Article

Optimal Placement and Sizing of Electric Vehicle Charging Infrastructure in a Grid-Tied DC Microgrid Using Modified TLBO Method

by
Nandini K. Krishnamurthy
1,
Jayalakshmi N. Sabhahit
1,*,
Vinay Kumar Jadoun
1,
Dattatraya Narayan Gaonkar
2,
Ashish Shrivastava
3,
Vidya S. Rao
4 and
Ganesh Kudva
1
1
Department of Electrical & Electronics Engineering, Manipal Institute of Technology, Manipal Academy of Higher Education, Manipal 576104, Karnataka, India
2
Department of Electrical & Electronics Engineering, National Institute of Technology Karnataka, Surathkal 575025, Mangalore, India
3
Skill Faculty of Engineering and Technology, Shri Vishwakarma Skill University, Gurugram 122003, Haryana, India
4
Department of Instrumentation & Control Engineering, Manipal Institute of Technology, Manipal Academy of Higher Education, Manipal 576104, Karnataka, India
*
Author to whom correspondence should be addressed.
Energies 2023, 16(4), 1781; https://doi.org/10.3390/en16041781
Submission received: 9 December 2022 / Revised: 30 December 2022 / Accepted: 11 January 2023 / Published: 10 February 2023

Abstract

:
In this work, a DC microgrid consists of a solar photovoltaic, wind power system and fuel cells as sources interlinked with the utility grid. The appropriate sizing and positioning of electric vehicle charging stations (EVCSs) and renewable energy sources (RESs) are concurrently determined to curtail the negative impact of their placement on the distribution network’s operational parameters. The charging station location problem is presented in a multi-objective context comprising voltage stability, reliability, the power loss (VRP) index and cost as objective functions. RES and EVCS location and capacity are chosen as the objective variables. The objective functions are tested on modified IEEE 33 and 123-bus radial distribution systems. The minimum value of cost obtained is USD 2.0250 × 10⁶ for the proposed case. The minimum value of the VRP index is obtained by innovative scheme 6, i.e., 9.6985 and 17.34 on 33-bus and 123-bus test systems, respectively. The EVCSs on medium- and large-scale networks are optimally placed at bus numbers 2, 19, 20; 16, 43, and 107. There is a substantial rise in the voltage profile and a decline in the VRP index with RESs’ optimal placement at bus numbers 2, 18, 30; 60, 72, and 102. The location and size of an EVCS and RESs are optimized by the modified teaching-learning-based optimization (TLBO) technique, and the results show the effectiveness of RESs in reducing the VRP index using the proposed algorithm.

1. Introduction

The world transportation system is transforming from traditional gasoline to electric vehicles (EVs). A long-term charging infrastructure must be developed to deploy electric vehicles on a large scale. To satisfy long-term energy demands, countries are intentionally lowering their reliance on conventional energy and moving their emphasis to renewable sources. Choosing renewable sources of energy depends on a country’s climate and environmental factors. A DC microgrid (MG) is an integrated energy infrastructure composed of sources of energy generation, storage options, and users of energy.
A two-stage joint chance-constrained program design is modeled for minimizing the operation cost of a multi-energy microgrid (MEMG) consisting of various energy carriers such as thermal power, electricity, and gas, which work independently [1]. However, until all vehicles are fully electrified, gas vehicles and electric vehicles (EVs) will exist in an MEMG. The MEMG’s electric and gas sides should be run in tandem to meet their energy demands. It is proposed to use a mixed-integer linear procedure (MILP) [2] to decide the best operation planning for a DC-based EV charging station (EVCS). The approach reduces daily operational costs by predicting photovoltaic production and EV usage. The suggested MILP solution has been determined to be economical and immediately meet the system’s time needs.
A multi-objective context is used to analyze the problem with charging station employment that considers cost, distribution network functioning constraints such as voltage stability, dependability, power loss, charging station availability, and waiting period in the charging station [3]. Teaching-learning-based optimization (TLBO) and chicken swarm optimization (CSO) were employed to address the placement of EVCSs. The optimal size and position of renewable energy sources (RESs) and EVCSs are instantaneously performed, and the handling vehicle charging method is delivered by [4]. A problem of multi-objective optimization is created to decrease power losses, voltage variations, demand and charging-providing outlays, and EV storage price. The performance on an IEEE 33-bus unit was studied to validate the efficacy of the new genetic algorithm-particle swarm optimization (GA-PSO) technique to optimize placement and capacity of RESs and EVCSs concurrently. The hybrid grey wolf optimization (GWO) and PSO technique are applied to determine the appropriate position of EVCSs, and distributed generations (DGs) in a stable IEEE 33- and 69-bus distribution unit analyze the consistency of the electrical distribution network [5]. The assistance for the MG’s rate of recurrence through a control method has been provided in order to address the sudden change in EV load at the CS. A smart CS has been planned where EVs contain a variety of battery voltage ratings to offer frequency assistance to the MG. The MG load profile is maintained by controlled discharging and charging of EVs. EVs parked long term at the CS take part in the process of charging and discharging their batteries [6]. References [1,2,3,4,5,6] highlight the multi-energy microgrid, DC-based EVCSs, and smart charging station distribution network operating parameter optimization by considering RESs and EVCSs together. The placement and sizing of EVCSs and DGs are performed parallelly on test systems.
In [7,8,9,10], the effect of EVCSs on the distribution network is emphasized along with CS operational planning without any traffic network. The charging station’s location and size are determined by factors such as solar energy variation, construction cost, and operator requirement. The EVCS’s overall profit is maximized by considering both construction and operation costs. In [7], the effect of EVCS load on a distribution unit is described. The findings revealed that locating quick-charging stations near inefficient buses had an impact on the power distribution network’s smooth operation. If quick-charging stations were put at the network’s fragile buses, a significant amount of money would be lost. A strategy for the placement of EVCSs has been offered based on the voltage stability, reliability, and power loss index. The best placement and size of the CS in the town of Allahabad, India is performed in [8]. For optimal charging infrastructure placement in the Allahabad distribution unit, a hybrid approach centered on a GA and an upgraded form of predictable PSO is used. The significance of including protective device upgrades in charging station planning in urban systems is described in [9] to reduce the overall price of charging stations, extend the distribution network and voltage control, and upgrade costs for the safety system after placement of EVCS. A proposal is made for an EV supply infrastructure’s best operation planning by [10]. The operation cost is optimized based on photovoltaic (PV) production and EV exploitation. The suggested method is tested on a DC MG on various functional days, and their efficacy is related using a genetic algorithm. An MG-based EV charging scheme and typical issues that arise during the charging of an EV, such as suspension operation and standby mode, are discussed in [11]. The proposed strategy is verified using MATLAB software.
The microgrid-based EVCS location problem is formulated in [11,12,13,14], considering both the distribution network and transport unit. The possibility of expanding EVs as a provisional energy storage system (ESS) contributing to structure requirements is investigated by [12]. To discover the amount of EVs that would minimize the total electricity obtained from the grid, an algorithm is suggested for charging and discharging. To demonstrate the proposed algorithm, a case study at Jordan University is used for the MG. The charging station sizing problem [13] is solved utilizing an optimization outline that reduces the asset price of CS operators while maintaining a given level of quality of service for EV owners. A two-stage planning model for charging infrastructure employment has been planned in view of the distance, grid stability, and traffic [14]. The places with the least amount of energy loss are determined. The smart DG is also allotted for additional energy loss decline and voltage enhancement. To cope with the uncertainties connected with EVs and SDGs, the 2 m point estimation method has been used [15]. The expenses of conveyance loss, accumulation, and substation energy, as well as power loss, are factored into optimal rapid CS design using a unique approach. To overcome the optimization challenge, the binary lightning search algorithm is developed [16]. The four different reliability indices are assessed on an IEEE 33-bus test system by increasing the load in equal and unequal mode on every node. An unequal increase in load is more suitable than an equal increase. As all the indices remain at an acceptable range of values with the increase in load, the system operation is considered as healthy and reliable [17]. References [15,16,17] describe EVCS operation strategy and placement considering uncertainties associated with EVs and DGs.
A reduction in the overall cost of microgrid operations is achieved. To reduce the cost of energy for consumers, the idea of dynamic pricing has also been implemented. A load variance index has been taken into account to ensure the stability of the microgrids, and the fuzzy-based technique has been employed for cost and load variance minimization to lower operating costs without sacrificing the stability of the MG. The grid-to-vehicle (G2V) and vehicle-to-grid (V2G) operations of EVs are incorporated, which will aid in shifting loads during off-peak and peak hours [18]. A methodology for sizing a DC-MG for optimal techno-economic coverage of EV mobility needs is developed. In each case, the best operation is achieved with a unique approach to EV commitment at various stations. The sizing technique is capable of handling MG device’s modular structure [19]. Different constraints are used to mathematically express the economic and environmental concerns. The multiple charging scenarios of EVs are implemented by multiagent reinforcement learning (RL). The efficacy of RL has been proved by integrating five and fifteen thermal producing units, which make up the two conventional test functions [20].
The optimal placement of the EVCS with synchronized charging within the MG at Wroclaw University of Science and Technology is performed using ant colony optimization (ACO). The chosen place was determined by grouping and positioning the EVCS on various MG nodes made up of distributed energy sources and analyzing the energy reserves calculated on typical days of the year [21]. The placement and sizing of the EVCS is performed on a distribution system in Allahabad, India. The voltage profile enhancement index and active and reactive power loss minimization index are optimized, as well as the the initial development costs, to obtain the lowest possible installation cost and to deliver better power grid parameters. The proposed problem has been solved by a balanced mayfly algorithm [22]. The suitable placement and sizing of PV and wind energy sources along with EVs are determined using a multi-objective grey wolf optimizer. The uncertainty of PV, wind generation, state of charge, and arrival and exit hours of EVs are taken into account. The total voltage deviances and grid power are optimized under four different cases of operation [23]. The EVCS placement problem is performed on an IEEE 33-bus system based on the reliability index. The present approach is validated on an actual system of Kerala, India [24]. A linear program model is developed to reduce the costs associated with network reinforcement and energy loss and determine which distribution network branches need to be strengthened. The created models are put into practice on the IEEE 69-bus network, and the outcomes are looked at under various scenarios [25]. To assure the autonomous and reliable operation of the DC microgrid, an improved decentralized droop control with load power dispatch and SOC balance of the energy storage unit is developed. The developed control strategy is validated in the Simulink platform [26]. References [18,19,20,21,22,23,24,25,26] highlight EVCSs integrated with the grid, MG-based EVCSs concerned with environmental factors, the distribution system loss minimization index, the uncertainty of PV and wind sources, the reliability index, and network reinforcement.
Table 1 gives the comparison of current work with the literature.
The history of the present work on placement and sizing of CSs is given in Table 2. It should be noted that the majority of the research has focused on economic constraints and distribution network operating parameters separately. This paper works on placement and sizing of CSs along with RESs, considering both cost and VRP index simultaneously on an IEEE 33- and 123-bus distribution system.
RESs are eco-friendly and assist in reducing the use of fossil fuels. Wind and PV are unreliable sources of electricity, with output varying depending on the amount of wind and sunshine available. Wind and PV fluctuate; hence, this necessitates a large amount of storage, which provides many possibilities for the fuel cell. It is very important to meet the required power demand of EVCSs and to reduce the burden on the utility grid. Hence, three different sources, PV, wind, and fuel cell, are used in the proposed DC MG. Large-scale EV incorporation and the location of EV charging and discharging stations present additional challenges to the power system unit, such as the VRP index. Evaluating the effect of EVCSs on the VRP index of grids and MGs is critical.
According to the existing literature, the location and sizing of the charging station are organized using various optimization strategies. Because of the widespread focus on RESs, it is vital to assess the effect of DC MG in terms of wind, PV, and fuel-cell-based EVCSs integrated with the grid. In the extant literature, there is little emphasis on optimizing the location and sizing of EVCSs integrated with the grid in a DC MG environment. The principal objective of this work is to decrease the VRP index of the 33- and 123-bus test systems after installing EVCSs with and without RESs. The cost of installation and operation of EVCSs are also optimized in this work. The placement and size of RESs and EVCSs are taken as the objective variables. The present problem is made more difficult by the non-linear properties of EVs when combined with DC MG. An efficient nature-inspired meta-heuristic modified TLBO technique is used to handle this challenging problem. The novelty of the work lies in the optimum placement and sizing of EVCSs with RESs in a DC MG environment. The present approach is tested on an extensive network of IEEE 123- and medium-scale 33-bus system with the objective of VRP index and cost optimization.
The key contributions of this work are as follows:
  • A new problem formulation is proposed for a grid-connected DC microgrid to optimize the cost and VRP index on modified IEEE 33- and 123-bus radial distribution units after installing EVCSs.
  • The proposed case of operation is performed on a DC MG integrated with the utility grid for optimal position and sizing of EVCSs with RESs under six diverse schemes to minimize the VRP index and cost with the related constraints. The minimization of the VRP index and cost is compared with the latest published results.
  • The VRP index is optimized to account for 24 h variations in PV, wind, and EV loads.
  • The operation strategy is proposed to minimize the cost and VRP index by performing distribution load flow on a DC microgrid. The proposed operation strategy helps to improve the voltage profile by the optimal location of RESs and EVCSs on modified IEEE test systems.
  • Modified meta-heuristic optimization technique TLBO given numerous relevant constraints with the proposed operation strategy is employed to resolve this composite problem.
  • The investigation of modified TLBO for the proposed operation strategy produces solutions of improved quality, which is evident in the numerical outcomes.
The remainder of the paper is systematized as follows. DC MG components are modeled in Section 2. The operational strategy, problem formulation, and objective function are detailed in Section 3. Section 4 illustrates the proposed optimization strategy. Section 5 outlines the results of the proposed case, and the complete work is concluded in Section 6.

2. Modeling DC MG Components

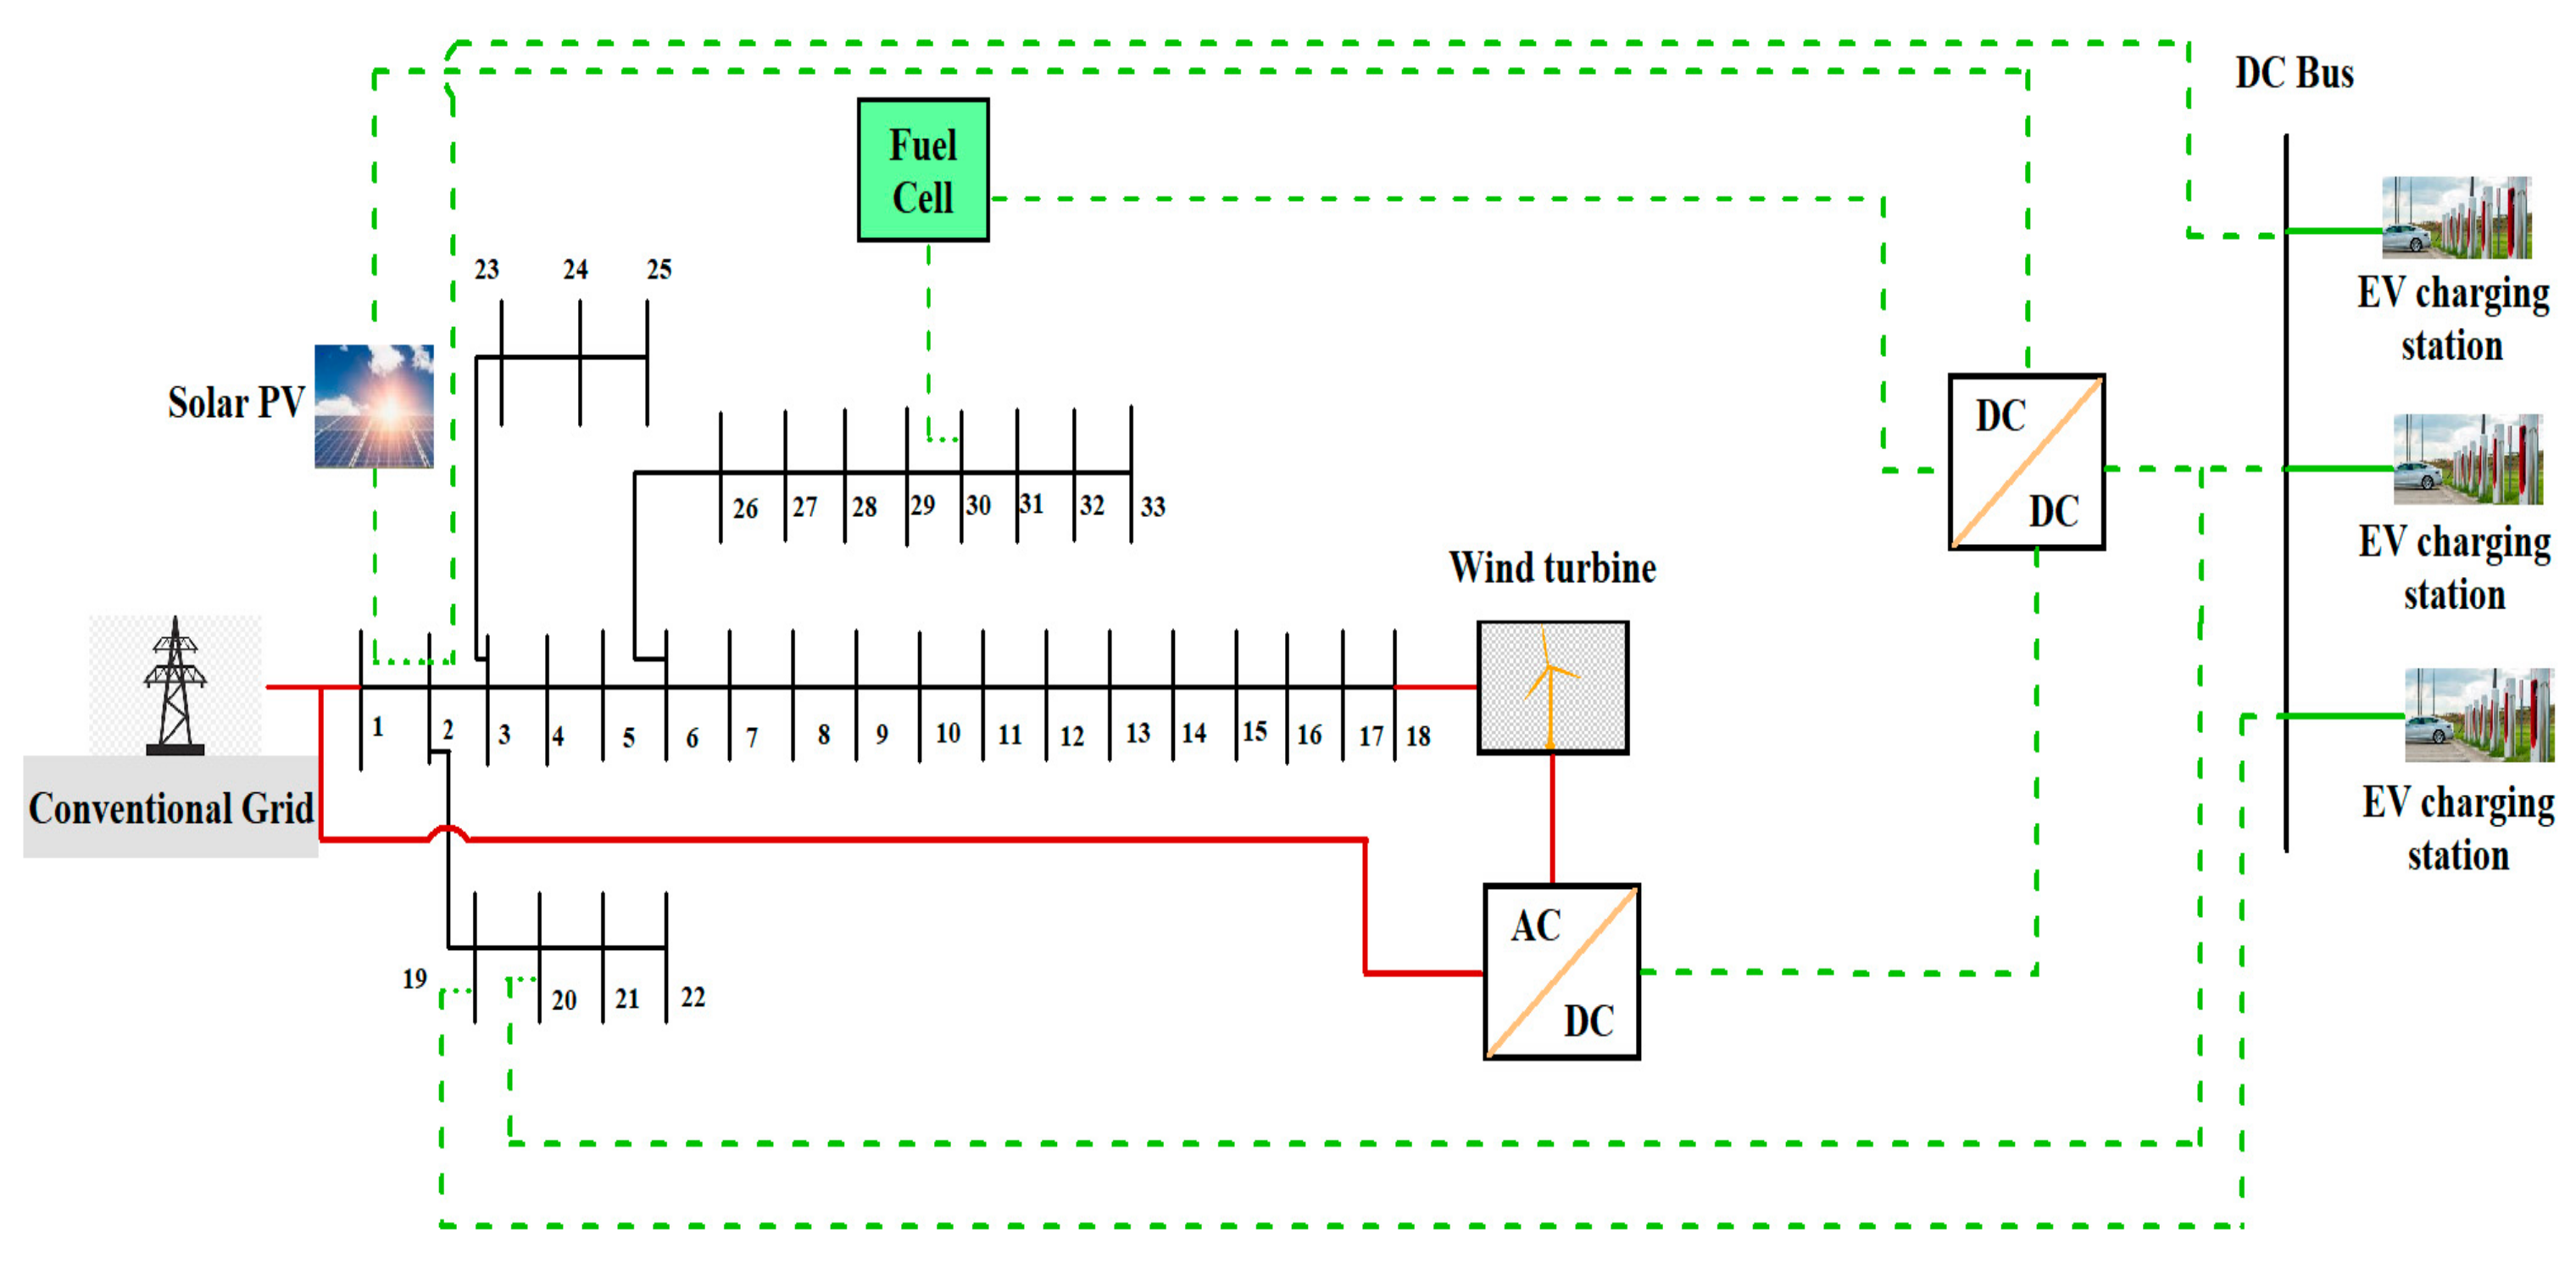
Figure 1 depicts the structure of a DC MG that includes wind, solar PV, fuel cells, EVCS, and the utility grid. Wind and PV are the prime energy sources in the DC MG, with the fuel cell as the backup source. Solar PV and the fuel cell produce DC electrical power, whereas the wind turbine produces electricity in the form of AC. The total amount of generated electricity by the PV system and wind turbine depends on many aspects, such as sun irradiance, ambient temperature, and wind speed, which are variable and unpredictable. All three sources are linked to the DC bus via a DC-DC type converter. The DC bus is interlinked to the conventional grid and EVCS through a bidirectional DC-AC inverter and DC-DC type converter, respectively.

2.1. Solar PV

Solar power is essential and influential in addressing the energy issues of any nation. Before installing PV modules in any area, the modeling of the same helps diagnose the performance of PV in real-world climate conditions [27]. A photovoltaic array collection contains several solar cells to achieve the necessary output current and voltage [28]. In the present work, solar and wind energy are used as primary sources of supply. The fuel cell is used as a backup source of supply. With drastic variations in energy production, on some days when solar energy production is very low the required load demand is met through wind energy and the fuel cell. If all three sources fail to meet the required EVCS load demand, then the utility grid is used to supply the deficit power. Hence, the proposed method works properly irrespective of solar radiation and wind speed.
The power output of the PV system for each hour (t) can be expressed as:
P V o u t t = F F t × I s c   t × V o c t
I s c   t = s 1000   [ I s c ,     S T C + K i ( T c ( t ) 25 ) ]
V o c t = V o c ,     S T C + K v ( T c ( t ) 25 )
F F t = F F o t   ×   [ 1 r s ( t ) ]
F F o t     V o c , 0 t l n   [ V o c , 0 t + 0.72 ] V o c , 0 t + 1
V o c , 0 t = V o c , 0 t   ×   q n k T c   t + 273.5
r s ( t ) = R s   I s c   t V o c   t
T c ( t ) = T a ( t ) + s N O C T 20 0.8
where, I s c   t and V o c t are the short circuit current and open circuit voltage under working circumstances and   P V o u t t is the highest output power at any given time t. The sun irradiance at time t is represented as s. The module’s actual and ideal fill factors are FF and FF0. V o c , 0 t represents the regulated open circuit voltage at any time t, q represents an electron’s charge. The ideality factor n is assumed to be equal to 1. Boltzmann’s constant is K, R s is the series resistance of the module, temperature of the modules at any time t is T c . (t).     T a (t) is the module ambient temperature, r s (t) is the standardized module series resistance at any time t, and NOCT is the manufacturer’s specified rated operating cell temperature [29,30]. In the present work, the parameters for the PV module are adapted from reference [31].

2.2. Wind Energy System

Wind power is considered one of the utmost rapidly growing RESs. Based on various types of wind zones, the wind turbines are installed, generating revenue in rural areas and consolidating the region’s economic status. The hybridized scheme in which both PV and wind are combined is indeed a potential alternative, because when either system is not working at its peak, the other can compensate. Apart from that, it keeps on supplying power without any disruptions with reduced storage system size [32]. By using PMSG, variable speed operation is achieved. One of the benefits of WT functioning at multiple speeds with PMSG is that it considerably cuts the necessary design parameters, as it comes with fixed losses from the generator. In the power transformation process, iron losses (Piron), mechanical losses (Pmec), and copper losses (Pcu) occur in the wind rotor. Inclusive of all the losses, PMSG (ηcon) has a conversion efficiency of about 90% [33]. The mechanical power generated from the wind rotor at each hour (t) is expressed as in (9) adapted from [34].
P m t = 0.5 ρ A v t 3 C p   , β
The power coefficient C p   , β is expressed as:
C p   , β   =   0.22 116 γ 0.4 β 5 . exp 12.5 γ
1 γ     1 + 0.089     0.035 β 3 + 1
=   R   .       ω ϑ
The torque acting on the shaft is calculated as:
T m =   p m ω
The power output extracted from the PMSG is:
P wind ( t ) =   P m t η con
where ρ is the density of air, wind speed is referred to as v in m/sec, A is the rotor area, and Cp is the coefficient of performance. is the tip speed fraction, γ is the specific weight, and ß is the pitch angle. ω is the blade’s angular speed and R is the rotor radius. The selected WT specification in the particular DC MG is mentioned in [35].

2.3. Fuel Cell

A fuel cell is a type of energy conversion method that directly changes chemical energy to electrical energy. Fuel cells are an excellent choice for applications requiring dispersed power production. A fuel cell cannot be utilized directly in most applications since it produces only unregulated DC power that varies with load. The Nernst expression used for determining cell potential is given as [36,37]:
E = E 0 R T n F log Q
Equation (15) represents a cell’s electrical potential, which is determined by the reaction quotient Q, where E0 denotes open circuit voltage, R is the collective gas constant, F is Faraday’s number, and T refers to the absolute temperature of the cell in oK. When a load is functional, the external current (Iext) flows cause the voltage drips with a current loss (Iloss). The overall current of the fuel cell is given as
I = I e x t + I l o s s
V s t k ( I ) = η c e l l V c e l l ( I ) = η c e l l ( E Δ V a c t Δ V o h m Δ V c o n ) = η c e l l ( E [ ξ 1 + ξ 2 T s + ξ 3 T s ln ( C O 2 ) + ξ 4 T s ln ( I ) ] R i o n I ( 1 + 1 α ) R T 4 F ln I L I L I )
where ηcell is the number of cells linked in series, taken as 30, ∆Vact is the activation voltage losses in volts, and ∆Vohm is the ohmic voltage losses in volts. The losses occur due to a drop in gas absorption at the electrode surface where there is a large current ∆Vcon. Ts is the stack temperature in k. Co2 is the amount of liquefied oxygen in mol/cm3. Rion is the ion flow in the membrane with resistance. Il is the current limit of the electrode in A. α is a water activity function.
The fuel cell stack’s output power is provided as
P s t k = V s t k I e x t

3. Problem Formulation

The multi-objective problem includes the operation and installation cost of the EVCS and VRP index as objective functions by optimally placing and sizing the PV, wind, and fuel cell. The selected problem formulation considers wind and PV as the primary source and the fuel cell as the secondary source; the size and place of RESs and EVCSs are taken as the objective variables.

3.1. Objective Function and Related Constraints

The objective function and the related constraints of the present work are discussed as follows:

3.1.1. Cost

The objective is to lessen the installation and operation cost of EVCSs, shown in (19)–(24), as illustrated in [3].
Considering both fast and slow charging stations:
Cost = C i n s t a l l a t i o n + C o p e r a t i o n
C i n s t a l l a t i o n = { j = 1 m     F j × f j × C f a s t } + { j = 1 m S j × s j × C s l o w }
C o p e r a t i o n = { { j = 1 m F j × f j × C P f a s t } + { j = 1 m S j × s j × C P s l o w } }   ×   P e l e c
Considering only a fast-charging station:
Cost = C i n s t a l l a t i o n + C o p e r a t i o n
C i n s t a l l a t i o n = { j = 1 m F j × f j × C f a s t }
C o p e r a t i o n = { { j = 1 m F j × f j × C P f a s t } }   ×   P e l e c
where Sj and Fj are the quantity of slow and fast charging infrastructures, and fj and sj are the number of fast charging and slow charging points, respectively. Cslow and Cfast are the installation costs of slow and fast charging infrastructures, respectively. CPslow and CPfast are the power intake of slow and fast charging infrastructures. The cost per unit of electricity is represented as Pelec. The cost of installation and operation depends on the quantity of slow and fast charging infrastructures, the quantity of slow and fast charging points, the power intake of chargers, and the electricity cost per unit.

3.1.2. VRP (Voltage Stability, Reliability, Power Loss) Index

The operating considerations of the distribution unit, such as power loss, reliability, and voltage stability, are together considered in one frame. The VRP index has a minimum value of 1 when there is no increase in load, which is considered as an ideal condition. The VRP index is represented mathematically as follows [3].
VRP = f (P, Fj, Sj, fj, sj) = w1 × VSI + w2 × R + w3 × P
Equation (25) represents a multi-objective function where the decision variables are P, Fj, Sj, fj, and sj. P is the placement of the charging infrastructure. w1, w2, and w3 are the weight allotted to VSI, R, and power loss, respectively. VSI represents voltage stability index, R is reliability, and P is power loss, where
VSI = V S I l V S I b a s e
R = W 21   S A I F I l S A I F I b a s e + W 22   S A I D I l S A I D I b a s e + W 23   C A I D I l C A I D I b a s e  
P = P l o s s l P l o s s b a s e  
Equation (26) represents   V S I b a s e and V S I l as voltage stability index base value and the voltage stability after the placement of charging infrastructure, respectively. S A I F I b a s e and S A I F I l   are the SAIFI base value and the SAIFI value after the employment of charging stations, respectively. The same convention is followed for SAIDI and CAIDI. w21, w22, and w23 are the weight assigned to SAIFI, SAIDI, and CAIDI, respectively in (27). P l o s s l   and P l o s s b a s e are the power loss value after the assignment of the charging station and the power loss value for the base case, as depicted in (28).
The voltage stability index (VSI) before and after employment of the charging infrastructure is given in (29) and (30).
V S I b a s e   = j = 1 N D 2   V j 2   V j + 1 2   2 V j + 1 2   ( P j + 1 r j + Q j + 1 x j ) Z 2   ( P j + 1 2 + Q j + 1 2 )
V S I l   = j = 1 N D 2   V j 2 V j + 1 2 2 V j + 1 2   ( P j + 1 r j + Q j + 1 x j ) Z 2   ( P j + 1 2 + Q j + 1 2 )
Here, the quantity of buses in the distribution system is denoted by N D , and V j and V j are the voltage of the jth bus for the base case and the voltage after the employment of charging station (CS), respectively. P j + 1   and P j + 1 are the active power at the (j + 1)th bus before and after the positioning of CSs. The same convention is followed for reactive power (Q). The impedance of the branch is represented as Z, the resistance of the branch is represented as   r j , and reactance of the branch is represented as   x j .
The important reliability indices, i.e., system average interruption duration index (SAIDI), system average interruption frequency index (SAIFI), and consumer average interruption duration index (CAIDI), are expressed in (31) and (32).
S A I F I b a s e =   j = 1 N D λ j N j   j = 1   N D   N j S A I D I b a s e =   j = 1   N D   U j N j   j = 1   N D   N j C A I D I b a s e =   j = 1   N D   U j N j   j = 1     N D   λ j N j
S A I F I l = j = 1   N D   λ j N j j = 1   N D N j S A I D I l = j = 1   N D   U j N j j = 1   N D N j C A I D I l =   j = 1   N D U j N j   j = 1     N D   λ j N j
λ j = λ j P j × P j U j = U j P j × P j
where λ j and λ j   are the failure rate of bus j before and after placement of CSs, U j and U j are the outage period of bus j before and after employment of CSs, respectively, and N j is the number of users associated at bus j . P j   and P j are the active power at the bus ‘j’ before and after the employment of charging infrastructures, respectively, as seen in (33).
The computation of power loss before and after the employment of CSs is expressed as:
P l o s s b a s e = j = 1 N D I j 2 r j P l o s s l = j = 1 N D I j 2 r j
where I j and I j are the current through branch j before and after employment of CSs, as presented in (34). It can be observed that the VRP index depends on the position of charging infrastructure, the type of CSs, the quantity of CSs, and the quantity of charging points. The SAIFI is considered a frequency-based reliability index that relies on interruption frequency. SAIDI is a time-based dependability file that is affected by the time of the outage. The unitary technique calculates the frequency and duration of interruptions when charging stations are installed [3]. The best locations and sizes of the RESs must be determined centered on the same objective to lessen the VRP index further.
The increase in load by considering both fast and slow charging stations is described in (35) and (36).
P j = P j + { ( F j   ×   f j )   ×   C P f a s t } + { ( S j × s j )   ×   C P s l o w }
Considering only fast charging station:
P j = P j + { ( F j   ×   f j )   ×   C P f a s t }
To carry out the sizing of EVCSs and their optimal location, the following constraints are listed in (37)– (41), considering both the highest and lowest amount of fast charging points, slow charging points, true and reactive power of the bus system, the voltage of the bus, and the output power of all the renewable energy sources. Equations (42) and (43) are the demand–supply balance constraint for each bus after counting EVCSs and RESs.
0 < F p F m a x ;     0 < f p f m a x  
0 < S p S m a x ;     0 < s p s m a x
Q j m i n Q j Q j m a x ;     P j m i n P j P j m a x
V j m i n V j V j m a x  
P m i n R E S P j R E S   P m a x R E S
P g i   P d i V i j = 1 N V j   Y i j   Cos   ( δ i   δ j θ i j ) = 0
Q g i   Q d i V i j = 1 N V j   Y i j   Cos   ( δ i   δ j θ i j ) = 0
where Pgi and Qgi are the active and reactive power production of the ith bus and Pdi and Qdi are the active and reactive power demand, respectively. Vj is the voltage of jth bus, and Yij is the magnitude of bus admittance matrix. δ(i) and δ(j) are the voltage angle of the ith and jth bus. θij is the angle of Yij.

3.2. Proposed Operational Strategy

It is more economical to indicate the location and sizing of RESs along with EVCSs to minimize the VRP index further. A comprehensive explanation has been stated in a flowchart in Figure 2. The steps followed for the proposed operational strategy are highlighted:
Step 1:
Identify the preliminary value i = 1.
Step 2:
Select the modified IEEE 33- and 123-bus system for the analysis of the VRP index.
Step 3:
Figure out the value of wind, PV, and fuel cell output power using (1) to (4).
Step 4:
Run the load flow for the base case by the forward-backward technique.
Step 5:
Estimate the voltage sensitivity factor (VSF) for all buses using (44) [38].
VSF = |dv/dp|
Step 6:
Based on the VSF, the CS is optimally selected. Increase the charging station load in phases.
Step 7:
Run distribution load flow analysis by the forward-backward method.
Step 8:
Optimize the VRP index and cost.
Step 9:
The wind, PV, and fuel cell output power is integrated into the modified IEEE 33- as well as 123-bus system and the EVCS load.
Step 10:
Run a forward-backward load flow method.
Step 11:
To minimize the VRP index further, the location and sizing of RESs are optimally selected.

4. Optimization Algorithm Based on Modified Teaching-Learning Method

The formulated problem in the preceding section is comprehensive, with multifaceted optimization. Hence, it is crucial to opt for an effective optimization technique. This work uses a modified TLBO to resolve the aforementioned complex problem in two diverse operation cases. The modified TLBO algorithm combines basic TLBO with suitable constraints handling as described in Section 3. The comprehensive discussion of the modified TLBO method is given as follows.
The basic version of the TLBO is a nature-inspired and population-centered method that imitates the teaching method followed by the learning phase. In the learning phase, two approaches are involved. Starting with the teacher phase, interaction takes place between both teacher and student. Then, in the learner phase, communication is established amongst the learners. The population size is selected based on a random number of students. The finest learner Pbest from the unique population set is obtained and chosen as a teacher factor from the best fitness value. The variance between the Pbest and the mean result of group, that is, Pmean, is applied to sort the newest response as per Equation (45), taken from [39].
P i ,   n e w = P i ,   o l d + r i   ( P i , b e s t   T F   ×   P i , m e a n )
The arbitrary number ‘ri is produced in the range [0, 1] in the ith iteration, and teaching factor TF is selected arbitrarily between 1 and 2. During the learning phase, a learning procedure is followed by a student that includes debate between themselves, and a chance studying companion who is more knowledgeable Pj is picked to apprise the new set of solutions. The newest solution is acceptable if the learner Pi has more awareness than his or her counterpart Pj as per (46), and equally, the solution is updated by (47), taken from [40].
P i ,   n e w = P i ,   o l d + r i   ( P i   P j )
P i ,   n e w = P i ,   o l d + r i   ( P i , b e s t T F   ×   P i , m e a n )
The modified TLBO is performed by choosing the size of the population 50 and 500 as the number of generations. Because r i ’ and ‘TF’ are not the specific parameters of TLBO, their values do not need to be tweaked like the mutation and crossover parameters in GA or inertial weight in PSO. The proposed problem formulation is complex and non-linear in nature. Hence, to solve such a complex and multi-objective problem, the modified TLBO technique is employed.
The advantages of TLBO with other population-based techniques such as GA, PSO, Harmony Search (HS), and Artificial Bee Colony (ABC) are three methods that combine a number of alternatives to reach the best one. PSO needs learning elements, weight variation, and maximum velocity, while GA requires crossover probability, selection procedure, and mutation rate. ABC requires the maximum value, while HS demands the rate at which harmony memory, rate of pitch adjustment, and number of improvisations are taken into account. The implementation of TLBO is easier since, unlike other optimization approaches, it does not require any algorithm factors to be tuned. Similar to PSO, TLBO modifies the current solution using the best iteration’s outcome for the population, thereby raising the convergence rate. TLBO does not split the population as happened in ABC optimization. The process of GA relies on the three crucial phases, viz., selection, crossover, and mutation. Likewise, in ABC, onlooker and scout bees are employed. On the contrary, TLBO uses dual phases, i.e., the ‘teacher phase’ and the ‘learner phase’. TLBO utilizes the mean value of the population to improvise the solution. The quality solution obtained by TLBO involves the greediness to reach a good candidate solution [41]. The workflow of modified TLBO is depicted in Figure 3. There are no specified control parameters mandatory for this algorithm, so it can be more popularly used compared to other population-based algorithms [42]. For it to work, it only needs a few basic governing parameters like population size and generation number [41]. If the quantity of generations attains the maximum, stop; else, reinitialize from the teacher phase. Table 3 validates the modified TLBO optimization with other procedures well-known in the literature.

5. Results and Discussion

Determination of the optimal sizing and location of EVCSs in a DC MG comprising wind, PV, and fuel cell interlinked with the utility grid is carried out using a modified version of TLBO to lessen the VRP index and cost. The data to IEEE 123-bus test system is taken from [43,44]. The optimization is performed in a MATLAB environment R2019b version of Intel core (TM) i3-2350M CPU clocking at a speed of 2.30 GHz. Figure 4 indicates the optimal location of EVCSs and three different sources on the IEEE 33-bus test system. Similar steps are followed with the extensive IEEE 123-bus test system. The voltage levels of the 33- and 123-bus test system are 12.66 kV and 4.16 kV as the standard requirement. The considered DC MG produces power utilizing solar PV panels and fuel cells followed by wind turbines. The modeling of each source is described in Section 2. The output power of the solar PV and fuel cell is extracted in the form of DC. Hence, the solar PV and fuel cell are optimally placed at bus numbers 2 and 30 with a DC-DC converter. On the contrary, the output power produced from the wind turbine is in the form of AC. Hence, it is connected to bus 18 through a rectifier along with a DC—DC type converter. The utility grid is interlinked to slack bus 1 through a bidirectional AC-DC converter. The sources used in the DC MG store or generate DC power, making it immediately compatible with EVCS load. The EVCSs are linked to the DC bus by exchanging the power on bus numbers 19 and 20 through a bidirectional rectifier along with the DC-DC type converter. At bus 2, one more EVCS is optimally placed through the bidirectional DC-DC converter. The DC bus voltage is controlled by receiving power from the utility grid. When the total output power of sources is less than the total EVCS load, the utility grid injects power to the EVCS load. The DC bus voltage of 400 V with ±5% deviation is considered. All the EV loads are connected to a 400 V DC bus through a converter to balance the power between the DC bus and EVCSs. The DC MG easily integrates with the considered RESs with the smaller number of converters, and it improves the overall efficiency of the system.
As the current work is strictly confined to the reduction in VRP index and cost, it requires data related to the IEEE test system. In the present work, results are analyzed on medium as well as extensive networks, such as IEEE 33- and 123-bus test systems. The optimization is performed by considering six non-dominated planning schemes. Each scheme is optimally selected with its own set of fast and slow CSs and fast and slow charging points. The parameters of the PV module utilized in the present work are described in Table 4 [45]. The specifications of a wind turbine (WT) in the selected multi-source MG are described in Table 5 [35]. The number of fast and slow CSs (Fj, Sj) and quantity of slow and fast points of charging (fj, sj) are optimized in each scheme, as shown in Table 6. The input factors essential for achieving objective function are taken from [3].
Detailed descriptions of the proposed case are given below.

5.1. Cost Objective Function

The placement and sizing of EVCSs on the modified IEEE 33- and 123-bus distribution system short of RESs are performed to minimize the VRP index and cost. The modified TLBO technique obtains the objective function cost values as described in Table 7. The cost objective function is optimized under six schemes considering a different quantity of fast charging (FCSs) and slow charging stations (SCSs). Table 7 compares the optimized cost value to the most recently published work taken from reference [3]. As cost objective function is mainly reliant on the total number of fast and slow charging stations and charging points, the amount of charging points is less in scheme 1 compared to other schemes of operations.
It is clear from Table 7 that scheme 1 gives the minimum value of cost when considering both fast and slow CSs and when considering only fast charging stations. The computational time required for the cost analysis is 8.234 s.

5.2. VRP Index

The VRP index minimization tested on IEEE 33- and 123-bus systems is detailed in the following subsections.

5.2.1. IEEE 33-Bus System

The location of CSs in a distribution unit centered on the VRP index is described in Figure 5. The VRP index is minimized to a greater extent by considering only fast charging stations compared to the combination of the FCS and SCS in all the schemes. The lowest value of VRP index is achieved in scheme 2, as the CS is placed at the strongest bus number, 2, of the test system. The optimal location and sizing of the CS centered on the VRP index are given in Table 8 and Table 9, respectively. The VSF of bus 2 is the minimum for all the loading factors, which makes it the strongest bus of the system, and bus number 19 is considered as the second strongest bus of the system. The highest capacity of CS is achieved in scheme 2, i.e., 793.87 and 400.92 kW, respectively. The proposed objective function VRP index is a combination of distribution network operating parameters, i.e., voltage stability, systems reliability, and power loss. The reliability indices are further classified as SAIFI, SAIDI, and CAIDI. The indices of reliability are deteriorated due to an increase in EV load. The deteriorated values were fewer than the critical values of the reliability indices. As EV charging load is increased in steps optimally at any bus, the SAIFI, SAIDI, and CAIDI values increase linearly; the system tends to be less reliable and fails to achieve healthy operation, which may lead the system to collapse. Optimal placement of RESs with EVCSs helps to meet the increase in load demand with the healthy operation of the system by maintaining reliability indices within the critical values.
In the proposed case, applying RESs along with EVCS load increases the distribution system’s reliability. The power extracted by wind and PV changes considerably because of the variation caused by solar irradiation and wind speed at altered timings due to varying climatic conditions. Hence, the fuel cell is considered as a backup source that supplies only real power. Furthermore, EVs charging with RESs cut down the emission of greenhouse gas. Thus, in the present work, a combination of wind, PV, and fuel-cell-based DC MG is taken for the optimal position and sizing of EVCSs. This work primarily focuses on lessening the VRP index of the distribution network by the best RES placement and sizing with EVCSs. The outcomes obtained for the proposed case are discussed as follows.
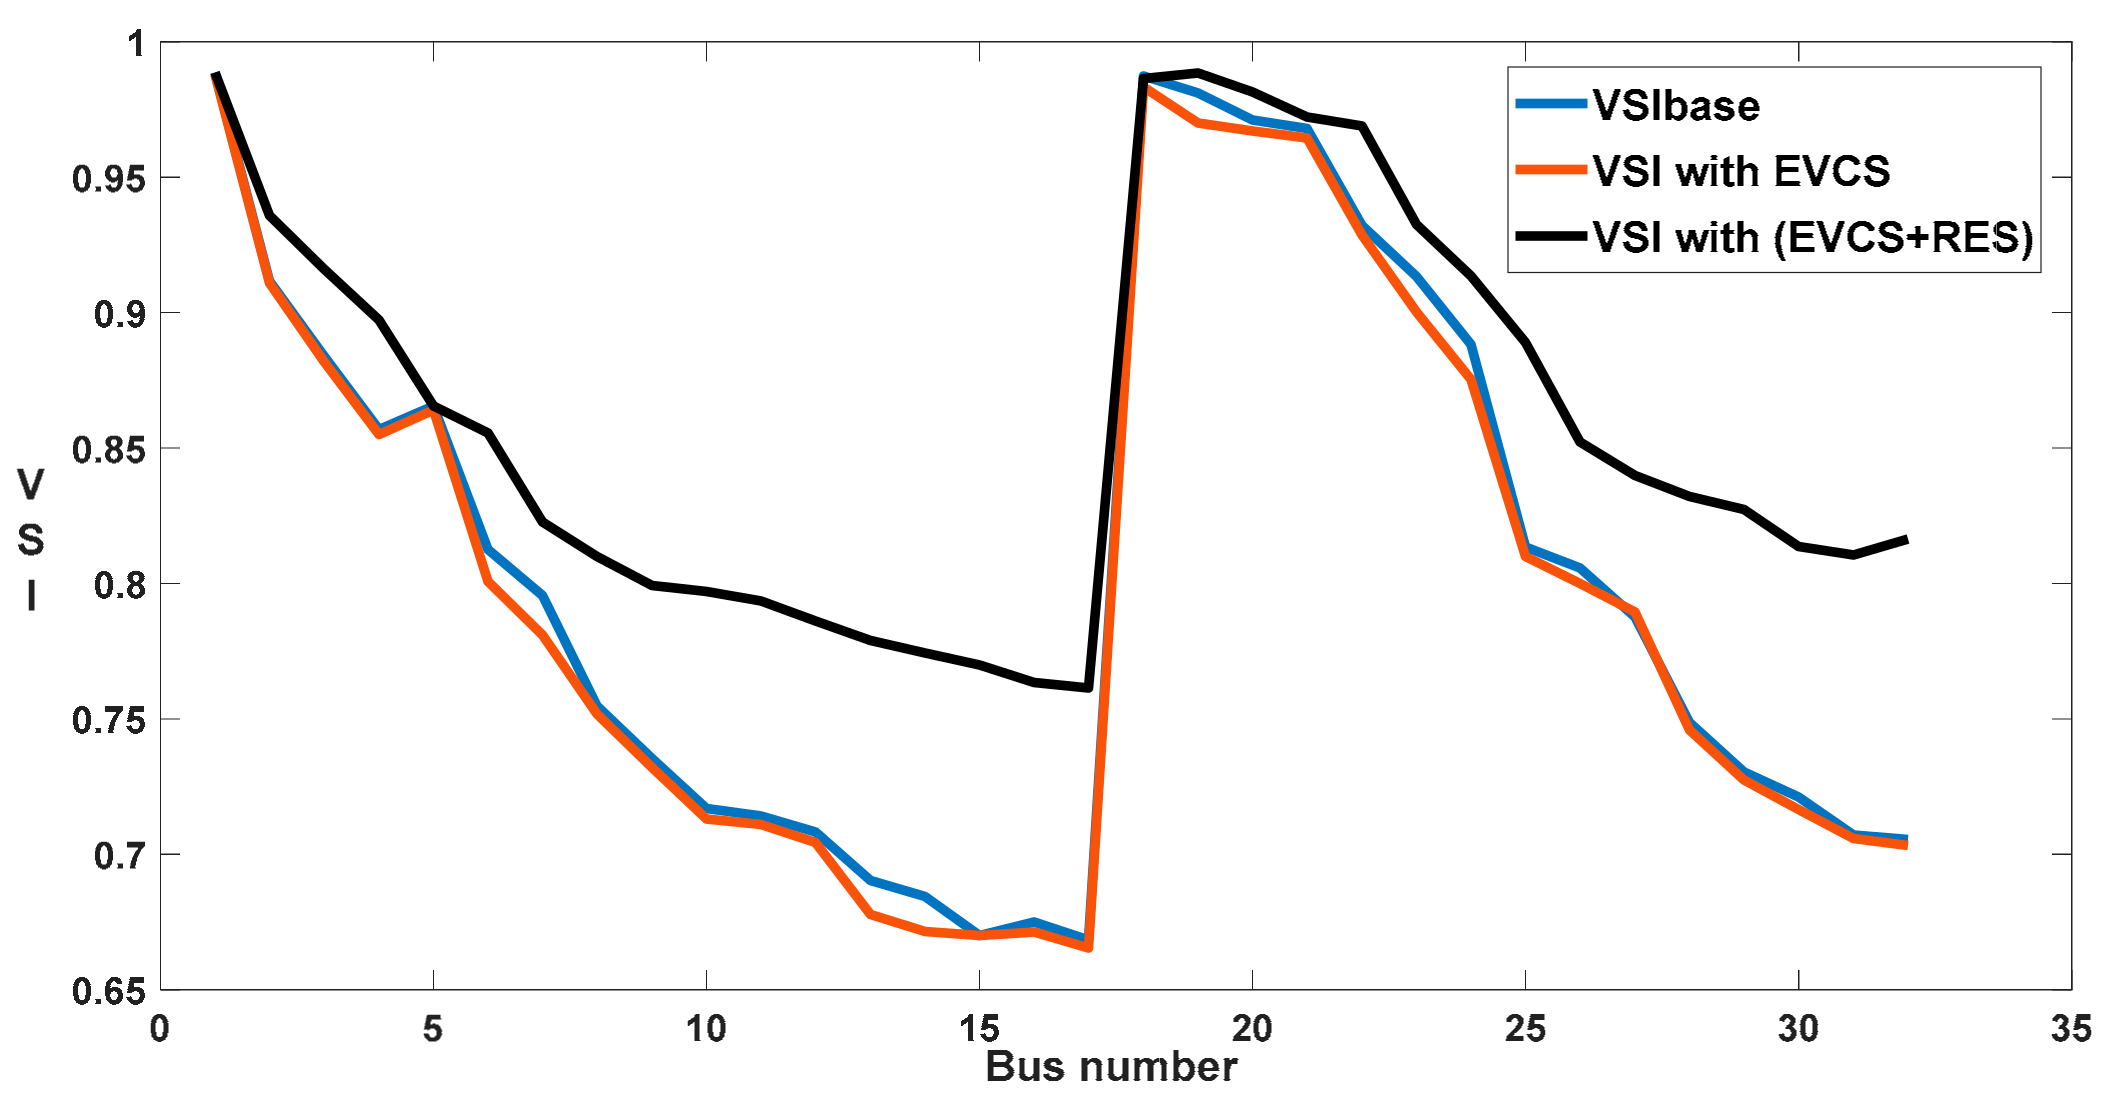
The value of VSI is computed for each bus, as discussed in Section 3. The stability of the bus is given by the VSI. The VSI value varies between 0 and 1. Any of the buses having a higher value of VSI, close to 1, are considered stable buses, and buses with lower values of VSI, close to zero, are prone to instability and should be taken care of. The placement and sizing of EVCSs and RESs depend on the continuous fall and sudden rise of VSI. The VSI values for the base, after placement of the EVCS load of 1500 kW and the EVCSs considering RESs, are shown in Figure 6. As the EVCS load is installed at the most robust bus, number 2, of the test system, there was less degradation of voltage stability. The stability index of the weakest bus, 14, is improved by 13.13% after installing RESs, considering the base value, and by 15.30% considering only EVCSs. The VSI value improves for all the buses with RES placement compared to EVCS placement alone. Hence, the probability of voltage instability is reduced, and the system becomes more stable with RES placement.
Figure 7 displays the voltage profile of the setup at each bus for the base after installing EVCSs with and without connecting RESs. It indicates that the voltage drop of all the buses after installing EVCSs is much less than the base value, because the CS is positioned at the robust bus of the test system. If the CS is placed at the weakest bus, then the voltage drop at that bus cannot be tolerated. However, the magnitude of voltage at all the buses lies within the acceptable range because of the distribution of CSs between a number of buses instead of concentrating the CSs at a single bus. The lowest value of voltage is obtained at bus number 18, and the maximum voltage appears at bus numbers 2 and 19.
The voltage profile started at 1 p.u. of voltage at bus number 1. It started a slow decrease in voltage up to bus number 18 from bus 1. The voltage profile is significantly and rapidly enhanced from bus number 18 to 19, then gradually decreased until bus 33. The maximum enhancement of voltage is perceived after installing RESs. This could reduce losses and improve the overall system performance. The voltage of the weakest bus, 14, is improved by 3.1% after installing RESs, considering the base value, and 3.4% considering only EVCSs.
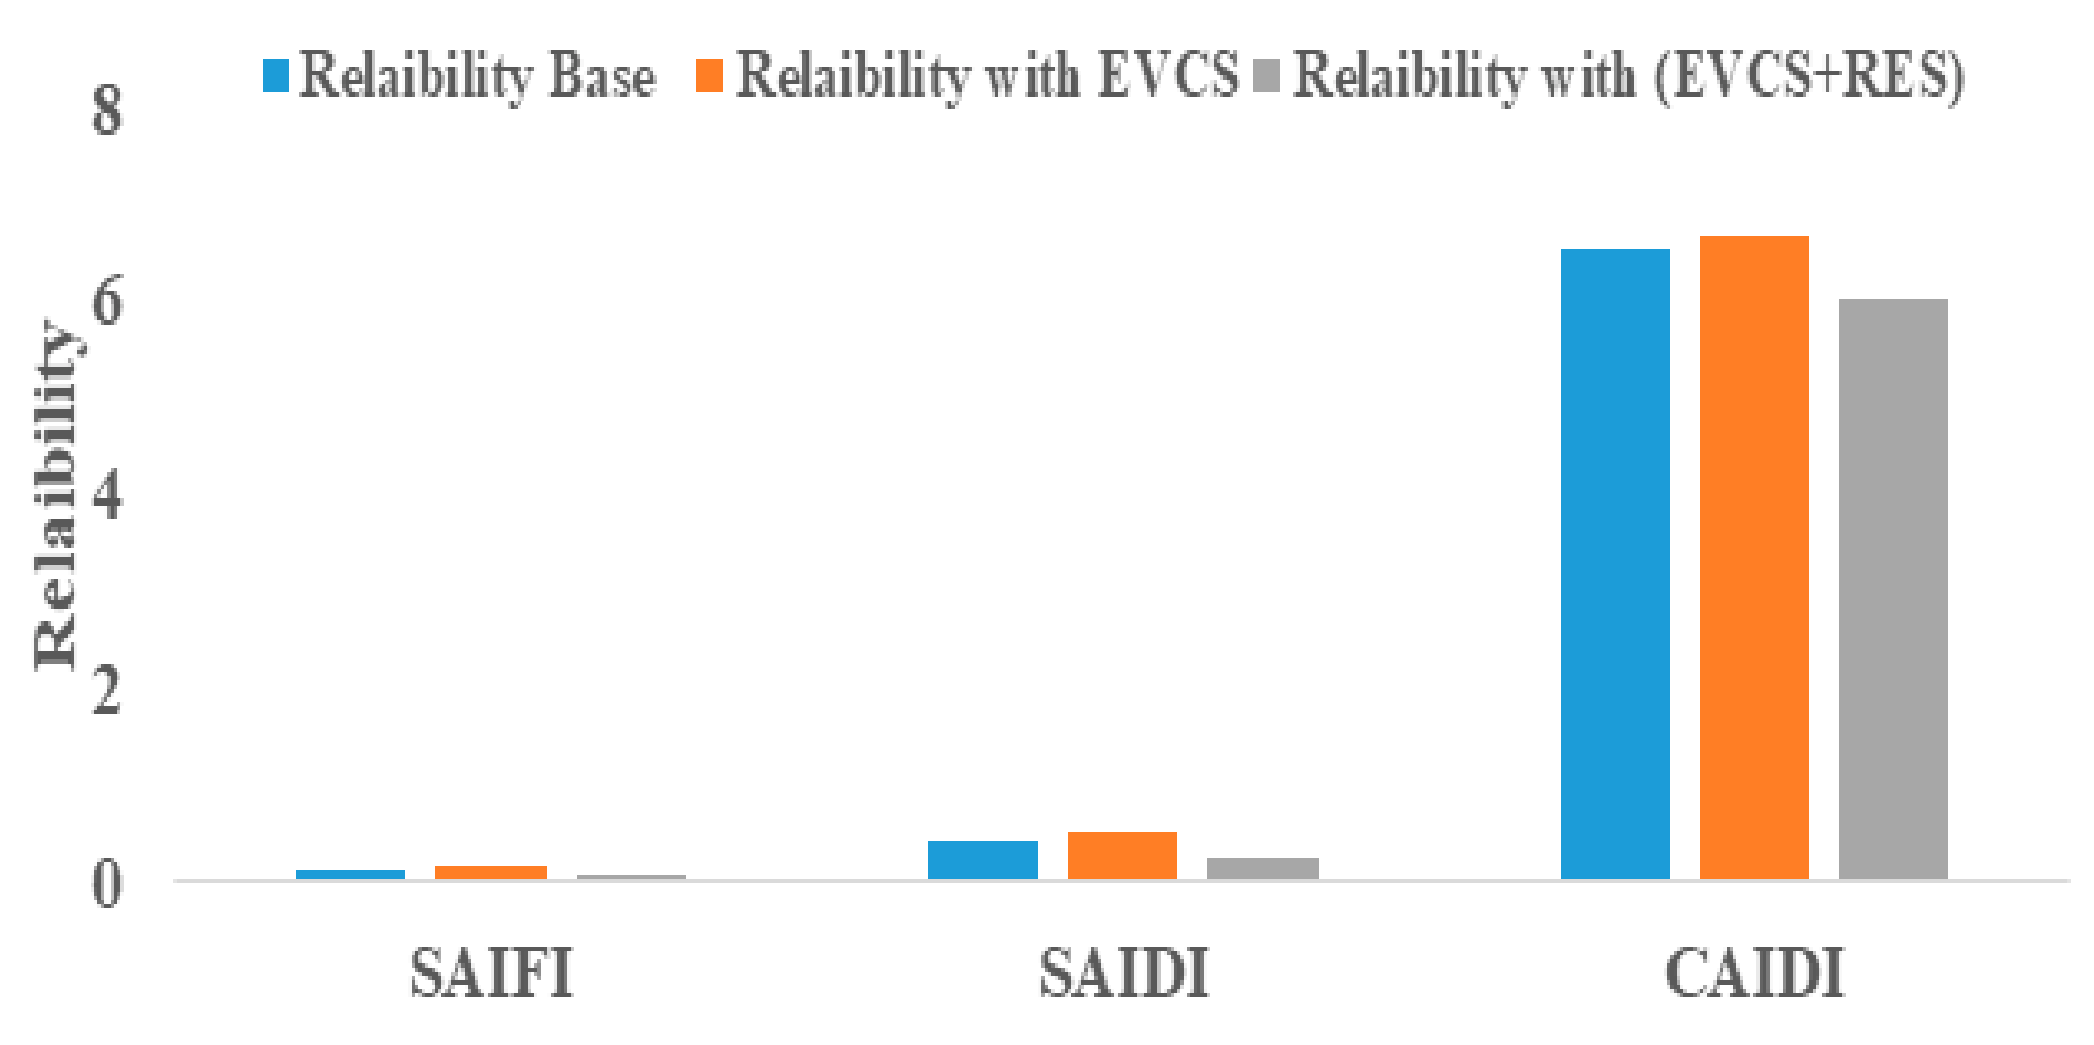
The reliability index of the test system for the proposed case is presented in Figure 8. The SAIFI value for the base load is 0.0890 interruptions/year. When the EVCS of 1500 kW capacity is placed, the SAIFI value is raised to 0.1540 interruptions per year. The value of SAIFI after the placement of RESs is reduced to 0.0587 interruptions/year. A similar implication is perceived in the values of SAIDI and CAIDI. The value of SAIDI raised to 0.4764 h/year with EVCSs and drops to 0.2300 h/year after RES placement. The CAIDI raised to 6.684 h/interruption and drops to 6.002 h/interruption with respect to the base case after installing EVCSs alone and RESs with CSs, respectively.
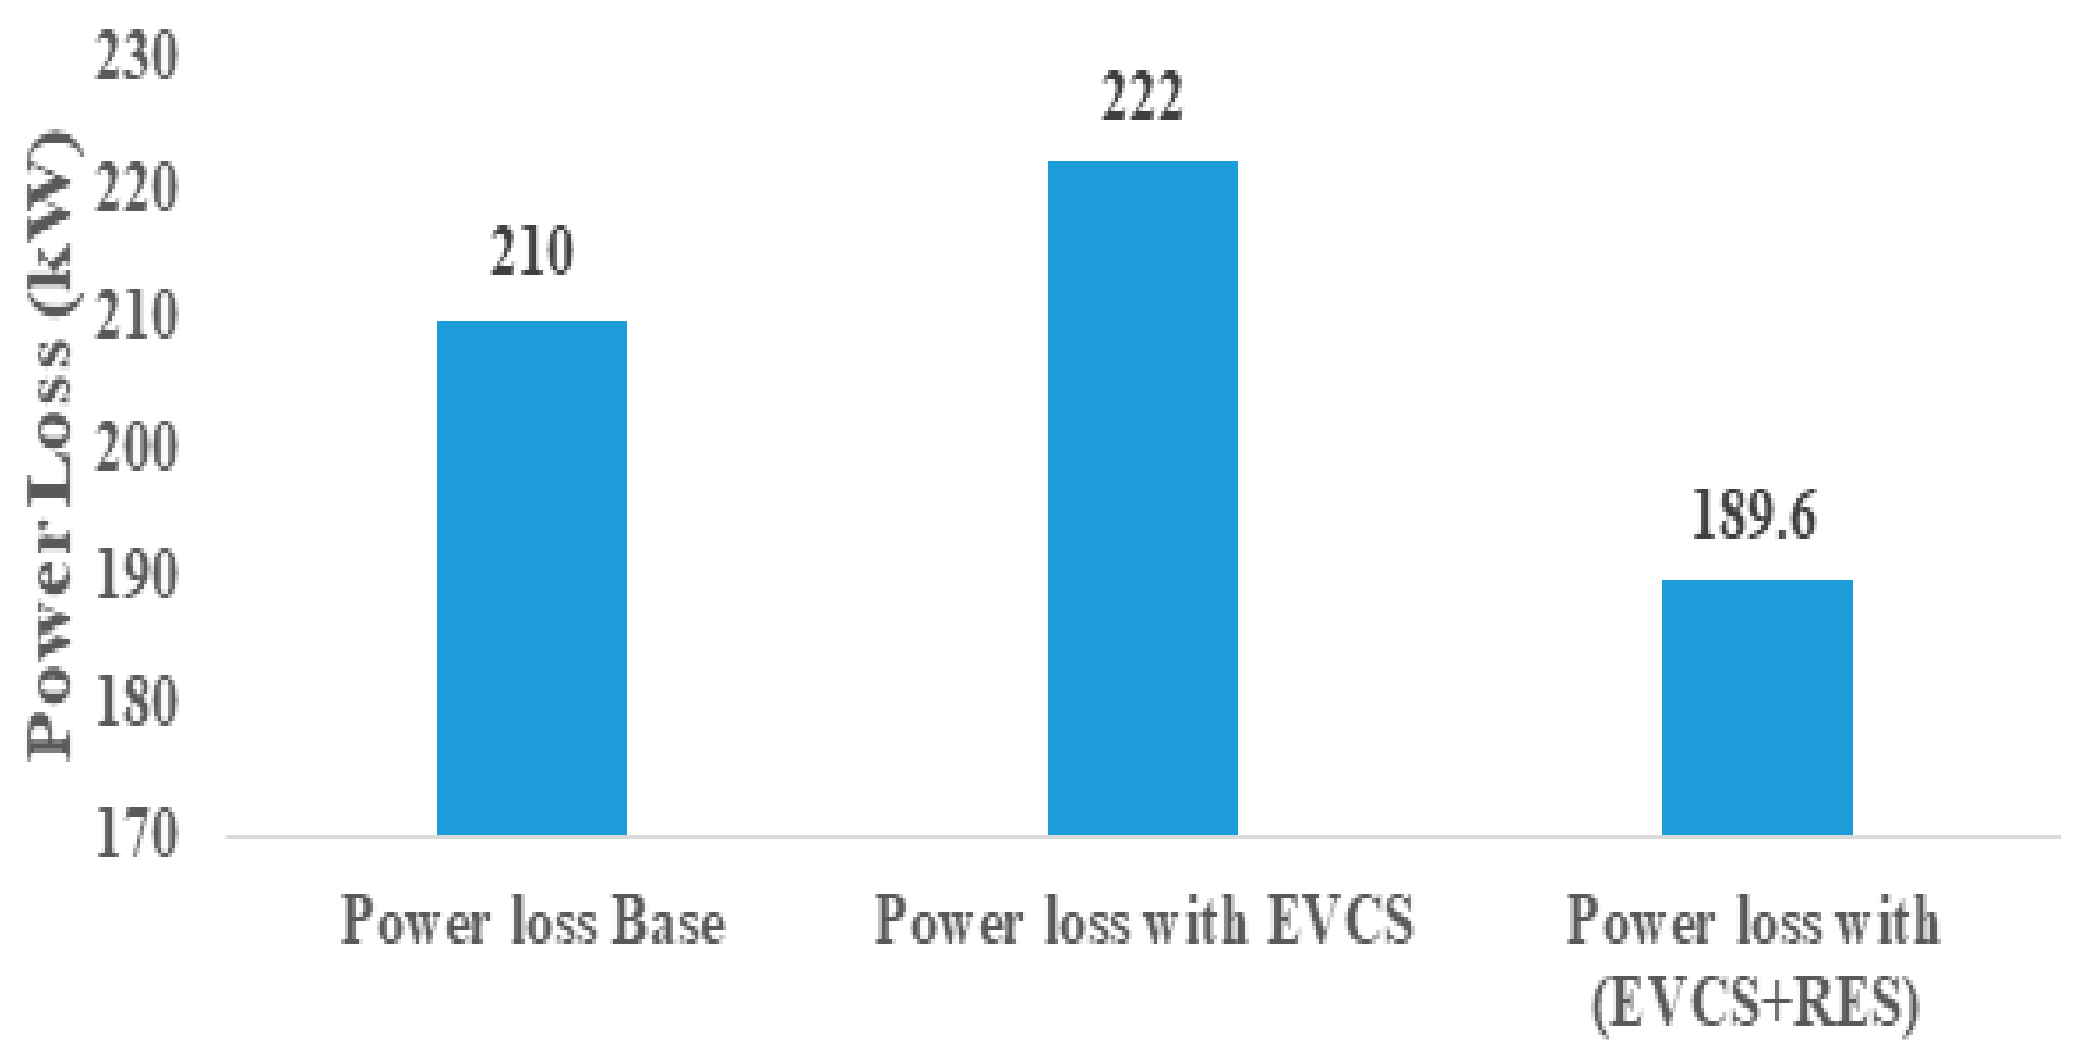
When a CS is installed, the distribution network power loss will be more than when it is not installed. Figure 9 shows that when RESs are placed on the test system along with EVCSs, there is a significant decrease in the power loss by 9.71%.
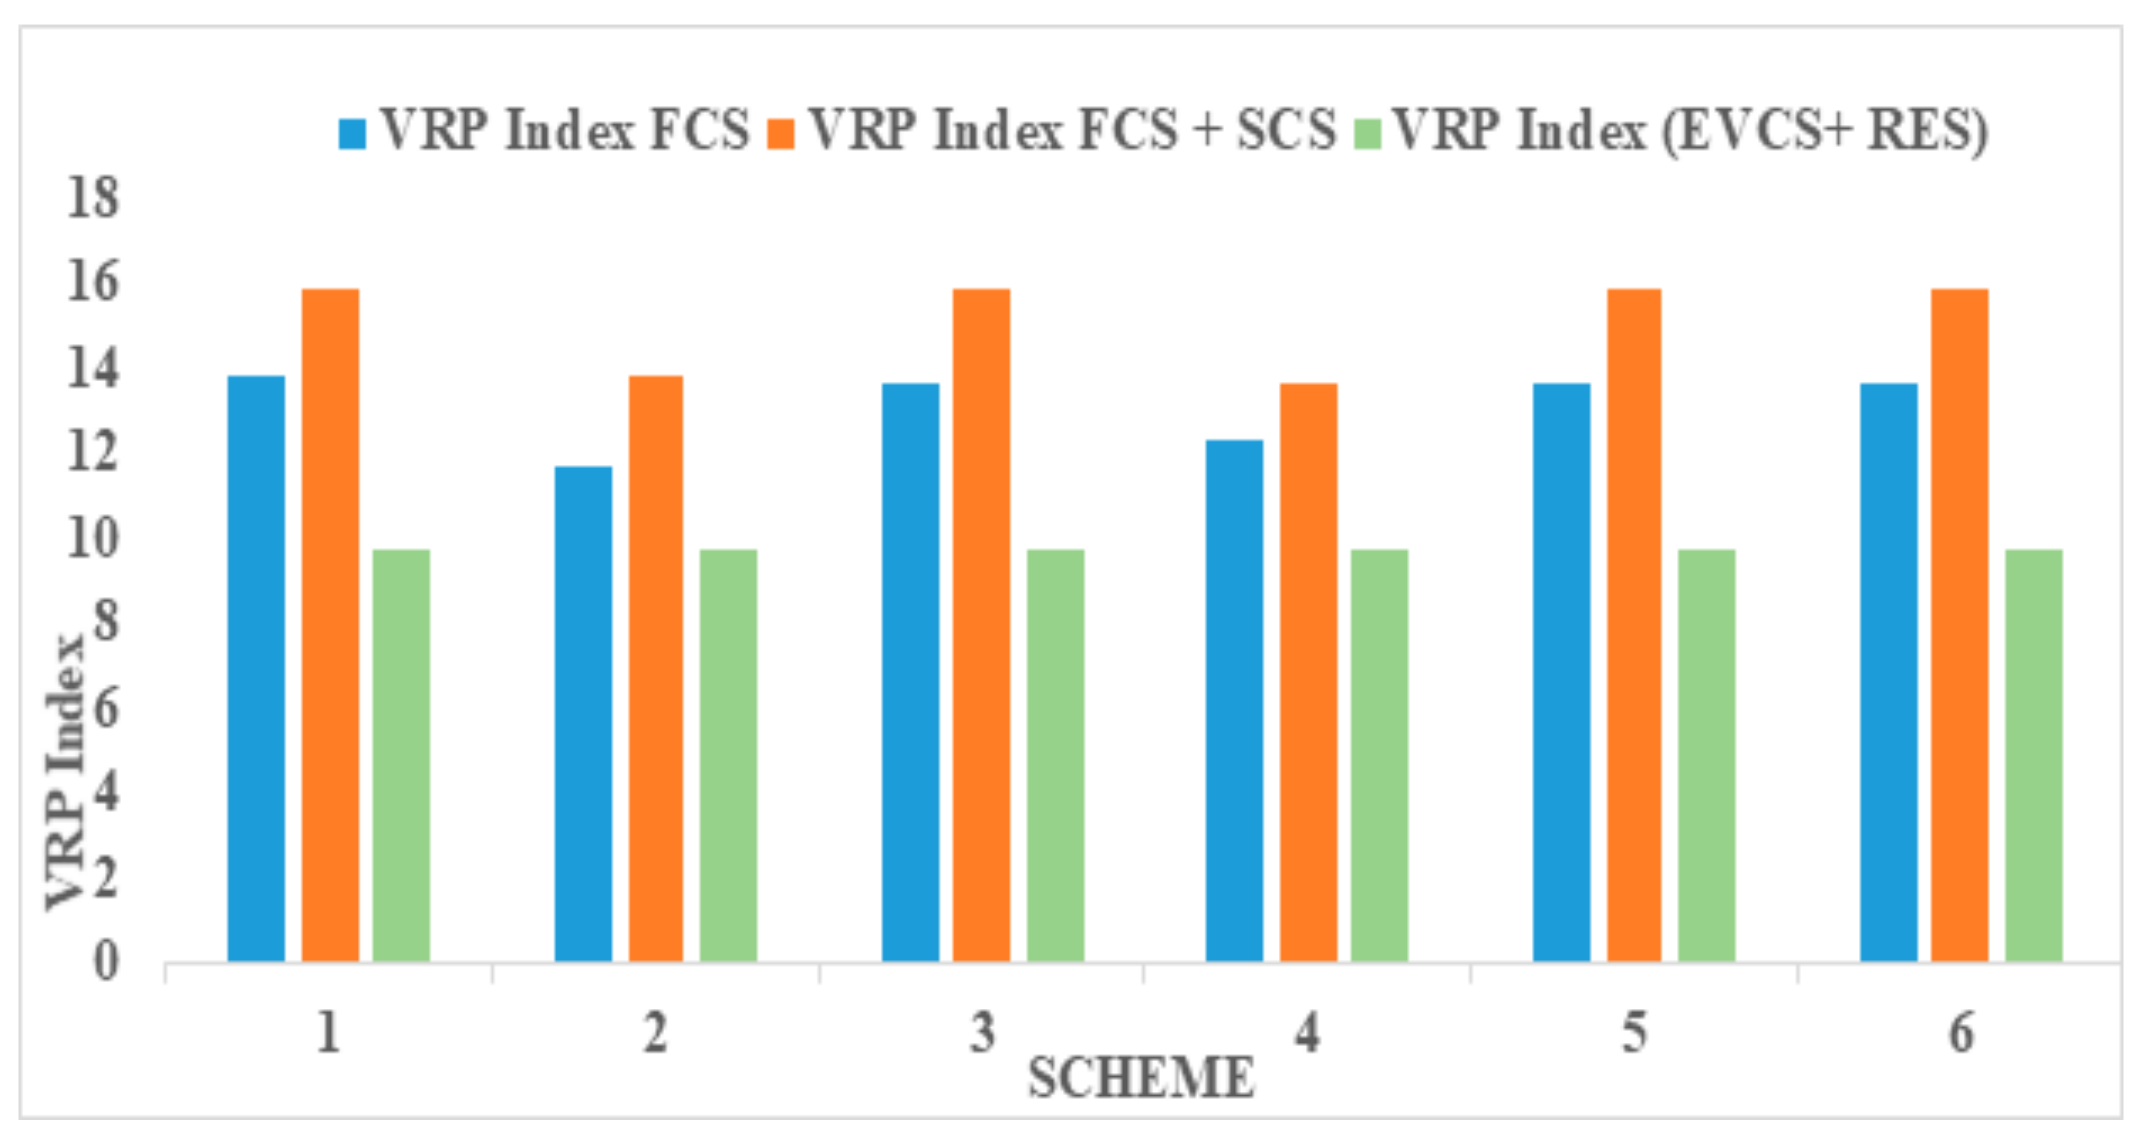
The VRP index of a test system in each scheme with and without RESs can be observed in Figure 10. Scheme 2 gives the lowest VRP index of 11.68 for EVCS placement alone. The minimum value of VRP index is obtained with scheme 6 compared to other schemes of operation, i.e., 9.6985 with EVCS and RES placement. The percentage reduction of VRP index on six various schemes for 33 bus system is shown in Figure 11.
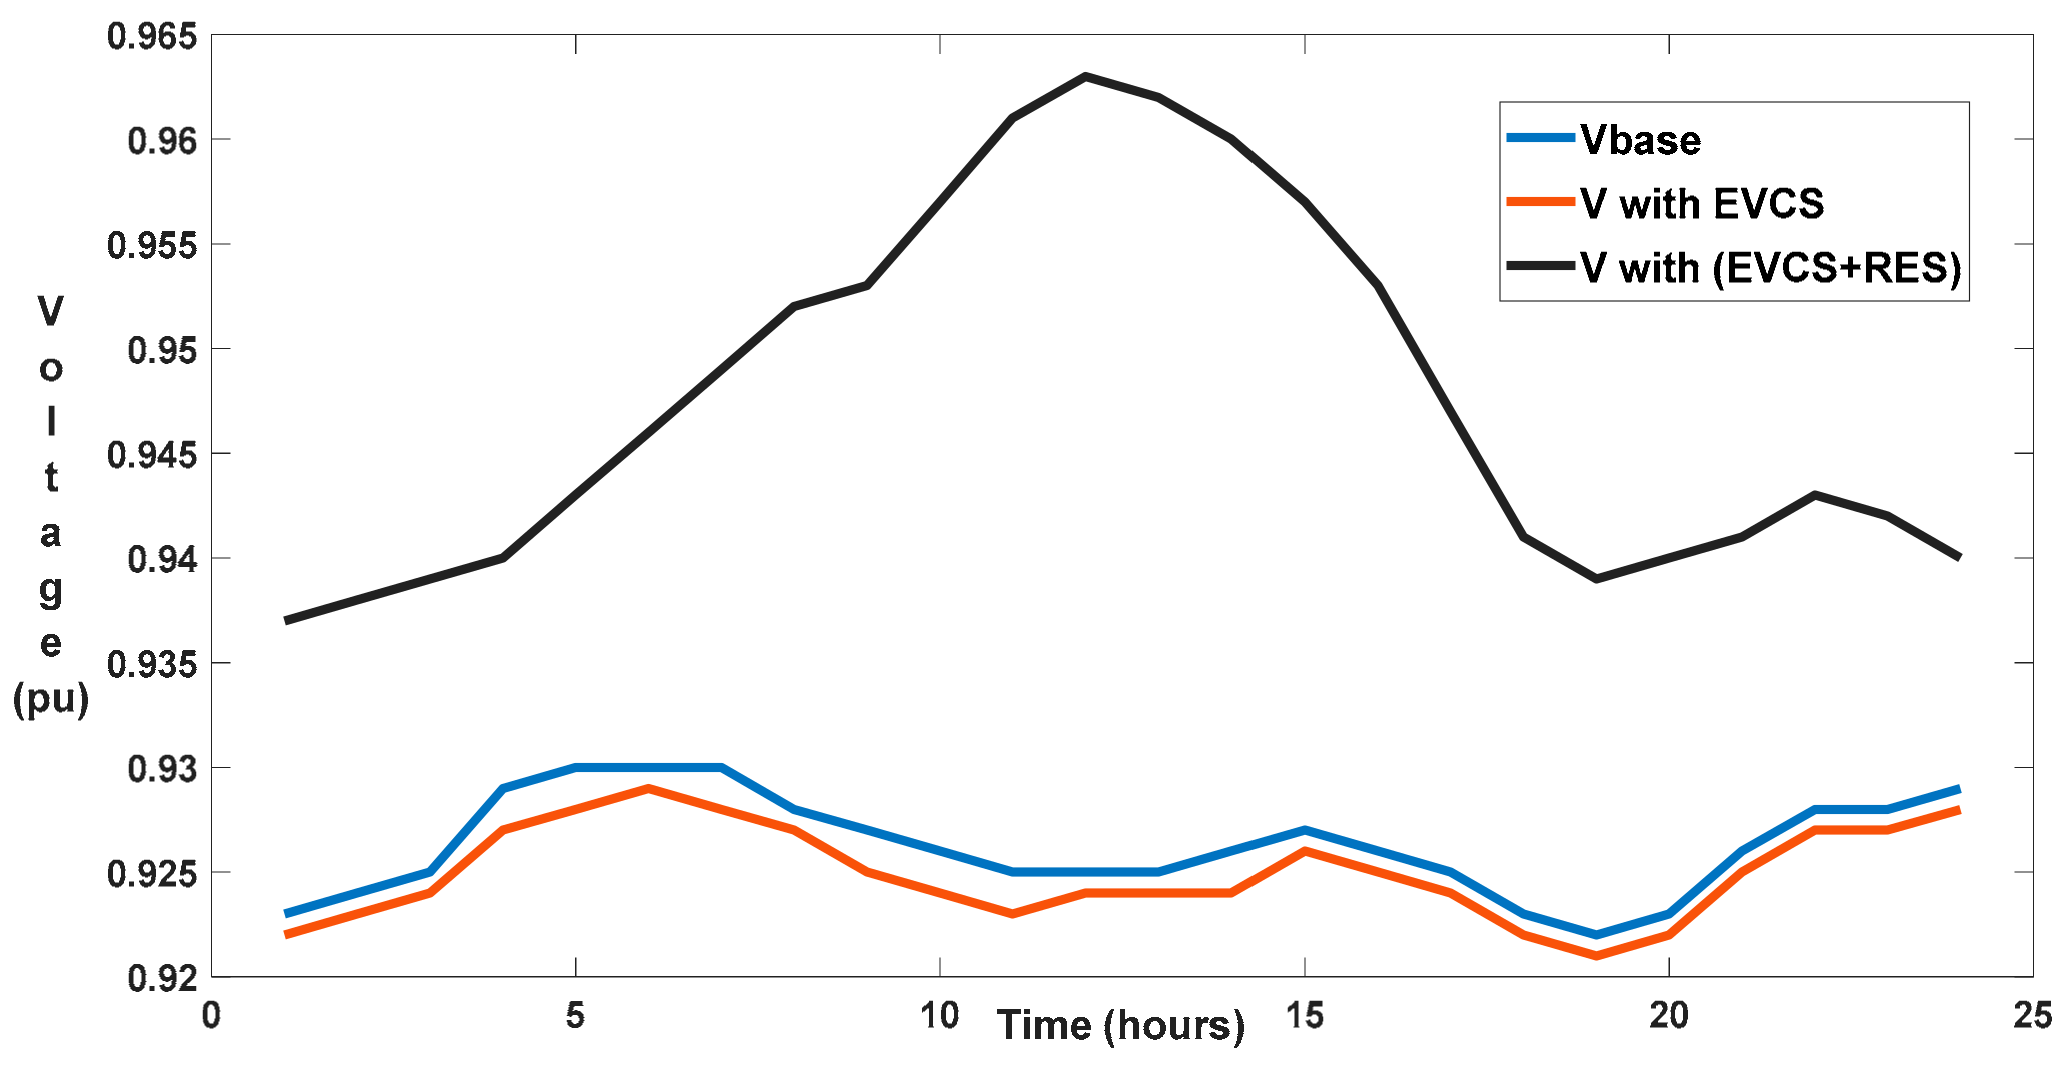
The power variation of PV, wind, and EV loading for 24 h is shown in Figure 12, in which time is displayed on the X-axis followed by power (kW) represented on the Y-axis, concerned with solar irradiation, variation in wind speed, and dynamic behavior of EV load. The output power modeling of sources is described in Section 2. The data associated with the power variation concerned with solar irradiation [45] and wind speed variation are adapted from [33,46,47]. The EV charging and discharging pattern is adapted from [18]. The VRP index for EVCS installation alone and RES along with EVCS installation are 7.8562 and 9.7154, respectively, displayed in Table 10. Figure 13 represents the voltage fluctuation of the 33-bus system for 24 h. The maximum voltage magnitude was obtained from 12 to 1 pm, and the voltage magnitude drops from 1 to 7 am and 6 pm to 12 am for the proposed case, based on the respective charging and discharging of EVs. Less voltage fluctuations can be observed for the base case. The voltage drops at all the hours with EVCS placement alone compared to the base case.

5.2.2. IEEE 123-Bus System

The optimal location of CSs centered on the VRP index in the 123-bus test system is given in Table 11. The placement of CSs is performed on the strongest buses of the system, with the major focus of reducing VRP index and enhancing the voltage profile of the system by reducing power losses.
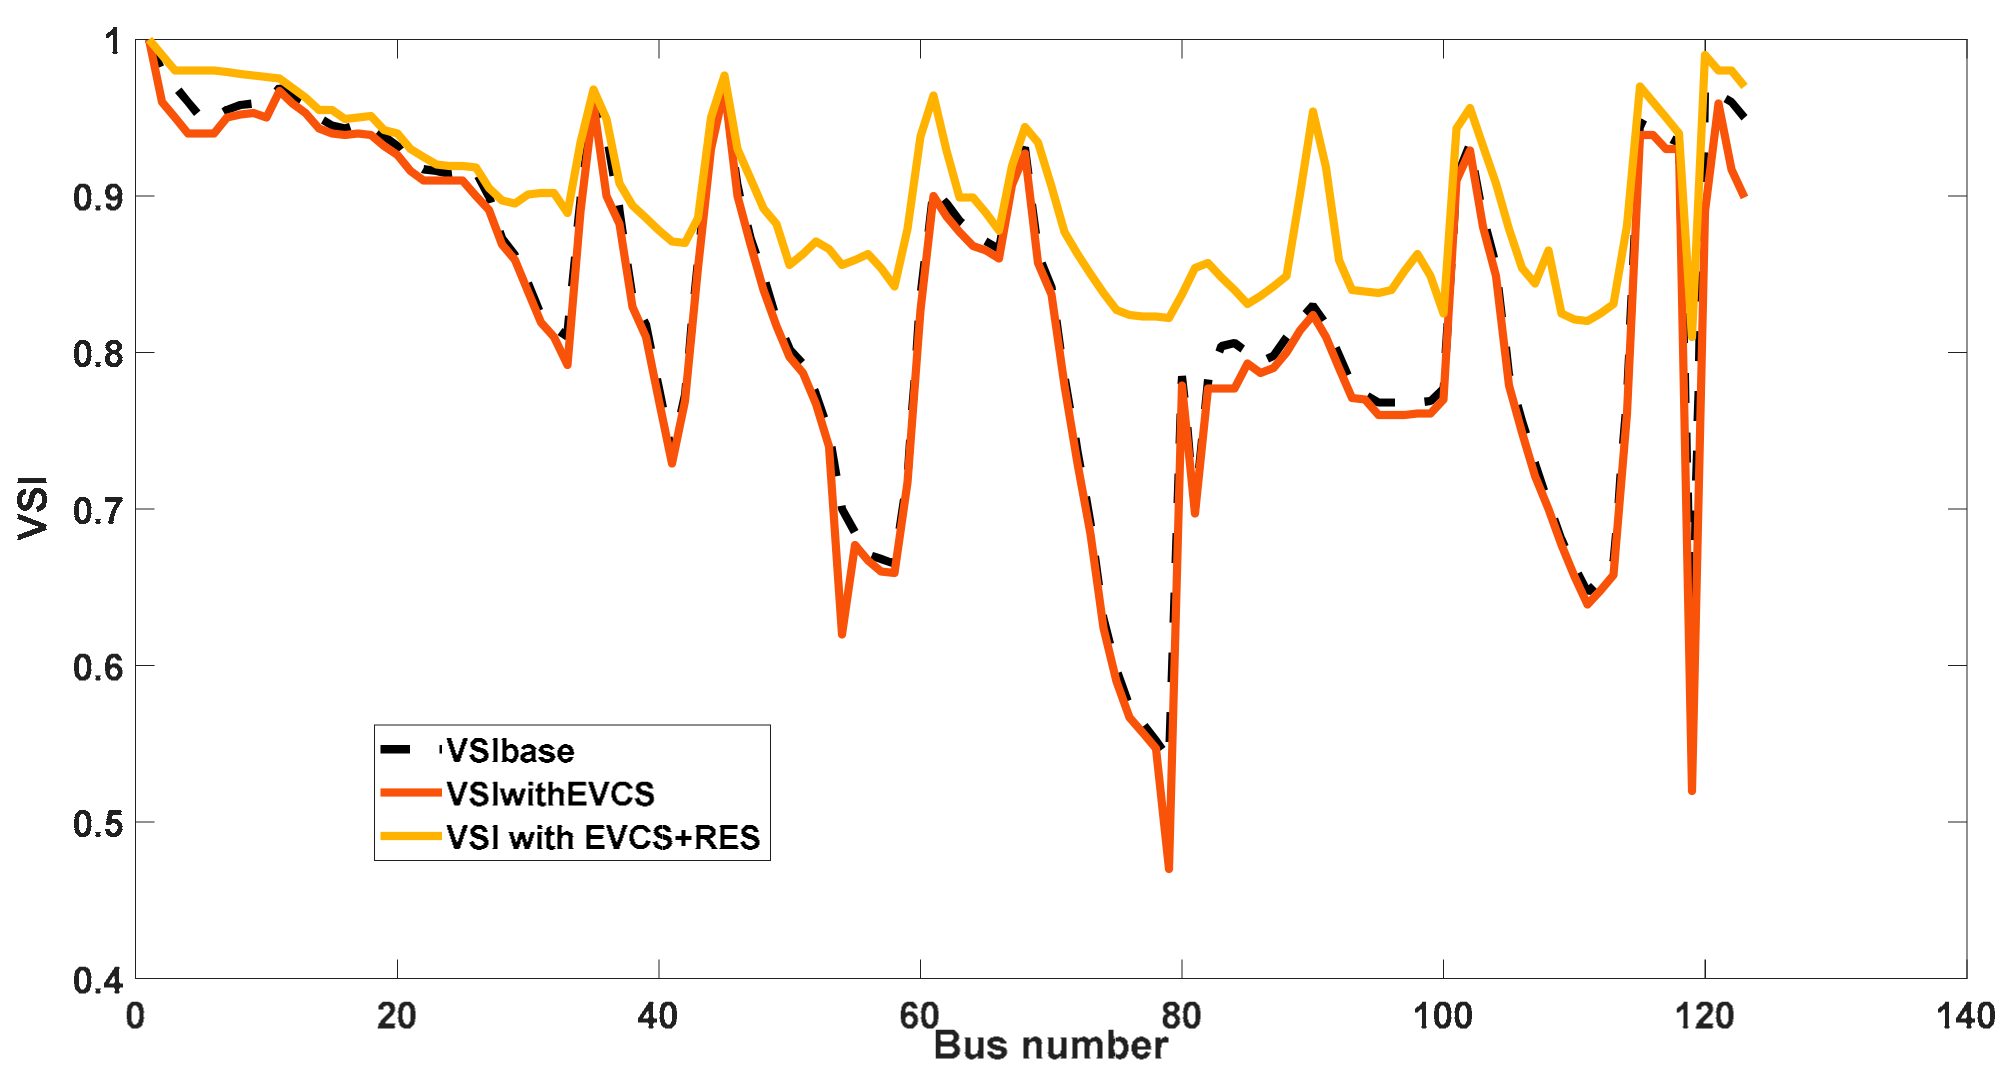
The value of VSI on the 123-bus system is determined for each bus as discussed in Section 3. The stability of the bus is given by VSI. The VSI value varies between 0 and 1. The placement and sizing of EVCSs and RESs on the IEEE 123 test system depends on the continuous fall and sudden rise of VSI. Figure 14 shows the VSI value for the base, after placement of the EVCS load of 1500 kW and the EVCSs considering RESs. The EVCS load installed at the most robust bus, 60 of the test system, caused less degradation of voltage stability. The stability index of the weakest bus, 79, is improved by 52.22% after installing RESs, considering the base value, and 74.89% considering only EVCSs. In comparison to EVCS placement alone, the VSI value is increased for all buses with the placement of RESs.
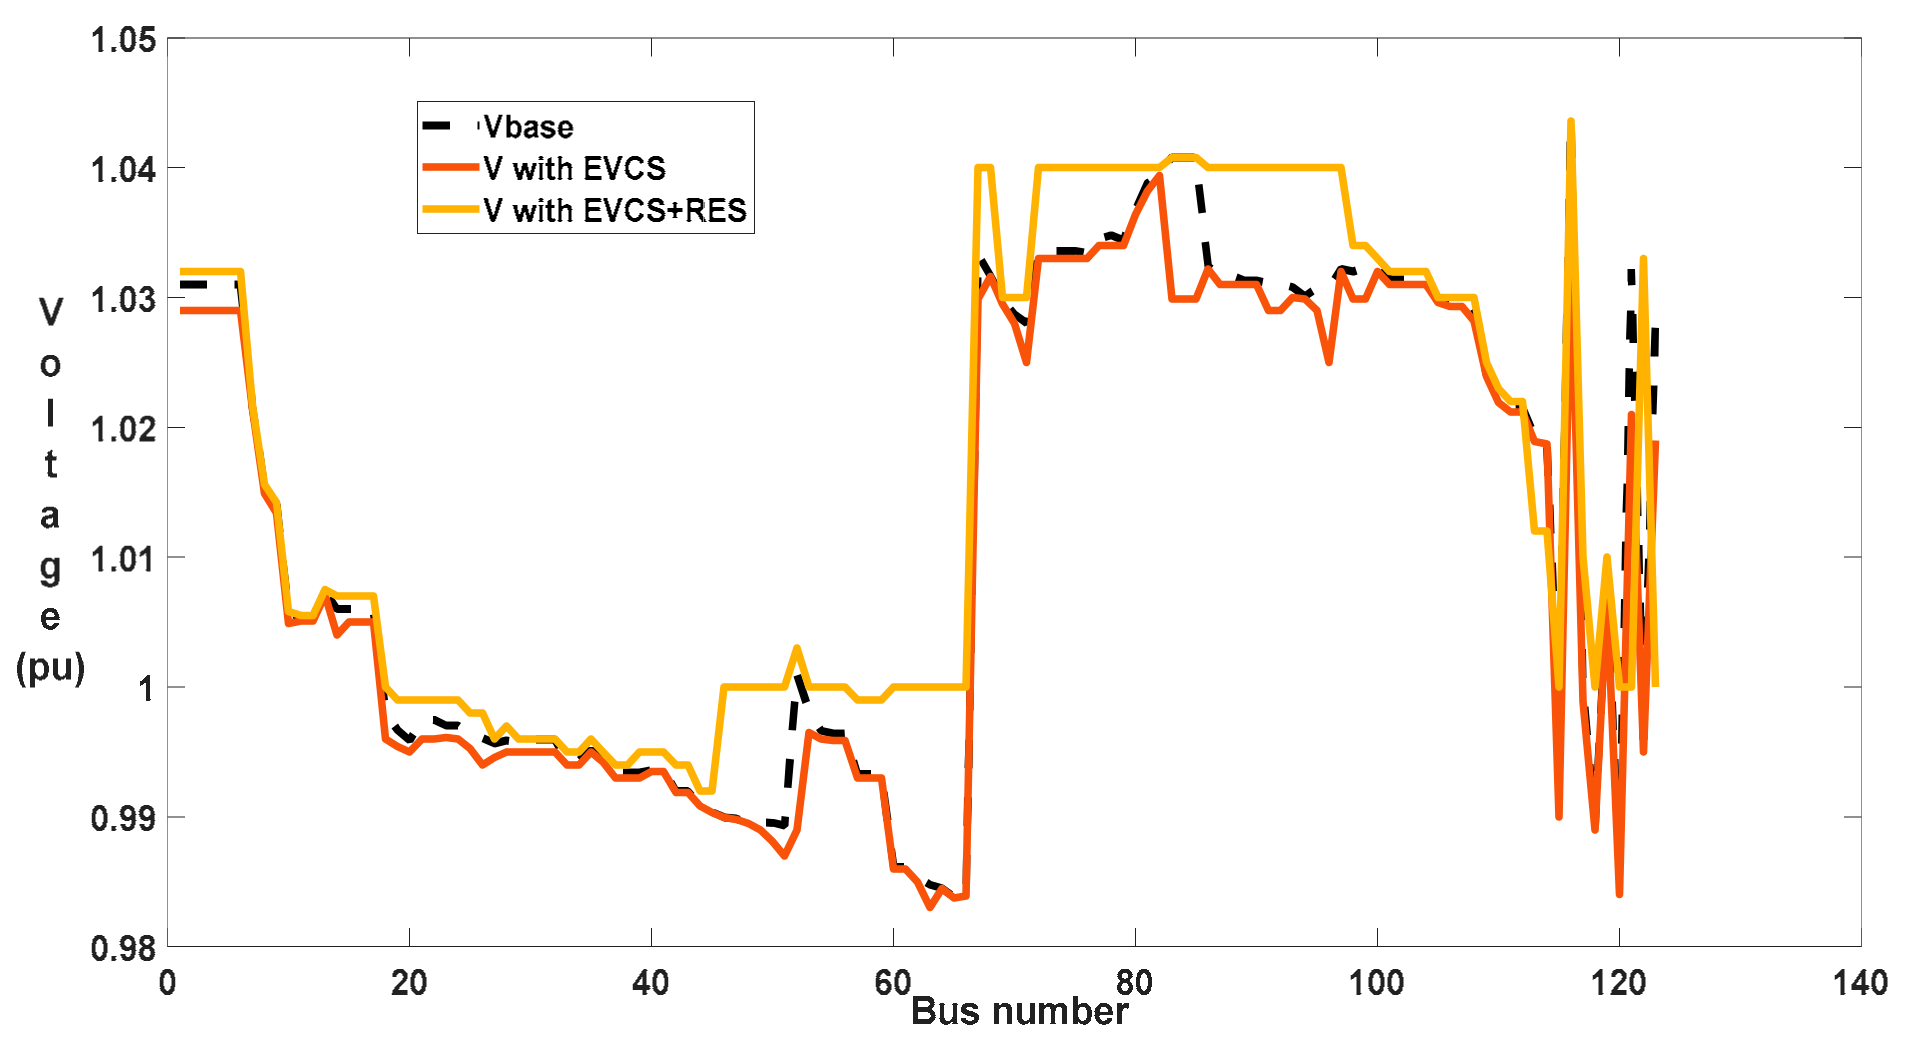
Figure 15 displays the voltage profile of the setup at each bus for the base, after installing EVCSs with and without connecting RESs. It indicates that the voltage drop of all the buses after installing EVCSs is much less than the base value because the CS is positioned at the robust bus of the test system. The voltage magnitude of all the buses lies within the acceptable range because of the distribution of CSs between a number of buses instead of concentrating the CSs at a single bus. The lowest value of voltage is obtained at bus number 62, and the maximum voltage is found at bus numbers 83, 84, 85, and 116. The voltage profile started at 1.03 p.u. of voltage at bus number 1. The voltage profile is rapidly and significantly enhanced from bus number 66 to 67 and 115 to 116, then gradually decreased. The significant enhancement of voltage profile at each bus of the system is perceived after installing RESs.
Figure 16 shows that when RESs are placed on the test system along with EVCSs, there is a significant decrease in the power loss, by 6.09% and 4.44%, with respect to EVCS placement alone and the base value.
The comparison of VRP index in each scheme of operation is observed in Figure 17. Scheme 2 gives the lowest VRP index of 19.99 for EVCS placement alone. The minimum value of VRP index is obtained with scheme 6 in comparison with other schemes of operation, i.e., 17.34 with EVCS and RES placement.
Figure 18 shows the decrease in VRP index for a different operating scheme after installing RESs. Schemes 2 and 4 provide the least VRP index reduction concerning the base, at 13% and 15.36%. The highest reduction in VRP index is achieved in scheme 1 with reference to the base, at 18.27%. The computation time required for the proposed case is 20.89 s.
The power loss reduction and further minimization of the VRP index are achieved by optimal placement of RESs, viz., solar PV, wind, and fuel cells, as described in Table 12. The major RES solar PV of 1080 kW and 1190 kW are placed at bus number 2 and 60 of the 33-bus and 123-bus systems, respectively. The maximum CS load is positioned at bus 2 and 60, as they are the strongest buses of the system, where substantial voltage drop occurs. The wind of 750 kW and 900 kW is placed at bus 18 and 72 because the least value of voltage occurs after placing the CS compared to all other buses. Hence, to maintain the voltage within the tolerable limit, bus numbers 18 and 72 are optimally selected, and the fuel cell of 250 kW and 510 kW is placed at buses 30 and 102, respectively. The values for the objective functions, i.e., cost and VRP index on two different test systems, are provided in Table 13. It validates the proposed case VRP index model with the latest published work derived from reference [3]. Schemes 1 and 6 provide the minimized objective function cost and VRP index values, respectively, for the proposed case.
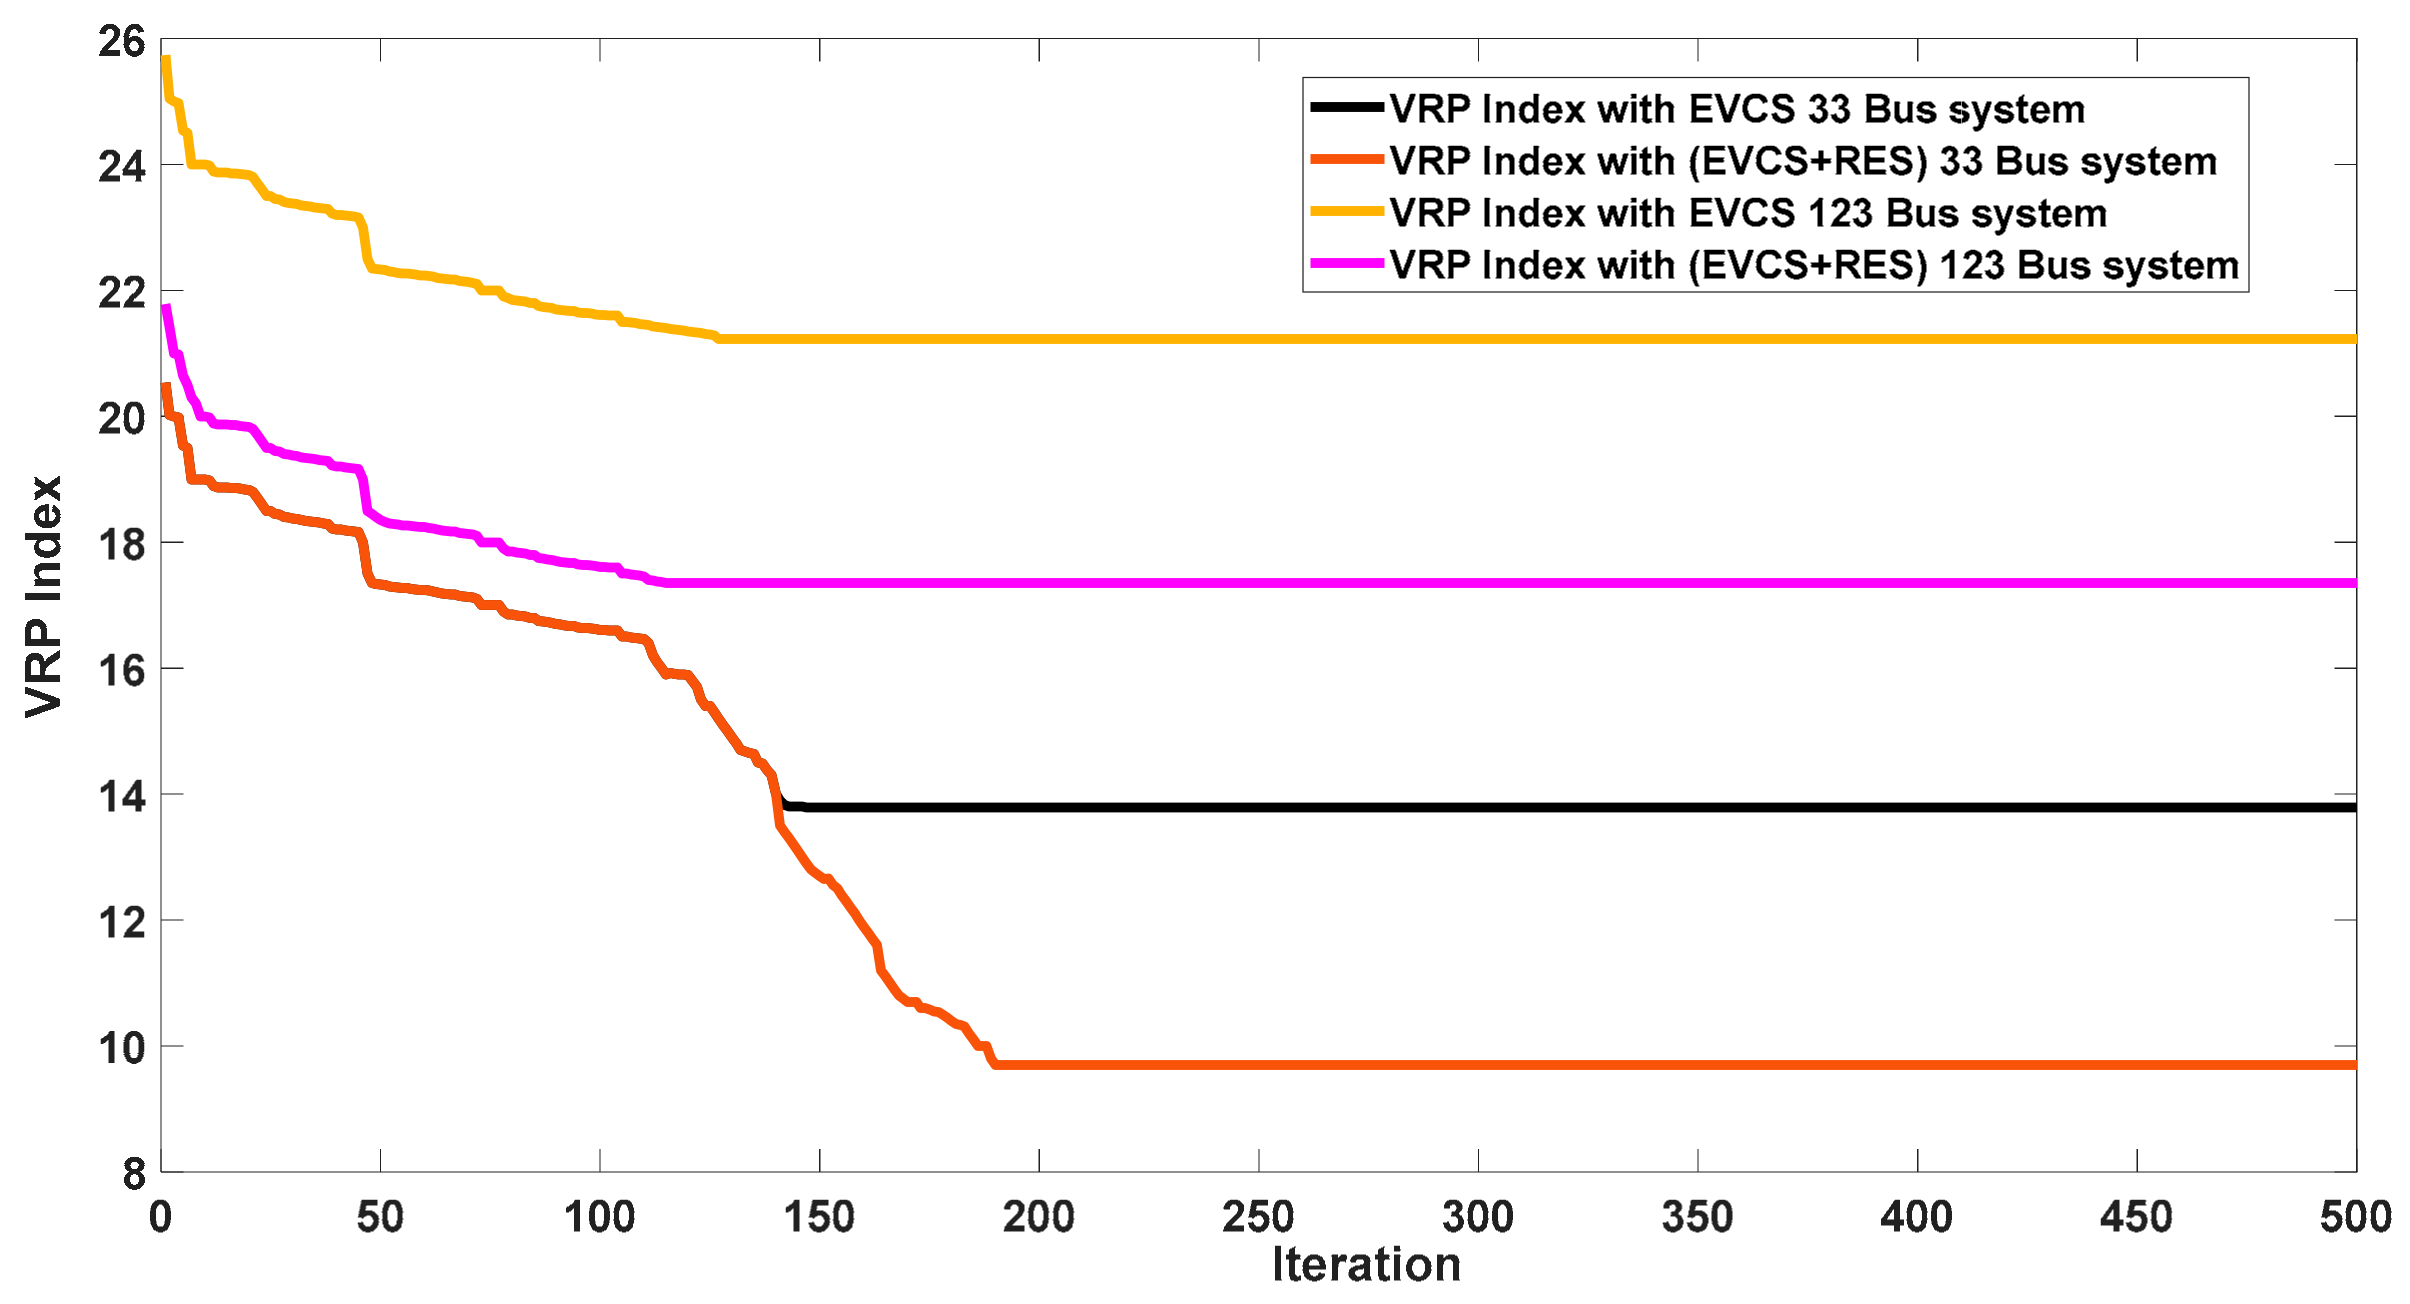
Figure 19 illustrates the convergence rate of modified TLBO for scheme 1, concerned only with EVCSs, and for the suggested case on both the test systems. The proposed case of the modified TLBO method gives more robust results because it reaches the least possible objective function. Hence, the optimum placement and sizing of EVCSs in a DC MG consisting of wind, solar PV, and fuel cells integrated with the grid are a favorable way out for an optimal reduction in the VRP index of the test system.
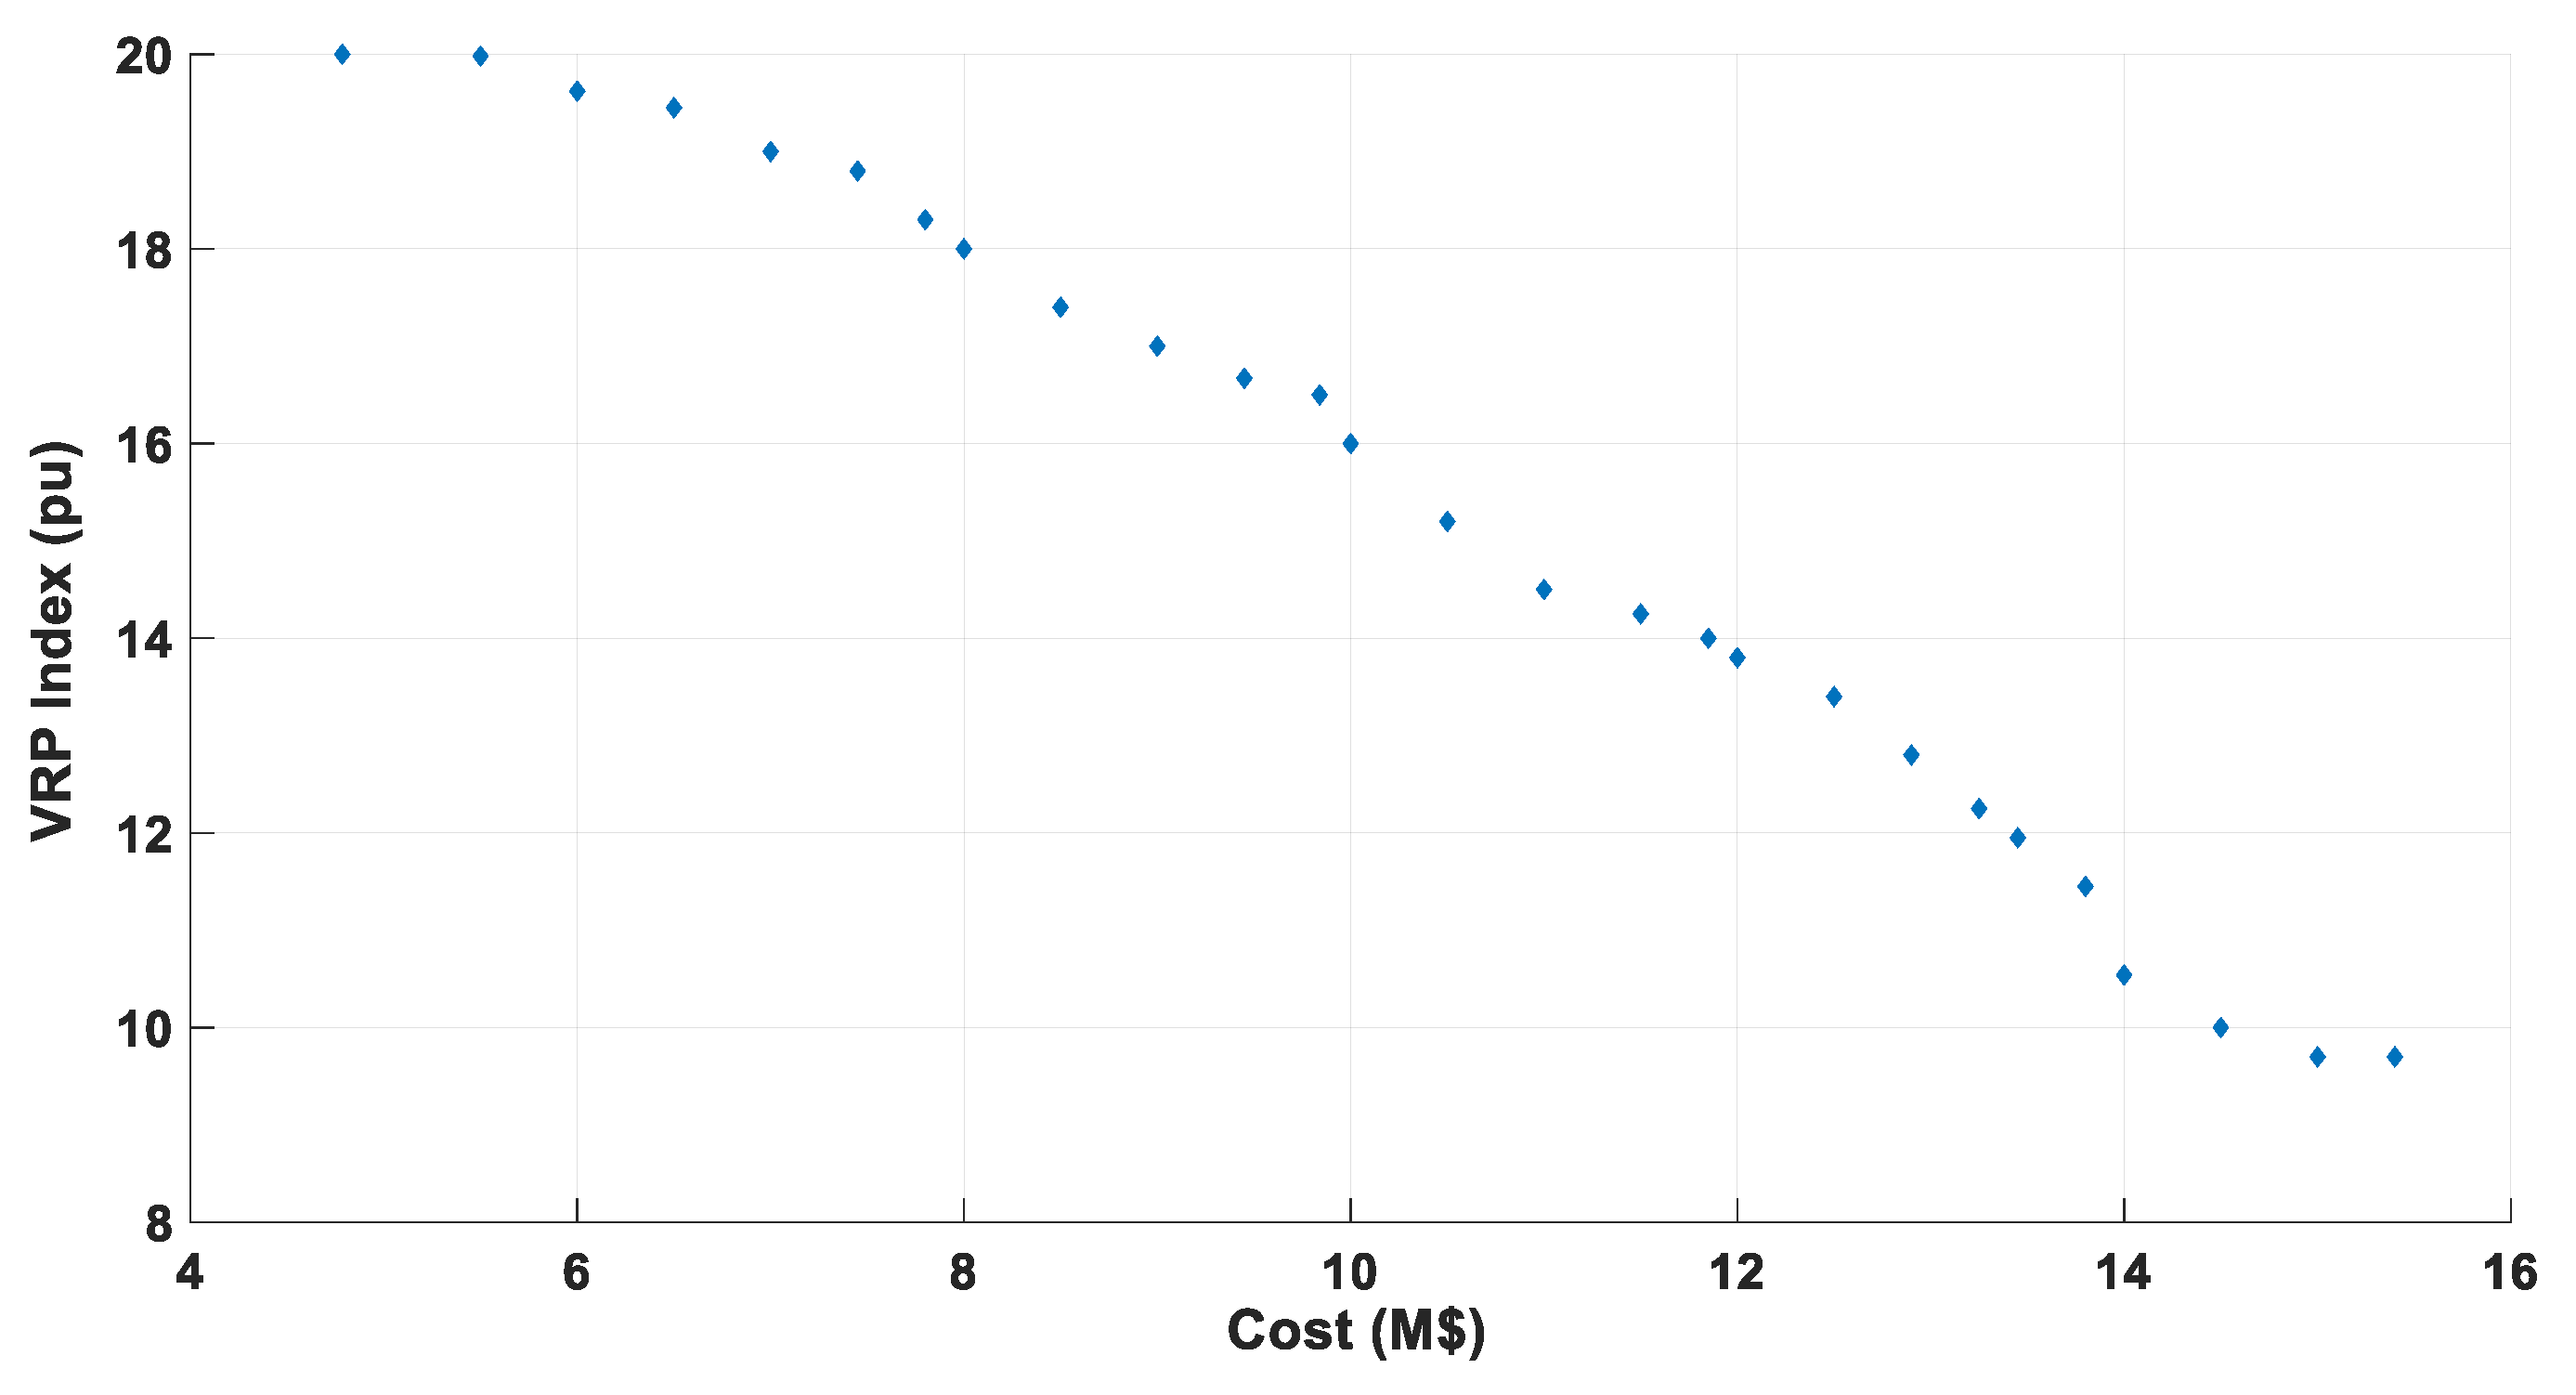
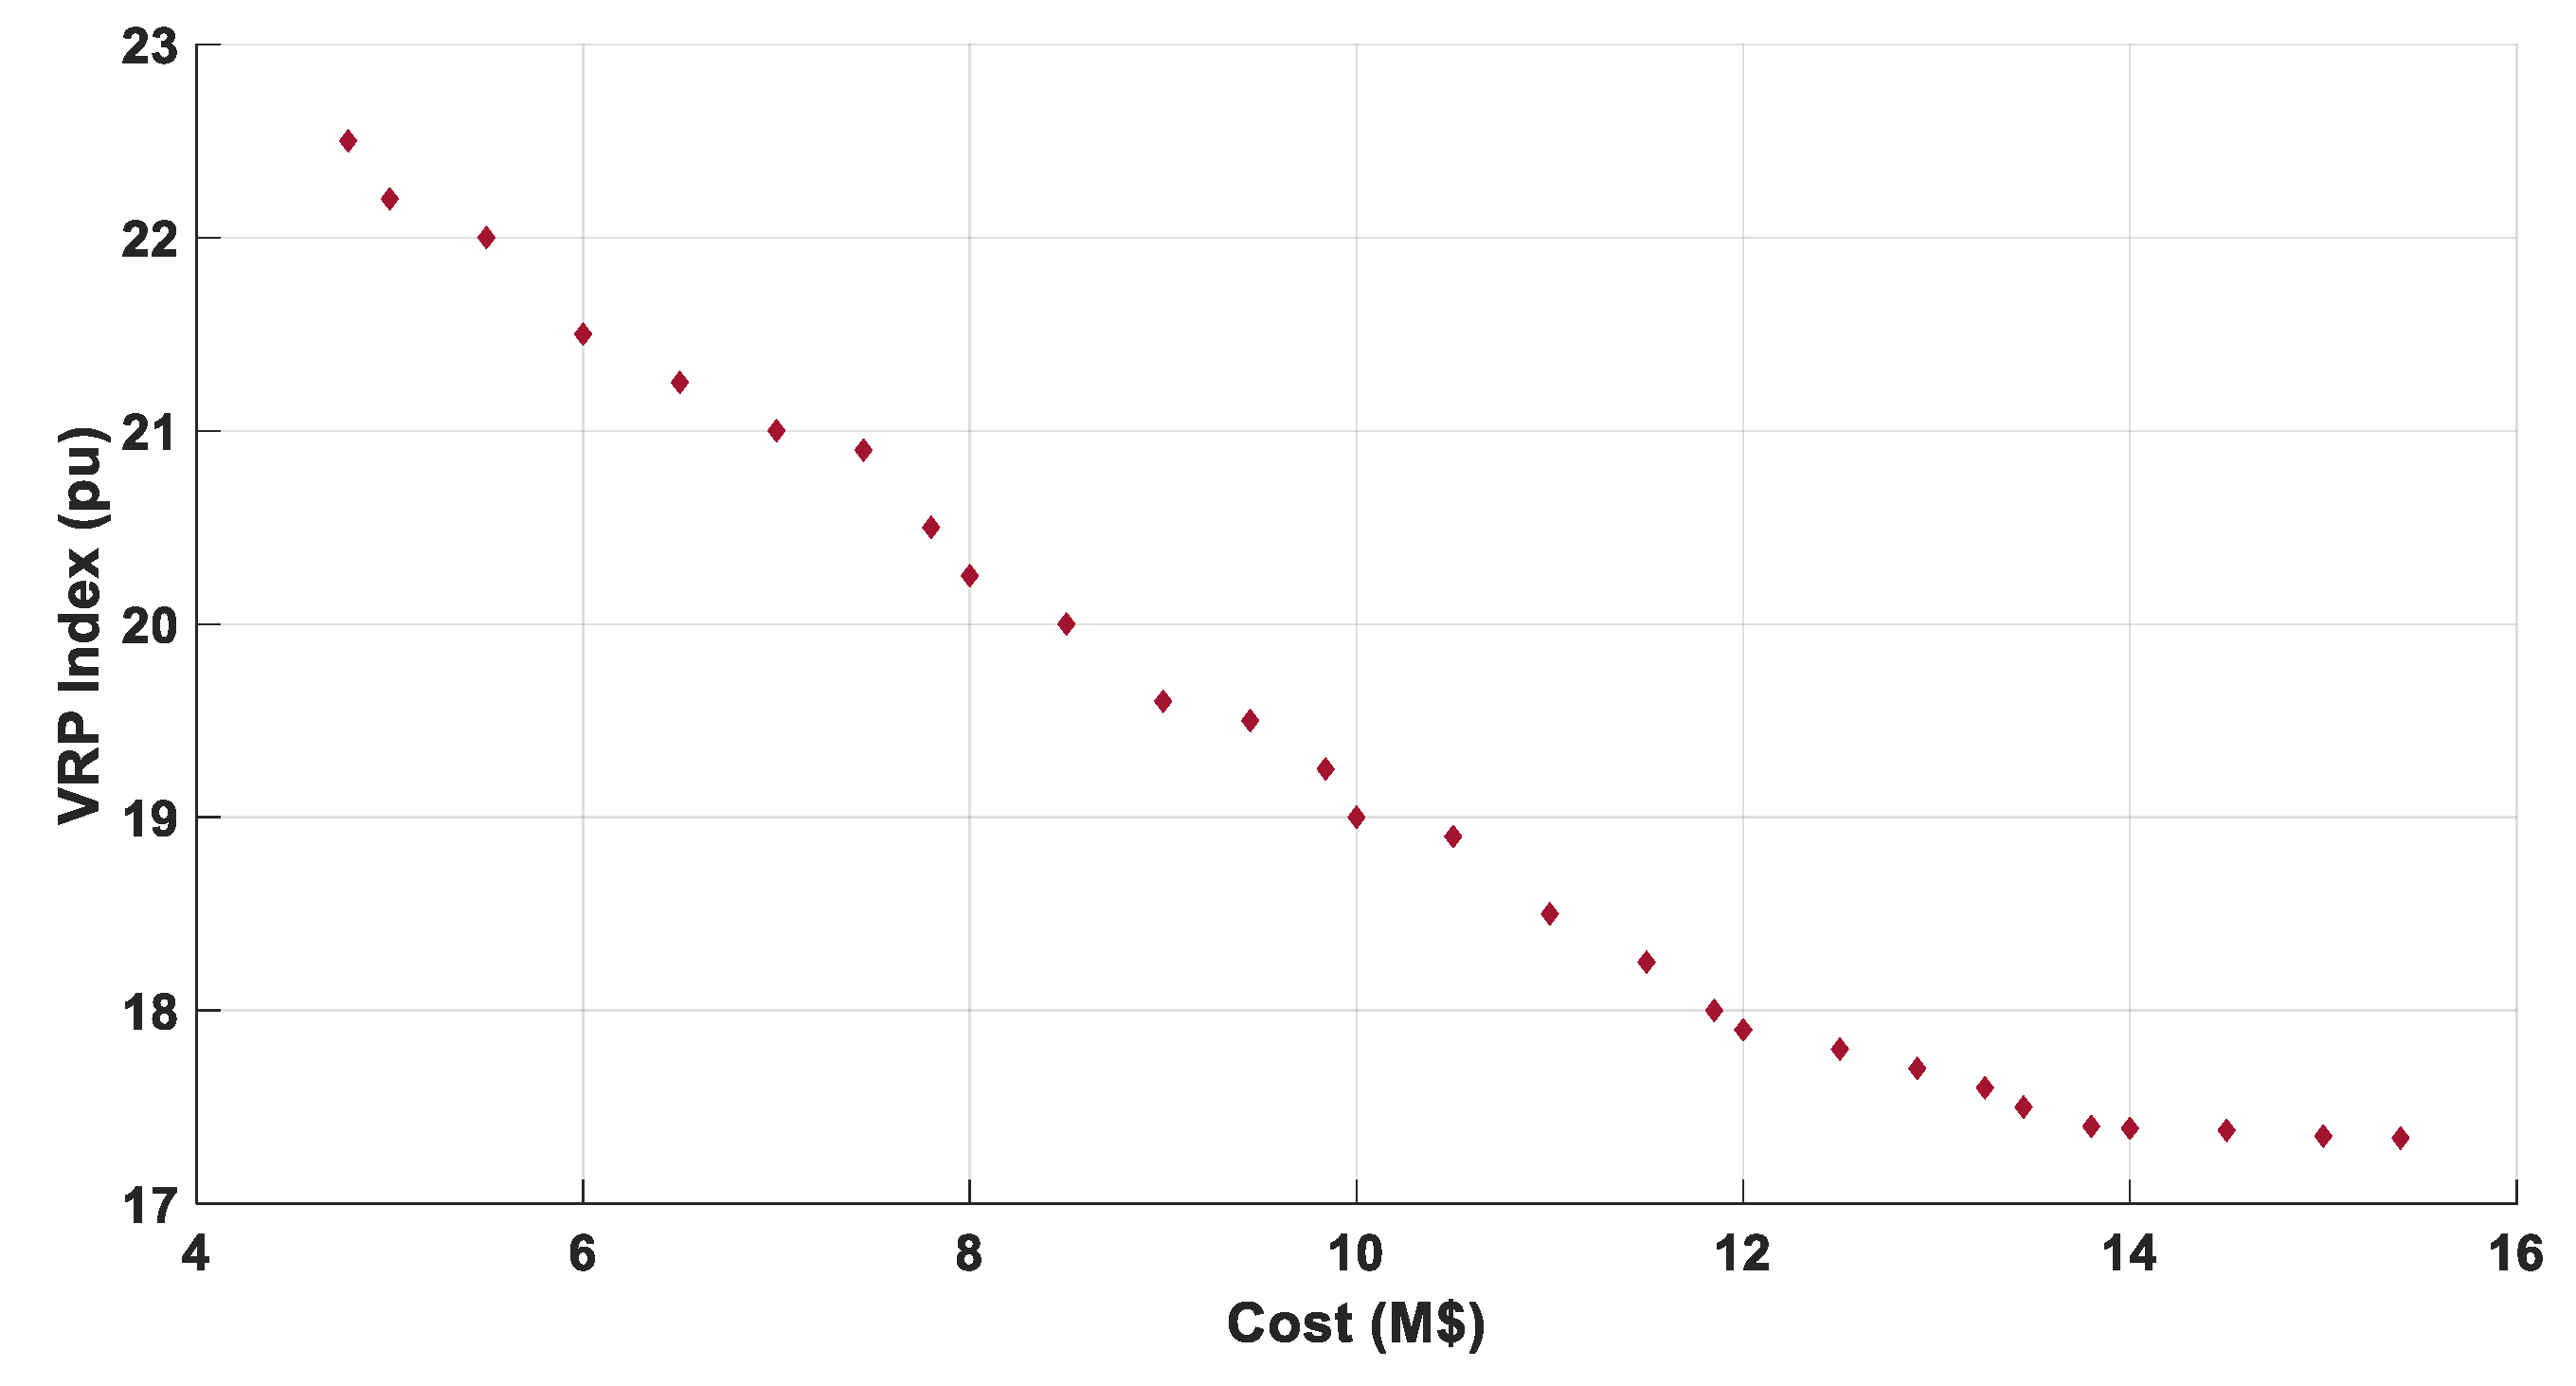
The pareto graph considering the proposed approach, scheme 6, is given in Figure 20 and Figure 21 for 33- and 123-bus systems, respectively. The pareto optimum solution yields the best compromised objective parameters for six diverse schemes of operation on both the test systems.

6. Conclusions

The rapid increase in EVCS loads can cause voltage unsteadiness and reliability problems. Due to the large-scale penetration of RESs, the reliable operation of the distribution network may be affected, which can strain the grid network’s performance. To address this particular issue, a new operation strategy is employed. This paper gives insight into the optimum sizing and location of EVCSs and RESs in a DC MG integrated with a utility grid. The present work is solved in a multi-objective context including cost and distribution network operational aspects such as voltage stability, power loss, and reliability. The major focus is to decrease the VRP index of the distribution unit under six diverse schemes of operation. For the proposed case, the minimum value of cost obtained is USD 2.0250 × 10⁶. The CSs are optimally placed at bus numbers 2, 19, and 20 and 16, 43, and 107 on 33 and 123 test systems, respectively. The RESs are optimally placed at 2, 18, and 30 and 60, 72, and 102 on 33 and 123 test units, respectively. The power loss on a medium scale and large scale is reduced by 14.59%, 9.714% and 6.09%, 4.44%, respectively, for the proposed case concerning EVCS placement alone and regarding the base case. An efficient meta-heuristic-modified TLBO technique is applied in MATLAB to solve this complex problem. The efficacy of the recommended strategy is evaluated on a modified IEEE 33- and123-bus test system for the proposed case and associated with the base values. The obtained results indicate that the optimal site and sizing of RESs and EVCSs with the proposed operational strategy enhance the voltage profile of a distribution system. The optimal positioning of RESs along with EVCSs reduces the VRP index of a distribution system to a greater extent under scheme 6 compared to other schemes of operation on both test systems. Therefore, the proposed instance is more suitable for minimizing the objective functions. There are numerous possibilities to delve deep into a further study by performing a techno-economic valuation of DC-MG-based EVCSs when linked to the utility grid.

Author Contributions

Conceptualization, N.K.K. and J.N.S.; methodology, N.K.K. and J.N.S.; software, N.K.K. and V.S.R.; validation, N.K.K., V.K.J. and J.N.S.; formal analysis, N.K.K.; investigation, N.K.K., V.K.J. and J.N.S.; resources, N.K.K. and J.N.S.; data curation, N.K.K.; writing—original draft preparation, N.K.K.; writing—review and editing, N.K.K., V.K.J. and J.N.S.; visualization, N.K.K., V.K.J., J.N.S. and A.S.; supervision, V.K.J. and J.N.S.; project administration, V.K.J., D.N.G. and J.N.S.; funding acquisition, V.K.J., G.K., V.S.R. and J.N.S. All authors have read and agreed to the published version of the manuscript.

Funding

This research received no external funding.

Data Availability Statement

Not applicable.

Conflicts of Interest

The authors declare no conflict of interest.

References

  1. Fang, S.; Zhao, T.; Xu, Y.; Lu, T. Coordinated Chance-constrained Optimization of Multi-energy Microgrid System for Balancing Operation Efficiency and Quality-of-service. J. Mod. Power Syst. Clean Energy 2020, 8, 853–862. [Google Scholar] [CrossRef]
  2. Salkuti, S.R. Short-term optimal hydro-thermal scheduling using clustered adaptive teaching learning based optimization. Int. J. Electr. Comput. Eng. 2019, 9, 3359. [Google Scholar] [CrossRef]
  3. Aluisio, B.; Bruno, S.; De Bellis, L.; Dicorato, M.; Forte, G.; Trovato, M. DC-Microgrid Operation Planning for an Electric Vehicle Supply Infrastructure. Appl. Sci. 2019, 9, 2687. [Google Scholar] [CrossRef]
  4. Pagidipala, S.; Vuddanti, S. Solving realistic reactive power market clearing problem of wind-thermal power system with system security. Int. J. Emerg. Electr. Power Syst. 2021, 23, 125–144. [Google Scholar] [CrossRef]
  5. Deb, S.; Tammi, K.; Kalita, K.; Mahanta, P. Charging Station Placement for Electric Vehicles: A Case Study of Guwahati City, India. IEEE Access 2019, 7, 100270–100282. [Google Scholar] [CrossRef]
  6. Mozafar, M.R.; Moradi, M.H.; Amini, M.H. A simultaneous approach for optimal allocation of renewable energy sources and electric vehicle charging stations in smart grids based on improved GA-PSO algorithm. Sustain. Cities Soc. 2017, 32, 627–637. [Google Scholar] [CrossRef]
  7. Bilal, M.; Rizwan, M.; Alsaidan, I.; Almasoudi, F.M. AI-Based Approach for Optimal Placement of EVCS and DG With Reliability Analysis. IEEE Access 2021, 9, 154204–154224. [Google Scholar] [CrossRef]
  8. Dhingra, K.; Singh, M. Smart Charging Station to Cater the Sudden Ingress and Egress of EVs while Supporting the Frequency of Microgrid through VSG. Arab. J. Sci. Eng. 2020, 45, 6715–6727. [Google Scholar] [CrossRef]
  9. Deb, S.; Tammi, K.; Kalita, K.; Mahanta, P. Impact of electric vehicle charging station load on distribution network. Energies 2018, 11, 178. [Google Scholar] [CrossRef]
  10. Awasthi, A.; Venkitusamy, K.; Padmanaban, S.; Selvamuthukumaran, R.; Blaabjerg, F.; Singh, A.K. Optimal planning of electric vehicle charging station at the distribution system using hybrid optimization algorithm. Energy 2017, 133, 70–78. [Google Scholar] [CrossRef]
  11. Cui, Q.; Weng, Y.; Tan, C.-W. Electric Vehicle Charging Station Placement Method for Urban Areas. IEEE Trans. Smart Grid 2019, 10, 6552–6565. [Google Scholar] [CrossRef]
  12. Jawad, S.; Liu, J. Electrical Vehicle Charging Services Planning and Operation with Interdependent Power Networks and Transportation Networks: A Review of the Current Scenario and Future Trends. Energies 2020, 13, 3371. [Google Scholar] [CrossRef]
  13. Wang, D.; Locment, F.; Sechilariu, M. Modelling, Simulation, and Management Strategy of an Electric Vehicle Charging Station Based on a DC Microgrid. Appl. Sci. 2020, 10, 2053. [Google Scholar] [CrossRef]
  14. AbuElrub, A.; Hamed, F.; Saadeh, O. Microgrid integrated electric vehicle charging algorithm with photovoltaic generation. J. Energy Storage 2020, 32, 101858. [Google Scholar] [CrossRef]
  15. Khaksari, A.; Tsaousoglou, G.; Makris, P.; Steriotis, K.; Efthymiopoulos, N.; Varvarigos, E. Sizing of electric vehicle charging stations with smart charging capabilities and quality of service requirements. Sustain. Cities Soc. 2021, 70, 102872. [Google Scholar] [CrossRef]
  16. Deb, S.; Tammi, K.; Gao, X.-Z.; Kalita, K.; Mahanta, P.; Cross, S. A Robust Two-Stage Planning Model for the Charging Station Placement Problem Considering Road Traffic Uncertainty. IEEE Trans. Intell. Transp. Syst. 2021, 23, 6571–6585. [Google Scholar] [CrossRef]
  17. Pal, A.; Bhattacharya, A.; Chakraborty, A.K. Allocation of EV Public Charging Station in Renewable based Distribution Network using HHO Considering Uncertainties and Traffic Congestion. Res. Sq. 2021. preprint. [Google Scholar]
  18. Islam, M.; Shareef, H.; Mohamed, A. Improved approach for electric vehicle rapid charging station placement and sizing using Google maps and binary lightning search algorithm. PLoS ONE 2017, 12, e0189170. [Google Scholar] [CrossRef]
  19. Bhadra, J.; Chattopadhyay, T.K. Analysis of distribution network by reliability indices. In Proceedings of the 2015 International Conference on Energy, Power and Environment: Towards Sustainable Growth (ICEPE), Shillong, India, 12–13 June 2015; pp. 1–5. [Google Scholar]
  20. Jadoun, V.K.; Sharma, N.; Jha, P.; Malik, H.; Garcia Márquez, F.P. Optimal scheduling of dynamic pricing based v2g and g2v operation in microgrid using improved elephant herding optimization. Sustainability 2021, 13, 7551. [Google Scholar] [CrossRef]
  21. Aluisio, B.; Dicorato, M.; Ferrini, I.; Forte, G.; Sbrizzai, R.; Trovato, M. Optimal Sizing Procedure for Electric Vehicle Supply Infrastructure Based on DC Microgrid with Station Commitment. Energies 2019, 12, 1901. [Google Scholar] [CrossRef]
  22. Navin, N.K. A Multiagent Fuzzy Reinforcement Learning Approach for Economic Power Dispatch Considering Multiple Plug-In Electric Vehicle Loads. Arab. J. Sci. Eng. 2021, 46, 1431–1449. [Google Scholar] [CrossRef]
  23. Suresh, V.; Bazmohammadi, N.; Janik, P.; Guerrero, J.M.; Kaczorowska, D.; Rezmer, J.; Jasinski, M.; Leonowicz, Z. Optimal location of an electrical vehicle charging station in a local microgrid using an embedded hybrid optimizer. Int. J. Electr. Power Energy Syst. 2021, 131, 106979. [Google Scholar] [CrossRef]
  24. Chen, L.; Xu, C.; Song, H.; Jermsittiparsert, K. Optimal sizing and sitting of EVCS in the distribution system using metaheuristics: A case study. Energy Rep. 2021, 7, 208–217. [Google Scholar] [CrossRef]
  25. Ali, A.; Mahmoud, K.; Lehtonen, M. Optimal planning of inverter-based renewable energy sources towards autonomous microgrids accommodating electric vehicle charging stations. IET Gener. Transm. Distrib. 2022, 16, 219–232. [Google Scholar] [CrossRef]
  26. Archana, A.N.; Rajeev, T. A Novel Reliability Index Based Approach for EV Charging Station Allocation in Distribution System. IEEE Trans. Ind. Appl. 2021, 57, 6385–6394. [Google Scholar] [CrossRef]
  27. Shaker, M.H.; Farzin, H.; Mashhour, E. Joint planning of electric vehicle battery swapping stations and distribution grid with centralized charging. J. Energy Storage 2023, 58, 106455. [Google Scholar] [CrossRef]
  28. Wang, S.; Lu, L.; Han, X.; Ouyang, M.; Feng, X. Virtual-battery based droop control and energy storage system size optimization of a DC microgrid for electric vehicle fast charging station. Appl. Energy 2020, 259, 114146. [Google Scholar] [CrossRef]
  29. Vinod, K.R.; Singh, S. Solar photovoltaic modeling and simulation: As a renewable energy solution. Energy Rep. 2018, 4, 701–712. [Google Scholar] [CrossRef]
  30. Shaikh, M.R.S. A Review Paper on Electricity Generation from Solar Energy. Int. J. Res. Appl. Sci. Eng. Technol. 2017, 5, 1884–1889. [Google Scholar] [CrossRef]
  31. Chedid, R.; Sawwas, A. Optimal placement and sizing of photovoltaics and battery storage in distribution networks. Energy Storage 2019, 1, e46. [Google Scholar] [CrossRef]
  32. Pandey, A.K.; Jadoun, V.K.; Sabhahit, J.N. Real-Time Peak Valley Pricing Based Multi-Objective Optimal Scheduling of a Virtual Power Plant Considering Renewable Resources. Energies 2022, 15, 5970. [Google Scholar] [CrossRef]
  33. Djelailia, O.; Kelaiaia, M.S.; Labar, H.; Necaibia, S.; Merad, F. Energy hybridization photovolta-ic/diesel generator/pump storage hydroelectric management based on online optimal fuel consumption per kWh. Sustain. Cities Soc. 2019, 44, 1–15. [Google Scholar] [CrossRef]
  34. Slootweg, J.G.; de Haan, S.W.H.; Polinder, H.; Kling, W.L. General model for representing variable speed wind turbines in power system dynamics simulations. IEEE Trans. Power Syst. 2003, 18, 144–151. [Google Scholar] [CrossRef]
  35. Verde, A.; Lastres, O.; Hernández, G.; Ibañez, G.; Verea, L.; Sebastian, P.J. A new method for characterization of small capacity wind turbines with permanent magnet synchronous generator: An experimental study. Heliyon 2018, 4, e00732. [Google Scholar] [CrossRef]
  36. Wang, C.-N.; Lin, W.-C.; Le, X.-K. Modelling of a PMSG Wind Turbine with Autonomous Control. Math. Probl. Eng. 2014, 2014, 856173. [Google Scholar] [CrossRef]
  37. Jayalakshmi, N.S.; Gaonkar, D.N. Operation of grid integrated wind/PV hybrid system with grid perturbations. Int. J. Renew. Energy Res. 2015, 5, 1106–1111. [Google Scholar]
  38. Omran, A.; Lucchesi, A.; Smith, D.; Alaswad, A.; Amiri, A.; Wilberforce, T.; Sodré, J.R.; Olabi, A. Mathematical model of a proton-exchange membrane (PEM) fuel cell. Int. J. Thermofluids 2021, 11, 100110. [Google Scholar] [CrossRef]
  39. Hailu Kebede, M.; Bekele Beyene, G. Feasibility study of PV-wind-fuel cell hybrid power system for electrification of a rural village in Ethiopia. J. Electr. Comput. Eng. 2018, 2018, 4015354. [Google Scholar] [CrossRef]
  40. Rahman, M.M.; Barua, S.; Zohora, S.T.; Hasan, K.; Aziz, T. Voltage sensitivity based site selection for PHEV charging station in commercial distribution system. In Proceedings of the 2013 IEEE PES Asia-Pacific Power and Energy Engineering Conference (APPEEC), Hong Kong, China, 8–11 December 2013; pp. 1–6. [Google Scholar] [CrossRef]
  41. Rao, R.V.; Savsani, V.J.; Vakharia, D.P. Teaching–learning-based optimization: A novel method for constrained mechanical design optimization problems. Comput. Aided Des. 2011, 43, 303–315. [Google Scholar] [CrossRef]
  42. Rao, R. Review of applications of TLBO algorithm and a tutorial for beginners to solve the unconstrained and constrained optimization problems. Decis. Sci. Lett. 2016, 5, 1–30. [Google Scholar]
  43. Tahmasebi, M.; Pasupuleti, J.; Mohamadian, F.; Shakeri, M.; Guerrero, J.; Khan, M.B.; Nazir, M.; Safari, A.; Bazmohammadi, N. Optimal Operation of Stand-Alone Microgrid Considering Emission Issues and Demand Response Program Using Whale Optimization Algorithm. Sustainability 2021, 13, 7710. [Google Scholar] [CrossRef]
  44. Feeders, D.T. IEEE PES Distribution System Analysis Subcommittee. 2011. Available online: http://sites.ieee.org/pes-testfeeders (accessed on 22 August 2022).
  45. Jiang, Z.; Zou, F.; Chen, D.; Kang, J. An improved teaching–learning-based optimization for multilevel thresholding image segmentation. Arab. J. Sci. Eng. 2021, 46, 8371–8396. [Google Scholar] [CrossRef]
  46. Zou, F.; Chen, D.; Wang, J. An Improved Teaching-Learning-Based Optimization with the Social Character of PSO for Global Optimization. Comput. Intell. Neurosci. 2016, 2016, 18. [Google Scholar] [CrossRef] [PubMed] [Green Version]
  47. The Annual Variability of Wind Speed. Available online: https://www.wind-energy-the-facts.org/the-annual-variability-of-wind-speed.html (accessed on 22 August 2022).
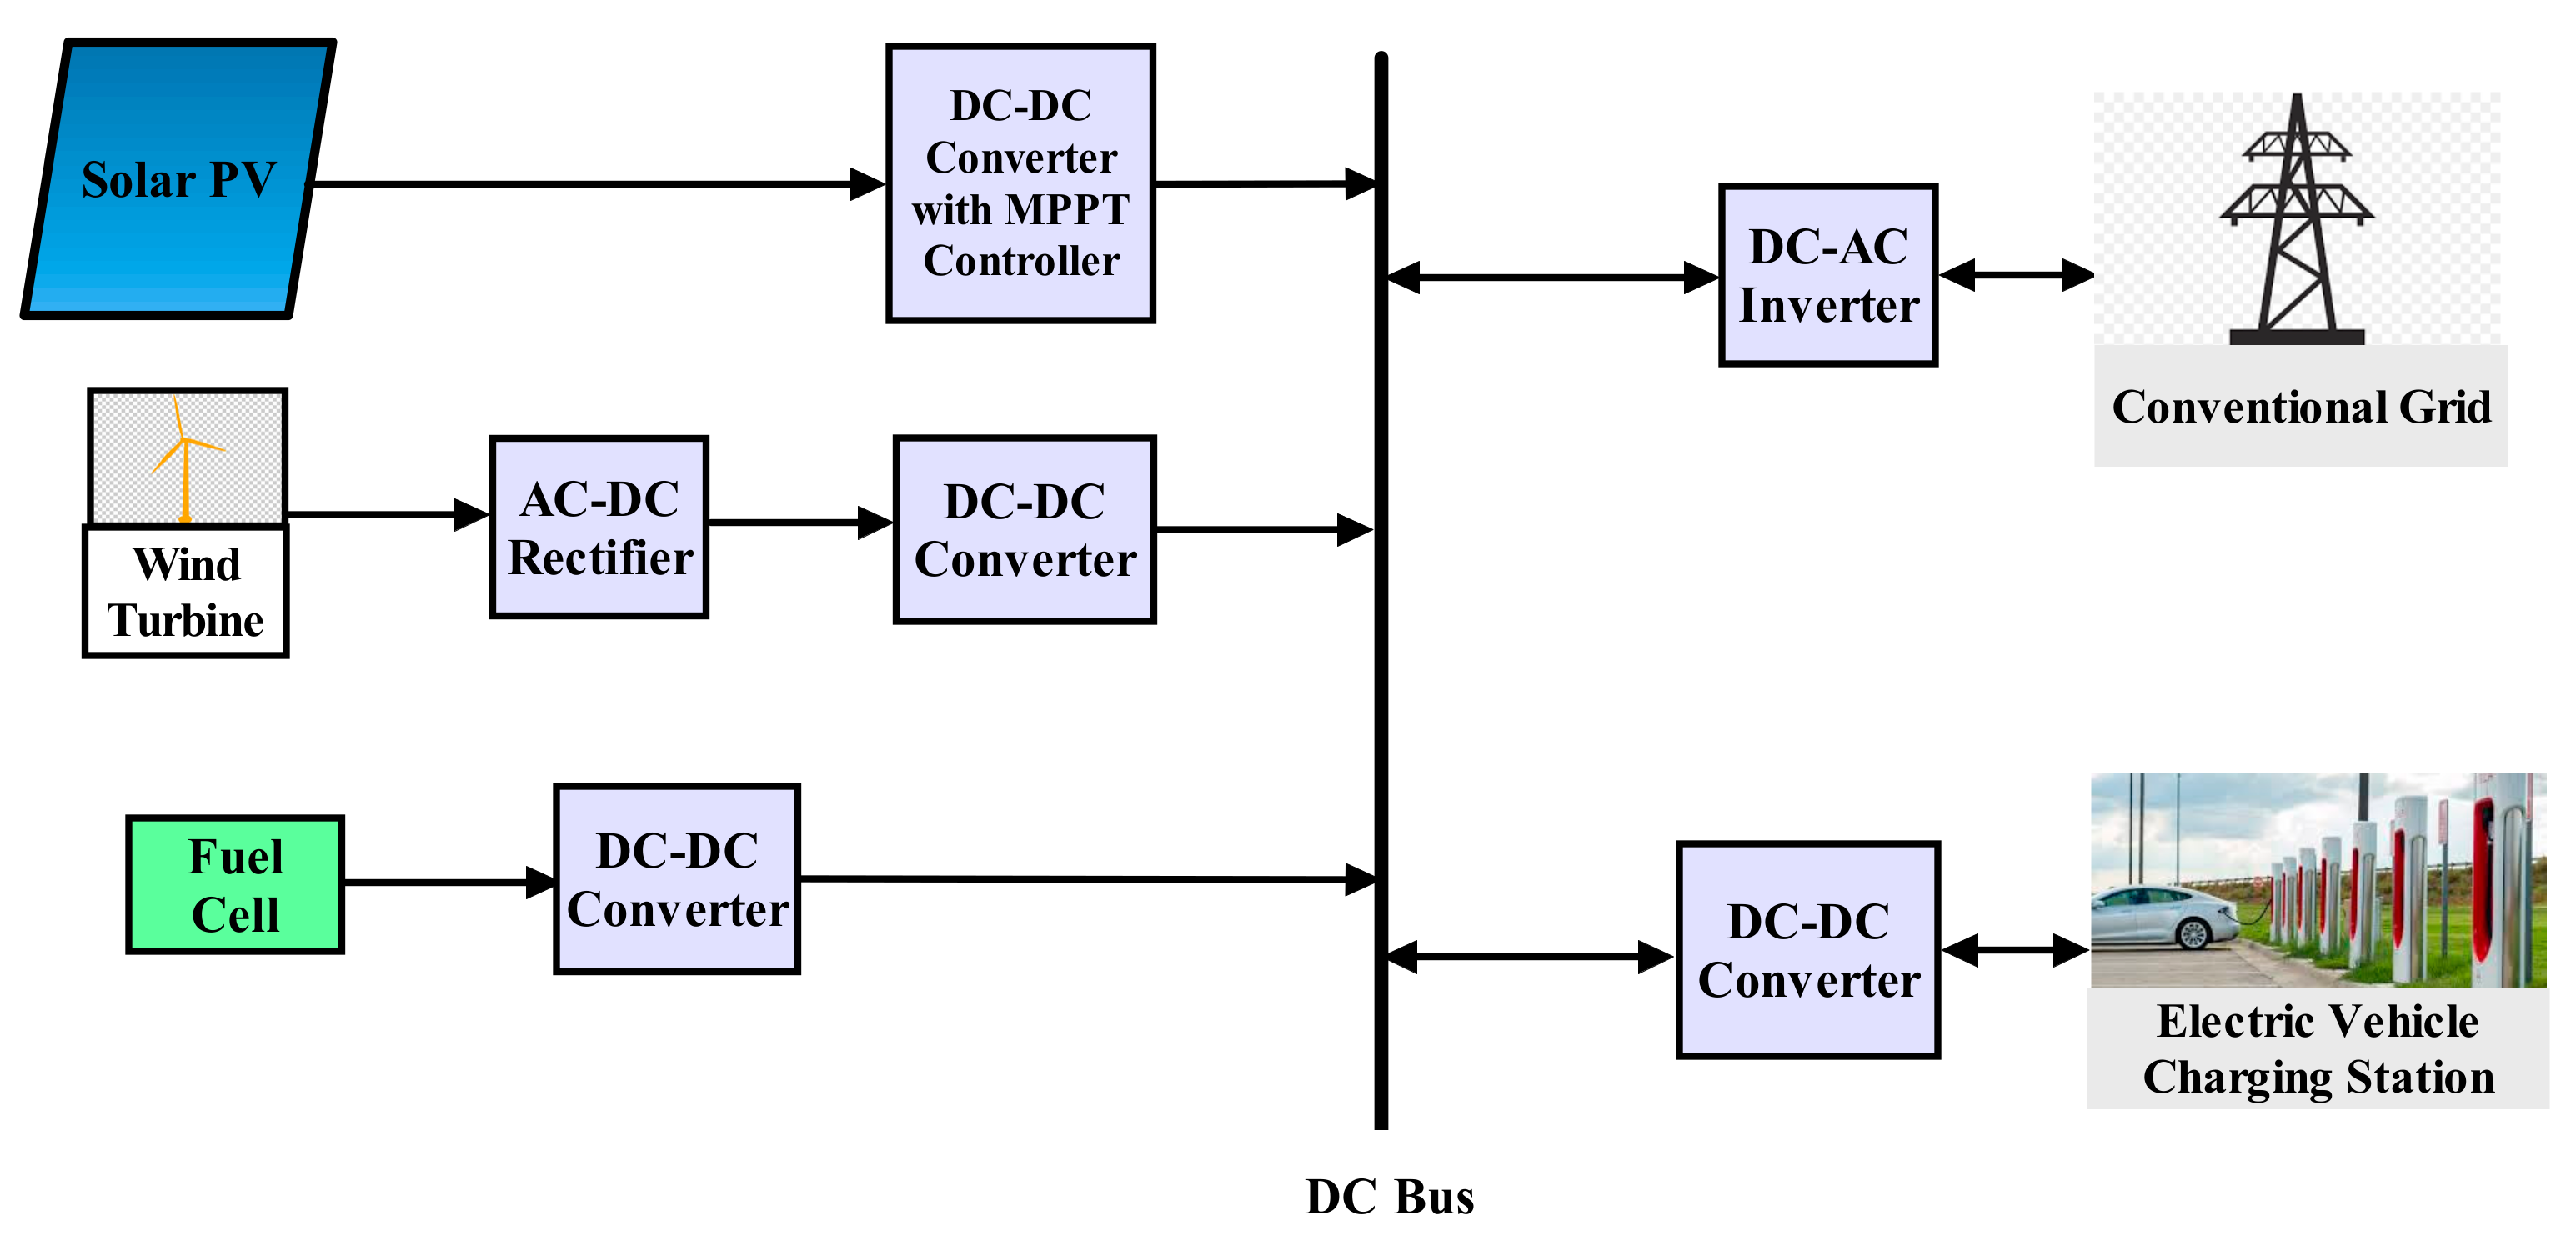
Figure 1. Structure of DC MG integrated with EVCS.
Energies 16 01781 g001
Figure 2. Proposed operation strategy.
Energies 16 01781 g002
Figure 3. Flowchart of modified TLBO.
Energies 16 01781 g003
Figure 4. Framework of modified IEEE 33-bus test system.
Energies 16 01781 g004
Figure 5. VRP index of modified IEEE 33-bus system considering both FCSs and SCSs.
Energies 16 01781 g005
Figure 6. VSI of modified IEEE 33-bus system.
Energies 16 01781 g006
Figure 7. Voltage profile of modified IEEE 33-bus system.
Energies 16 01781 g007
Figure 8. Reliability of modified IEEE 33-bus system.
Energies 16 01781 g008
Figure 9. Power loss of the modified IEEE 33-bus system.
Energies 16 01781 g009
Figure 10. VRP index of the modified IEEE 33-bus system.
Energies 16 01781 g010
Figure 11. VRP index reduction in the modified IEEE 33-bus system.
Energies 16 01781 g011
Figure 12. Power variation in 24 h.
Energies 16 01781 g012
Figure 13. Voltage profile of 33-bus system for 24 h.
Energies 16 01781 g013
Figure 14. VSI of the IEEE 123-bus system.
Energies 16 01781 g014
Figure 15. Voltage profile of IEEE 123 bus system.
Energies 16 01781 g015
Figure 16. Power loss of the modified IEEE 123-bus system.
Energies 16 01781 g016
Figure 17. VRP index of the IEEE 123-bus system.
Energies 16 01781 g017
Figure 18. VRP index reduction in the IEEE 123-bus system.
Energies 16 01781 g018
Figure 19. Convergence characteristics comparison of the proposed case on selected test systems.
Energies 16 01781 g019
Figure 20. Optimal pareto solution for 33-bus system.
Energies 16 01781 g020
Figure 21. Optimal pareto solution for 123-bus system.
Energies 16 01781 g021
Table 1. Comparison of literature review.
Reference NumberTechnique AppliedRemarks
[3]CSO-TLBOConsidering voltage stability, reliability, power loss, the availability of charging stations, and the waiting time within the charging station as functional constraints, EVCS is positioned optimally.
[4]GA-PSOOptimal placing and sizing of RESs and EVCSs are performed on IEEE 33 test system to decrease power losses, voltage variations, and EV storage price.
[5]GWO-PSOThe placement of EVCSs and DGs on IEEE 33- and 69-bus systems is performed to verify the reliability of the distribution network.
[7]GAThe placement of EVCSs has been implemented on IEEE 33-bus system to optimize the VRP index of the distribution system.
[8]GA-PSOThe installation of EVCSs in the Allahabad distribution unit is performed considering protective device upgrade cost.
[13]Monte Carlo Simulations (MCS)Charging station (CS) sizing is performed with smart charging competencies during operation to lessen the investment cost of charging station operators.
[14]CSO-TLBOThe CS placement problem is solved by considering the VRP index, cost, waiting time, and accessibility index as objective functions. Two-stage planning exemplar is authenticated on IEEE 33-bus system and practical network in Tianjin, China.
[15]Harris Hawk Optimization (HHO)The CS and solar-based DG placement is performed on 33-bus systems to reduce losses with energy and improvement of the voltage profile.
[18]GWOThe effect of EV placement on the 69-bus test system has been analyzed to enhance the voltage profile and minimize power losses.
[19]Scenario based operationTechno-economic sizing of a DC MG is performed, and EV commitment is developed.
Present paperModified TLBOOptimal placement and sizing of EVCSs and RESs are performed simultaneously to optimize the cost and VRP index on IEEE 33- and 123-bus test units in a DC MG environment.
Table 2. History of the present topic.
AuthorApproachObjective Function
Hu et al. (2013)Single-objectiveCost is optimized focusing solely on the distribution unit.
Zheng et al. (2014)Single-objectiveCost is optimized focusing solely on the distribution unit.
Pazouki et al. (2015)Multi-objectiveCost, power loss, and voltage profile are optimized on distribution unit.
Marcelo et al. (2015)Multi-objectiveActive power loss optimization considering distribution network.
Pan et al. (2016)Multi-objectiveCost and momentary power supply index are optimized on distribution network.
Aljanad et al. (2018)Multi-objectiveVoltage deviation and power loss considering distribution network.
Zhang et al. (2018)Multi-objectiveCharging station construction cost, discontented charging demand penalty, and cost of energy considering both distribution and transportation network.
Rahmani Andebili et al. (2018)Multi-objectiveCost, power loss, and unmet energy expectations considering both distribution and transportation network.
S. Deb et al. (2019)Multi-objectiveCost, accessibility index, VRP index, and wait time considering both distribution and transportation network.
Sachan, Sulabh et al. (2021)Multi-objectiveCost and VRP index with coordinated and uncoordinated charging considering both distribution and transportation network.
Table 3. Comparison of modified TLBO algorithm with other optimization methods.
Reference No.Type of Optimization
Algorithm
Feature of Optimization
Algorithm
[4]CSO—TLBOBio-inspired algorithm.
[5]HGWOPSOHas better optimization performance.
[9]GA PSOProvides better solution with faster convergence.
[16]BLSAPerforms in terms of search precision and convergence in multidimensional search space.
Present workModified TLBOControls parameters specific to the algorithm are not required.
Table 4. Parameters of solar PV module.
ParameterValueParameterValue
Power 305 W Converter efficiency 90%
Length 1559 mm Apv1.63 m 2
Width 1046 mm Npv150
Lifespan 25 years η pv18.7%
Table 5. Specifications of WEC system.
ParameterValueParameterValue
Air density1.225 kg/ m 2 Wind turbine nominal capacity20 kW
Blade radius3.7 mCut-in speed3.5 m/s
Number of blades3Cut-out speed18 m/s
Cpmax
ηcon
0.47
90%
Nominal speed17.5 m/s
Table 6. The Number of Variables to be Augmented in the Different Schemes of Operation.
Scheme Fj fj Sj sj
1 1,1,1 1,1,1 1,2,1 6,6,6
2 2,2,2 2,2,2 2,2,2 10,10,10
3 2,1,2 2,1,2 2,2,2 8,8,8
4 2,1,2 2,1,2 2,2,2 10,10,10
5 1,1,1 1,1,1 2,2,2 7,9,16
6 1,1,1 1,1,1 2,1,2 10,7,10
Table 7. Objective function cost value comparison for the different planning schemes.
SchemeWith FCS and SCS by Modified TLBO
(USD × 106)
Only FCS by
Modified TLBO
(USD × 106)
With FCS and SCS by CSO-TLBO
(USD × 106) [3]
1 3.14942.02503.0206
2 8.69947.57508.8900
3 7.19946.13507.1120
4 7.94946.82507.9977
5 5.09943.97505.0883
6 5.90944.78505.9284
Table 8. Optimal location of CSs based on VRP index for 33-bus system.
BusNumber of FCSNumber of SCS
2 21
19 23
20 12
Table 9. Optimal sizing of CSs based on VRP index for 33-bus system.
SchemeSize (kW)
(Fast + Slow Charging Station)
Size (kW)
Only FCS by
Modified TLBO
1297.6240
2793.87400.92
3522.61390.58
4508.14378.53
5297.60240
6297.60240
Table 10. Objective function value for 24 h variation of power.
Sl.VRP Index
with EVCS
VRP Index
with EVCS + RES
1 7.85629.7154
Table 11. Optimal location of CSs based on VRP index on IEEE 123 test system.
BusNumber of FCSNumber of SCS
16 21
43 22
107 12
Table 12. Optimal placement and sizing of RESs.
SchemeOptimal Sizing (kW) on 33-Bus SystemOptimal Location on 33-Bus SystemOptimal Sizing (kW) on 123-Bus SystemOptimal Location
on 123-Bus
System
PV 10802119060
Wind 7501890072
Fuel cell 25030510102
Table 13. Values obtained from objective functions for six innovative schemes for the proposed case (EVCSs with RESs).
SchemeCost
(USD × 106)
VRP Index for the Proposed Case on
123-Bus System
by Modified TLBO
VRP Index for the
Proposed Case on
33-Bus System by Modified TLBO
VRP Index with
only EVCS on
19-Bus System by
CSO-TLBO [3]
1 2.025017.359.701511.3011
2 7.575017.49.720011.7391
3 6.135017.49.720011.7018
4 6.825017.49.720011.8097
5 3.975017.359.699510.9291
6 4.785017.349.698511.3119
Disclaimer/Publisher’s Note: The statements, opinions and data contained in all publications are solely those of the individual author(s) and contributor(s) and not of MDPI and/or the editor(s). MDPI and/or the editor(s) disclaim responsibility for any injury to people or property resulting from any ideas, methods, instructions or products referred to in the content.