1. Introduction
As an important strategic material, crude oil is closely related to a country’s economic development and social stability. Due to the high separation of crude oil supply and demand markets, international trade on a global scale has become an important means of balancing crude oil supply and demand across various countries. Crude oil has become one of the most popular products, and its frequent transnational trade flows have promoted the formation of a global crude oil trade system [
1]. With the accelerated development process in the world, the global crude oil market is also expanding and changing [
2]. First, the growing demand for crude oil from East Asian countries and the declining supply of crude oil from producing countries have created an obvious contradiction between supply and demand. Second, the volatile international environment has further exacerbated the world crude oil supply and demand system’s stability, threatening the energy security issue. Third, global events have profoundly impacted the crude oil market and increased uncertainty in the crude oil trade [
3,
4,
5]. Therefore, parsing and uncovering the internal composition and dynamics of the crude oil trade market is an important and interesting research topic. It is important to promote the adjustment of national crude oil trade policies, optimize resource structure, ensure the security of crude oil supply and support the sustainable development of global energy.
The major oil-producing nations in the Middle East and Western industrialized nations have long held undisputed dominance in the world’s crude oil trade [
6]. In 2000, OPEC adopted the “price band” policy to regulate the supply of crude oil effectively, and the global crude oil market entered a four-year stabilization period [
7]. After the US subprime mortgage crisis and the European debt crisis, international crude oil prices peaked in 2012 [
8]. In recent years, the share of trade volume of Southeast Asian countries in the international crude oil market has increased significantly, and the global crude oil trade has shown an evolutionary trend of the eastward shift of the center of gravity. Since 2020, the world crude oil market has entered a period of adjustment due to factors such as the COVID-19 pandemic and international environmental turmoil. A series of policy changes, such as OPEC’s production cut agreement, the US shale gas revolution and European energy restructuring, as well as the rapid development of emerging economies in East Asia, have led to an unprecedented dynamic trend in the crude oil market [
9,
10,
11]. Energy security concerns and the growing influence of large oil companies and international/regional oil organizations on crude oil markets are at the root of the market instability in crude oil. Countries have started actively looking for trading partners to increase their resilience to supply and demand risks in the crude oil market due to problems with the supply of crude oil.
Due to the irreplaceable nature of crude oil in production and life, the international crude oil trade has been studied in academia for a long time. Scholars have found that the evolution of the global crude oil market pattern is influenced by a combination of supply and demand [
12], exploitation technology [
13], geographical distance [
1], international environment [
14], and geopolitics [
15]. With the progress and development in the domain of network science, complex network analysis methods have been widely applied to the field of the international energy trade [
16], and the number of research topics exploring the changes in the international crude oil market and their impacts from the perspective of trade networks has started to increase [
17,
18]. Earlier related studies focused on the macro-level portrayal of crude oil trade networks, using indicators such as centrality, shortest path length and clustering coefficient to analyze the flow patterns of crude oil in trade networks [
16,
17,
19]. Du et al. constructed the directed networks for international crude oil trade, analyzed the topological structure properties of trade networks through indicators such as centrality, and found that crude oil trade networks obeyed a power-law distribution [
20]. Zhang et al. used network analysis methods to analyze the competition among oil-importing countries to reveal the evolution and transmission process of the competitive pattern of oil trade [
21]. Jia et al. employed node degree and average path length to analyze diversification’s integration and evolutionary characteristics and identified two larger groups of stable homogeneous regional oil markets and dominant regional markets in the market evolution process [
19]. Afterwards, some studies dissected the topology and hierarchical characteristics of crude oil trade networks with the help of top networks [
22], community detection [
23], and core–periphery identification [
18]. Yang et al. applied centrality, community detection, and other analytical methods to study the topology of global crude oil flows and found network characteristics that capture both small-world and flat-world properties [
23]. Du et al. integrated the top network and improved the input-output method to directionally weighted world crude oil trade networks and evaluated the relative importance of countries in the international oil trade [
22]. Song et al. used the coreness indicator to dissect the core–periphery structure of major countries and economies in crude oil trade networks and examined the energy risk between a direct oil trade network and an embodied oil transfer network [
24]. In addition, the robustness of crude oil trade networks and their impact on national security have also received attention [
25]. Wei et al. measured the structural resilience of global oil and gas trading networks based on a network resilience analysis framework. They found that stable trade links facilitate resistance to major contingencies. In contrast, the structural resilience of oil and gas resource trade networks tends to decline, although the structure of natural gas trading networks exhibits stronger resilience [
25]. Geospatial visualization has a unique fascination in presenting trade network analysis. Yan et al. used the same colors to identify crude oil trading ports attributed to the same community structure, which were then displayed by geospatial visualization [
26]. Yang et al. also applied geospatial visualization to the presentation of community grouping results, using different color blocks to characterize different community types [
23]. Basically, geovisualization can compensate for the spatial information generally missing from the network topology, and thus better demonstrate the spatial flows of crude oil trade networks.
The global crude oil trade network has become an important academic topic, and a certain number of related studies have been conducted in the literature. However, there are still some shortcomings in the existing studies. The current crude oil trade networks mainly rely on traditional network analysis indicators to explore the topological structures of crude oil trade networks. Still, fewer studies can combine macro, meso, and micro network analysis methods to comprehensively and systematically study the structural connectivity of global crude oil trade networks, resulting in the fragmentation of existing research findings. At the same time, although network analysis methods have been used extensively to analyze the network topology, some of the current studies on crude oil trade networks are still limited to unweighted networks, which fail to take into account the unbalanced nature of international trade flows in the network structure. In addition, the research on crude oil trade networks tends to focus more on topological attributes, and the understanding and application of geographic visualization in modelling the spatiotemporal flow structure of crude oil networks is insufficient, and few investigations have been conducted to investigate the spatiotemporal dynamics of global crude oil trade networks in depth. Therefore, to further disclose the evolutionary patterns of the global crude oil trade, this research systematically investigates the spatiotemporal dynamics of the global crude oil trade network and its topological structure from a long time series scale.
To fill these gaps, we construct global crude oil trade networks, integrate macro, meso, and micro network analysis methods, combine geospatial visualization techniques, and depict the spatiotemporal dynamics and topological evolution of the global crude oil trade network. Furthermore, it aims to deeply explore and analyze the world crude oil competition and cooperation links. Finally, this paper compares and examines existing studies, and the results can provide reference and data support for the future adjustment of crude oil import and export trade policies of countries around the world. The potential contributions of this paper are as follows: (1) This paper integrates macro-, meso-, and micro network analysis methods and comprehensively examines the topological evolution of the global crude oil trade network in terms of nodes, edges, and the whole network; (2) This paper applies geographic visualization techniques to depict the spatial flows and their evolution in the world crude oil trade, which makes up for the lack of attention to the geospatial level in existing studies; (3) This study examines the dynamic changes of the global crude oil trade from a long time-series scale, which helps to gain an in-depth understanding of the latest change trends in the global crude oil trade market.
The remainder of this study is organized as follows.
Section 2 describes the methodology and data procession.
Section 3 presents the results in detail.
Section 4 discusses the findings. Finally,
Section 5 is the conclusion and future directions.
3. Results and Analysis
3.1. Dynamics in the Global Crude Oil Import and Export Trade
As an indispensable energy resource today, crude oil is the “blood” on which modern industrial society depends for survival and development and plays an incomparable role in the economy, people’s livelihoods and national defense. Due to the importance of crude oil and the uneven geographical distribution, the international crude oil market is changing rapidly, forming increasingly complex world crude oil trade networks.
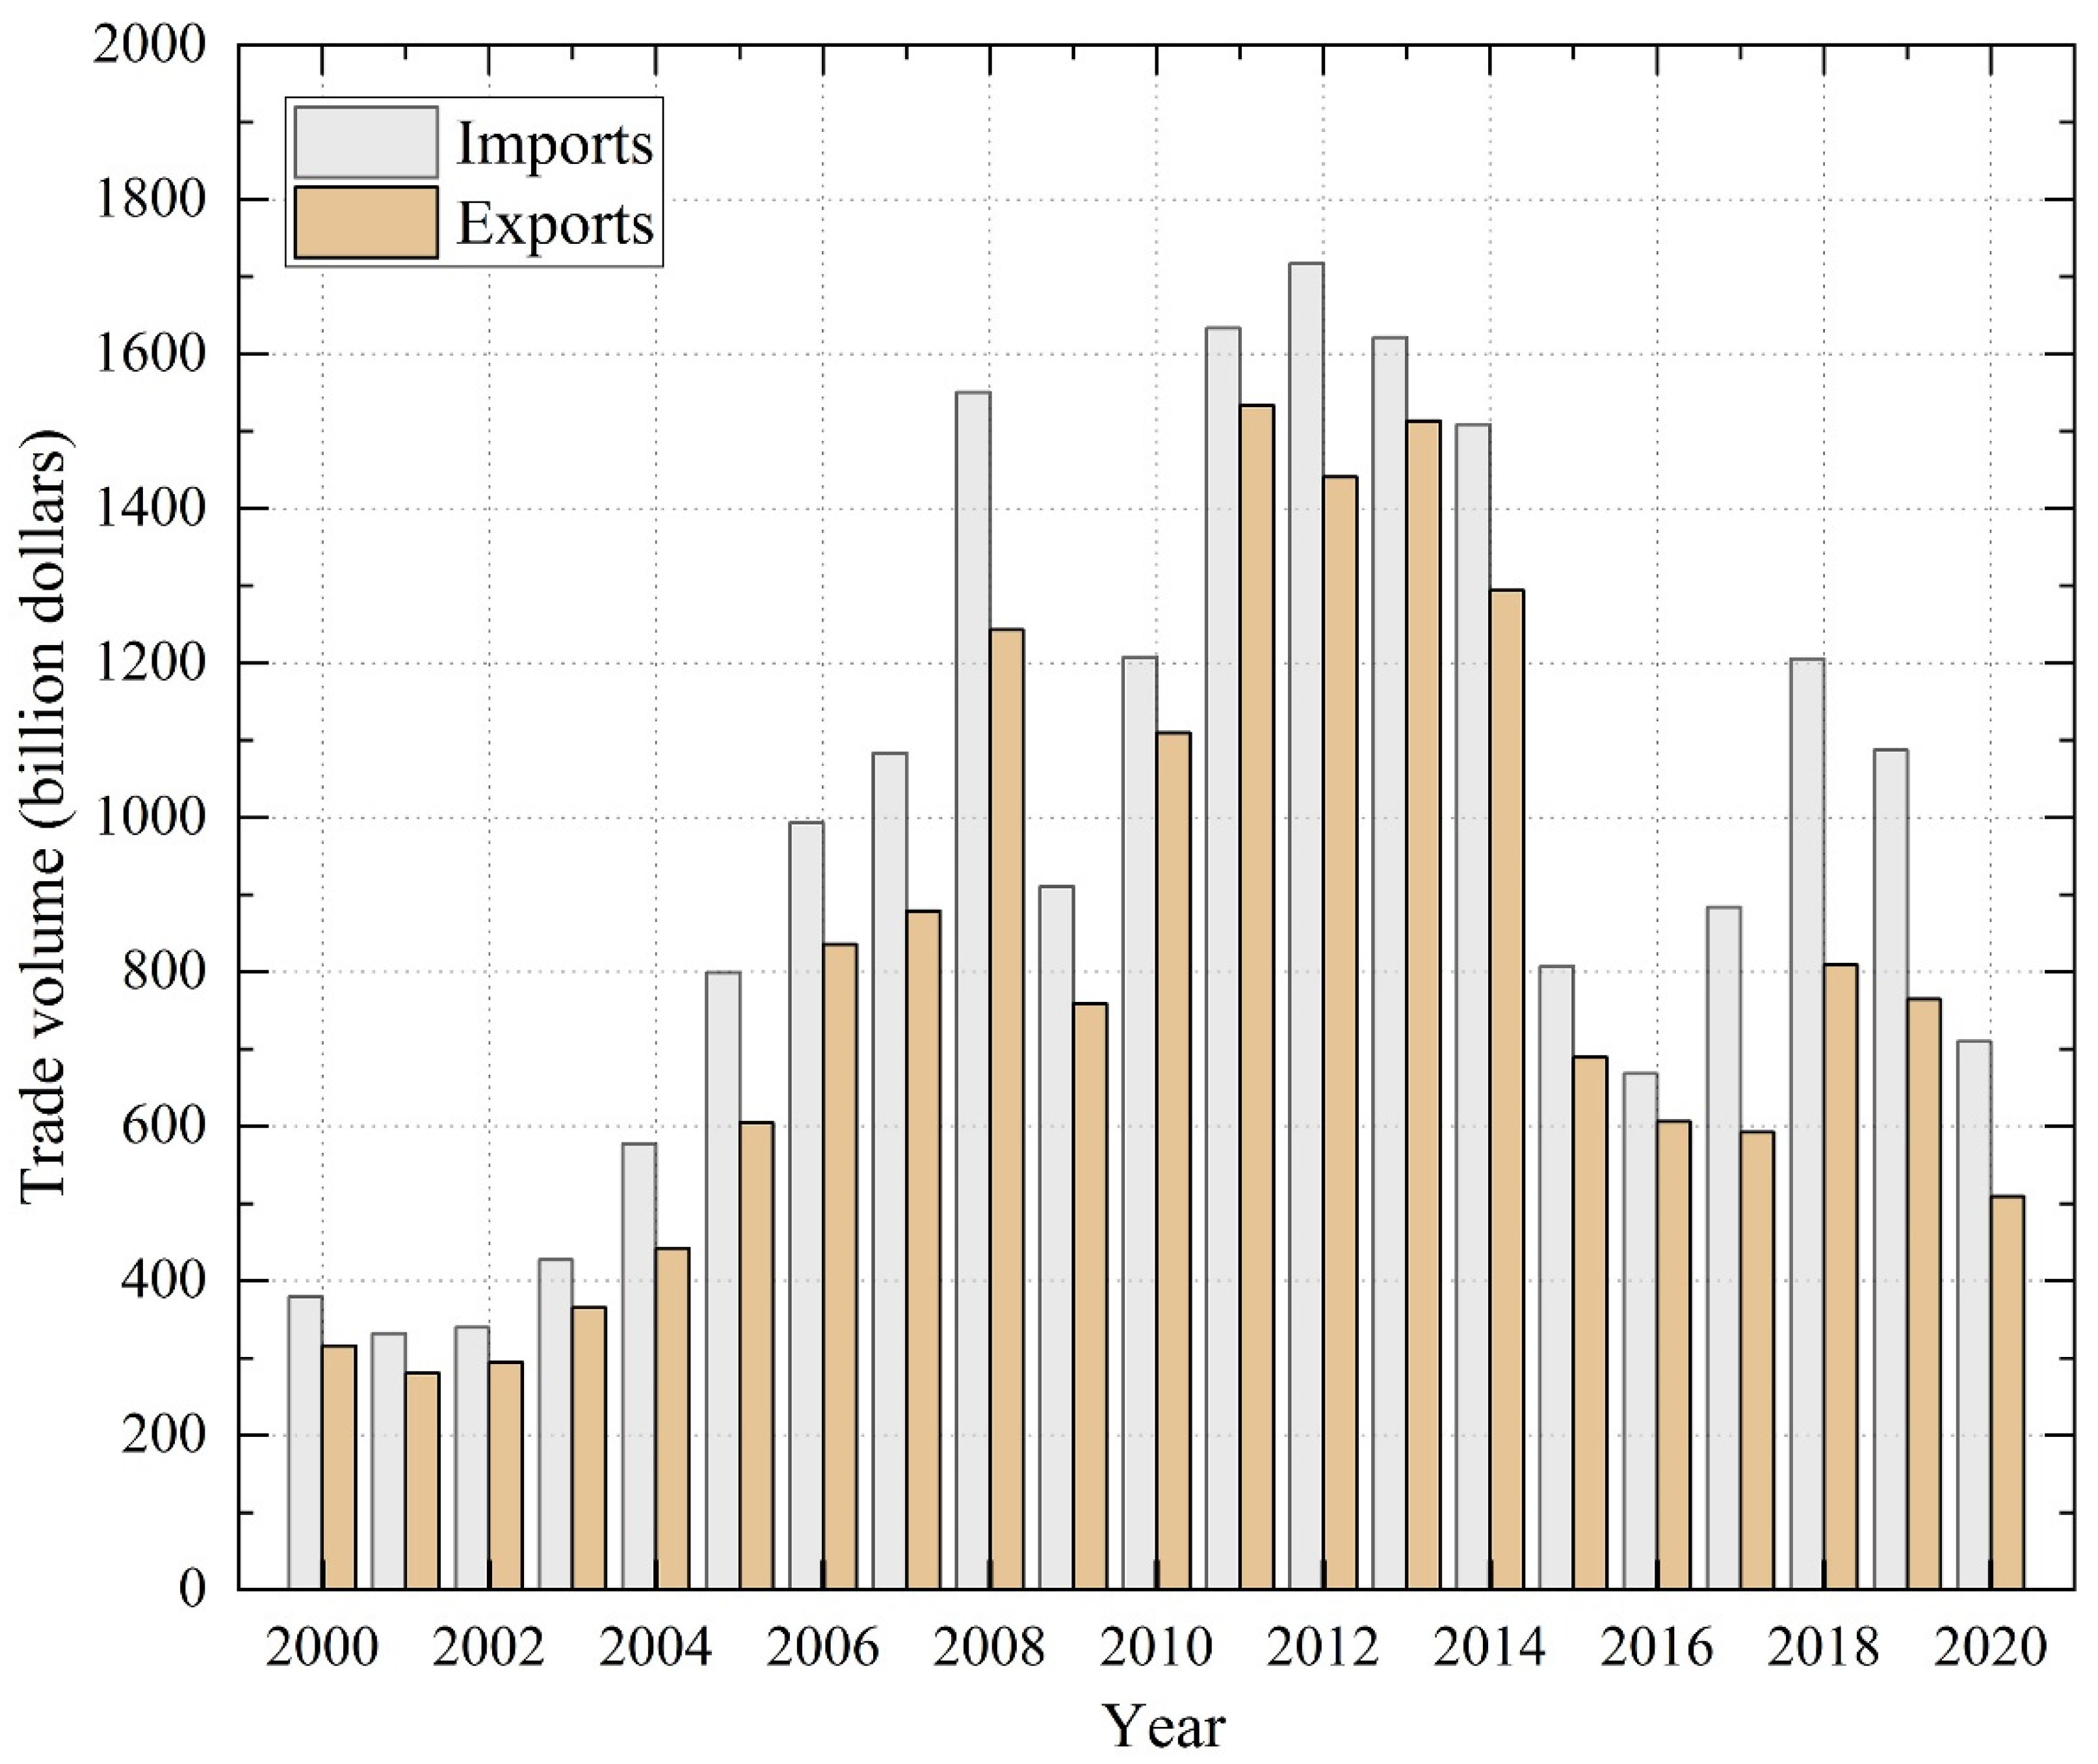
Figure 1 visualizes the change in global crude oil import and export trade volume for 21 years from 2000 to 2020.
The international import and export trade volume of crude oil has shown a developmental trend of fluctuations, and 2012 was the largest scale of the world crude oil trade in the past 20 years. During the past 20 years, the global crude oil import and export trade has experienced three distinct fluctuating changes, which can be divided into three phases, namely 2000–2008, 2009–2016, and 2017–2020. Since the beginning of the 21st century, the world’s demand for crude oil has increased and reached its first peak in 2008. From 2000 to 2003, the size of international crude oil trade was relatively flat, even declining in 2001, which was also the first year since 1993 when the world’s three largest economies (the US, the EU, and Japan) experienced a simultaneous economic downturn that slowed the growth rate of the world economy. The International Energy Agency (IEA) revised its forecast downward for global crude oil demand growth seven times in 2001. Starting in 2004, the global economy recovered rapidly, and international crude oil trade volumes quickly increased, with the peak of this period occurring in 2008. The global economy then slowed down due to the US subprime mortgage crisis and other impacts, and the crude oil market trade volume declined significantly; from 2009 onwards, the world crude oil trade volume kept climbing and reached its peak in 2012. Crude oil trade in 2012 was mainly influenced by three leading factors: the macroeconomic situation, supply and demand structure and geopolitics. From 2011 to 2014, these four years were also the highest global crude oil trade scale period in the past 20 years, exceeding $2.8 trillion. After 2015, as the global economy fell into a new round of downturn, the international crude oil market trading activity was affected, and the trade scale dropped significantly, even only about half of the scale amount of that year in 2012. After 2019, the global crude oil market was affected by the outbreak of COVID-19 and the downturn in the international economic situation with an imbalance between supply and demand, and the trade volume also shows a certain degree of downward trend.
3.2. Evolution of Global Crude Oil Trade Patterns
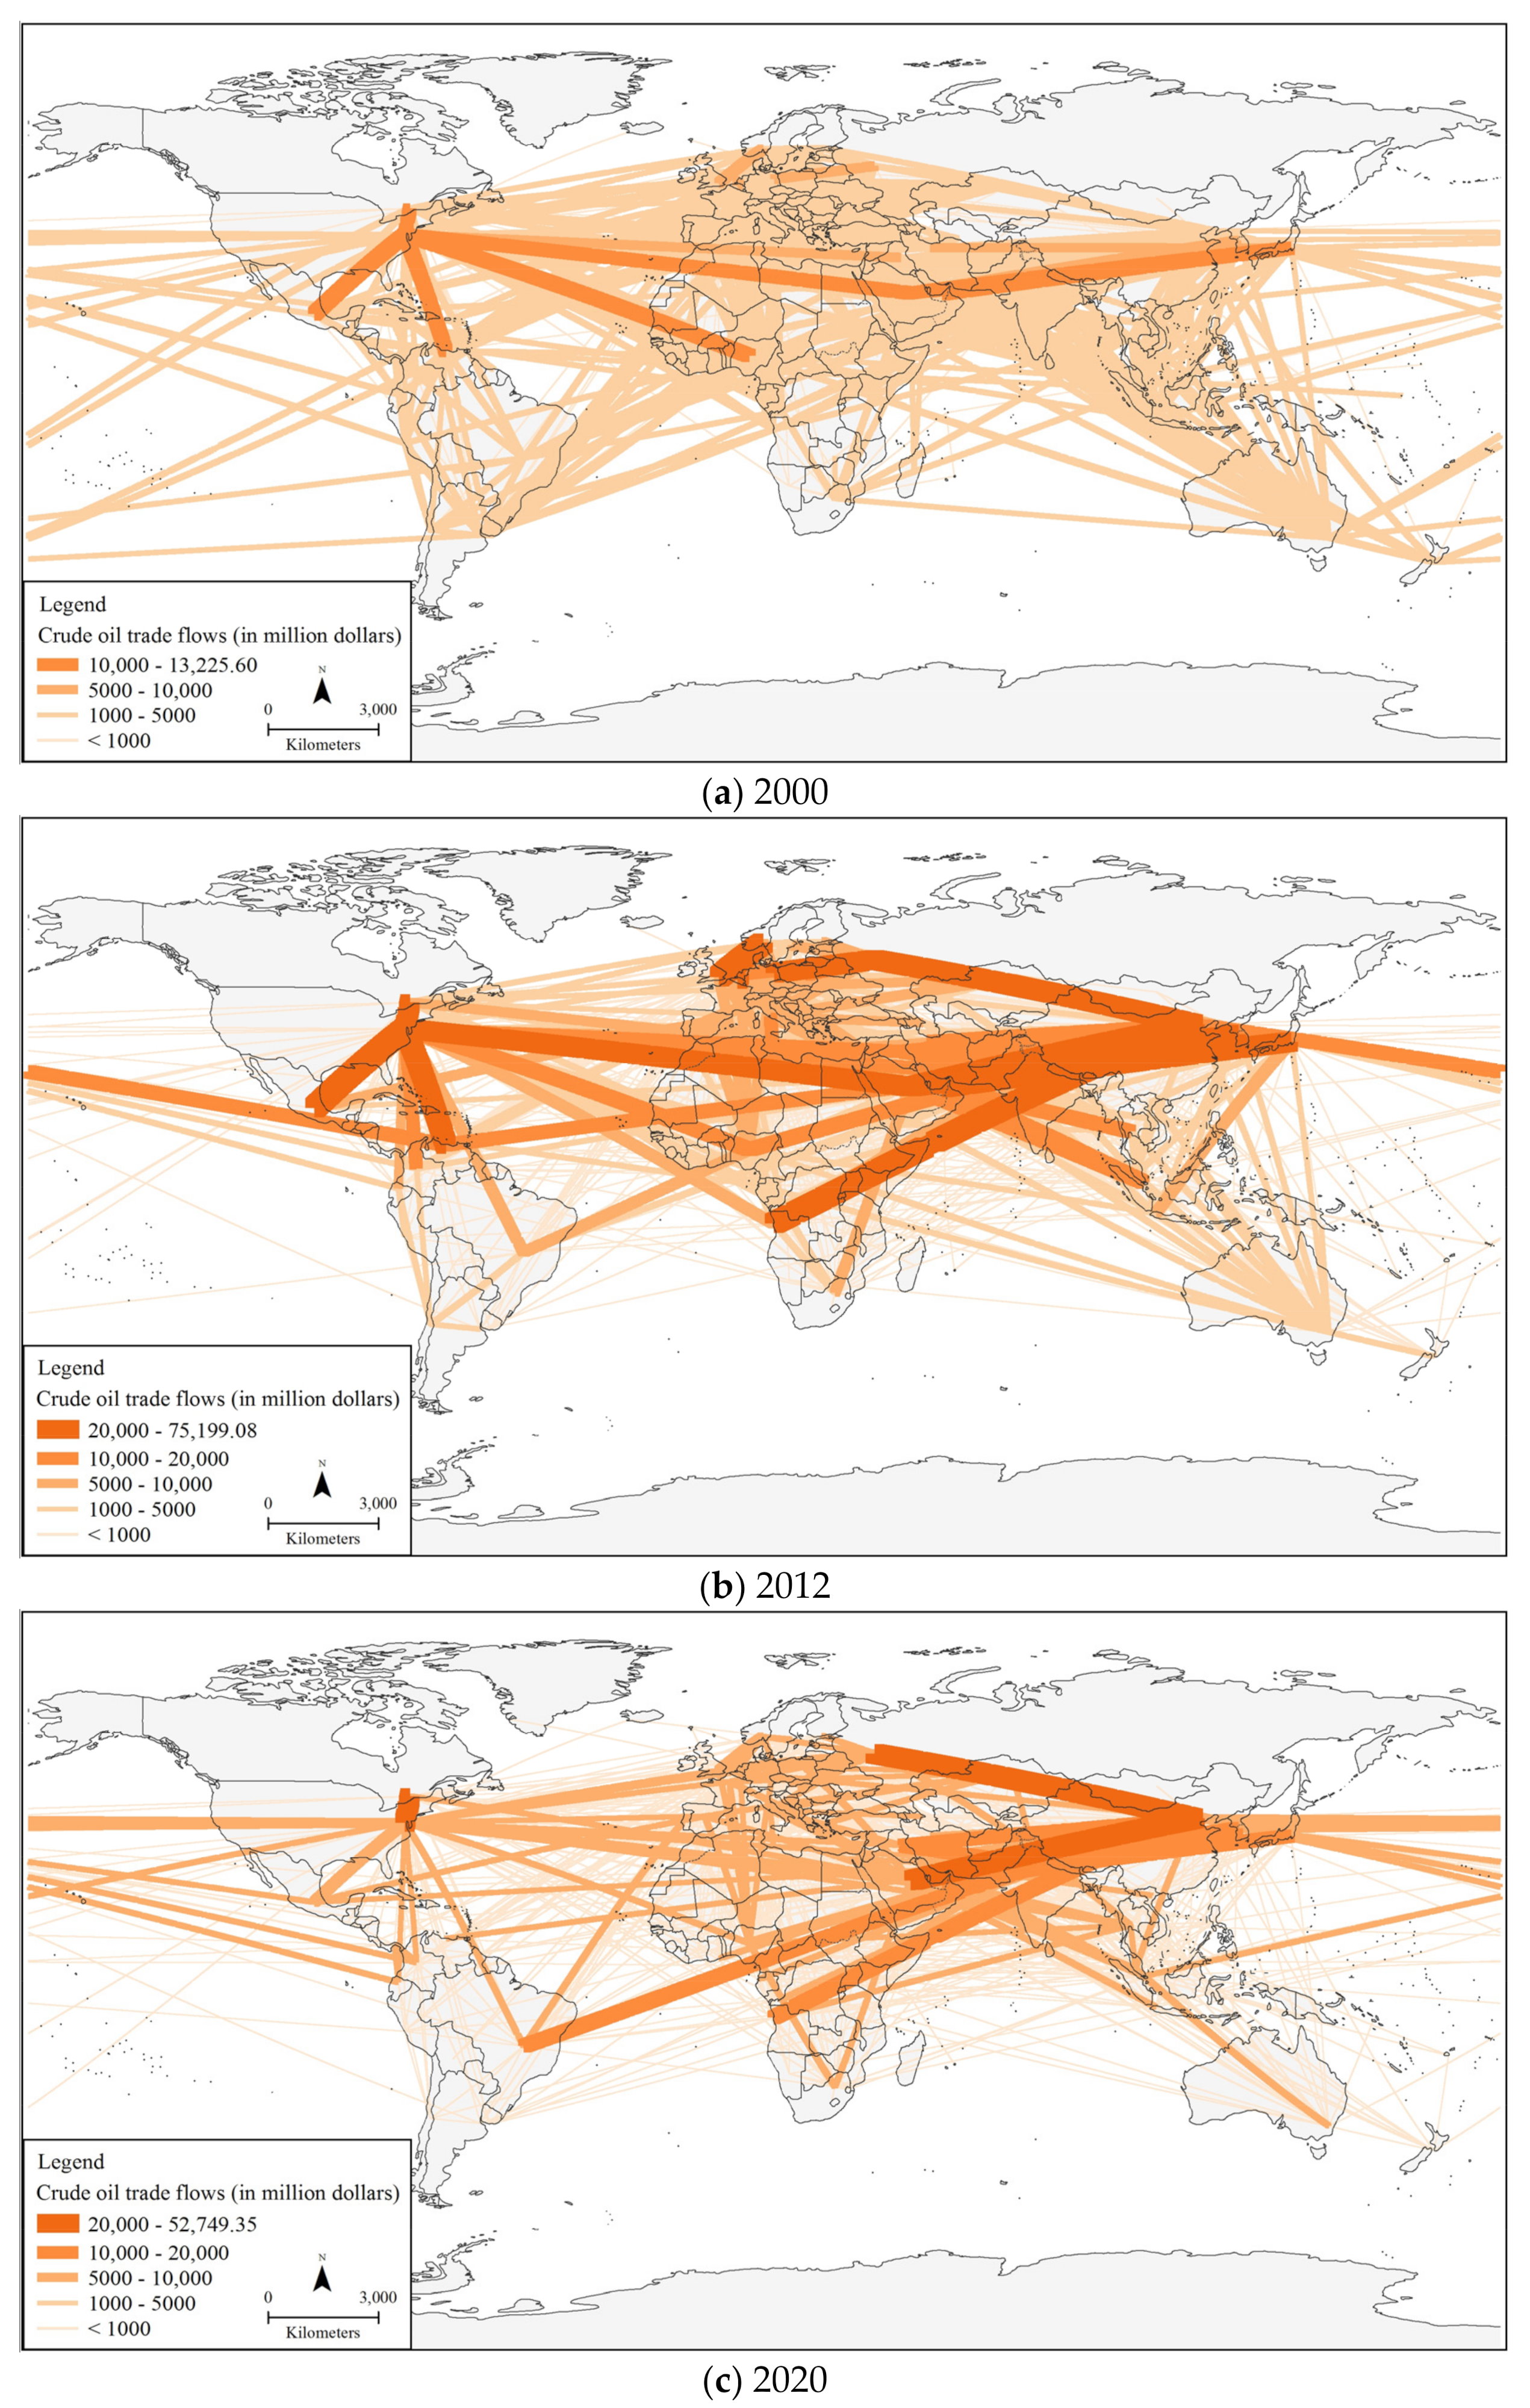
In terms of the temporal variation of the world crude oil import and export trade, 2012 is the largest global crude oil trade year. Therefore, we choose here three nodal years, 2000, 2012, and 2020, as the cross-section of the global crude oil trade networks (
Figure 2) to portray the dynamic evolution process of the global crude oil trade patterns. As a result, the global crude oil trade patterns undergo an obvious stage evolution process, with the trade volume increasing first and then decreasing, forming trade networks with complex structures, clear hierarchy, and unbalanced distribution. In addition, the “rich club” phenomenon in the network is remarkable.
The world crude oil trade shows two phases: the growth period and the adjustment period. From 2000 to 2012, international crude oil trade achieved substantial growth, and after reaching a peak in 2012, it entered an adjustment period and experienced a fluctuating decline in trade scale. During the growth period, the global crude oil trade increased 4.58 times, from $0.36 trillion in 2000 to $1.67 trillion in 2012. Specifically, the graph shows an increase in the number of levels of edges, which has grown from four levels in 2000 to five levels since 2012. In 2000, US–Saudi Arabia was the most vital partner in global crude oil trade ties, with a trading volume of $13.226 billion. Crude oil has always been an important commodity for trade cooperation between the US and Saudi Arabia. The world economy has been in a downturn since the US economic crisis and the European debt crisis. And after 2012, global crude oil trade volumes began and continued to decline at an average annual rate of 10.81%, with trade volumes of only $669.234 billion in 2020, and the crude oil market entered a period of adjustment. Under the combined effects of factors such as an accelerated global energy revolution, adjustment of crude oil supply and demand and geopolitical relationships, crude oil importing countries keep seeking new partners to maintain domestic energy security, and the dynamic development characteristics of the overall patterns of global crude oil trade networks are obvious.
The network density of global crude oil trade is deeply influenced by the supply and demand relationship between import and export powers. The trade linkage shows evident unevenness, the hierarchical structure is becoming more explicit, and the backbone structure is still in dynamic evolution and continuous reconstruction. In 2000, the world crude oil market was still in its infancy, and the crude oil trade volume among countries was relatively small, with only seven groups of node pairs having a trading volume of more than $10 billion. The US, Saudi Arabia, and Japan constituted the core structure of the trade network, accounting for 22.73% of the trade volume, in line with the “rich club” phenomenon. Subsequently, the international crude oil trade peaked in 2012, when 168 countries and 1060 trade pairs participated in the global crude oil import and export trade, deepening the trade network structure’s overall density and enriching the network’s topology at different levels. In parallel with the global economic development, the open and active international market environment promotes the continuous expansion of crude oil trade scale and cooperation diversification, with a total of 14 groups of node pairs led by the US–Canada with trade volume exceeding $20 billion, about twice as many as the number of node pairs exceeding $10 billion in 2000. In 2020, the node pairs with trade volume exceeding $20 billion are concentrated in the US–Canada, Saudi Arabia–China, and Russia–China, with the five countries mentioned above occupying a significant position in the global crude oil trade network. Under the shale gas revolution, the US completely transformed from a crude oil importer to an exporter in 2018, causing a considerable impact on the traditional global crude oil market landscape. As the market with the most substantial demand for crude oil in the Asia Pacific and globally, China has established stable and continuous trade relations with major crude oil exporters in key positions in the trade network, such as Russia and Saudi Arabia, to ensure energy security and industrial development. Against accelerated energy restructuring, European countries such as the UK, the Netherlands, and Germany have begun to seek new energy products actively, and have taken a back seat in the global crude oil trade market. The adjustment of national energy strategies and the dynamically changing international environment is also pushing the global crude oil trade pattern to change while influencing the crude oil trade ties between different countries, with major crude oil import and export countries having more say in the global crude oil trade.
3.3. Macro-Characteristics of Global Crude Oil Trade Networks
The international crude oil trade is becoming more frequent, and more and more countries are involved in the world crude oil trade, and crude oil is the most internationalized marker [
34]. To better portray the changing trends of the macro topological characteristics of the global crude oil trade network, we selected five representative node years as the study cross-section, including 2000, 2008, 2012, 2018 and 2020 (
Table 1). Since 2000, the connectivity patterns of the global crude oil trade network have experienced different fluctuations, and the network size and density have shown a trend of increasing and then decreasing. As a result, the network agglomeration patterns are more obvious, the inter-nodal connections are continuously strengthened, and the network connectivity has improved.
In the global crude oil trade network, the network scale and density have similarities, showing a noticeable trend of increasing first and then decreasing. From 2000 to 2018, the number of connected edges of the trade network gradually increased from 805 to 1063, and the crude oil trade relations became more diversified, while the network density also increased from 0.035 to 0.0462, and the trade network density deepened. Since 2018, the network scale and network density have decreased due to the combined influence of the COVID-19 pandemic and the global economic situation. As a result, the number of connected edges dropped to 990, the network density dropped to 0.043, and the activity of international crude oil trading was in a downward direction.
The global clustering coefficient continued to increase, from 0.2978 in 2000 to 0.3325 in 2020. It indicates that the agglomeration trend of the crude oil trade network is intensifying, and the intrinsic grouping structure is prominent in the network. In terms of the average shortest path length, this coefficient has undergone fluctuating changes, showing an overall trend of increasing and decreasing. From 2000 to 2008, the average shortest path length increased from 61,890.5 to 123,950.7, reaching its highest value in 2008, with a significant increase in path length, more decentralized connections between nodes and the prominence of core nodes in the network. After that, it decreased to 63,877.2 and 15,207.3 in 2012 and 2020, respectively, with the network link paths continuously shortening, the strength of inter-node links increasing, and the network connectivity gradually improving.
3.4. Meso-Characteristics of Global Crude Oil Trade Networks
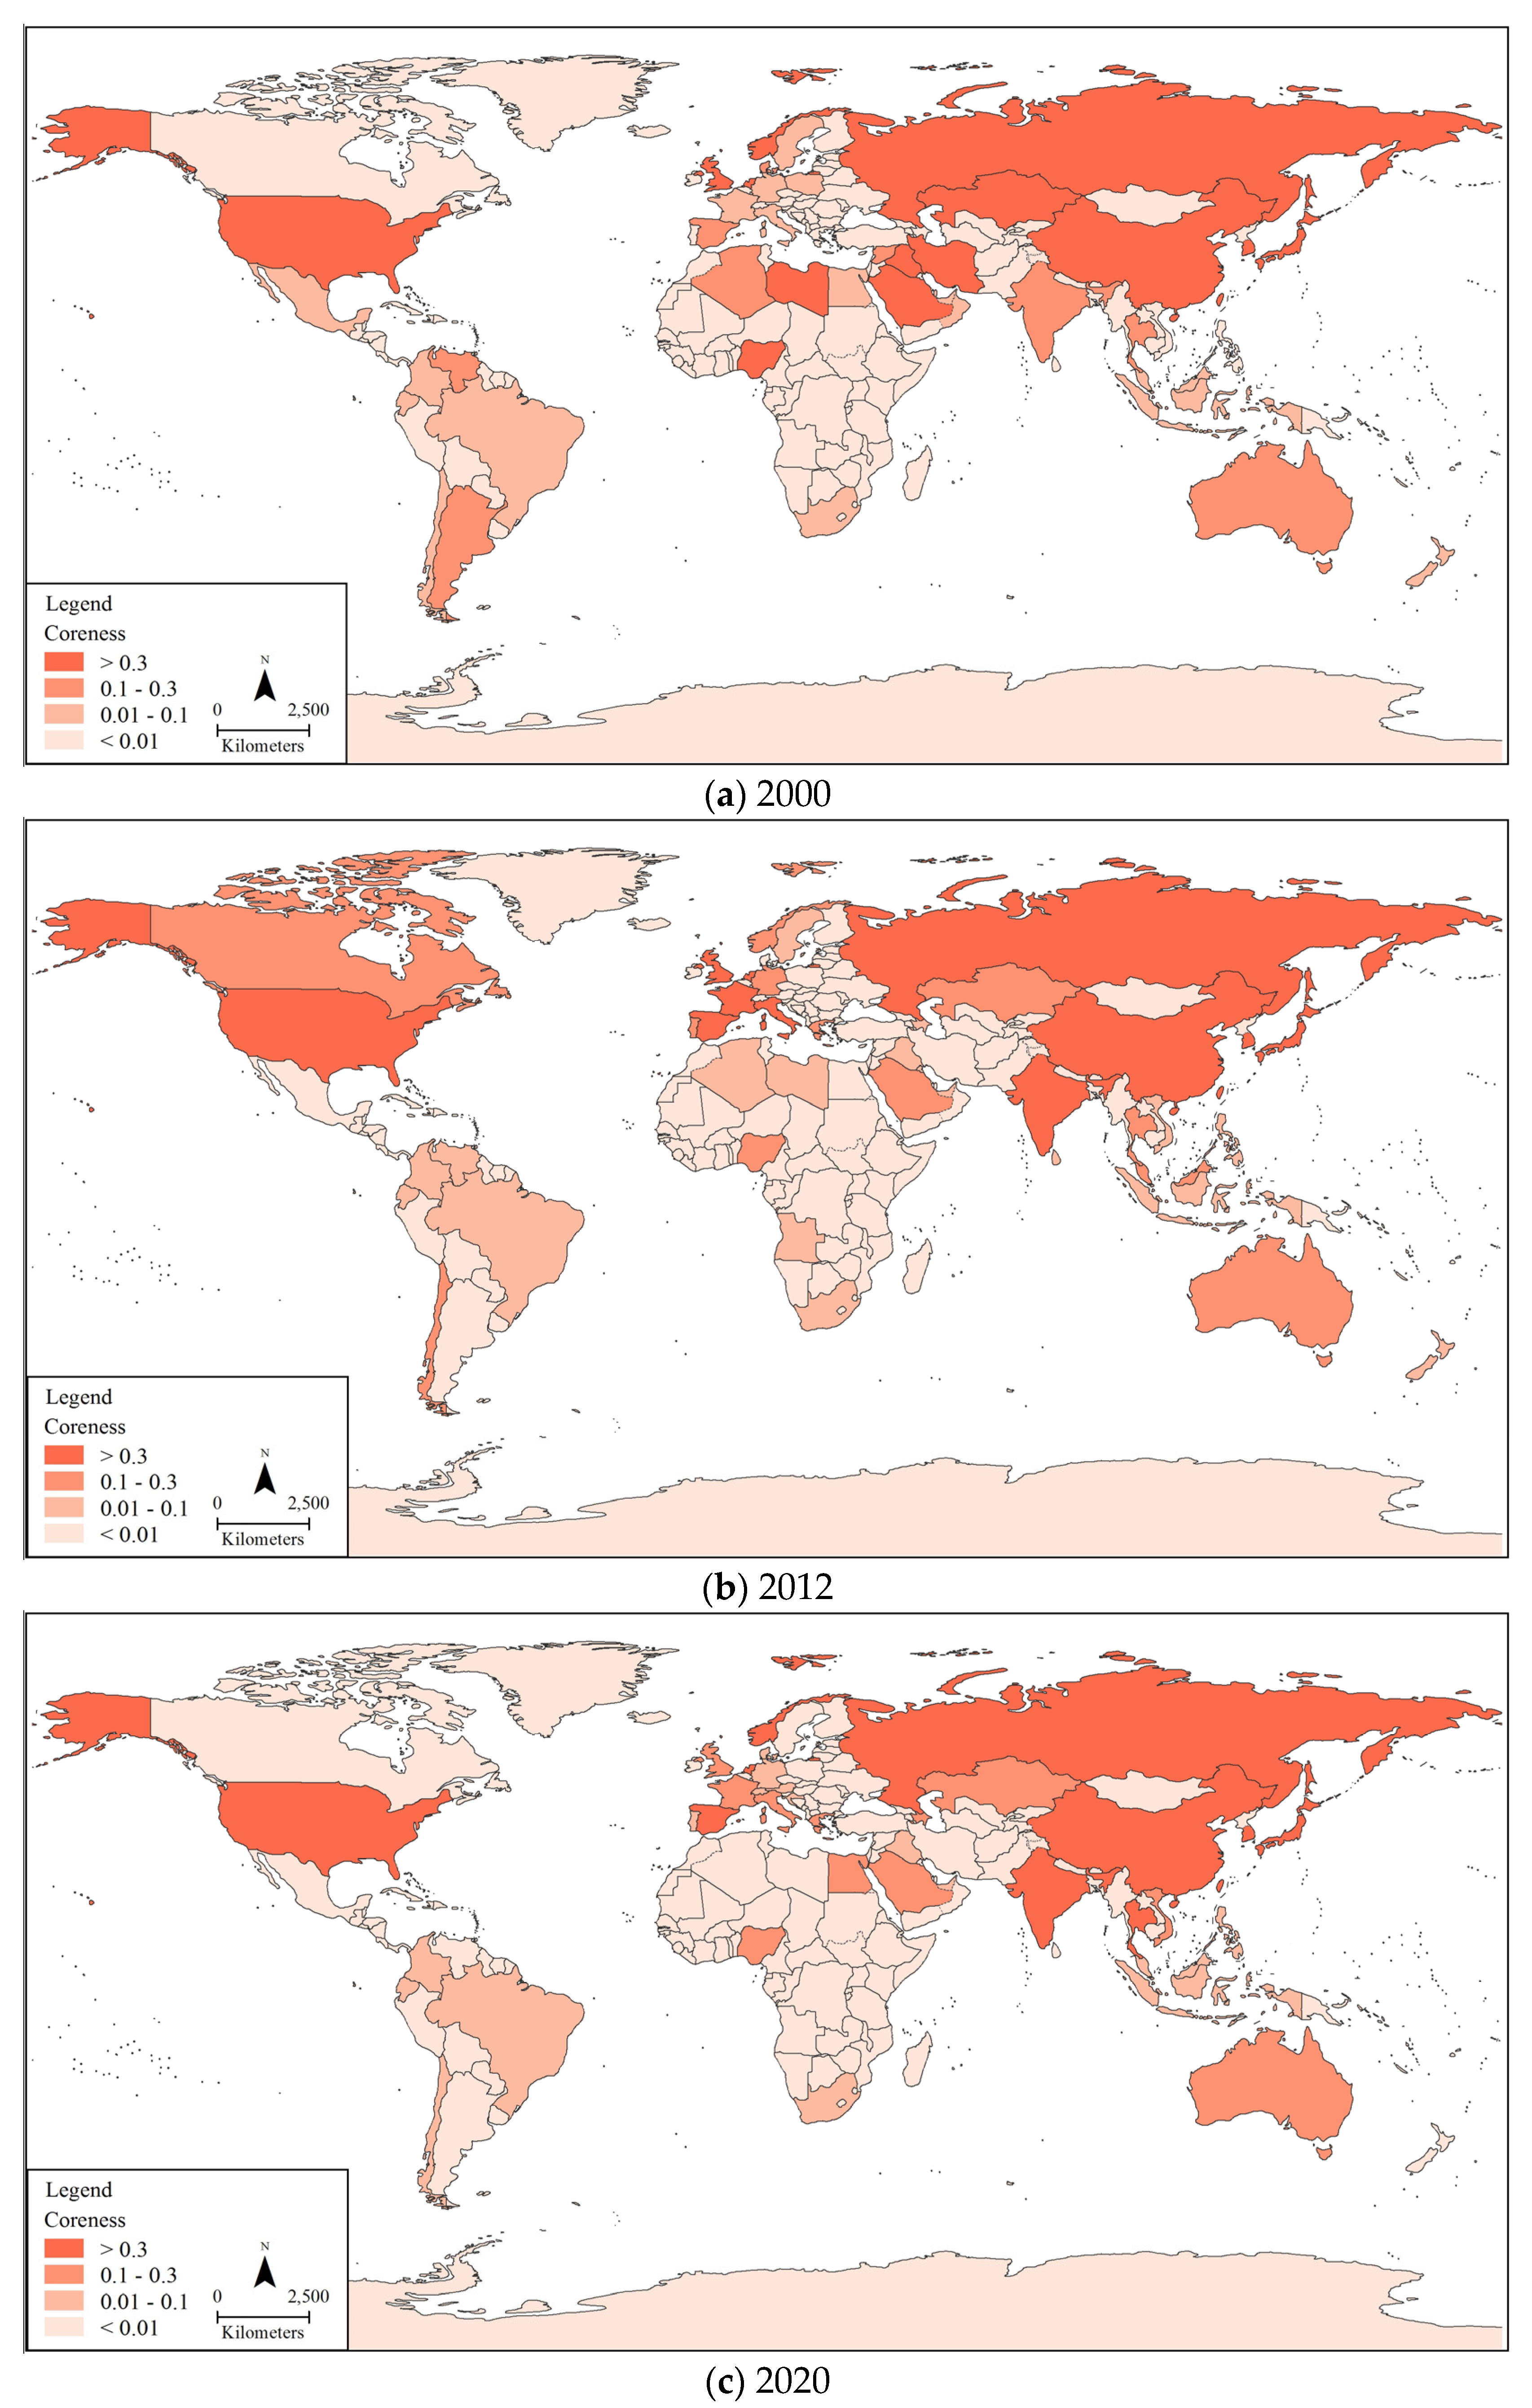
To explore the mesoscale characteristics of the global crude oil trade network, we further quantified the concentration coefficients of the global crude oil trade network and the coreness of individual countries in 2000, 2012, and 2020 by using the core–periphery profile algorithm. The concentration coefficients for the three years are 0.9087, 0.9130, and 0.9259, respectively, which show a yearly increase, indicating that the global crude oil trade networks have obvious core–periphery structures, and their polarization effect is gradually deepened. For the sake of analysis, referring to related studies [
35], we consider nodes with a coreness greater than 0.3 as core countries, nodes greater than 0.1 and less than 0.3 as sub-core countries, sub-peripheral countries as nodes greater than 0.01 and less than 0.1, and countries less than 0.01 as peripheral countries in the network (
Figure 3).
The global crude oil trade networks have distinct core–periphery structures, with the number of core and peripheral countries relatively stable. Still, the composition of its member countries is constantly changing with the evolution of the internal system of the trade network. The core countries are gradually concentrated in a smaller number of countries, and the polarization effect of the trade network is significant, decreasing from 14 in 2000 to 11 in 2020. The number of peripheral countries is relatively stable in the early stage and increases by five in the later stage in 2020, totaling 177 countries, most of which belong to the peripheral countries in the crude oil trade network. The demand for crude oil trade is positively correlated with each country’s economic development, and the US and Russia have long been at the core of the global crude oil trade network, peaking in 2012. In recent years, with the industrialization process and economic development needs of China, India and other Asia–Pacific countries, the center of gravity of global crude oil trade has shifted significantly eastward. The average coreness of Asian countries has increased from 54.34% in 2000 to 60.00%, gradually occupying more seats in the core countries of the trade network. Due to the great difference in economic volume and industrial demand, 180 countries have long belonged to the sub-peripheral/peripheral countries, and the crude oil trade scale has less influence on the crude oil trade system on a global scale.
The US, Russia, China, Japan, South Korea, and the Netherlands are firmly positioned as the core countries in the crude oil trade network, and the major crude oil importers have become the dominant forces in the trade network. As a traditional crude oil importer, the US has been developing markets in the crude oil trade network, and its crude oil exports have increased year by year, surging from 0.61% of total imports and exports in 2000 to 37.09% in 2020. In particular, the US, with its shale gas revolution, has significantly changed its energy consumption and production structure, profoundly influencing and even changing the global crude oil trade pattern. As the largest and only exporter of crude oil among the six core countries mentioned above, Russia’s coreness in the crude oil trade network peaked in 2012 at 0.8077. Since then, the share of Russian crude oil exports to European countries has declined due to geopolitical factors, but the volume of crude oil exports to Asian countries has increased significantly, indicating that Russia’s crude oil trade remains resilient on a global scale. China’s core position in the global crude oil trade network continues to grow as a result of expanding demand for crude oil for economic development, surpassing the US in the first place in 2020. Japan and South Korea are highly dependent on foreign energy due to their resource endowments, and both have adopted crude oil import diversification strategies to ensure domestic energy security. With the port of Rotterdam as a trading hub, the Netherlands has become the gateway country for European crude oil trade with its superior geographical location. As a result, many partners have consolidated the core position of the Netherlands in the global crude oil trade network.
Meanwhile, India, Spain, Greece, Vietnam, and Azerbaijan all achieved growth in their core rankings. India and Spain jumped from sub-core to core in 2012, and their large populations and economies determine India’s continued high crude oil consumption. Among European countries, Spain and Greece have relatively large crude oil imports. Greece and Vietnam have improved their core ranking in the trade network, becoming sub-core countries from marginal countries in 2012 and 2020, respectively. They have significantly increased their position in the global crude oil market. Azerbaijan, located at the junction of Eurasia, is also an important crude oil exporter and has been increasing its participation in the global crude oil trade, becoming a sub-core country in 2020. It is worth noting that countries such as Syria, Iran, Argentina, Algeria, Venezuela, and Libya have fallen from the core/sub-core positions of the network to the periphery, also side-by-side, indicating that although the major exporters export large volumes, their trade objects in the international crude oil market may be relatively single or concentrated, with less diversity of exports, and do not occupy precise core positions in the overall trading system.
3.5. Micro-Characteristics of Global Crude Oil Trade Networks
Nodes are important network components, and their importance is usually quantified using centrality [
36]. To further dissect the significance and the role played by each country in the global crude oil trade network, we measured the centrality values of each country in the network in 2000, 2012, and 2020 using two classical indicators: betweenness centrality and eigenvector centrality.
Table 2 shows the top 20 countries and their corresponding centrality indicators for each year.
As can be seen from
Table 2, the US, Russia, Saudi Arabia, and Canada are always the top-ranked countries in the global crude oil trade network and occupy important positions in the network. The US is perennially at the top of the list and the core country in the network. After the shale gas revolution, the US crude oil imports in 2020 have been reduced to a volume comparable to that of 2000, yet exports have grown 87 times as much as in 2000, making a shift in the role of importer and exporter in the trade network. Russia’s two centrality indicators show opposite trends, with its betweenness centrality decreasing and its ranking in the network decreasing. In contrast, its characteristic vector centrality increases yearly, rising from 29th place in 2000 to the top five in 2020. As a result of the international environment and geopolitical factors, Russia’s export markets have begun to shift to East Asian countries represented by China, South Korea, and Japan. Saudi Arabia and Canada have also retained high eigenvector centrality values in the network. Saudi Arabia is a net exporter, and the largest export trade partner has changed from the US to China; Canada has maintained high crude oil trade with the US, benefiting from geopolitical influences.
The positions of European countries such as Germany, France, the UK, and Italy in the global crude oil trade network have been weakening, especially Germany and Italy, where the centrality value has decayed the most. And the UK is in the state of declining by one place per year. The development and use of clean energy and renewable energy in European countries have been boosted in the context of climate change, environmental protection policies, and energy restructuring. Based on traditional fossil energy consumption, the energy structure is changing significantly, and its position in the crude oil network has decreased. As an important European transit hub, the Netherlands continues to improve its betweenness centrality ranking. It plays an increasingly important role as a “bridge” in the European crude oil trading system. However, its eigenvector centrality ranking decreases, indicating that the ties between the Netherlands and its fellow crude oil trading hubs have weakened. As a result, the crude oil trading network ties have become more fragmented and diversified. At the same time, with the deepening of industrialization and national economic development needs, large developing countries such as China and India have a high demand for crude oil in the long term, prompting the world crude oil trade center to shift eastward. In 2012, China’s betweenness centrality ranked second; in 2020, its eigenvector centrality surpassed the US to become the first. China continues to climb in the global crude oil trade network, establishing closer trade relations with more crude oil exporting countries and becoming an absolute core node.
4. Discussion
Globalization has integrated countries worldwide into an interconnected economic system based on international trade [
37]. Because of its high demand and value, crude oil has become a strategic resource for countries worldwide. The global trading environment influences crude oil markets in various regions and significantly influences price movements [
38,
39]. The price co-movements between regional markets provide the possibility and support to carry out the analysis of crude oil trade networks on a global scale. This paper found a regular increase or decrease in the global crude oil import and export trade volume. After experiencing the peak period, the global crude oil market will enter a period of adjustment in the current and subsequent stages, with a slow rise in the scale of crude oil trade. Meanwhile, the global trade networks exhibit obvious unbalance and hierarchical characteristics. The importance of core nodes in the trade network grows gradually, and the network agglomeration effect becomes noticeable. The ranking of European countries in the crude oil trade network is generally declining, and the global crude oil trade center of gravity is gradually shifting to the Asia–Pacific region. With the gradual deepening of the response to climate change, the shale gas revolution, and the development of new energy techniques, traditional fossil energy production and consumption are being spatially reorganized, and global crude oil trade patterns will also undergo large-scale changes.
We examined the macro, meso, and micro characteristics of trade networks in detail and investigated the topological structures of global crude oil trade networks to enrich and complement existing studies on crude oil trade networks by integrating different scales of network analysis methods. Compared with the existing literature, this paper identifies some new findings. After studying the competitive crude oil import and export networks, Zhou et al. similarly found that the traditional crude oil trade pattern is changing, with the Asia–Pacific region transforming into the center of gravity of crude oil trade, traditional crude oil exporters still retaining high competitiveness in the trade network, and emerging countries further developing their trade capabilities [
40]. Du et al. revealed the importance of the nodes in the global crude oil trade network. They found that countries with high betweenness centrality values, such as the US, Russia, Germany, and China, exhibit a stronger degree of correlation in the trade network. The global crude oil trade network follows a power-law distribution [
20]. However, betweenness centrality mainly emphasizes the mediating effect of countries in the trade network, and it is difficult to fully describe the importance of nodes in the trade network using only a single indicator. For this reason, we introduce two indicators to measure the importance of nodes, betweenness centrality and eigenvector centrality. The results show the nodes that play essential roles as “bridges” in the global crude oil trade networks and identify which countries’ trade partners are important crude oil trading powers. This study also finds that countries such as the US and Russia consistently occupy the top of the centrality ranking of the trade networks, while European countries such as Germany and France are becoming less influential in the global trade networks. In this paper, we also used the core–periphery profile algorithm that can measure weighted networks to overcome the shortcomings of many current algorithms that can only deal with unweighted networks, and quantitatively measure the concentration coefficients of global crude oil trade networks and the coreness of individual countries, and used this as a basis to classify the positions of countries in the network into core and peripheral countries, so as to gain a deeper understanding of the hierarchical characteristics of global crude oil trade networks.
This paper studied the spatiotemporal variation patterns of the global crude oil trade networks from a long-time series perspective, aiming to reveal the performance and evolution trend of the global crude oil trade networks. Of course, there are some shortcomings in this paper, which need further improvement. (1) This paper only takes the trade volume as the trade network’s weight and fails to consider the intrinsic influence of the crude oil market price fluctuations on the global crude oil trade networks in the year in question. (2) Although this paper uses various network description indicators and models to characterize the topology of trade networks, it is limited by space to construct an analytical framework to conduct a comprehensive and in-depth study on the network connectivity and structural resilience of global crude oil trade. (3) The integration of trade network analyses at the macro, meso, and micro levels should be strengthened to provide a complete picture of the global crude oil trade. We will continue to investigate the driving mechanisms behind changes in global crude oil trade patterns, including crude oil price volatility, bilateral trade agreements, geopolitics, and energy transition, in future studies.
5. Conclusions
Crude oil is known as the “blood of industry” and dominates the composition of global energy consumption, making it the most crucial energy material and strategic material today. Crude oil price movements are closely related to crude oil supply and demand, international situations, and geopolitical trends. The crude oil trade is also crucial in international commodity trade. This paper constructs global crude oil trade networks, integrates macro, meso, and micro network analysis methods, combines geospatial visualization techniques, and portrays the spatiotemporal patterns and topological evolution of the global crude oil trade networks. It aims to provide a scientific reference for understanding the dynamic changes in the global crude oil market.
The following conclusions have been obtained. (1) International crude oil import and export trade shows three fluctuating changes of increasing and then decreasing, with 2009 and 2016 as the nodal years, respectively. The global crude oil trade volume was the lowest in 2001 and peaked in 2012, and the scale of crude oil trade decreased after 2018. The crude oil market is entering an adjustment period at this stage, and the market scale is rising slowly. (2) World crude oil trade shows two-stage evolution patterns of the growth and adjustment periods, which converge with the overall crude oil trade volume change. The international crude oil trade has increased and decreased, forming trade networks with complex structures, clear hierarchy and unbalanced distribution. The “rich club” phenomenon in the network is remarkable, and the giant trading countries play dominant roles in the trade networks. (3) Since 2000, the connectivity patterns of the global crude oil trade networks have experienced different degrees of fluctuations, with the network scale and density showing a trend of first increasing and then decreasing, the network agglomeration pattern becoming more obvious, the inter-nodal links continuously strengthening, and the network connectivity improving. (4) The global crude oil trade networks exhibit prominent core–periphery structures. The number of core and peripheral countries is relatively stable, but the composition of its member countries is constantly changing with the evolution of the internal structures of the trade networks, and the polarization effect of the trade networks is significant. The US, Russia, China, Japan, South Korea, and the Netherlands are the core countries in the crude oil trade networks, and the major crude oil importing countries have become the dominant forces in the trade networks. (5) The US, Russia, Saudi Arabia, and Canada are always the top-ranked countries in the global crude oil trade networks and occupy important positions. Against the background of climate change, environmental protection policies and energy restructuring, European countries have been strengthening the development and use of clean energy and renewable energy based on traditional fossil energy consumption, and the energy structure is experiencing obvious changes, with crude oil’s status decreasing. Countries such as Germany, France, the UK, and Italy have been weakening their positions in the global crude oil trade networks.
The global crude oil trade networks are becoming increasingly complex due to the influence of multiple factors. To promote economic development and maintain energy security, countries around the world are dynamically adjusting their energy trade policies according to the external environment and their own needs, adhering to the strategy of diversifying the sources of crude oil imports, continuously widening the supply channels of crude oil imports, dispersing supply chain risks, enhancing their own choice of supply chain and ensuring long-term, stable, supply sources. Based on the above conclusions, we propose the following four policy recommendations for different types of countries. First, European countries should continue the “new energy revolution”, increase clean energy development and increase their share in the energy supply. At the same time, they should actively develop international relations with the major crude oil exporting countries in their neighborhood, promote the diversification of crude oil imports and improve their ability to cope with the energy crisis. Second, traditional crude oil exporting countries are highly dependent on crude oil. Traditional crude oil exporting countries should strengthen the development of domestic crude oil upstream and downstream industrial chains, improve their added value, and carry out industrial restructuring and optimization to ensure domestic economic stability. Internationally, they should focus on multilateral trade cooperation and enhance the trade regime for export products. Third, the US has achieved energy independence through the shale gas revolution, which has changed the world’s energy landscape. As a technological powerhouse, the US should further develop shale gas extraction technology, reduce extraction and usage costs, and ensure a stable supply of crude oil. Furthermore, it should develop renewable energy sources, improve energy utilization and reduce its dependence on overseas oil. Fourth, major crude oil importing countries, represented by China, should take the initiative to lead global crude oil governance and actively participate in changing the global crude oil governance system. In addition, it should focus on new technology research and development and promote the transformation and upgrading of the energy structure; on the other hand, it should strengthen cooperation with major crude oil exporting countries in the international crude oil market and carry out multilateral trade to maintain energy security.
It is worth noting that with the joint response to climate change becoming a global consensus, energy transition is necessary for most countries’ economic and social development. The new energy revolution is in full swing, and countries around the world have increased their development and use of clean and renewable energy, attempting to reduce their reliance on fossil fuels and crude oil. The US shale gas revolution has profoundly changed the international crude oil trade pattern. Major countries in the world are considering the development of new energy technologies as an essential breakthrough to lead the latest round of the energy revolution, improve the efficiency of energy resource utilization, promote green and low-carbon energy development, and thus ensure energy resource security.


