Article

Effects of Lignin Gasification Impurities on the Growth and Product Distribution of Butyribacterium methylotrophicum during Syngas Fermentation

1
Unidade de Bioenergia e Biorrefinarias, Laboratório Nacional de Energia e Geologia, Estrada do Paço do Lumiar, 22, 1649-038 Lisboa, Portugal
2
Department of Biotechnology and Nanomedicine, SINTEF Industry, Sem Sælands vei 2 A, 7034 Trondheim, Norway
*
Author to whom correspondence should be addressed.
Energies 2023, 16(4), 1722; https://doi.org/10.3390/en16041722
Submission received: 3 January 2023 / Revised: 27 January 2023 / Accepted: 3 February 2023 / Published: 9 February 2023
(This article belongs to the Section A4: Bio-Energy)

Abstract

:
This work evaluated the effects of condensable syngas impurities on the cell viability and product distribution of Butyribacterium methylotrophicum in syngas fermentation. The condensates were collected during the gasification of two technical lignins derived from wheat straw (WST) and softwood (SW) at different temperatures and in the presence or absence of catalysts. The cleanest syngas with 169 and 3020 ppmv of H2S and NH3, respectively, was obtained at 800 °C using dolomite as catalyst. Pyridines were the prevalent compounds in most condensates and the highest variety of aromatics with cyanide substituents were originated during WST lignin gasification at 800 °C without catalyst. In contrast with SW lignin-based condensates, the fermentation media supplemented with WST lignin-derived condensates at 1:100 vol. only supported residual growth of B. methylotrophicum. By decreasing the condensate concentration in the medium, growth inhibition ceased and a trend toward butyrate production over acetate was observed. The highest butyrate-to-acetate ratio of 1.3 was obtained by supplementing the fermentation media at 1:1000 vol. with the condensate derived from the WST lignin, which was gasified at 800 °C in the presence of olivine. B. methylotrophicum was able to adapt and resist the impurities of the crude syngas and altered its metabolism to produce additional butyrate.

1. Introduction

Addressing the global (present and future) demands for clean energy is the key to our common future. In the absence of a silver bullet, all diversified technological solutions, centralized or decentralized, should be considered important tools on the path to decarbonization. Bioenergy production from materials that are generated as waste or low-value byproducts in various industries and/or human activities, e.g., technical lignocellulosic residues, municipal solid waste, food waste, or agricultural residues, is an option that should be included in the sustainable energy portfolio [1]. One of the most promising feedstocks is lignocellulosic biomass, particularly the lignin-rich waste stream generated in second-generation ethanol production or as the residue of the pulp and paper industry, which often lacks appropriate valorization [2,3,4]. Gasification is a thermochemical process that can be applied for the valorization of this low-grade lignin and that allows the recovery of the recalcitrant carbon as synthetic gas (syngas) [2,3,5,6]. Syngas is mainly composed of hydrogen (H2), carbon monoxide (CO), carbon dioxide (CO2), methane (CH4), higher gaseous hydrocarbons (CnHm), and lower amounts of cyanide, ammonia, and some sulfur organic forms.
One possibility for syngas utilization involves its fermentation in the production of chemical building blocks and biofuels [7,8,9]. The microbial fixation of CO and CO2 is performed by acetogenic bacteria, such as Butyribacterium methylotrophicum, producing several naturally occurring acids and alcohols via the Wood–Ljungdahl pathway (WLP) [10,11,12]. Most studies on syngas fermentation use synthetic syngas formulations, tailor-made to mimic crude syngas. However, the composition of crude syngas is much more complex and, besides CO, CO2, and H2, it generally contains particulates (char and ash), volatile tars, and other gaseous hydrocarbons. Depending on the feedstock and gasification conditions, other prevalent gaseous species are CH4 and N2, and minor impurities include acetylene (C2H2), ethylene (C2H4), ethane (C2H6), benzene (C6H6), toluene (C7H8), xylene (C8H10), and naphthalene (C10H8), hydrogen sulfide (H2S), sulfur dioxide (SO2), carbonyl sulfide (COS), ammonia (NH3), hydrogen cyanide (HCN), nitrogen oxides (NOx), oxygen (O2), water (H2O), hydrogen chloride (HCl), ammonium chloride (NH4Cl), among others [5,13,14,15].
Depending on their toxicity and/or concentration, the syngas impurities decisively influence cell viability, enzyme activity, and product formation, thus contributing to possible differences between the results obtained with the bioconversion of synthetic and crude syngas [2,16]. In a previous study, the authors reported the accumulation of tar inside the bioreactor and a decrease in the syngas consumption rate by B. methylotrophicum during a prolonged conversion process [17]. Volatile compounds carried out by the incoming gas stream can solubilize in the fermentation medium and cause bacterial stress, inducing loss of cell viability [5,9,18]. Currently, a broad analysis of the potential effects of crude syngas impurities on microbial fermentation systems is still lacking. Recent publications tended to mainly focus on the standalone influence of one or of defined impurities, such as H2S, NH3, and NOX. For example, the effect of adding sulfide or ammonium to autotrophic cultures of acetogenic clostridia denoted a species-dependent response. Cell growth and alcohol production by C. carboxidivorans were promoted by supplementation of 1.0 g/L H2S or 5.0 g/L NH4Cl [18]. Conversely, low concentrations of H2S (0.1 g/L) inhibited C. autoethanogenum, C. ljungdahlii, and C. ragsdalei [9]. These studies were performed on comparable fermentation processes and constituted important advances in understanding the impacts of syngas impurities on syngas fermentation. However, there are additional factors that may influence the fermentation outcome. One is the fact that complex and detrimental compounds, such as the components of volatile tars, coexist in crude syngas [9,18,19]. Another is the fact that the composition of these tars is highly dependent on the type of feedstock and the operational parameters and gas cleaning stages of the gasification process [17,20]. To encompass this complexity in the composition of the gaseous substrate, studies have been conducted in which the substrate fed to the bioreactor was crude syngas [17,20]. In these cases, the syngas-cleaning stages preceding the fermentation can be complex and they usually involve extensive removal of impurities to obtain the syngas ready for end use. The approach of the present work differed from current studies in that it attempted to assess the inhibitory effects of a mixture of syngas impurities that were collected almost directly at the exit of the gasifier. One of the most easily accessible and representative mixtures of impurities in syngas is condensed volatile tar that can be removed during syngas cooling at the exit of the gasifier. At this point, condensates that still contain significant concentrations of other mentioned impurities can be collected [2,5].
In this study, the condensables collected at the outlet of a bubbling fluidized bed (BFB) gasifier with no previous cleaning stages except for particulate removal in a cyclone, were supplemented to B. methylotrophicum fermentation media. The gasification was performed in the presence of three different gasification catalysts and the effects on microbial growth and product distribution of the respective syngas condensates were compared. Advances in the subject would provide valuable information to adjust the fermentation process parameters and adapt and increase the robustness of microbial strains or consortia to crude syngas, with the potential to reduce the gas cleaning stages and operation costs.

2. Materials and Methods

2.1. Gasification—Operating Conditions

Two technical lignins (referred to, henceforward, as WST and SW) were used in the gasification assays. WST and SW were obtained as solid residues after the steam explosion and enzymatic hydrolysis of wheat straw and softwood biomass, respectively, from a 2nd-generation bioethanol production plant [3]. The technical lignin WST originated from wheat straw and consisted of large and compressed particles, while the technical lignin SW originated from softwood and consisted of a mixture of particles of different sizes and shapes [3]. Both feedstocks were roughly ground, dried at 60 °C, and further milled to obtain 2–10 mm particles suitable for BFB gasification. The proximate, ultimate and ash compositions of both lignins are detailed in Table 1.
The schematic diagram of the gasification system and the bubbling fluidized bed (BFB) gasifier are shown in Figure 1.
The BFB reactor was made of refractory steel pipe, with a circular cross-section, an internal diameter of 0.08 m, and a height of 1.50 m [21]. The reactor was placed inside an electrically heated furnace. The top, middle, and bottom temperatures in the reactor were measured on the axis and kept the desired value. Steam and oxygen were used as gasification agents and were mixed in the wind box located below the gas distributor placed at the base of the reactor. The feedstock was continuously fed into the gasifier through a screw feeder. To avoid feedstock clogging and gas backflow, a small nitrogen flux was used, and the feeding system was water-cooled. The feedstock flow rate was adjusted to dry and ash-free (daf) basis to account for the effect of moisture and ash content and enable the comparison between the results obtained with both technical lignins. The reactor was operated at atmospheric pressure and the lignin flow rate was set at around 5 g(daf)/min. The gas resulting from gasification (syngas) went through a cyclone (9 in Figure 1) to remove particulates. Subsequently, the gas was conducted into a water-cooled quenching system for the retention of tar and condensables (10 and 11 in Figure 1). Tar particles were separated from the condensate by filtration and were sampled for quantification (CEN/TS 15439:2006). After filtration, the gas was injected into a CO/CO2 at-line analyzer (18 in Figure 1) to control the gasifier operation. Syngas was also sampled for H2S and NH3 quantification (16 in Figure 1). H2S and NH3 concentrations were determined by the Environmental Protection Agency (EPA) method 11 and EPA CTM-027, respectively.
The selected gasification conditions were the following: equivalence ratio (ER) of 0.13, steam/lignin ratio (S/L) of 0.35 g/g(daf), gasification temperatures of 800–850 °C for WST, and 750 °C for SW [4]. The main criteria to select the gasification conditions were set to obtain the highest CO/H2 ratio as operationally possible, which would better suit B. methylotrophicum preference for CO [22,23]. Silica sand was used as the fluidization medium, with or without the addition of low-cost catalysts (dolomite, limestone, or olivine). Six condensates were collected from different gasification conditions according to the respective lignin sample, gasification temperature, and catalyst (Table 2). The condensates were stored in glass serum flasks with butyl rubber stoppers and stored at −4 °C until characterization, to avoid volatilization losses.

2.2. Syngas Fermentation—Strain and Culture Medium

The microbial strain used in this study was Butyribacterium methylotrophicum strain Marburg (DSM 3468, Deutsche Sammlung von Mikroorganismen und Zellkulturen, Braunschweig, Germany). This acetogen was cultured anaerobically in 125 mL serum flasks with 20 mL of culture medium and capped with butyl rubber stoppers and aluminum caps. The culture medium was adapted from Oswald et al., 2016 and is described in Pacheco et al., 2021 [17,24]. For the assays described herein, the selected pH was 6.0. The medium was first made anoxic by the replacement of the gas phase with nitrogen (N2) through a gas manifold system. Afterward, the serum bottles were sparged for 10 min with synthetic syngas with the following composition: 26 vol% CO, 19 vol% CO2, 18 vol% H2, and 37 vol% N2. After autoclaving, 0.2 mL of vitamin solution and 60 mM of sodium acetate were aseptically added [17], and the medium was inoculated with 4% (vol.) of fresh inoculum. For culture maintenance, the 2-(N-morpholino)ethanesulfonic (MES) buffer was replaced by 140 mM of phosphate buffer (pH 7.0) and the sodium acetate solution was omitted. The culture medium for the maintenance of syngas-adapted cells was 1% (vol.) inoculated every 4 days.
To test the effect of syngas impurities on the growth of B. methylotrophicum and C2-/C4-acid production, the microorganism was cultured in the presence of the gasification condensates. In the first assay, Cond1 and Cond2 (Table 2) were aseptically diluted to 1:100 and 1:1000 vol. directly in the culture medium. In the second assay, Cond3 to 6 (Table 2) were aseptically diluted to 1:1000 vol. directly in the culture medium. Eight serum flasks were prepared for each condition and two independent flasks were analyzed at each sampling time (t = 0, 12, 24, and 72 h). At the respective sampling time, the flasks were opened for cellular growth and product formation monitoring. Eight control flasks were also prepared by replacement of the condensate with ultra-pure sterile water in equal volume. All of the serum flasks were incubated horizontally at 37 °C and 150 rpm.

2.3. Analytical Methods

For each biological sample, growth was monitored by absorbance at 600 nm (Thermo Fisher Scientific spectrophotometer, Genesys 20, Waltham, MA, USA). Acetic and butyric acids were quantified by high-performance liquid chromatography (HPLC) in a Merk-Hitachi LaChrom modular HPLC, equipped with a refractive index (RI) detector (LaChrom, Merck, Germany). A Bio-Rad Aminex HPX-87H column (Bio-Rad Laboratories, Hercules, CA, USA) was maintained at 35 °C during the analysis, with 0.5 mM of H2SO4 as the mobile phase at a flow rate of 0.4 mL/min. Solutions of the analyzed organic acids were used as external standards. Syngas samples were analyzed through gas chromatography (GC) in an Agilent/HP 6890 gas chromatograph [17]. Values are at standard conditions of temperature and pressure: the temperature was 25 °C (293.15 K) with an absolute pressure of 1.0 × 10⁵ Pa. The gasification condensates were analyzed through gas chromatography/mass spectrometry (GC/MS) in Agilent 7697A equipment (Agilent Technologies, Santa Clara, CA, USA), with an Agilent HP-5MS UI and an Agilent DB-WAX column, both with lengths of 30 m, 0.250 mm in diameter, and 0.25 µm of film. Helium was the carrier gas and the injection volume was 1 µL for both columns. The gradient elution method used with the HP-5MS UI column was 5.66 min at 45 °C, with an increase of 8.8 °C/min to 100 °C for 1.7 min, an increase of 13.3 °C/min to 220 °C for 3.39 min, and finally an increase of 22.1 °C/min to 240 °C for 3.43 min, for a total run time of 30.358 min. The gradient elution method used with the DB-WAX column started at 40 °C for 4 min, then there was an increase of 5 °C/min to 50 °C for 1 min, an increase of 18 °C/min to 200 °C, and then an increase of 25 °C/min to 245 °C for 1 min. A proprietor database was used for peak and mass identification.

3. Results and Discussion

3.1. Effect of the Lignin Type

3.1.1. Syngas and Condensable Compounds

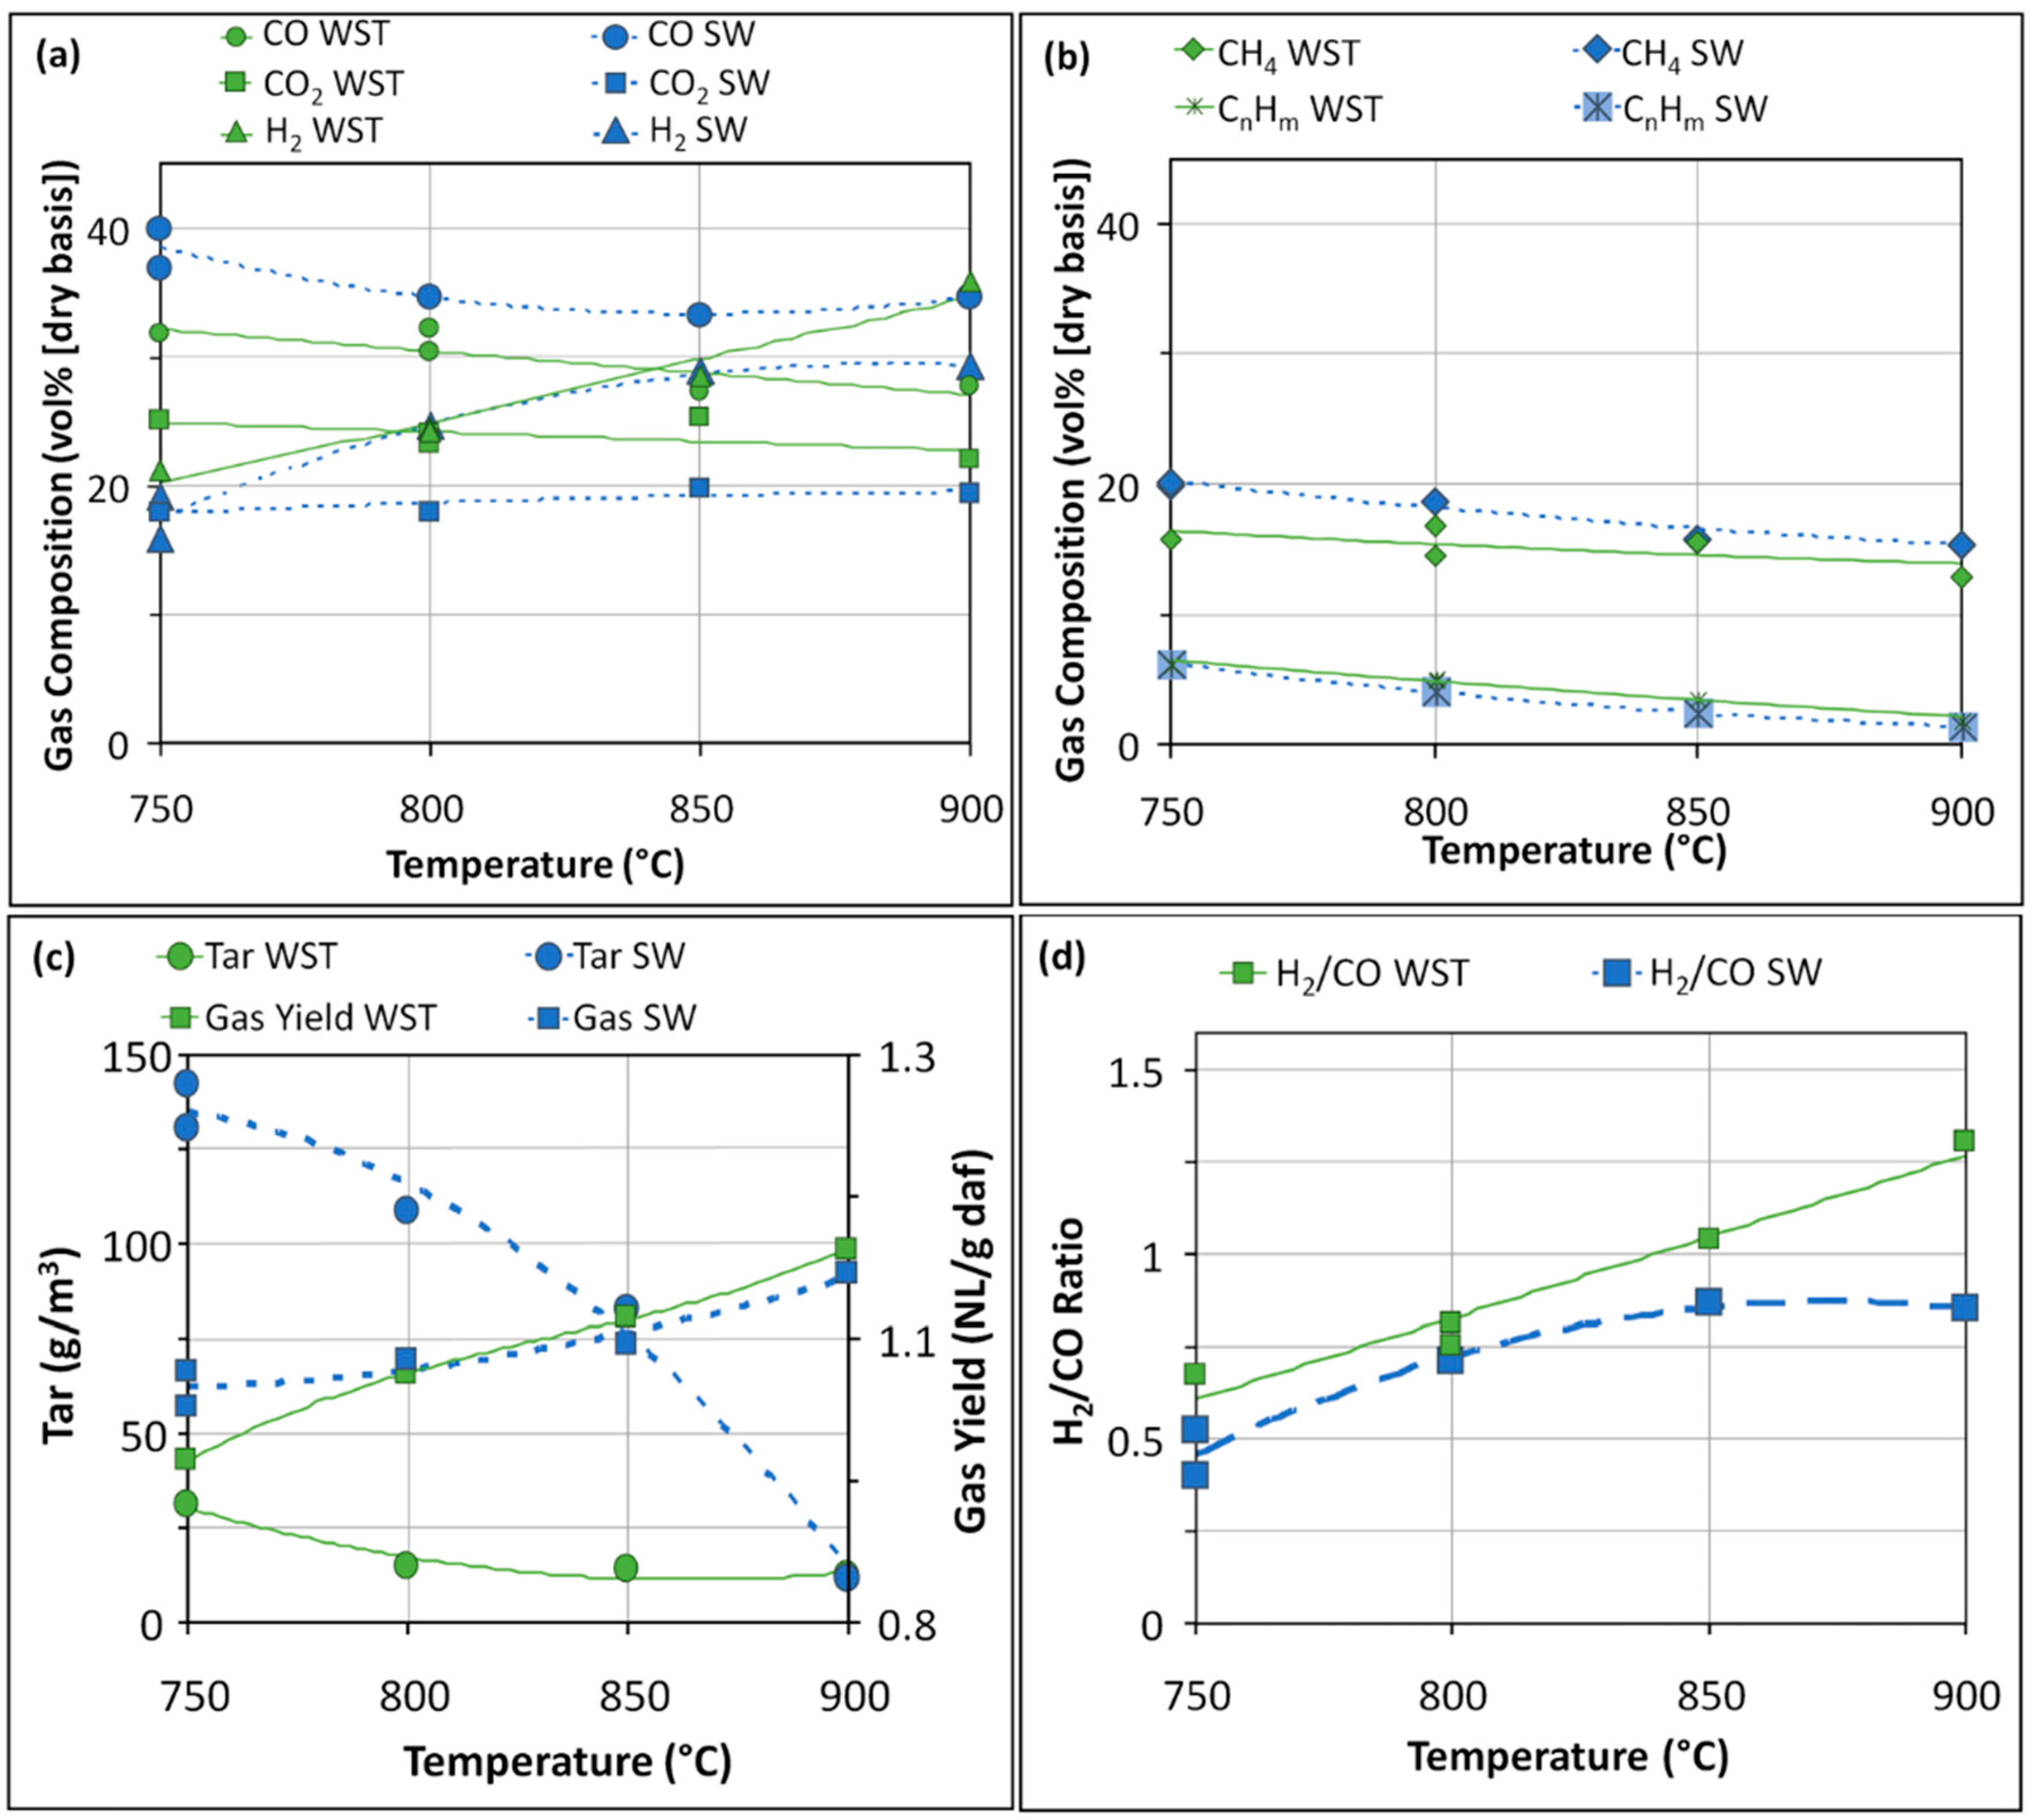
The two technical lignins used in this work were provided by two biorefineries, and their compositions are depicted in Table 1, Section 2.1. The gasification temperatures of SW and WST varied between 750 and 900 °C and the ER and S/L ratios were selected as the optimal conditions for WST gasification (ER = 0.13 and S/L ratio = 0.35 g/g(daf)) [4]. The results obtained in SW and WST gasification under different temperatures are compared in Figure 2.
As shown in Figure 2, the gasification temperature significantly affected the yield and composition of the syngas. The increase in temperature during WST and SW gasification favored steam-reforming reactions, as seen by the increase in the H2 concentration and the decrease of CO in the generated syngas. The H2/CO ratio is a fundamental factor in syngas fermentation, regulating how effectively the carbon in the gas will be converted by the autotrophically grown acetogens [4,17,21]. Figure 2d shows that for WST, H2/CO ratios ≥ 1 were obtained at gasification temperatures equal to or higher than 850 °C, while for SW, the H2/CO ratios plateaued below 1 due to the high concentration of CO in the produced gas. While SW syngas would have more carbon for the bacteria to convert, the lack of reducing potential provided by the H2 limits CO2 conversion. Therefore, a syngas with an H2/CO ratio ≥ 1, such as the WST syngas, is considered preferential for maximum carbon conversion by B. methylotrophicum [17]. Figure 2c shows that tar release decreased with the gradual increase in temperature for both lignins, while the gas yields followed the temperature variation. The cracking of heavy tars was particularly significant during SW gasification. Nonetheless, the tar concentrations from SW gasification below 900 °C were always much higher than those obtained with WST (approximately 5 times higher). Higher gasification temperatures appeared to be more favorable for tar-cracking reactions; however, temperatures closer to 900 °C also increased bed agglomeration, which is a well-known problem of the BFB gasification of agricultural and wood residues [25,26].
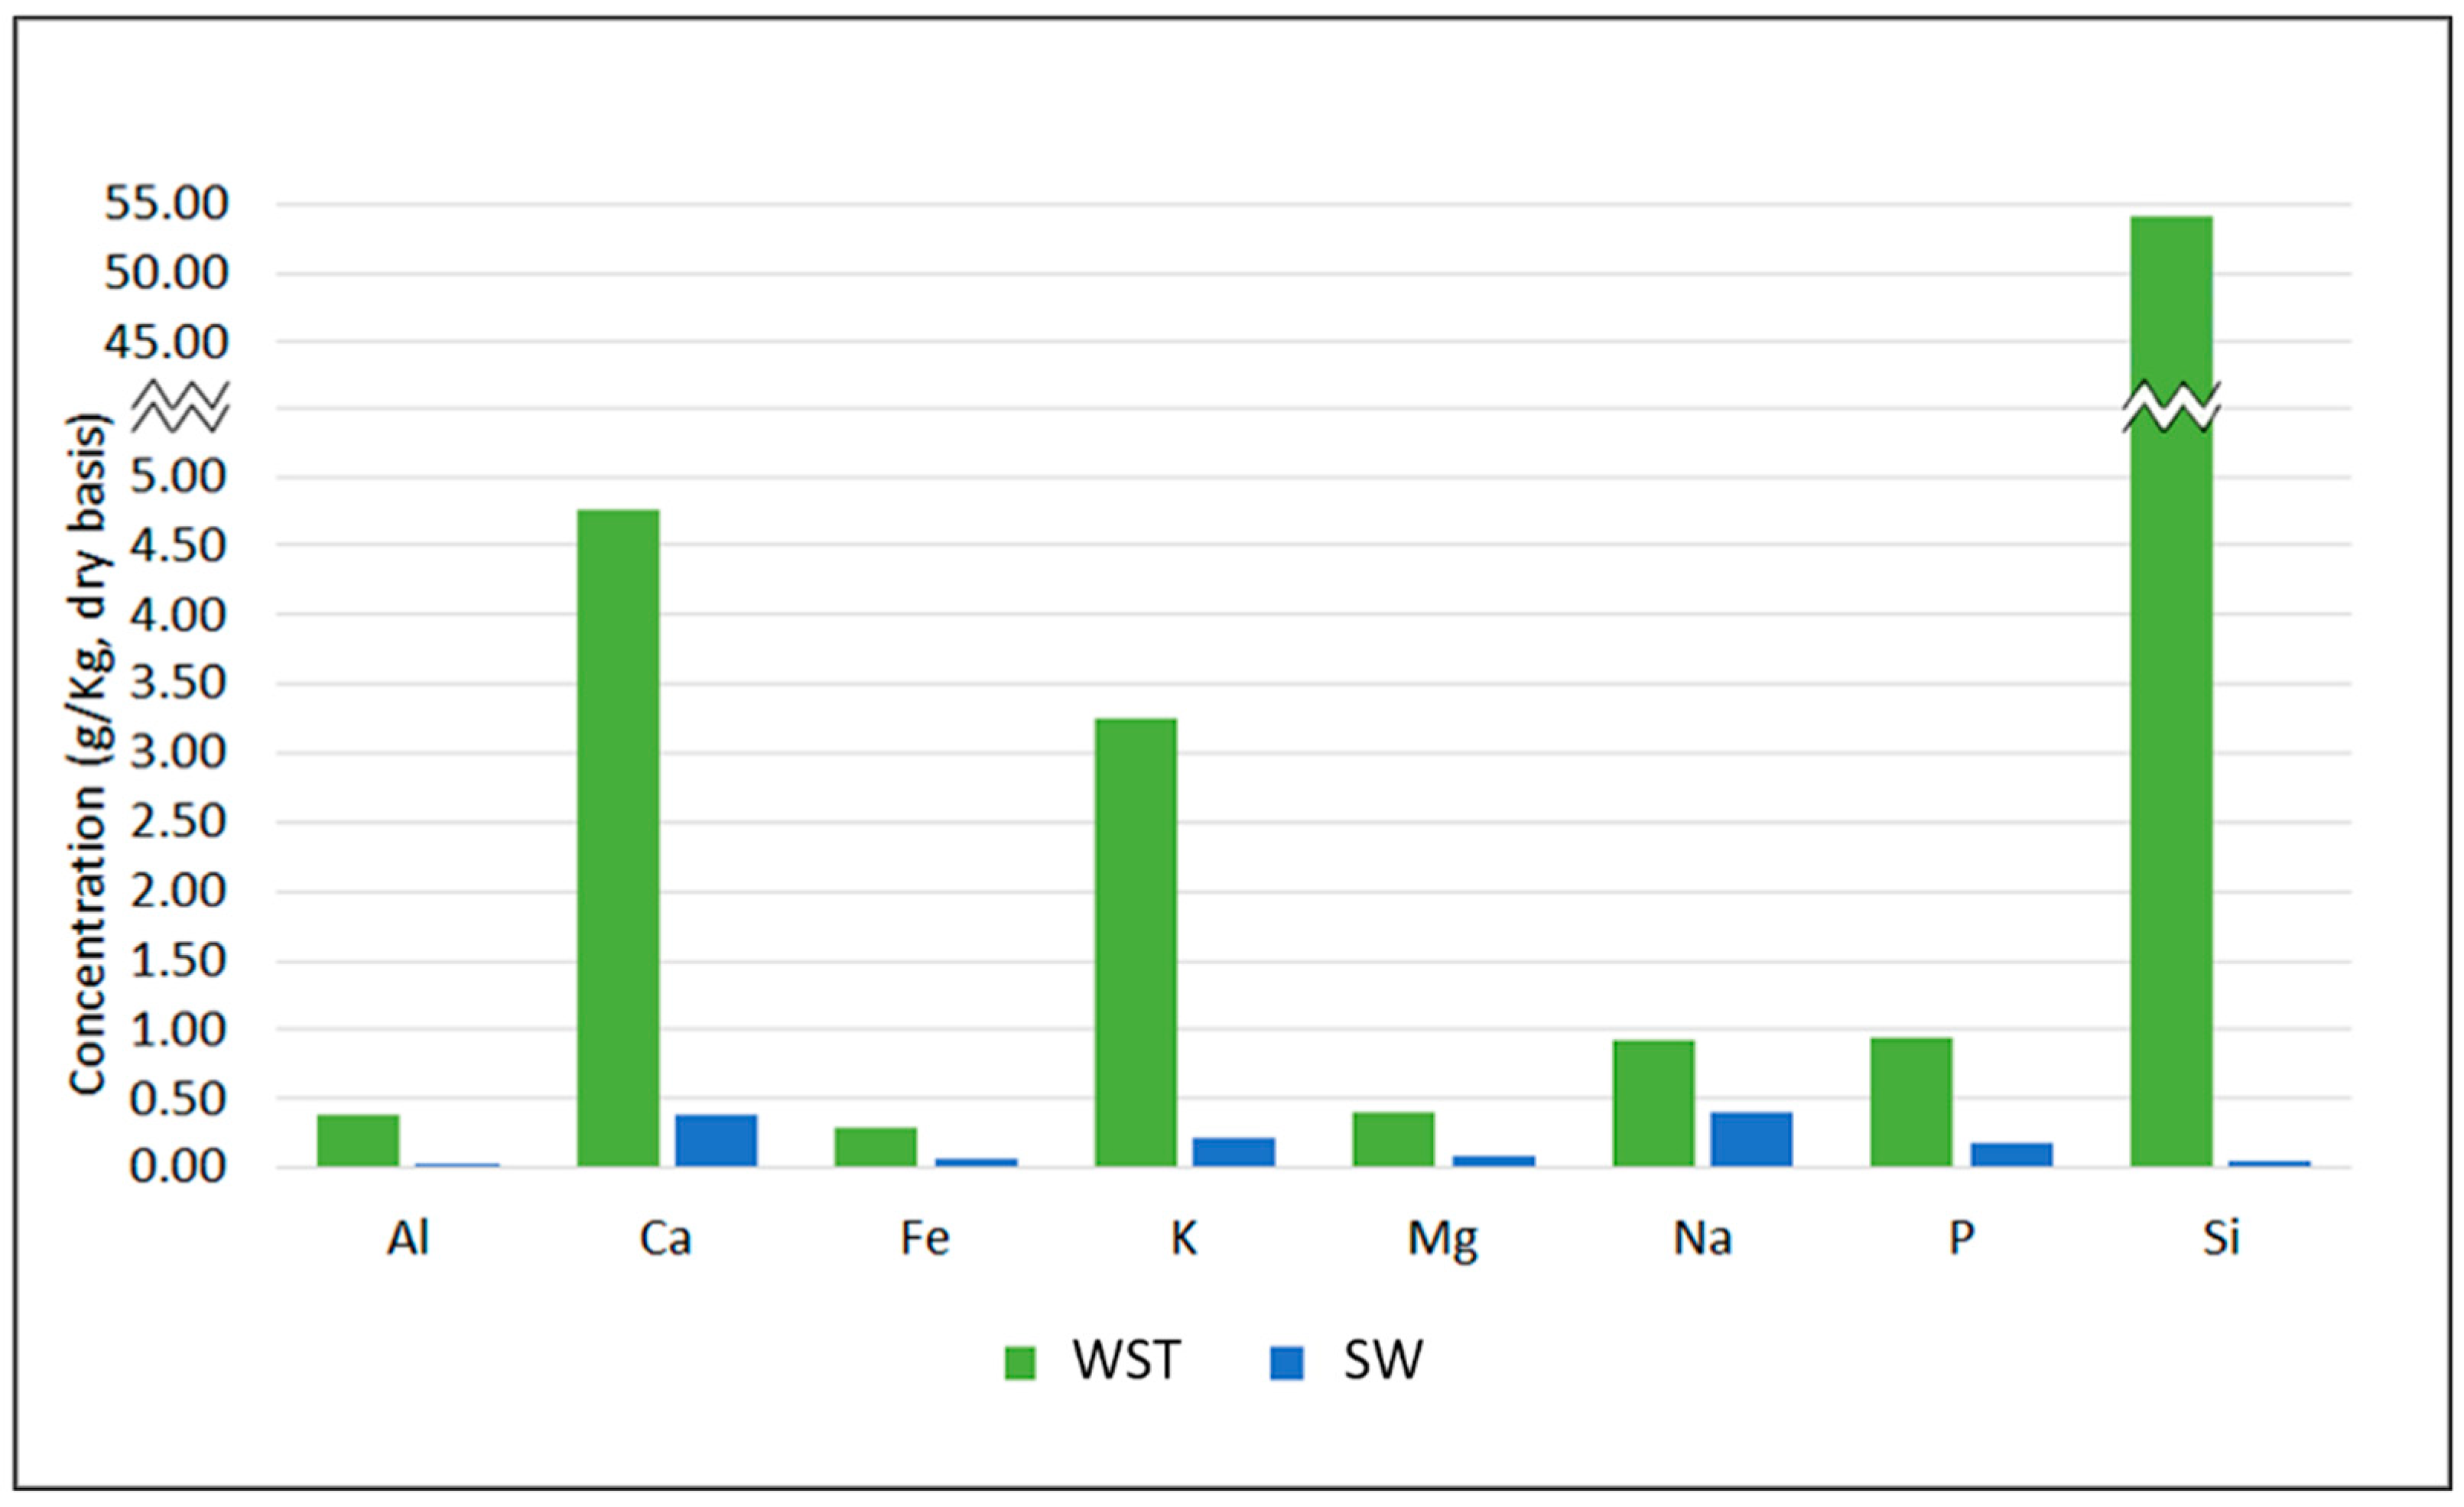
The outcome of biomass gasification is highly dependent on the composition of the feedstock used, especially in terms of ash and inorganic compounds. While high ash contents tend to increase bed agglomeration, alkali–alkaline earth metals (AAEMs) can act as catalysts during thermochemical processes, modifying product distribution, influencing char–ash/slag transition, and fomenting tar-cracking reactions [27,28,29]. Figure 3 shows the mineral composition of WST and SW.
From Table 1 and Figure 3, it is possible to observe that the mineral composition was visibly different between the two feedstocks used in this study. WST presented a higher ash content when compared with SW, which could lead to higher tar formation and bed agglomeration. However, this was not observed in the gasification of WST (Figure 2c). The presence of high concentrations of silicon (Si) and calcium (Ca) lowered bed agglomeration [30,31,32], while potassium (K) and sodium (Na) facilitated water–gas shift reactions, steam reforming and the cracking of tar and hydrocarbons, even at low temperatures, producing syngas with higher H2 concentrations [33,34,35], as can be observed in Figure 2a,c. The absence of the catalytic effects provided by the AAEM during SW gasification can explain the very high concentration of heavy tar observed in Figure 2c, concurrently with an overall higher CO concentration in the produced syngas (Figure 2a). Both technical lignins also contain sulfur and nitrogen in their compositions (Table 1), which may lead to the formation of S- and N-compounds. These may not be only present in the syngas as H2S, COS, NH3, and HCN [3], but also in the condensable volatiles collected at the outlet of the BFB gasifier, as sulfur and nitrogen substituents.
During the different gasification assays, samples of the formed condensates were collected for NH3, H2S, and tar quantification. The condensates were collected at the water-cooled quenching system used for the removal of tar and impurities from the gas; they are usually rich in organic compounds that can hinder the bacterial conversion of crude syngas directly from the gasifier. Condensate 1 (Cond1) was collected during the gasification of WST at 850 °C, ER = 0.13, and S/L ratio = 0.35 g/g(daf), while condensate 2 (Cond2) was collected during the gasification of SW at 750 °C, ER = 0.13, and S/L ratio = 0.35 g/g(daf). Cond1 and Cond2 were characterized by GC-MS; Table 3 depicts the groups of chemical compounds identified and their relative distribution.
A qualitative analysis showed that Cond2 presented the highest complexity, i.e., the highest number of different compounds, with 28 hits, 18 of which were compounds only identified in this condensate, namely N-methylmethanamine, 2,3-dihydro-1H-indene, 2-aminobenzonitrile, nitrosobenzene, phenylmethanol, 1H-pyrrole, 4-methylpyridine, pyridin-2-amine, 2-methylpyrimidine, 4-methylpyrimidine, pyrazine, 2-methylpyrazine, 1H-indole, 6-methyl-3-nitroso-1H-indol-2-ol, o-, m- and p-methylphenol, and 2-vinylfuran. Contrastingly, Cond1 generated only 15 hits, 5 of which were not identified in Cond2, namely acetic acid, 1H-inden-1-ol, benzonitrile, 6-methylpyridine-2-carboxylic acid, and quinoline.
The compounds identified by GC-MS were mainly aromatics from the group of pyridines, followed by several forms of benzenes and pyrimidines (Table 3). This high percentage of aromatic compounds in both condensates is naturally related to the structural organization of the lignin itself. Due to the cyclic nature of lignin, its thermochemical treatment promotes the cleavage of the weak α-ether and β-ether bonds, releasing aromatic compounds [36]. Comparatively, a higher variety of substituted aromatics were identified in Cond2. This predominance was consistent with the composition of SW and the respective tar content (Figure 2c). Another visible difference between both condensates was the higher content in phenols of Cond2, possibly due to the chemical composition of SW which was derived from softwood. Overall, the higher gasification temperature and the presence of high concentrations of AAEM in WST also seemed to have facilitated molecular fractionation. Cond1 presented only four high-molecular carbon compounds (6-methylpyridine-2-carboxylic acid, 1H-pyrazolo [3,4-d]pyrimidin-4-amine, 1H-inden-1-ol and quinoline), whereas Cond2 presented a higher variety of such compounds (6-methyl-3-nitroso-1H-indol-2-ol, 1H-pyrazolo [3,4-d]pyrimidin-4-amine, 1H-indole, 2,3-dihydro-1H-indene, 2-aminobenzonitrile, phenylmethanol, o-, m-, and p-methylphenol), due to molecular fractionation and re-organization of heavy tars [21,26]. Benzene and pyridines substituted with cyanide (CN) were common to both condensates, while NH2 was the most common nitrogen functional group. Cond2 also presented some aromatic rings with NO functional groups, revealing the influence of the gasification conditions. Some of the molecules present in the gasification condensates corresponded to minor impurities of crude syngas that act as microbial inhibitors, by inducing changes in the metabolic activity, impairment of the gas uptake, and cell growth cessation [17,20,37].

3.1.2. B. methylotrophicum Growth and Product Distribution

Cond1 and Cond2 were tested for their inhibitory potential over B. methylotrophicum. The responses were evaluated in terms of bacterial growth and product distribution in the presence of each condensate at dilution factors of 1:100 and 1:1000 vol. The results were analyzed throughout the incubation time and compared with cellular growth in an unsupplemented culture medium (Table 4).
The values of the cell density indicate that Cond1 more significantly affected the growth of B. methylotrophicum than Cond2, despite having lower compound variability (Table 3). As shown in Table 4, supplementing with 1:100 vol. of Cond1 resulted in an absorbance of 0.11 after 72 h, which was 6.8 times lower than that obtained without the condensate supplementation. The presence of physiologically high concentrations of strong solvents in Cond1, such as acetonitrile and benzonitrile, can cause pores in the cell membrane and disrupt the phospholipidic layer, compromising ATP production and cellular proliferation [38,39]. The supplementation with 1:100 vol. of Cond2 only slightly decreased cell density, showing that the condensate complexity might not necessarily correspond to higher cytotoxicity. As for the effects of the condensates on the production of carboxylic acids by B. methylotrophicum from syngas, the sum of the acetate and butyrate titers decreased by 97% with the supplementation of Cond1 at 1:100 vol., but only 15% at 1:1000 vol., when compared to the unsupplemented condition. While high concentrations of solvents can have adverse effects on cellular physiology and biochemistry, lower concentrations can explain this tendency for butyrate production. The presence of small amounts of solvents may facilitate the transport of extracellular acetate to the interior of the cell by increasing membrane permeability. Previous studies demonstrated that a high amount of cytoplasmic acetate in combination with low pH promotes butyrate production in E. limosum and B. methylotrophicum cells [22,40].

3.2. Effect of the Gasification Catalyst

3.2.1. Syngas and Condensable Compounds

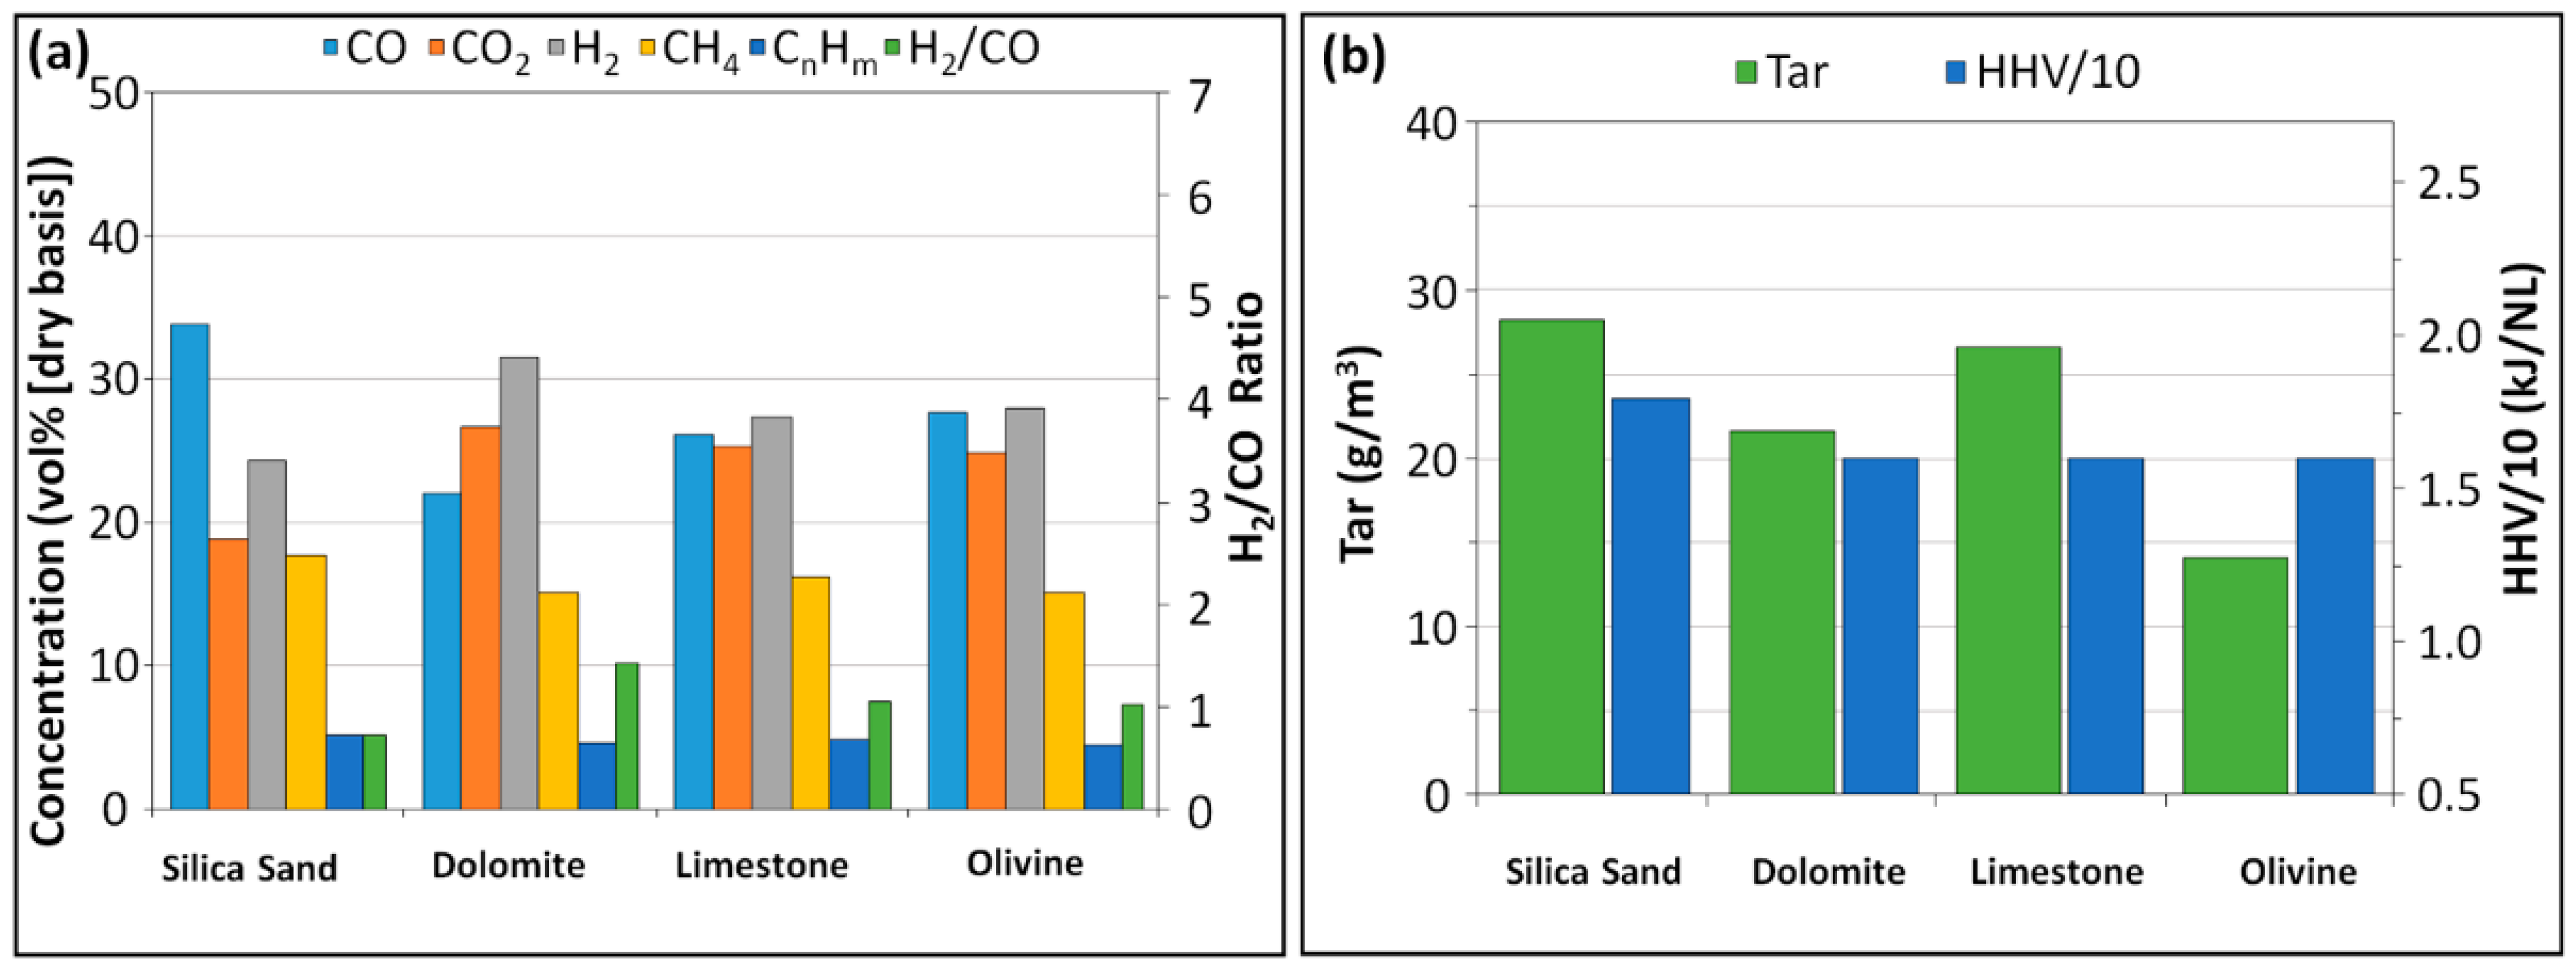
In the present work, the accumulation of tar and particulates during the gasification of SW led to severe clogging and the forced shutdown of the reactor. For this reason SW was discarded, and WST was used in all subsequent experiments to test the effects of the gasification catalyst on syngas-condensable compounds and the fermentation outcome. The presence of a catalyst during gasification is essential for the production of a cleaner gas, as the type of catalyst affects the gasification process by favoring biomass conversion into syngas and by promoting gaseous hydrocarbons and tar conversion into CO, CO2, and H2, thus leading to changes in the syngas composition [21,41,42]. Three different types of catalysts were tested during gasification at 800 °C (ER = 0.13, steam/lignin = 0.35 g/g(daf)): dolomite (carbonate: MgCO3.CaCO3), limestone (predominantly calcite: CaCO3), and olivine (magnesium iron silicate: (Mg, Fe)2SiO4). All catalysts were mixed with silica sand to reach 33% (w/w). The results were compared with the control (silica sand as the sole component of the gasification bed) and are presented in Figure 4.
All the catalysts used affected the composition of the produced syngas (Figure 4a), by promoting the main gasification reactions, including the water–gas shift reaction. Thus, CO contents decreased, while H2 and CO2 concentrations increased in the presence of all catalysts tested, compared to the control. The use of limestone led to the least variation in syngas compared to the use of silica sand only. Limestone’s main component is Ca, which mainly affects bed agglomeration by reacting with the silica in the bed [21,26]. When comparing the three tested catalysts with the control condition, the decrease in CH4 and CnHm content averaged 8%, while the increases in H2 and CO2 concentrations averaged 13 and 30%, respectively. The syngas with the highest H2 and CO2 concentrations and the lowest CO content was obtained in the presence of dolomite, which seemed to be the most suitable catalyst to promote water–gas shift reactions. Consequently, the highest H2/CO ratio was also obtained when dolomite was added to the gasification bed.
Figure 4b shows that the use of olivine as a catalyst produced the syngas with the lowest tar content, halving the tar concentration when compared to the control. The presence of Mg/Ca and Mg/Fe in dolomite and olivine, respectively, tended to promote tar-cracking reactions and decrease bed agglomeration [21,26,42,43]. Figure 4b also shows that the high heating values (HHV) of the syngas obtained with the tested catalysts were slightly lower than that of the gas produced with only silica sand as the gasification bed. This effect might be due to the promotion of steam reforming reactions by the catalysts, which lower the CH4 concentration in the gas and, therefore, the HHV [21].
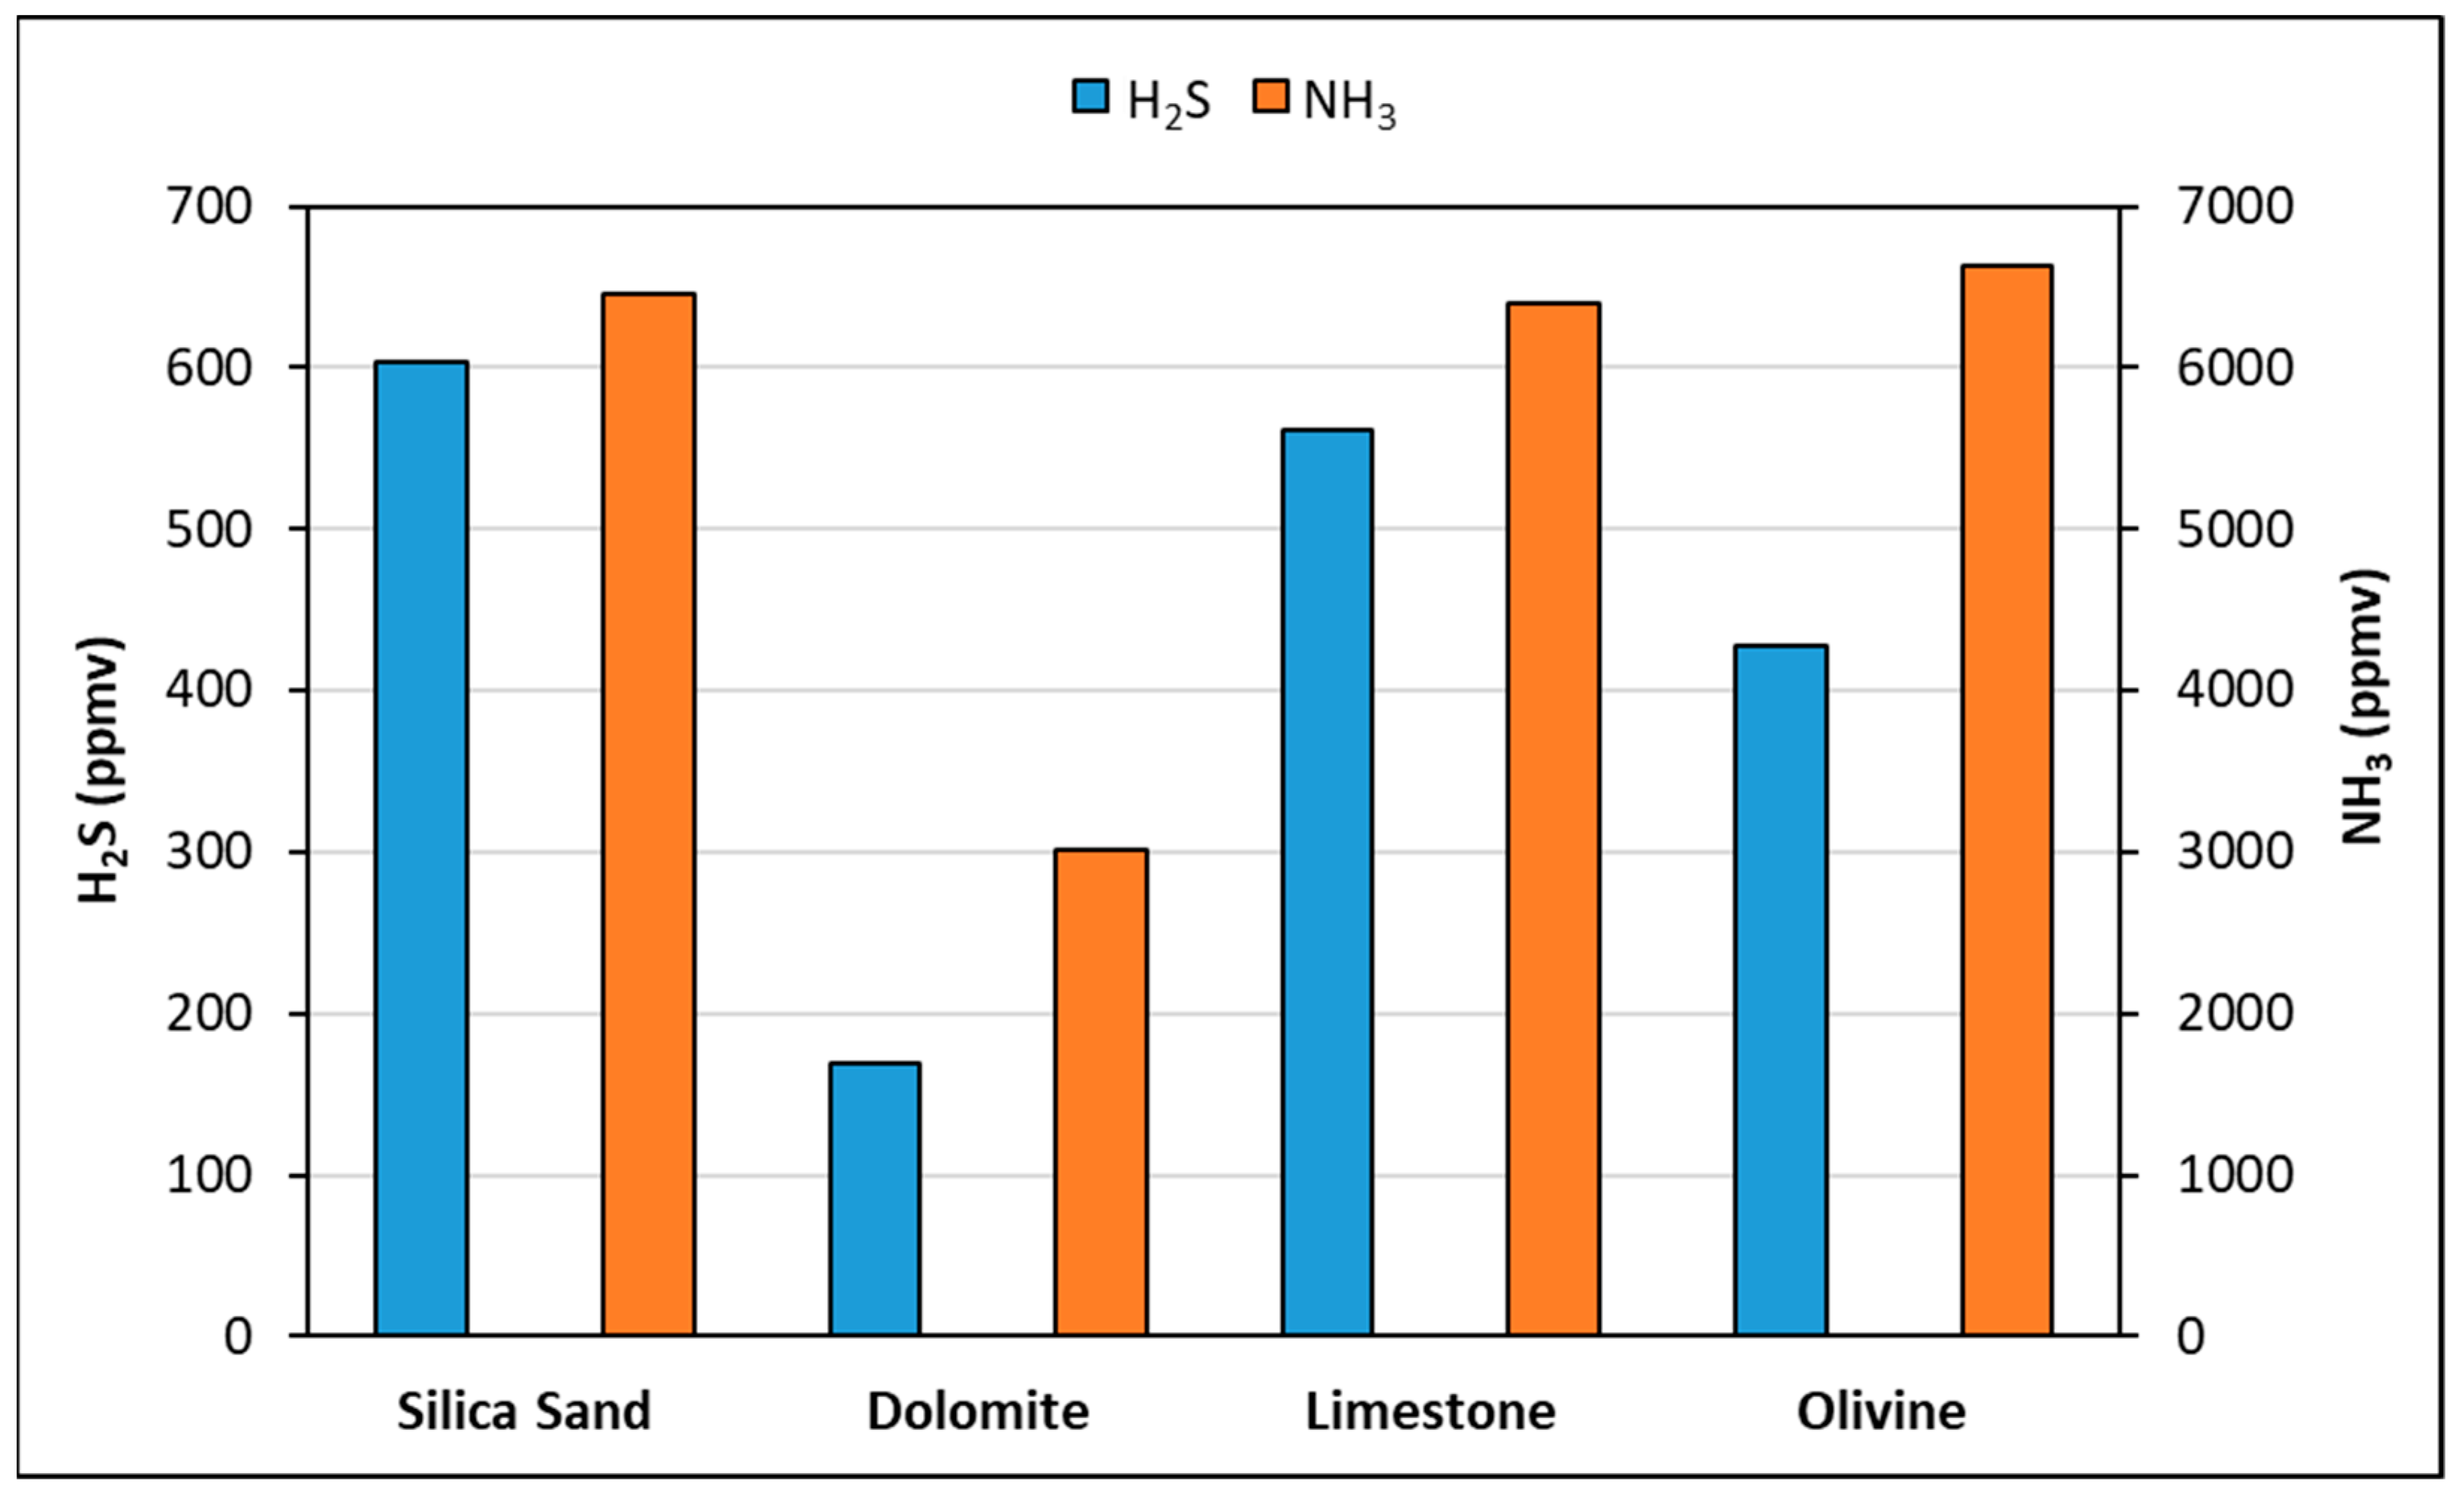
Figure 5 depicts the effect of the catalyst type on NH3 and H2S concentrations during the gasification of WST. Although dolomite was not as effective as olivine in tar cracking (Figure 4b), its use led to the lowest H2S and NH3 concentrations on the syngas (Figure 5), resulting in 72 and 53% decreases, respectively, when compared to the use of only silica sand. The use of limestone and olivine led to 7 and 29% decreases in the H2S concentration in the produced syngas, respectively, while the NH3 concentration was similar to that obtained with silica sand. Such differences may be explained by the presence of Ca and Mg in the composition of the three catalysts, which react with H2S to form calcium and magnesium sulfates that are retained inside the gasifier bed [21,26].
In order to characterize and compare the syngas impurities generated by the use of the different catalysts, the condensables of each gasification assay were collected and characterized through GC-MS. Table 5 and Table 6 list the groups of chemical compounds identified in all four condensates, Cond3 to Cond6.
From the results in Table 5 and Table 6, it can be concluded that the addition of the gasification catalysts exerted a positive influence on the overall composition of the condensates, producing an overall cleaner syngas, lowering the total identified compounds compared to the use of only silica sand as gasification bed (Cond3). Cond4 (dolomite) presented the lowest number of identified compounds, while in Cond5 (limestone) and Cond6 (olivine), a total of 38 and 37 different compounds were identified, respectively. Cond3, Cond5, and Cond6 had 29 compounds in common, from which the majority were included in the group of pyridines and pyrimidines. Cond5 had a high variety of acids and nitriles, with special emphasis on the presence of acetic and hexadecenoic acid, products of tar cracking into smaller molecules [26]. The use of dolomite in the gasification bed (Cond4) especially affected the occurrence of pyridines by facilitating the cracking of these molecules into simpler CnHm compounds (Figure 4). Molecules with biological inhibition potential were detected in all of the analyzed condensates. Cond3 presented the highest number of aromatics substituted with CN (11 different hits), while in Cond4, only 2 of those compounds were detected, namely 4-hydroxybenzonitrile and acetonitrile. Both Cond5 and Cond6 presented 10 different compounds with CN functional groups, showing that limestone and olivine were inadequate to diminish the presence of these inhibitors in syngas. Furthermore, Cond3, Cond5, and Cond6 contained compounds with NO substituents, which were not detected in Cond4 (dolomite). Compounds with NO substituents are especially worrying since this molecule can replace CO as a terminal electron acceptor during syngas fermentation, leading to the production of unwanted products and lower biomass yields [9,18]. These results were consistent with the NH3 and H2S analysis performed (Figure 5), indicating that the best option for a cleaner, more suitable syngas for fermentation is the co-usage of dolomite and silica sand in the BFB gasifier.

3.2.2. B. methylotrophicum Growth and Product Distribution

The condensates obtained from WST gasification in the presence of the different catalysts were also used to test the effects on B. methylotrophicum growth and product distribution. Cond3 to Cond6 were supplemented at a 1:1000 vol. to B. methylotrophicum culture medium since it was the dilution that yielded the best results in the experiments with Cond1 and Cond2. Table 7 and Figure 6a,b display the results obtained with or without the addition of Cond3 to Cond6.
From the analysis of Table 7 and Figure 6, no significant variation in cellular density was observed. The maximum specific growth rate was approximately 0.04 h−1 in all conditions tested, indicating that, at the tested concentrations, the supplementation of the fermentation media with the condensates did not significantly affect B. methylotrophicum growth. However, syngas pressure inside the serum flasks varied differently for the tested condensates. A pressure decrease inside the serum flask is a synonym of syngas consumption and is normally associated with cell growth and metabolite production [17]. While with Cond4, Cond5, and Cond6, the pressure variation was similar to that of the control without condensate, the cells cultured in the presence of Cond3 consumed less syngas. The supplementation of the culture medium with Cond3 to Cond6 at a 1:1000 vol. resulted in clear differences in the acetate and butyrate production by B. methylotrophicum. The highest acetate concentration of 8.8 mM was obtained with Cond3 supplementation, corresponding to 1.3 times more than that of the control. As for butyrate production, the highest concentration of 4.5 mM was obtained with Cond6 supplementation, which was 1.4 times higher than that of the control without condensate, while only 1.9 mM of butyrate was produced when the medium was supplemented with Cond3. Overall, the carboxylic acid production was either directed toward C2-acid, which was the case of Cond3 and, to a lower degree, Cond5, or toward C4-acid as observed with Cond6. The total acid production was 10.2 and 10.7 mM in the control without condensate supplementation and with Cond3, respectively, while the supplementation with Cond4 induced the production of only 7.8 mM total acids. This was unexpected, since the condensate obtained during WST gasification with dolomite as catalyst contained the lowest number of impurities, especially compounds substituted with CN and NO functional groups, and should, therefore, exert less inhibition over B. methylotrophicum.
Most of the species that were exclusively identified in Cond3, Cond4, or Cond5 were not present in Cond6, the composition of the latter being the most similar to that of Cond1 (Section 3.1.1). The cells grown in the presence of Cond6 yielded the highest butyrate titer for all the conditions tested in this assay, and the concentration resembled that obtained in syngas fermentation with Cond1. The stimulus for butyrate production induced by Cond6 and, to a lesser extent, by Cond4, can also indicate that cells could be responding to the presence of solvents, namely to the benzene species present in these condensates. These compounds would need to be removed by active transport from the cell and could also cause alterations of the phospholipidic membrane, increasing acetate availability inside the cells and triggering a metabolic shift [38,39,44]. Even though numerous works describe aromatic compounds as highly toxic [45,46,47,48], the results obtained in this work indicate that B. methylotrophicum not only can resist their presence in small amounts but also alter its metabolism accordingly [18]. In a biorefinery setting, where gasification and syngas fermentation are sequentially connected, such bio-resilience is of utmost importance. It can also benefit overall process costs by preventing the need for exhaustive gas cleaning, bringing us one step closer to the integration of these two technologies.

4. Conclusions

This work showed that complex mixtures of syngas impurities derived from WST and SW, which were collected as condensables at a BFB gasifier outlet, can hinder B. methylotrophicum growth and alter its carboxylic acid production profile. Regardless of the feedstock and gasification conditions, the gasification condensates mainly contained aromatic compounds with the potential to affect microbial activity. The increase in the process temperature and the addition of low-cost catalysts to the silica sand bed changed the gasification outcome by not only promoting tar-cracking reactions but also reducing the number and type of impurities present in the gasification condensates. Accordingly, the condensates that originated from the gasification of WST at 800 °C in the presence of dolomite or olivine proved to be the least inhibitory to the growth of B. methylotrophicum. However, the presence of syngas impurities at low concentrations promoted a shift from acetate to butyrate production by B. methylotrophicum. The supplementation of the fermentation medium with Cond6, which was produced by gasification of WST at 800 °C in the presence of olivine, or with Cond1, induced the highest butyrate production by B. methylotrophicum. This may be advantageous in a syngas fermentation setting where butyrate is intended to be the main product. The results show that B. methylotrophicum can potentially withstand toxic syngas impurities, suggesting that a reduction of syngas-cleaning steps could be applied in an integrated gasification and fermentation process.

Author Contributions

Conceptualization, M.P., F.P. and P.M. (Patrícia Moura); methodology, M.P., J.O. and P.M. (Patrícia Moura); validation, M.P., F.P. and P.M. (Patrícia Moura); formal analysis, M.P., F.P., A.B. and P.M. (Patrícia Moura); investigation, M.P., F.P., A.B., R.A., P.M. (Paula Marques), R.M. and J.O.; writing—original draft preparation, M.P., F.P. and P.M. (Patrícia Moura); writing—review and editing, M.P., F.P., A.B., J.O., F.G. and P.M. (Patrícia Moura); supervision, P.M. (Patrícia Moura); project administration, F.G.; funding acquisition, F.G. and P.M. (Patrícia Moura). All authors have read and agreed to the published version of the manuscript.

Funding

This research was performed under the framework of the AMBITION Project, an ECRIA project funded by Horizon 2020 EU, grant agreement no. 731263, and of the Operational Program for Competitiveness and Internationalization (PORTUGAL 2020), Lisbon Portugal Regional Operational Program (Lisboa 2020), and the North Portugal Regional Operational Program (Norte 2020) under the Portugal 2020 Partnership Agreement, through the European Regional Development Fund (LISBOA-01-0145-FEDER-022059). M.P. was supported by FCT through the Ph.D. grant DFA/BD/6423/2020 and by BRISKII grant agreement no. 731101.

Data Availability Statement

No additional data are associated with this article.

Acknowledgments

The authors would like to acknowledge Maria M.M. Santos for assisting in the classification of the chemical groups.

Conflicts of Interest

The authors declare no conflict of interest. The funders had no role in the design of the study, in the collection, analyses, or interpretation of data, in the writing of the manuscript or in the decision to publish the results.

References

  1. Lee, S.Y.; Sankaran, R.; Chew, K.W.; Tan, C.H.; Krishnamoorthy, R.; Chu, D.-T.; Show, P.-L. Waste to bioenergy: A review on the recent conversion technologies. BMC Energy 2019, 1, 4. [Google Scholar] [CrossRef]
  2. Liakakou, E.T.; Infantes, A.; Neumann, A.; Vreugdenhil, B.J. Connecting gasification with syngas fermentation: Comparison of the performance of lignin and beech wood. Fuel 2020, 290, 120054. [Google Scholar] [CrossRef]
  3. Liakakou, E.; Vreugdenhil, B.; Cerone, N.; Zimbardi, F.; Pinto, F.; André, R.; Marques, P.; Mata, R.; Girio, F. Gasification of lignin-rich residues for the production of biofuels via syngas fermentation: Comparison of gasification technologies. Fuel 2019, 251, 580–592. [Google Scholar] [CrossRef]
  4. Pinto, F.; André, R.; Marques, P.; Mata, R.; Pacheco, M.; Moura, P.; Gírio, F. Production of Syngas Suitable to Be Used in Fermentation to Obtain Biochemical Added-Value Compounds. Chem. Eng. Trans. 2019, 76, 1399–1404. [Google Scholar] [CrossRef]
  5. Chiche, D.; Diverchy, C.; Lucquin, A.-C.; Porcheron, F.; Defoort, F. Synthesis Gas Purification. Oil Gas Sci. Technol. 2013, 68, 707–723. [Google Scholar] [CrossRef]
  6. Daniell, J.; Köpke, M.; Simpson, S.D. Commercial Biomass Syngas Fermentation. Energies 2012, 5, 5372–5417. [Google Scholar] [CrossRef]
  7. Benevenuti, C.; Amaral, P.; Ferreira, T.; Seidl, P. Impacts of Syngas Composition on Anaerobic Fermentation. Reactions 2021, 2, 391–407. [Google Scholar] [CrossRef]
  8. Latif, H.; Zeidan, A.A.; Nielsen, A.T.; Zengler, K. Trash to treasure: Production of biofuels and commodity chemicals via syngas fermenting microorganisms. Curr. Opin. Biotechnol. 2014, 27, 79–87. [Google Scholar] [CrossRef]
  9. Oliveira, L.; Rückel, A.; Nordgauer, L.; Schlumprecht, P.; Hutter, E.; Weuster-Botz, D. Comparison of Syngas-Fermenting Clostridia in Stirred-Tank Bioreactors and the Effects of Varying Syngas Impurities. Microorganisms 2022, 10, 681. [Google Scholar] [CrossRef]
  10. Bertsch, J.; Müller, V. Bioenergetic constraints for conversion of syngas to biofuels in acetogenic bacteria. Biotechnol. Biofuels 2015, 8, 1–12. [Google Scholar] [CrossRef] [Green Version]
  11. Kennes, D.; Abubackar, H.N.; Diaz, M.; Veiga, M.C.; Kennes, C. Bioethanol production from biomass: Carbohydrate vs syngas fermentation. J. Chem. Technol. Biotechnol. 2015, 91, 304–317. [Google Scholar] [CrossRef]
  12. Kumar Panda, S.; Sahu, L.; Kumar Behera, S.; Ray, R.C. Chapter 9-Research and Production of Organic Acids and Industrial Potential. In Bioprocessing for Biomolecules Production; John Wiley & Sons, Ltd.: Chichester, UK, 2019; pp. 195–209. [Google Scholar]
  13. Kumar, S.; Dineshkumar, R.M.; Vinayakaselvi, M.A.; Ramanathan, A. Bio-Ethanol Production from Syngas-Derived Biomass: A Review. Mater. Today Proc. 2021, 46, 9989–9993. [Google Scholar] [CrossRef]
  14. Munasinghe, P.C.; Khanal, S.K. Biomass-derived syngas fermentation into biofuels: Opportunities and challenges. Bioresour. Technol. 2010, 101, 5013–5022. [Google Scholar] [CrossRef]
  15. Xu, D.; Tree, D.R.; Lewis, R.S. The effects of syngas impurities on syngas fermentation to liquid fuels. Biomass-Bioenergy 2011, 35, 2690–2696. [Google Scholar] [CrossRef]
  16. Infantes, A.; Kugel, M.; Neumann, A. Evaluation of Media Components and Process Parameters in a Sensitive and Robust Fed-Batch Syngas Fermentation System with Clostridium ljungdahlii. Fermentation 2020, 6, 61. [Google Scholar] [CrossRef]
  17. Pacheco, M.; Pinto, F.; Ortigueira, J.; Silva, C.; Gírio, F.; Moura, P. Lignin Syngas Bioconversion by Butyribacterium methylotrophicum: Advancing towards an Integrated Biorefinery. Energies 2021, 14, 7124. [Google Scholar] [CrossRef]
  18. Rückel, A.; Hannemann, J.; Maierhofer, C.; Fuchs, A.; Weuster-Botz, D. Studies on Syngas Fermentation With Clostridium carboxidivorans in Stirred-Tank Reactors With Defined Gas Impurities. Front. Microbiol. 2021, 12, 655390. [Google Scholar] [CrossRef]
  19. Oswald, F.; Zwick, M.; Omar, O.; Hotz, E.N.; Neumann, A. Growth and Product Formation of Clostridium ljungdahlii in Presence of Cyanide. Front. Microbiol. 2018, 9, 1213. [Google Scholar] [CrossRef]
  20. Infantes, A.; Kugel, M.; Raffelt, K.; Neumann, A. Side-by-Side Comparison of Clean and Biomass-Derived, Impurity-Containing Syngas as Substrate for Acetogenic Fermentation with Clostridium ljungdahlii. Fermentation 2020, 6, 84. [Google Scholar] [CrossRef]
  21. Pinto, F.; André, R.N.; Carolino, C.; Miranda, M.; Abelha, P.; Direito, D.; Dohrup, J.; Sørensen, H.R.; Girio, F. Effects of Experimental Conditions and of Addition of Natural Minerals on Syngas Production from Lignin by Oxy-Gasification: Comparison of Bench- and Pilot Scale Gasification. Fuel 2015, 140, 62–72. [Google Scholar] [CrossRef] [Green Version]
  22. Worden, R.M.; Grethlein, A.J.; Zeikus, J.G.; Datta, R. Butyrate production from carbon monoxide by Butyribacterium methylotrophicum. Appl. Biochem. Biotechnol. 1989, 20–21, 687–698. [Google Scholar]
  23. Humphreys, J.R.; Hebdon, S.D.; Rohrer, H.; Magnusson, L.; Urban, C.; Chen, Y.-P.; Lo, J. Establishing Butyribacterium methylotrophicum as a Platform Organism for the Production of Biocommodities from Liquid C1 Metabolites. Appl. Environ. Microbiol. 2022, 88, e02393-21. [Google Scholar] [CrossRef] [PubMed]
  24. Oswald, F.; Dörsam, S.; Veith, N.; Zwick, M.; Neumann, A.; Ochsenreither, K.; Syldatk, C. Sequential Mixed Cultures: From Syngas to Malic Acid. Front. Microbiol. 2016, 7, 891. [Google Scholar] [CrossRef]
  25. Alabdrabalameer, H.A.; Taylor, M.J.; Kauppinen, J.; Soini, T.; Pikkarainen, T.; Skoulou, V. Big problem, little answer: Overcoming bed agglomeration and reactor slagging during the gasification of barley straw under continuous operation. Sustain. Energy Fuels 2020, 4, 3764–3772. [Google Scholar] [CrossRef]
  26. Yu, J.; Guo, Q.; Gong, Y.; Ding, L.; Wang, J.; Yu, G. A review of the effects of alkali and alkaline earth metal species on biomass gasification. Fuel Process. Technol. 2021, 214, 106723. [Google Scholar] [CrossRef]
  27. Jordan, C.A.; Akay, G. Speciation and Distribution of Alkali, Alkali Earth Metals and Major Ash Forming Elements during Gasification of Fuel Cane Bagasse. Fuel 2012, 91, 253–263. [Google Scholar] [CrossRef]
  28. Widjaya, E.R.; Chen, G.; Bowtell, L.; Hills, C. Gasification of non-woody biomass: A literature review. Renew. Sustain. Energy Rev. 2018, 89, 184–193. [Google Scholar] [CrossRef]
  29. Zhu, C.; Maduskar, S.; Paulsen, A.D.; Dauenhauer, P.J. Alkaline-Earth-Metal-Catalyzed Thin-Film Pyrolysis of Cellulose. ChemCatChem 2016, 8, 818–829. [Google Scholar] [CrossRef]
  30. Ge, Z.; Kong, L.; Bai, J.; Chen, X.; He, C.; Li, H.; Bai, Z.; Li, P.; Li, W. Effect of CaO/Na2O on slag viscosity behavior under entrained flow gasification conditions. Fuel Process. Technol. 2018, 181, 352–360. [Google Scholar] [CrossRef]
  31. Holmgren, P.; Broström, M.; Backman, R. Slag Formation during Entrained Flow Gasification: Silicon-Rich Grass Fuel with a KHCO3 Additive. Energy Fuels 2018, 32, 10720–10726. [Google Scholar] [CrossRef]
  32. Vassilev, S.V.; Baxter, D.; Andersen, L.K.; Vassileva, C.G. An Overview of the Chemical Composition of Biomass. Fuel 2010, 89, 913–933. [Google Scholar] [CrossRef]
  33. Guo, Q.; Cheng, Z.; Chen, G.; Yan, B.; Li, J.; Hou, L.; Ronsse, F. Assessment of biomass demineralization on gasification: From experimental investigation, mechanism to potential application. Sci. Total. Environ. 2020, 726, 138634. [Google Scholar] [CrossRef] [PubMed]
  34. Jiang, L.; Hu, S.; Wang, Y.; Su, S.; Sun, L.; Xu, B.; He, L.; Xiang, J. Catalytic effects of inherent alkali and alkaline earth metallic species on steam gasification of biomass. Int. J. Hydrog. Energy 2015, 40, 15460–15469. [Google Scholar] [CrossRef]
  35. Skoulou, V.; Kantarelis, E.; Arvelakis, S.; Yang, W.; Zabaniotou, A. Effect of biomass leaching on H2 production, ash and tar behavior during high temperature steam gasification (HTSG) process. Int. J. Hydrogen Energy 2009, 34, 5666–5673. [Google Scholar] [CrossRef]
  36. Zhou, H.; Wu, C.; Onwudili, J.A.; Meng, A.; Zhang, Y.; Williams, P.T. Polycyclic Aromatic Hydrocarbon Formation from the Pyrolysis/Gasification of Lignin at Different Reaction Conditions. Energy Fuels 2014, 28, 6371–6379. [Google Scholar] [CrossRef]
  37. Neumann, A.; Dörsam, S.; Oswald, F.; Ochsenreither, K. Chapter 4-Microbial Production of Value-Added Chemicals from Pyrolysis Oil and Syngas. In Sustainable Production of Bulk Chemicals; Xian, M., Ed.; Springer: Dordrecht, The Netherlands, 2016; pp. 69–105. ISBN 9789401774758. [Google Scholar]
  38. Broniatowski, M.; Binczycka, M.; Wójcik, A.; Flasiński, M.; Wydro, P. Polycyclic aromatic hydrocarbons in model bacterial membranes—Langmuir monolayer studies. Biochim. Biophys. Acta (BBA) Biomembr. 2017, 1859, 2402–2412. [Google Scholar] [CrossRef]
  39. Dyrda, G.; Boniewska-Bernacka, E.; Man, D.; Barchiewicz, K.; Słota, R. The effect of organic solvents on selected microorganisms and model liposome membrane. Mol. Biol. Rep. 2019, 46, 3225–3232. [Google Scholar] [CrossRef]
  40. Park, S.; Yasin, M.; Jeong, J.; Cha, M.; Kang, H.; Jang, N.; Choi, I.-G.; Chang, I.S. Acetate-assisted increase of butyrate production by Eubacterium limosum KIST612 during carbon monoxide fermentation. Bioresour. Technol. 2017, 245, 560–566. [Google Scholar] [CrossRef]
  41. Pinto, F.; Lopes, H.; André, R.N.; Gulyurtlu, I.; Cabrita, I. Effect of catalysts in the quality of syngas and by-products obtained by co-gasification of coal and wastes. 1. Tars and nitrogen compounds abatement. Fuel 2007, 86, 2052–2063. [Google Scholar] [CrossRef]
  42. Shahbaz, M.; Yusup, S.; Inayat, A.; Patrick, D.O.; Ammar, M. The influence of catalysts in biomass steam gasification and catalytic potential of coal bottom ash in biomass steam gasification: A review. Renew. Sustain. Energy Rev. 2017, 73, 468–476. [Google Scholar] [CrossRef]
  43. Corella, J.; Toledo, J.M.; Padilla, R. Olivine or Dolomite as In-Bed Additive in Biomass Gasification with Air in a Fluidized Bed: Which Is Better? Energy Fuels 2004, 18, 713–720. [Google Scholar] [CrossRef]
  44. Bugg, T.; Foght, J.M.; Pickard, M.A.; Gray, M.R. Uptake and Active Efflux of Polycyclic Aromatic Hydrocarbons by Pseudomonas fluorescens LP6a. Appl. Environ. Microbiol. 2000, 66, 5387–5392. [Google Scholar] [CrossRef] [PubMed]
  45. Flesher, J.W.; Lehner, A.F. Structure, function and carcinogenicity of metabolites of methylated and non-methylated polycyclic aromatic hydrocarbons: A comprehensive review. Toxicol. Mech. Methods 2016, 26, 151–179. [Google Scholar] [CrossRef]
  46. Patel, A.B.; Shaikh, S.; Jain, K.R.; Desai, C.; Madamwar, D. Polycyclic Aromatic Hydrocarbons: Sources, Toxicity, and Remediation Approaches. Front. Microbiol. 2020, 11, 2675. [Google Scholar] [CrossRef] [PubMed]
  47. Pavela, R. Acute Toxicity and Synergistic and Antagonistic Effects of the Aromatic Compounds of Some Essential Oils against Culex Quinquefasciatus Say Larvae. Parasitol Res 2015, 114, 3835–3853. [Google Scholar] [CrossRef]
  48. Vitale, C.M.; Gutovitz, S. Aromatic Toxicity; StatPearls Publishing: Tampa, FL, USA, 2022. [Google Scholar]
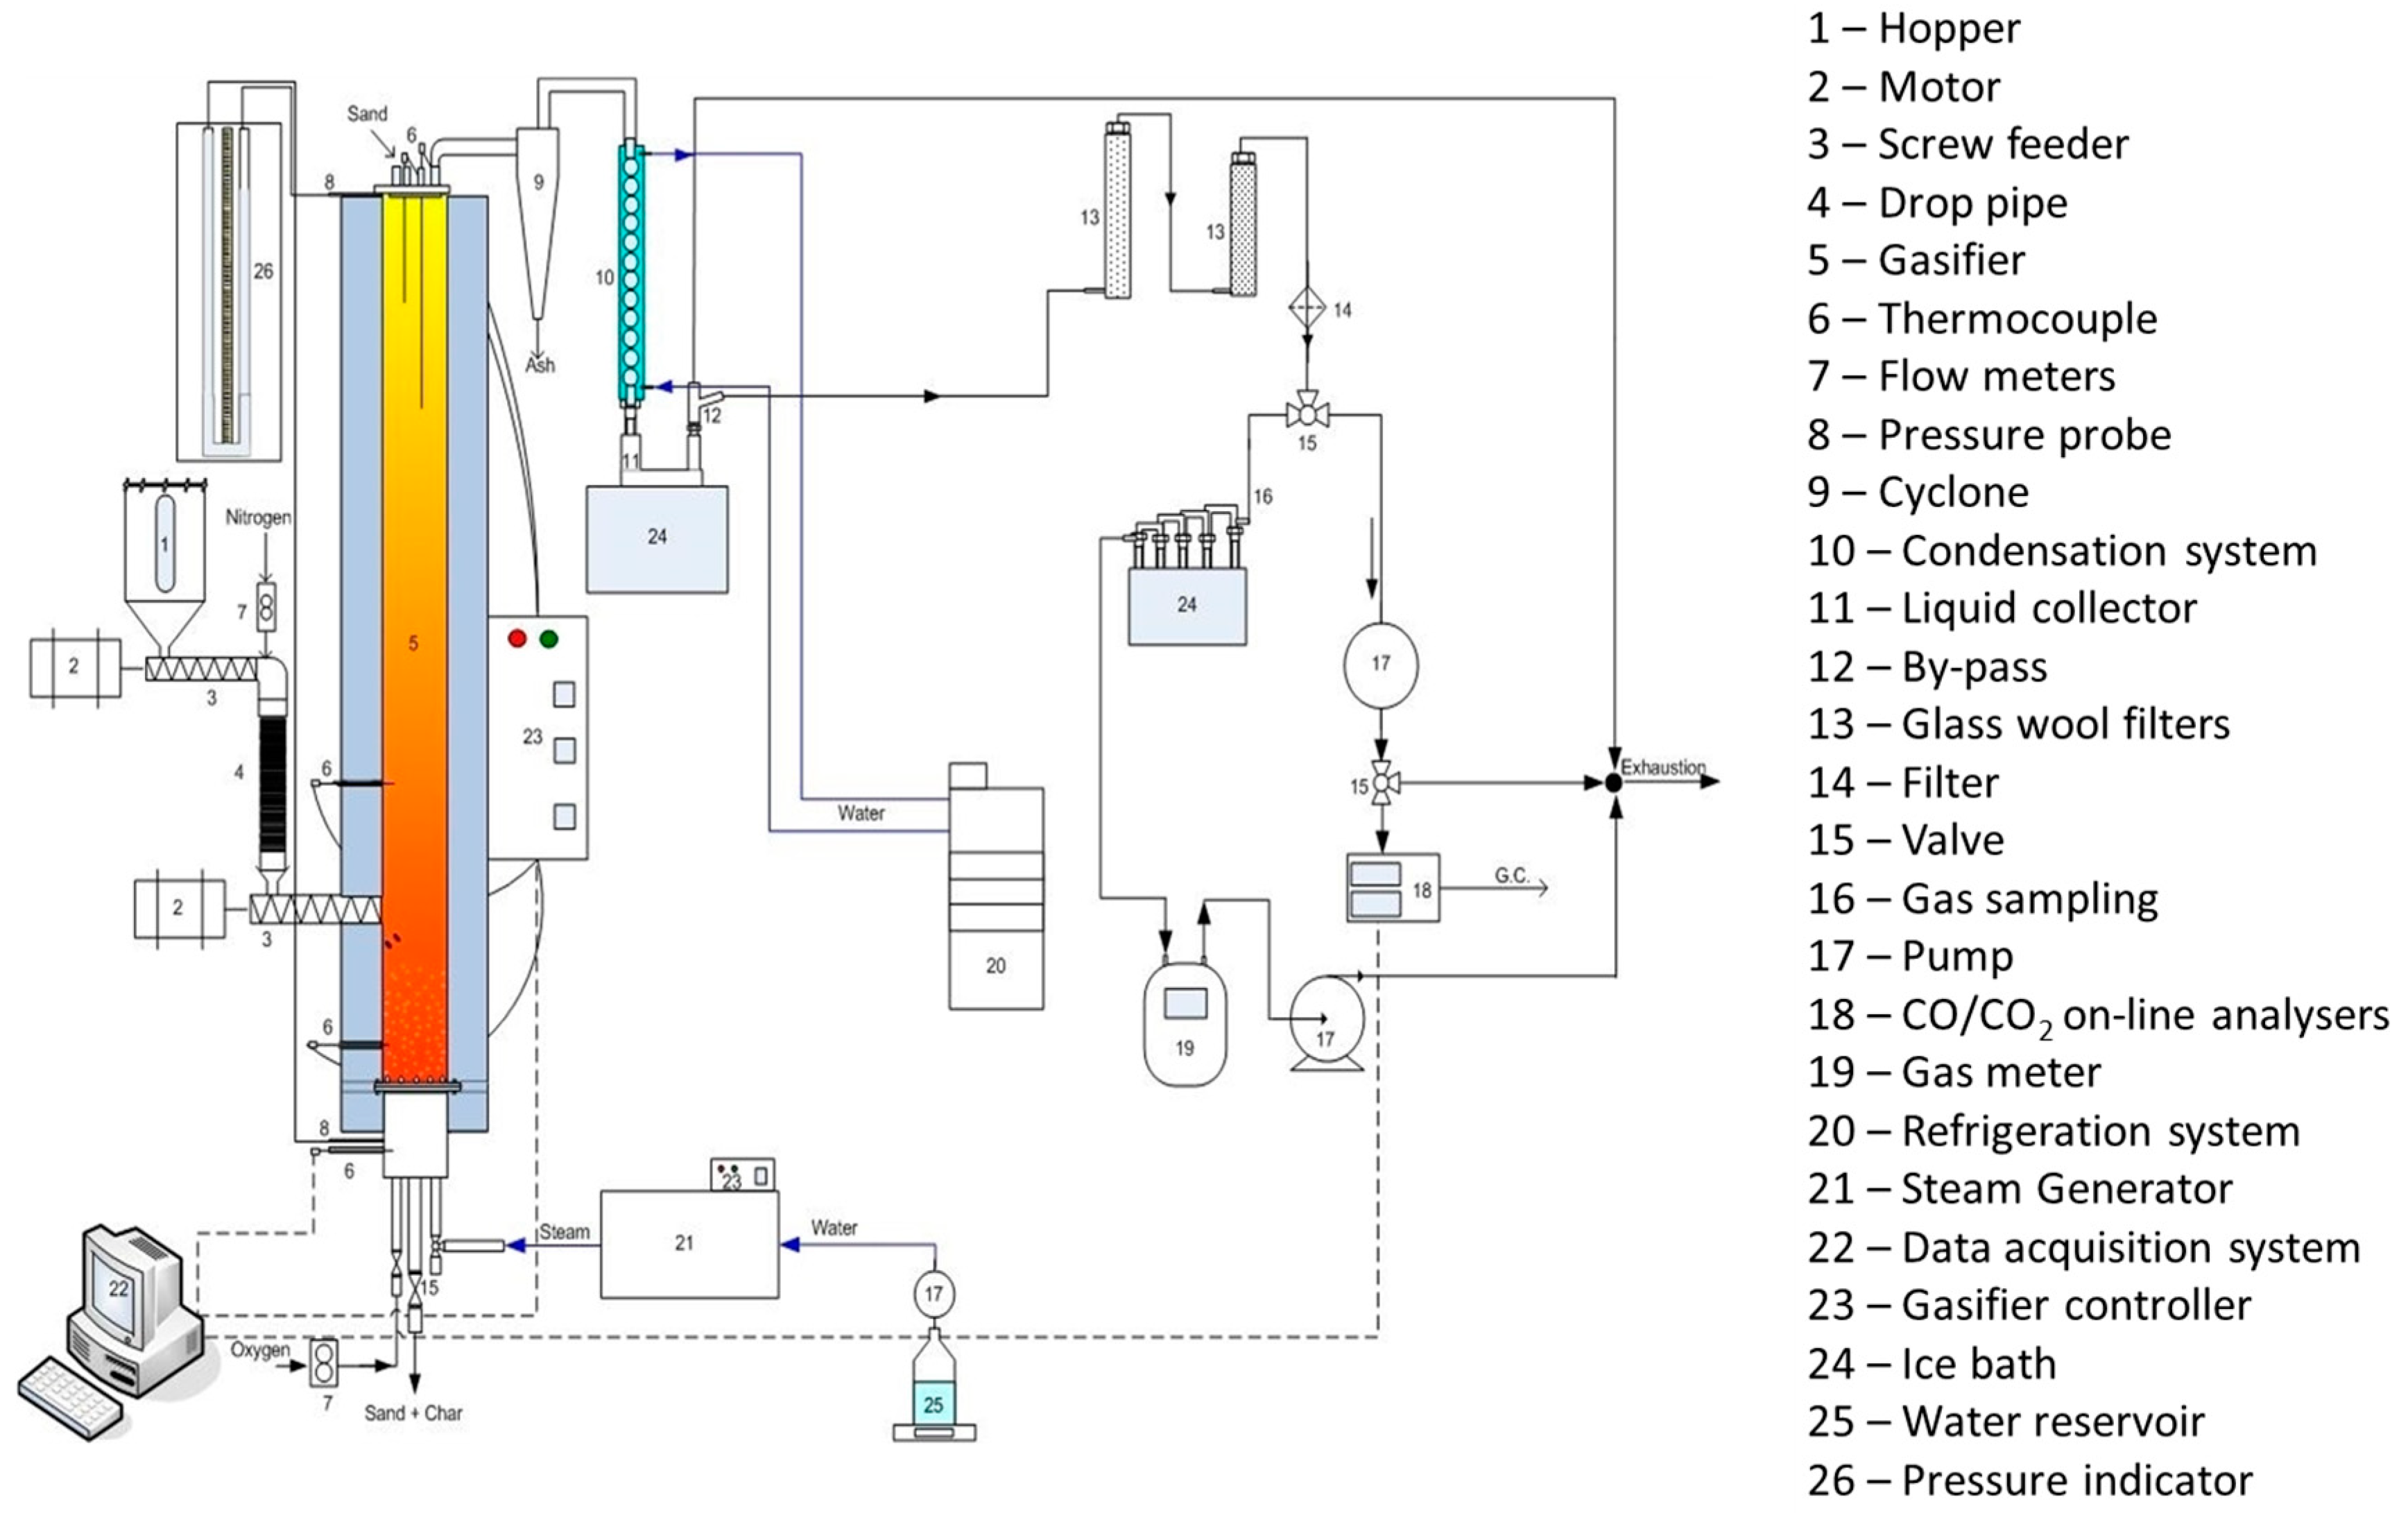
Figure 1. Schematic diagram of the bench-scale fluidized bed gasification system.
Energies 16 01722 g001
Figure 2. Effects of the temperature on CO, CO2, and H2 compositions (a), CH4 and CnHm compositions (b), tar and gas yield, (c) and H2/CO ratio (d) as obtained by the gasification of WST and SW with oxygen and steam (experimental conditions: ER = 0.13, steam/lignin = 0.35 g/g(daf)). NL, volume of syngas in L at standard conditions of temperature and pressure: 293.15 K, 1.0 × 10⁵ Pa absolute pressure.
Energies 16 01722 g002
Figure 3. Mineral compounds quantified in WST and SW by the ICP-AES analysis [3].
Energies 16 01722 g003
Figure 4. Effect of the catalyst type on (a) gas composition and H2/CO ratio, and (b) tar content and high heating value (HHV), as obtained by gasification of WST at 800 °C with oxygen and steam, ER = 0.13, steam/lignin = 0.35 g/g(daf). Silica sand was used as fluidization medium, with or without the addition of each catalyst. NL, volume of syngas in L at standard conditions of temperature and pressure: 293.15 K, 1.0 × 10⁵ Pa absolute pressure.
Energies 16 01722 g004
Figure 5. Effect of the catalyst type on NH3 and H2S concentrations in the syngas produced by WST gasification at 800 °C, ER = 0.13, steam/lignin = 0.35 g/g(daf); ppmv, parts per million in volume.
Energies 16 01722 g005
Figure 6. Optical density and pressure variation (ΔP) (a), and acetate and butyrate production (b) by B. methylotrophicum at 72 h while growing from syngas in the absence or presence of syngas condensates Cond3 to Cond6, obtained during the gasification of WST using different catalysts.
Energies 16 01722 g006
Table 1. Proximate, ultimate and ash compositions of WST and SW [3].
WSTSW
Proximate analysis (wt.%, dry basis)
Volatile matter64.672.1
Ash 550 °C14.00.1
Ultimate analysis (wt.%, dry basis)
C47.257.7
H5.66.2
O33.033.8
N1.30.8
S0.180.13
Cl0.0200.002
ICP-AES 1 analysis (mg/kg, dry basis)
Al38017
Ca4750380
Fe29048
K3250210
Mg38568
Na906390
P930160
S17501300
Si54,000<30
1 ICP-AES, inductively coupled plasma–atomic emission spectrometry.
Table 2. Gasification condensates collected and the respective technical lignin type, gasification temperature, and catalyst.
CondensateLigninGasification Temperature (°C)Catalyst
Cond1WST850-
Cond2SW750-
Cond3WST800-
Cond4WST800Dolomite
Cond5WST800Limestone
Cond6WST800Olivine
Table 3. Distribution by chemical group of the compounds identified by GC-MS in the condensates that were obtained by gasification of WST at 850 °C (Cond1) and SW at 750 °C (Cond2) in a BFB gasifier.
Group SpecificationCond1Cond2
No. of Compounds 1Total Percentage (%)Relative Percentage (%)No. of Compounds 1Total Percentage (%)Relative Percentage (%)
Ions12071114
Carboxylic acids17-0
Secondary Amines-014
Nitriles1714
Identified compounds3 3
AromaticsHydrocarbons18071894
Benzene213414
Pyrroles-014
Pyridines533621
Pyrimidines213414
Pyrazines-027
Quinolines17-0
Indoles-027
Phenols17414
Furans-014
Identified aromatics12 25
Total identified compounds15 28
1 Number of compounds identified by GC-MS.
Table 4. Growth, acetate, and butyrate production by B. methylotrophicum during syngas fermentation with or without supplementation of Cond1 or Cond2.
Without CondensateCond1Cond2
1:100 (vol.)1:1000 (vol.)1:100 (vol.)1:1000 (vol.)
Max. CDW (g/L)1.19 ± 0.031.04 ± 0.001.15 ± 0.061.10 ± 0.021.13 ± 0.02
OD (600 nm)0.750.110.670.590.76
Acetate (mM)12.6 ± 0.9n.d 18.7 ± 1.315.5 ± 2.610.8 ± 1.9
Butyrate (mM)3.0 ± 0.00.4 ± 0.04.5 ± 0.21.3 ± 0.34.5 ± 0.1
Butyrate/Acetate (mol/mol)0.2 ± 0.0-0.5 ± 0.10.1 ± 0.00.4 ± 0.1
1 n.d—not detected.
Table 5. Distribution by chemical group of the compounds identified by GC-MS in the condensates that were obtained by gasification of WST at 800 °C in the presence of different catalysts. Cond5 and Cond6 gasification conditions are described in Table 2.
Group SpecificationCond5 (Limestone + Silica Sand)Cond6 (Olivine + Silica Sand)
No. of Compounds 1Total Percentage (%)Relative Percentage (%)No. of Compounds1Total Percentage (%)Relative Percentage (%)
Ions11631143
Carboxylic/Fatty acids25-0
Nitriles38411
Identified compounds6 6
AromaticsHydrocarbons28453868
Benzene410513
Imidazoles13-0
Pyrroles1313
Pyridines14371438
Pyrimidines3838
Pyrazines2513
Quinolines1313
Indoles1313
Phenols1313
Furans2525
Identified Aromatics32 32
Total identified compounds38 37
1 Number of compounds identified by GC-MS.
Table 6. Distribution by chemical group of the compounds identified by GC-MS in the condensates that were obtained by gasification of WST at 800 °C in the presence of different catalysts. Cond3 and Cond4 gasification conditions are described in Table 2.
Group SpecificationCond3 (Silica Sand)Cond4 (Dolomite + Silica Sand)
No. of Compounds 1Total Percentage (%)Relative Percentage (%)No. of Compounds 1Total Percentage (%)Relative Percentage (%)
Ions110313813
Carboxylic acids-0113
Nitriles38113
Identified compounds4 3
AromaticsHydrocarbons290516313
Benzene615338
Imidazoles-0-0
Pyrroles38-0
Pyridines1538113
Pyrimidines38-0
Pyrazines13-0
Quinolines25-0
Indoles13-0
Phenols13-0
Furans13-0
Identified Aromatics35 5
Total identified compounds39 8
1 Number of compounds identified by GC-MS.
Table 7. Growth, acetate, and butyrate production by B. methylotrophicum during syngas fermentation in the presence or absence of 1:1000 vol. of Cond3 to Cond6.
Without CondensateCond3Cond4Cond5Cond6
ΔPressure (atm) 10.36 ± 0.060.11 ± 0.010.42 ± 0.000.30 ± 0.070.41 ± 0.00
Max. cellular density (600 nm)0.280.260.320.270.31
Acetate (mM)7.0 ± 0.58.8 ± 0.43.9 ± 0.95.3 ± 0.23.6 ± 0.4
Butyrate (mM)3.2 ± 0.01.9 ± 0.33.9 ± 0.33.4 ± 0.54.5 ± 0.1
Butyrate/Acetate (mol/mol)0.5 ± 0.00.2 ± 0.01.0 ± 0.20.6 ± 0.11.3 ± 0.2
1 Pressure variation inside the serum flasks ( Δ P = P i P 72 h ) measured at standard conditions of temperature and pressure (temperature of 25 °C (293.15 K) and absolute pressure of 1.0 × 10⁵ Pa). Pi represents the initial pressure that was measured at t = 0 h.
Disclaimer/Publisher’s Note: The statements, opinions and data contained in all publications are solely those of the individual author(s) and contributor(s) and not of MDPI and/or the editor(s). MDPI and/or the editor(s) disclaim responsibility for any injury to people or property resulting from any ideas, methods, instructions or products referred to in the content.