Article

Energy, Exergy, and Economic (3E) Analysis of Transcritical Carbon Dioxide Refrigeration System Based on ORC System

1
Tianjin Key Laboratory of Refrigeration Technology, School of Mechanical Engineering, Tianjin University of Commerce, Tianjin 300134, China
2
Shandong Agricultural Exchange and Cooperation Center, Jinan 250100, China
*
Author to whom correspondence should be addressed.
Energies 2023, 16(4), 1675; https://doi.org/10.3390/en16041675
Submission received: 13 December 2022 / Revised: 14 January 2023 / Accepted: 6 February 2023 / Published: 8 February 2023

Abstract

:
This paper used the energy, exergy, and economic analysis of a carbon dioxide (CO2) transcritical two-stage compression system based on organic Rankine cycle (ORC) waste heat recovery technology. When the intermediate pressure and high-pressure compressor outlet pressure were changed, respectively, this study simulated the change in system energy efficiency by adding the ORC for waste heat recovery, calculated the ratio of exergy loss of each component, and performed an economic analysis of the coupled system. The results show that adding waste heat recovery can effectively increase the energy efficiency of the system, and among all components, the heat exchanger had the largest exergy loss, while the evaporator had the highest capital investment and maintenance costs.

1. Introduction

The environment is deteriorating, and climate change is becoming worse. People are growing more concerned about the environment and energy saving. From 1 November to 12 November, 2021, the United Nations Climate Change Conference was held in Glasgow, Scotland. The meeting called for maintaining the Paris Agreement’s mandate to limit global temperature rise to 1.5 degrees Celsius and phase out coal use. Because of the global warming impact of HFCS, the refrigeration and air conditioning industry has made the search for acceptable refrigerants to replace existing CFCS and HFCS a key priority. Positives include the progress that has been made in the development of environmentally friendly refrigerants and nanoscale refrigerants [1], and some natural refrigerants such as carbon dioxide, ammonia, and hydrocarbons (R290, R600, and R600a) are now being considered as long-term alternatives to CFCs [2]. Discussing refrigerant replacement and optimization from the standpoint of energy conservation and emission reduction can put us on the right path for our future efforts [3]. Zhao Yang [4] comprehensively compared the performance parameters of several typical alternative refrigerants and conducted relevant studies on the flammability of low GWP and flammable refrigerants. Similarly, Madhu Sruthi Emani [2], Cenker Aktemur [5], and Tomasz Halon et al. [6] discussed the differences in system performance where different natural refrigerants were used and proposed improvements. These studies provide a reference for us to select refrigerants in the future.
CO2 is one of the oldest natural fluids, with hundreds of years of history, no environmental harm, an ozone depletion potential (ODP) of 0, a global warming ozone depletion potential (GWP) of 1, is non-toxic and non-flammable, and has a higher density than air, CO2 has more advantages in refrigeration than the traditional working media. J M Belman-Flores [7] wrote an article to systematically introduce the material properties and common application scenarios of CO2. In recent decades, many scientists have worked to improve the efficiency of CO2 refrigeration systems, contributing to many practical applications. Relevant studies have demonstrated that the selection of components such as expanders [8], internal heat exchangers [9], and the heat exchanger of the supercooler [10] will affect the efficiency of the system. Instead of optimizing a single component, Feng Zhang [11] proposed two new CO2 power cycles that make better use of waste heat from engine exhausts, and Baomin Dai [12] proposed a novel attempt to use a new configuration such as a thermoelectric (TE) supercooler and expander (TES + EXPHM and TES + EXPML) in the transcritical CO2 refrigeration cycle, which greatly improved the system performance.
In addition to the optimization and improvement in the system components above-mentioned, researchers have found that CO2 has excellent physical properties and there is a large research space in efficient energy conversion technologies represented by supercritical and transcritical CO2 refrigeration cycles. At present, scholars have made significant progress in the research of the supercritical carbon dioxide cycle and transcritical CO2 cycle, which is of guiding significance to the actual production and life. On one hand, for the supercritical carbon dioxide cycle, Francesco Crespi [13] comprehensively analyzed the supercritical CO2 cycle under 12 similar conditions. Similarly, Jiayao Kang [14] summarized the latest progress of the supercritical CO2 Brayton cycle power generation technology, and the technical challenges between power generation technology and commercial applications were discussed as well as the corresponding solutions. In terms of practical engineering applications, major breakthroughs have been made in relevant studies such as a new type of air liquefy energy storage system powered by wind energy and natural gas integrated with a two-stage supercritical CO2 cycle [15], and a new method integrating the multi-effect distillation (MED) and supercritical carbon dioxide (sCO2) Brayton cycle for the simultaneous production of electricity and freshwater [16]. There are also new hybrid solar tower gas turbine combined power cycles [17] and other innovative designs that are of great help to the actual production and life. On the other hand, for the transcritical CO2 cycle, with regard to the question of how to improve system performance, Aklilu Tesfamichael Baheta [18] discussed the performance of the traditional transcritical CO2 compression refrigeration cycle under different parameters and evaluated the cyclic performance coefficient (COP) value. Considering the operation of the actual system, for the optimization of the transcritical CO2 cycle, some scientists have proposed methods such as connecting ejectors [19], adding internal heat exchangers (TED) (TED-IHX) components [20] and coupling liquid air energy storage (LAES) with the transcritical CO2 cycle [21].
To improve the efficiency of the transcritical CO2 refrigeration cycle, some scholars [22] have previously proposed that the disadvantage of the transcritical CO2 refrigeration cycle’s high emission temperature can be solved by using two-stage compression and internal cooling between two stages. There has been a lot of progress in recent years on how to improve the efficiency of transcritical CO2 two-stage compression systems, and many scientists have proposed increasing the efficiency of the system by adding components such as auxiliary gas coolers [23], a liquid suction heat exchanger (LSHE) [24], ejectors, and flash tanks [25], which have been shown to significantly improve the system performance. Innovatively, several researchers are now focusing on the coupling of the organic Rankine cycle (ORC) and the transcritical CO2 cycle because the recovery of waste heat power generation technology is a hot spot in current research [26]. Furthermore, among the many low-grade thermal power generation technologies, ORC power generation technology is the easiest to be used and promoted.
At present, ORC can be used for solar power generation [27], geothermal power generation [28], biomass power generation [29], etc., which has good development prospects. What is worth our attention is that Tianming Ni [30] recently proposed a new waste heat recovery system combining the transcritical CO2 system, ORC, and compressed heat pump/refrigeration system where the compressed heat pump system can be converted into a compressed cooling system without replacing any equipment, which is conducive to reducing the cost of the system. This provided us with a new idea that ORC could also bind to transcritical CO2 systems.
Based on current research findings, it is reasonable to conclude that the combination of ORC and transcritical CO2 systems is beneficial to system performance; however, there is still a lack of research in this area, so a detailed evaluation of the system is required to determine the degree of performance improvement. This research simulated the performance of a transcritical CO2 refrigeration system based on ORC waste heat recovery technology and analyzed it in terms of the energy, exergy, and economic cost. By comparing the energy efficiency of the independent transcritical CO2 cycle and the coupling system, the advantages of the coupling system can be intuitively reflected, and the exergy loss rate and the economic costs of each component of the coupling system can be computed to guide practical operation.

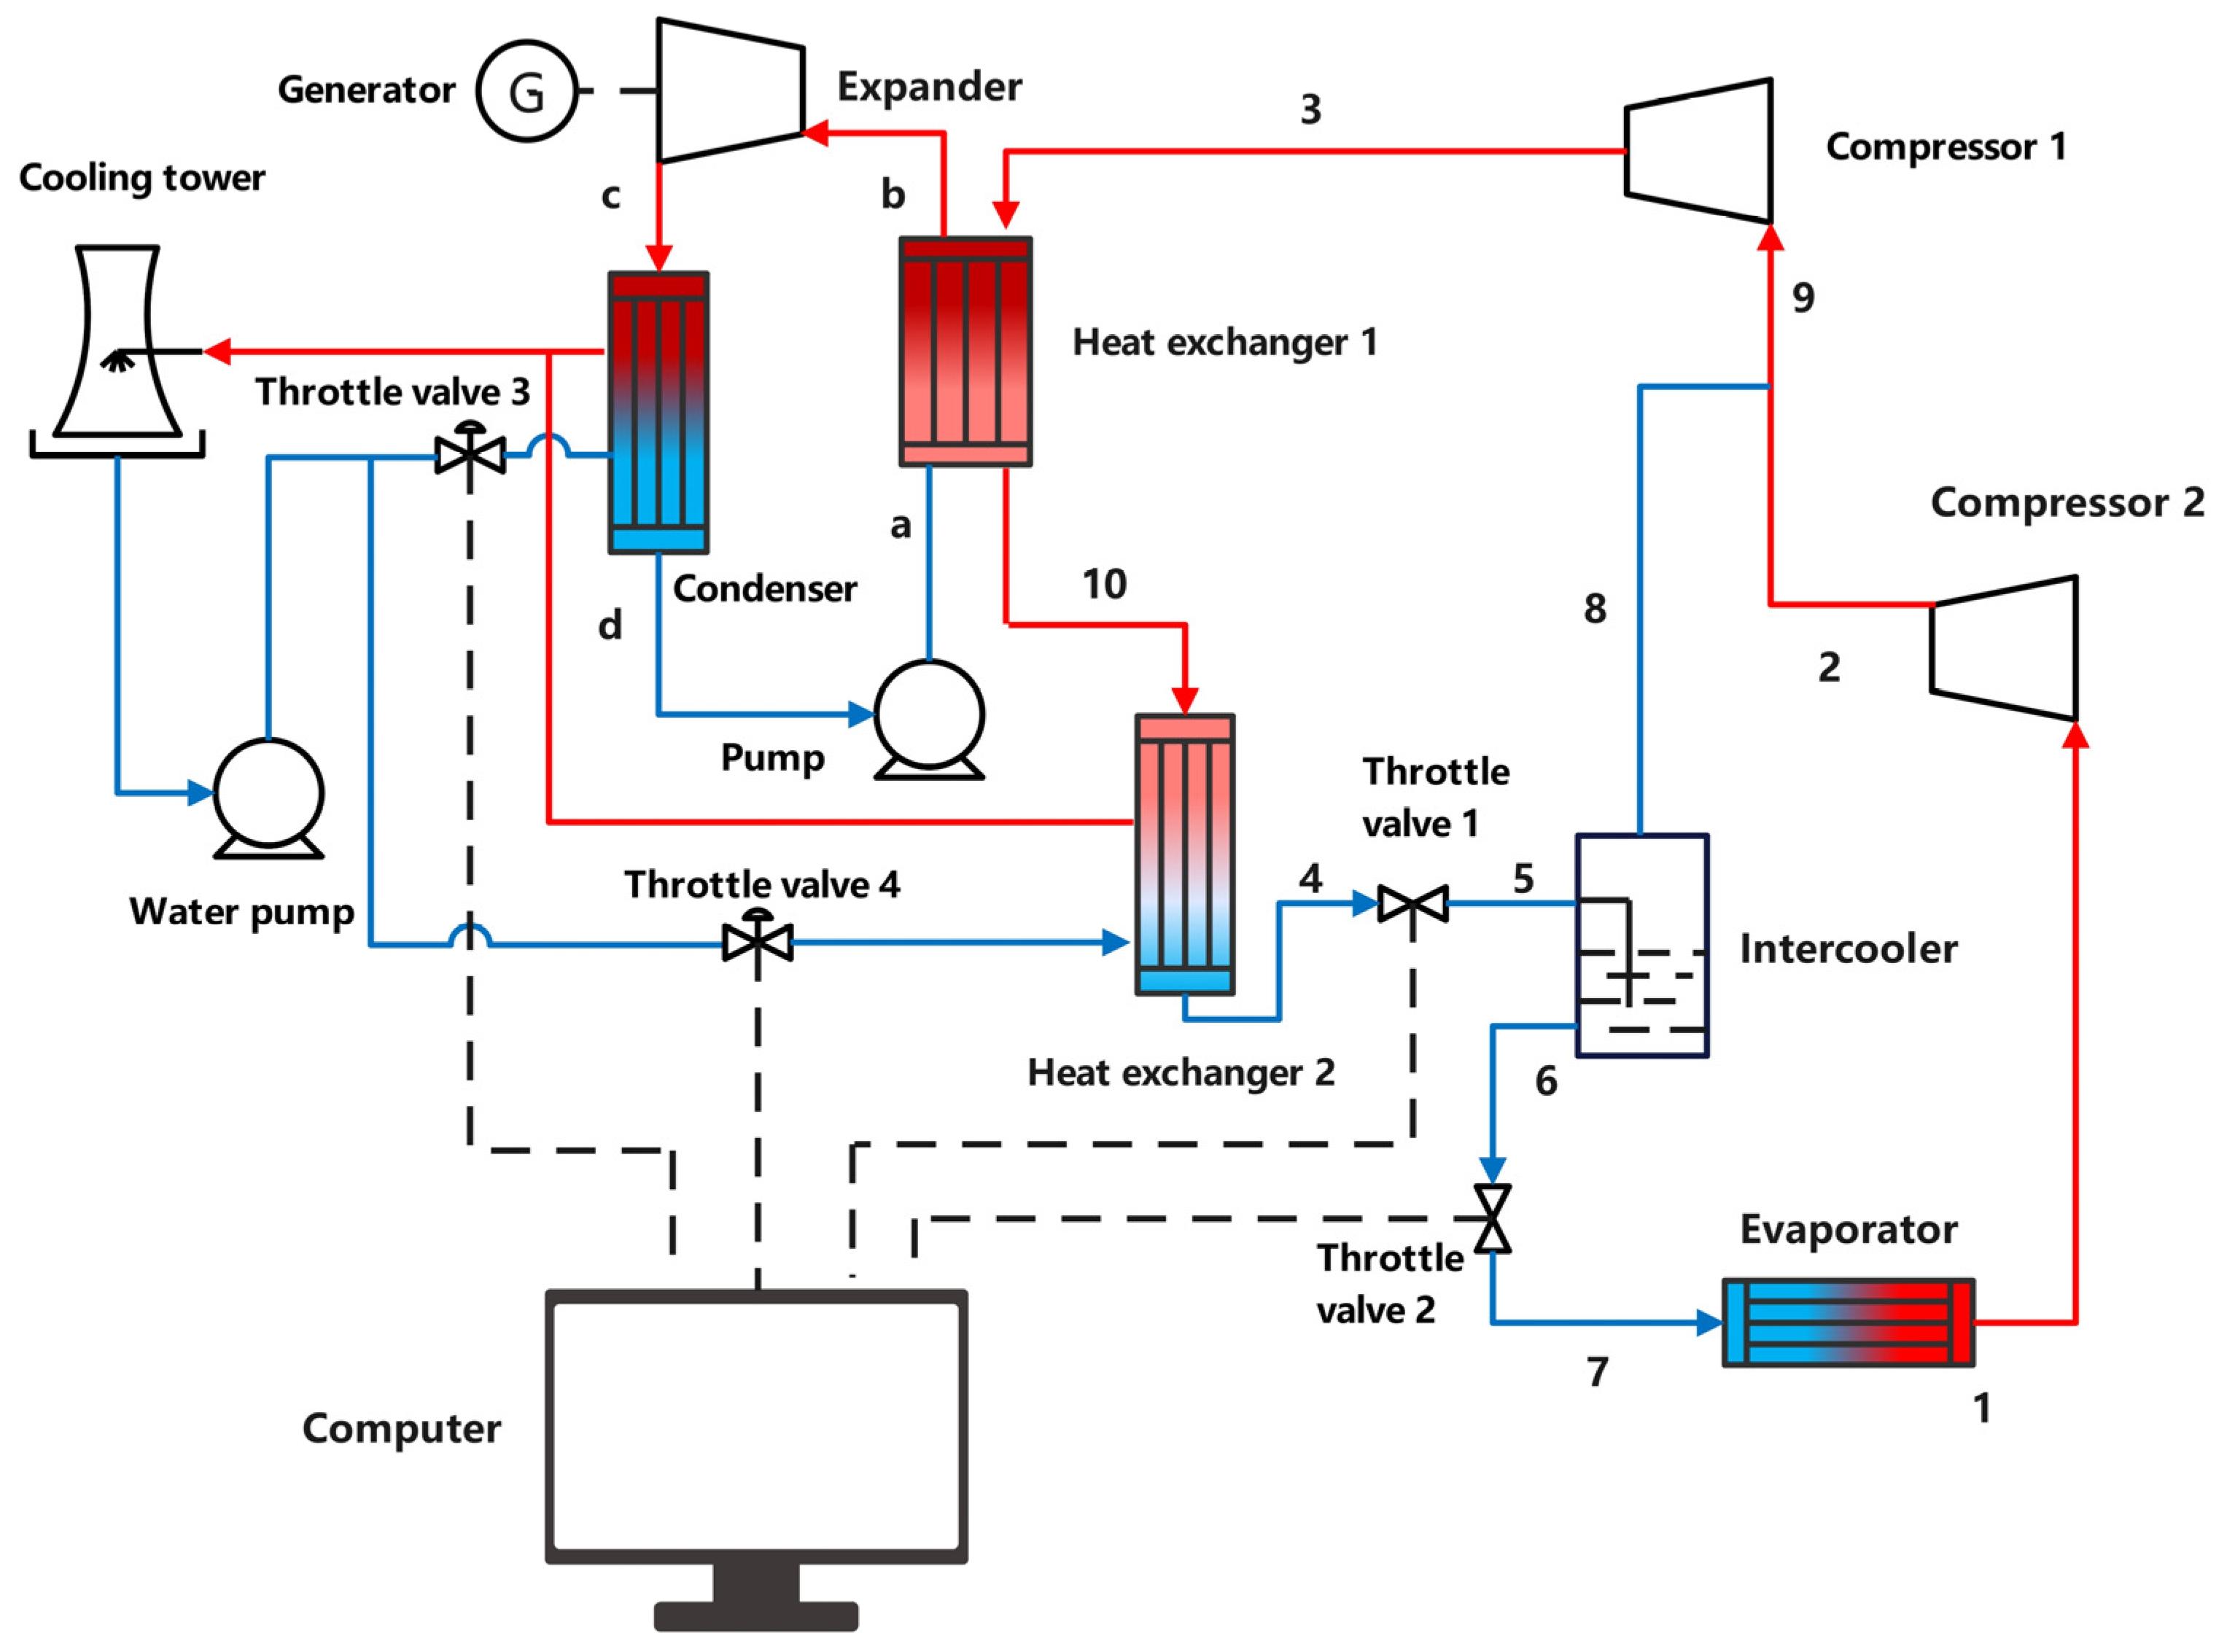
2. System Description

The coupled cycle in this paper is shown in Figure 1, which consists of an ORC cycle and a CO2 transcritical two-stage compression cycle. The ORC cycle consisted of a heat exchanger 1, an expander, a condenser, and a pump, and the working fluid was the refrigerant R245fa. The CO2 cycle consisted of two compressors, two heat exchangers, a throttle, an evaporator, and an intercooler. These two independent cycles were coupled through heat exchanger 1, which acts as the evaporator for the ORC cycle and gas cooler for the CO2 cycle. It is also worth noting that the valves of the system can be controlled by a computer.
In the CO2 transcritical cycle, compressor 2 is a low-pressure compressor and compressor 1 is a high-pressure compressor. Compressor 2 compresses the refrigerant vapor from the evaporating pressure to the intermediate pressure, and compressor 1 compresses it from the intermediate pressure to the pressure at heat exchanger 1. CO2 is cooled by heat exchanger 1 and then cooled to the desired temperature by the cooling tower for a second time in heat exchanger 2. The liquid at the bottom of the intercooler is throttled by throttle valve 2 and then enters the evaporator. The saturated vapor at the top is mixed with the exhaust gas from the low-pressure compressor and then drawn in by the high-pressure compressor. In the ORC cycle, the expander delivers electricity to the outside through a generator, the condenser is cooled by the cooling tower, and the working fluid obtains the required heat by heat exchange with CO2 through the heat exchanger 1.

3. Modeling and Analysis

The relevant computational ideas for this study are shown below, and the modeling calculations were performed using MATLAB R2016b [31] and REFPROP 9.0 [32] software.

3.1. Assumption of the Model

On the basis of the following five hypotheses, the thermodynamic assessment of the ORC coupled with transcritical CO2 in two stages of the compression refrigeration cycle was performed as follows.
  • Modeling and subsequent calculation under steady-state conditions;
  • In the compression process, the efficiency of the high-pressure and low-pressure compressor was constant, both of which were 0.75 [33];
  • In the throttling process, all were treated in accordance with constant enthalpy;
  • The kinetic energy and potential energy were ignored;
  • Exergy loss due to flow in the pipeline was ignored.

3.2. Thermodynamic Model

The coupling system’s thermodynamic analysis was performed by utilizing the assumptions provided in the previous section. To assess the overall performance of the system, the energy and exergy balance equations were applied to the components of the proposed system, namely, the heat exchanger, compressor, condenser, throttle valve, and pump, based on these assumptions. The temperature entropy (T–S) diagram of the coupled cycle of ORC and CO2 transcritical cycle is shown in Figure 2. Table 1 summarizes the specific formulas for each system component. In addition, Table 2 lists the input values of the parameters used in the thermodynamic analysis.
REFPROP was used to measure the relevant thermodynamic properties of the refrigerant in the system. At the same time, we must bear in mind that the system model for this study was created in the MATLAB environment, so we used a specific MATLAB function to access the REFPROP database to collect the necessary thermodynamic data.
The optimal intermediate pressure ( P m ) of the CO2 cycle can be calculated by the following formula:
P m = P 1 × P 3
where P1 and P3 are low-pressure and high-pressure, respectively.
The COP of the independent CO2 cycle ( C O P 0 ) can be calculated by the following formula:
C O P 0 = Q ˙ / W ˙ t
where Q ˙ and W ˙ t are the cooling capacity and the total power consumption of the compressors, respectively.
The network of the ORC cycle can be shown as follows:
W ˙ n e t = M ˙ o r c ( h b h c ) η 3 M ˙ o r c ( h a h d )
The overall COP of the coupled system ( C O P t o t ) can be calculated as follows:
C O P t o t = Q ˙ / ( W ˙ t W ˙ n e t )
The COP change rate (RC) of the coupled system compared with the independent CO2 cycle can be found in the following formula:
R C = C O P t o t C O P 0 C O P 0 × 100 %

3.3. Economic Analysis Model

In this paper, the total annual cost of the system was divided into two parts for the calculations: one part was the operating cost of the system, the other part was the capital investment cost and maintenance cost of each component of the system [35].
C ˙ t o t a l = Z ˙ o p + k Z ˙ k
where C ˙ t o t a l is the annual operating cost of the system with the unit $/yr; Z ˙ o p is the annual operating cost of the system in $/yr; Z ˙ k is the annual capital investment cost and maintenance cost of each component of the system in $/yr [35].
Z ˙ o p = N × W ˙ t o t a l × α e l
where N is the annual working time of the system; 4266 h was taken in this paper. α e l is the electricity charge, and the unit is $/kWh; here, we used 0.12 $/kWh. The capital and maintenance cost of the kth system component is calculated as follows [36].
Z ˙ k = Z k × Φ × C R F
where Z k is the cost of the capital, the relational equation in Table 3 can be used to estimate the capital cost of system components or the cost of purchased equipment; Φ is the maintenance factor, which is 1.06; CRF is the capital maintenance factor [37].
Table 3. Cost functions for estimating the capital costs of the components [38].
ComponentCapital Cost Function (Zk)
High-pressure compressor 9624.2 × W ˙
Low-pressure compressor 10167.5 × W ˙
Evaporator 1397 × A 0.89
Throttle valve 114.5 × q ˙ m
Expander 9624.2 × W ˙
Heat exchanger 383.5 × A 0.65
Condenser 1397 × A 0.89
Pump 114.5 × M ˙ o r c
C R F = i ( 1 + i ) n ( 1 + i ) n 1
where i is the annual cost rate, which is 0.14; n is the system life, which is set to 15 years.
A = Q ˙ U 0 F Δ T i m
where A is the surface area of the heat exchanger; Q ˙ is the heat transfer; U 0 is the total heat transfer coefficient of the heat exchanger; and the coefficient of evaporator, heat exchanger and condenser are 0.04, 0.04 and 0.03, respectively [35]. Δ T i m is the logarithmic average temperature difference, and F is the correction coefficient [39].
The calculation process used in this study is shown in Figure 3.

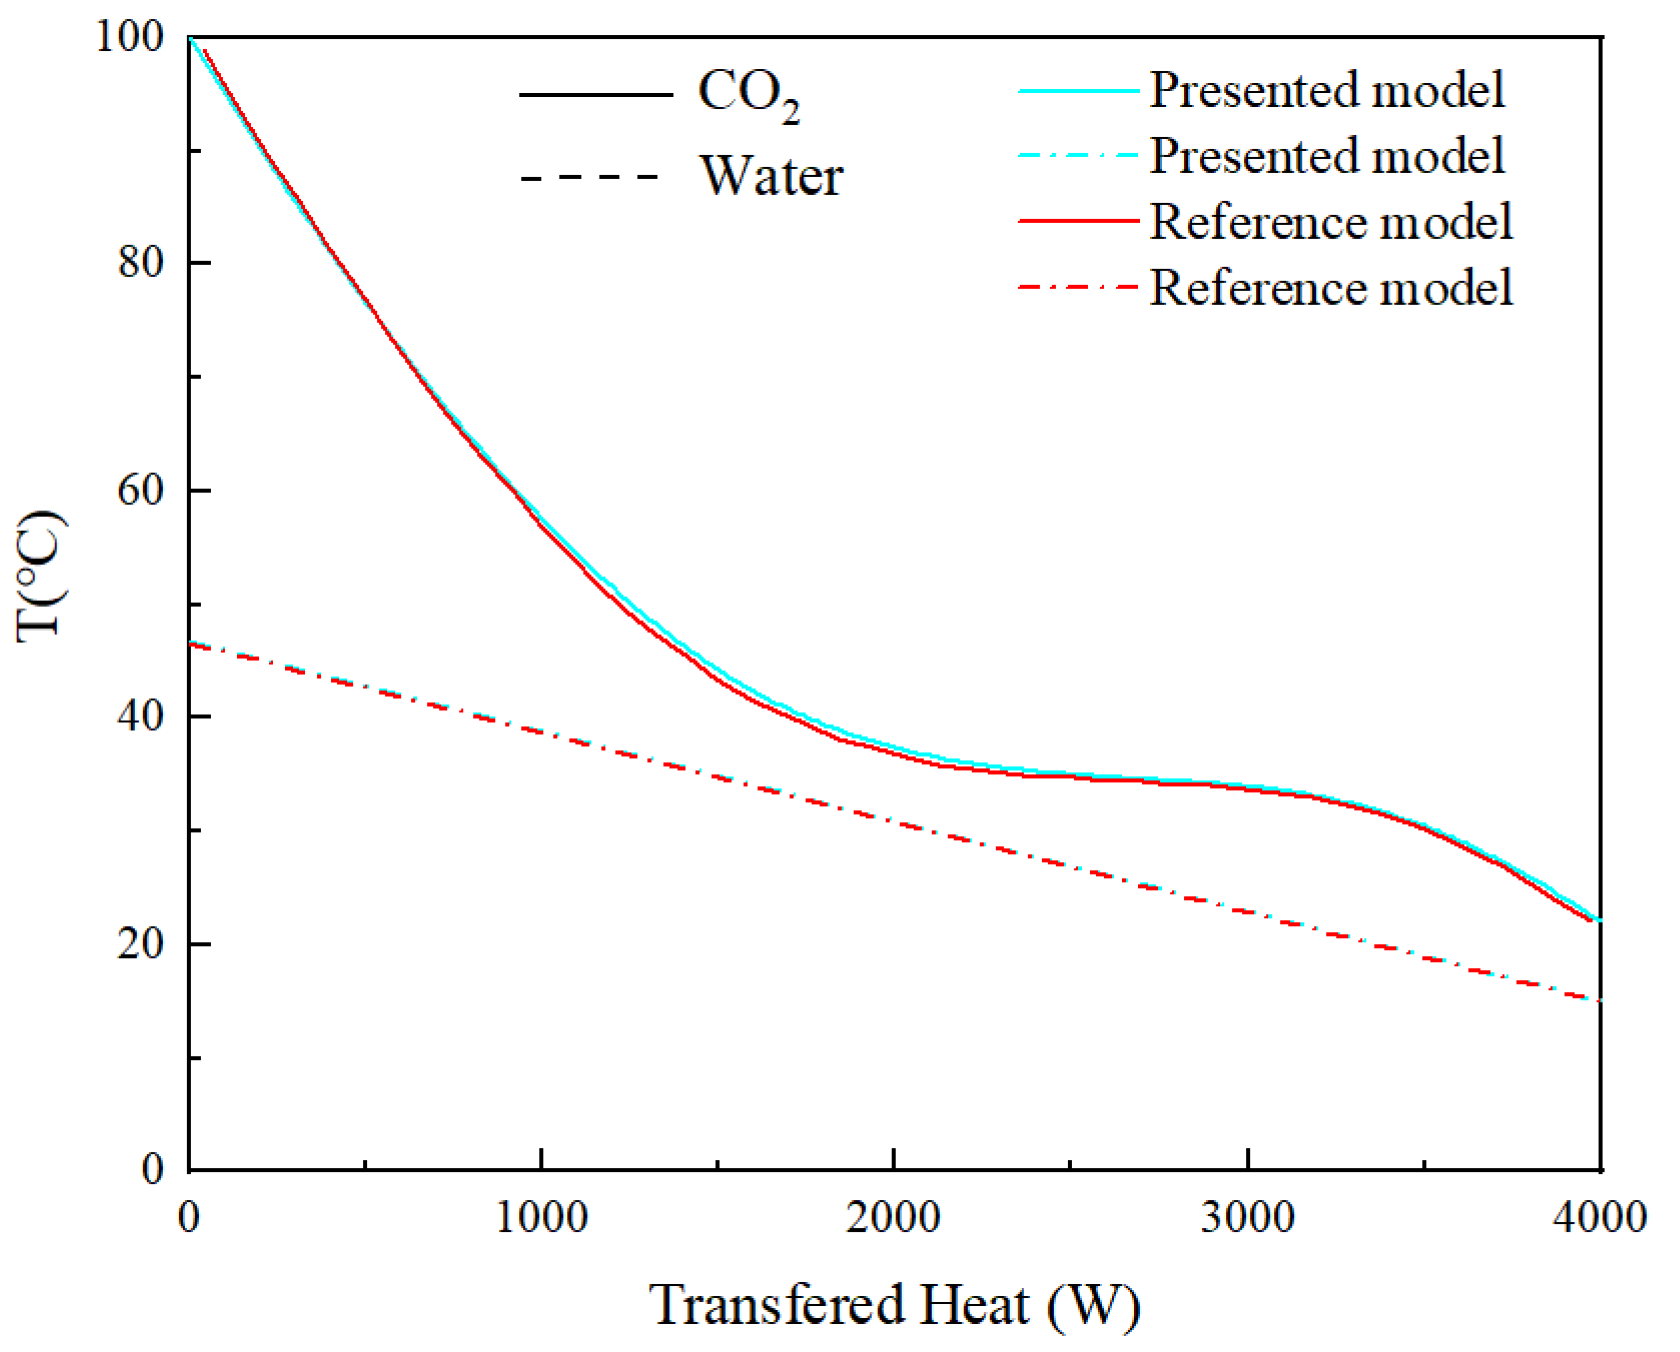
4. Model Verification

In order to ensure the accuracy of the simulation results, modeling calculations were carried out for the single-stage transcritical CO2 cycle and ORC system, respectively, and the corresponding results were compared with those in the literature [18,40]. As can be seen in Table 4 and Table 5, the relative deviation of each dataset was within the acceptable range, which proves the rationality of the simulation calculation.
In addition, as shown in Figure 4, we simulated the temperature distribution inside heat exchanger 1 when the outlet temperature of the high-pressure compressor was 12,000 kPa, and proved that there is no temperature crossover inside this heat exchanger. Meanwhile, as shown in Figure 5, the heat exchange process between water and CO2 was simulated in this paper, and the results are compared with those of the literature [41].

5. Results and Discussion

In this study, the carbon dioxide transcritical two-stage compression cycle and coupling cycle were compared and analyzed. The variation in the coupling system’s parameters directly reflects the overall system’s operation performance.

5.1. Energy Analysis

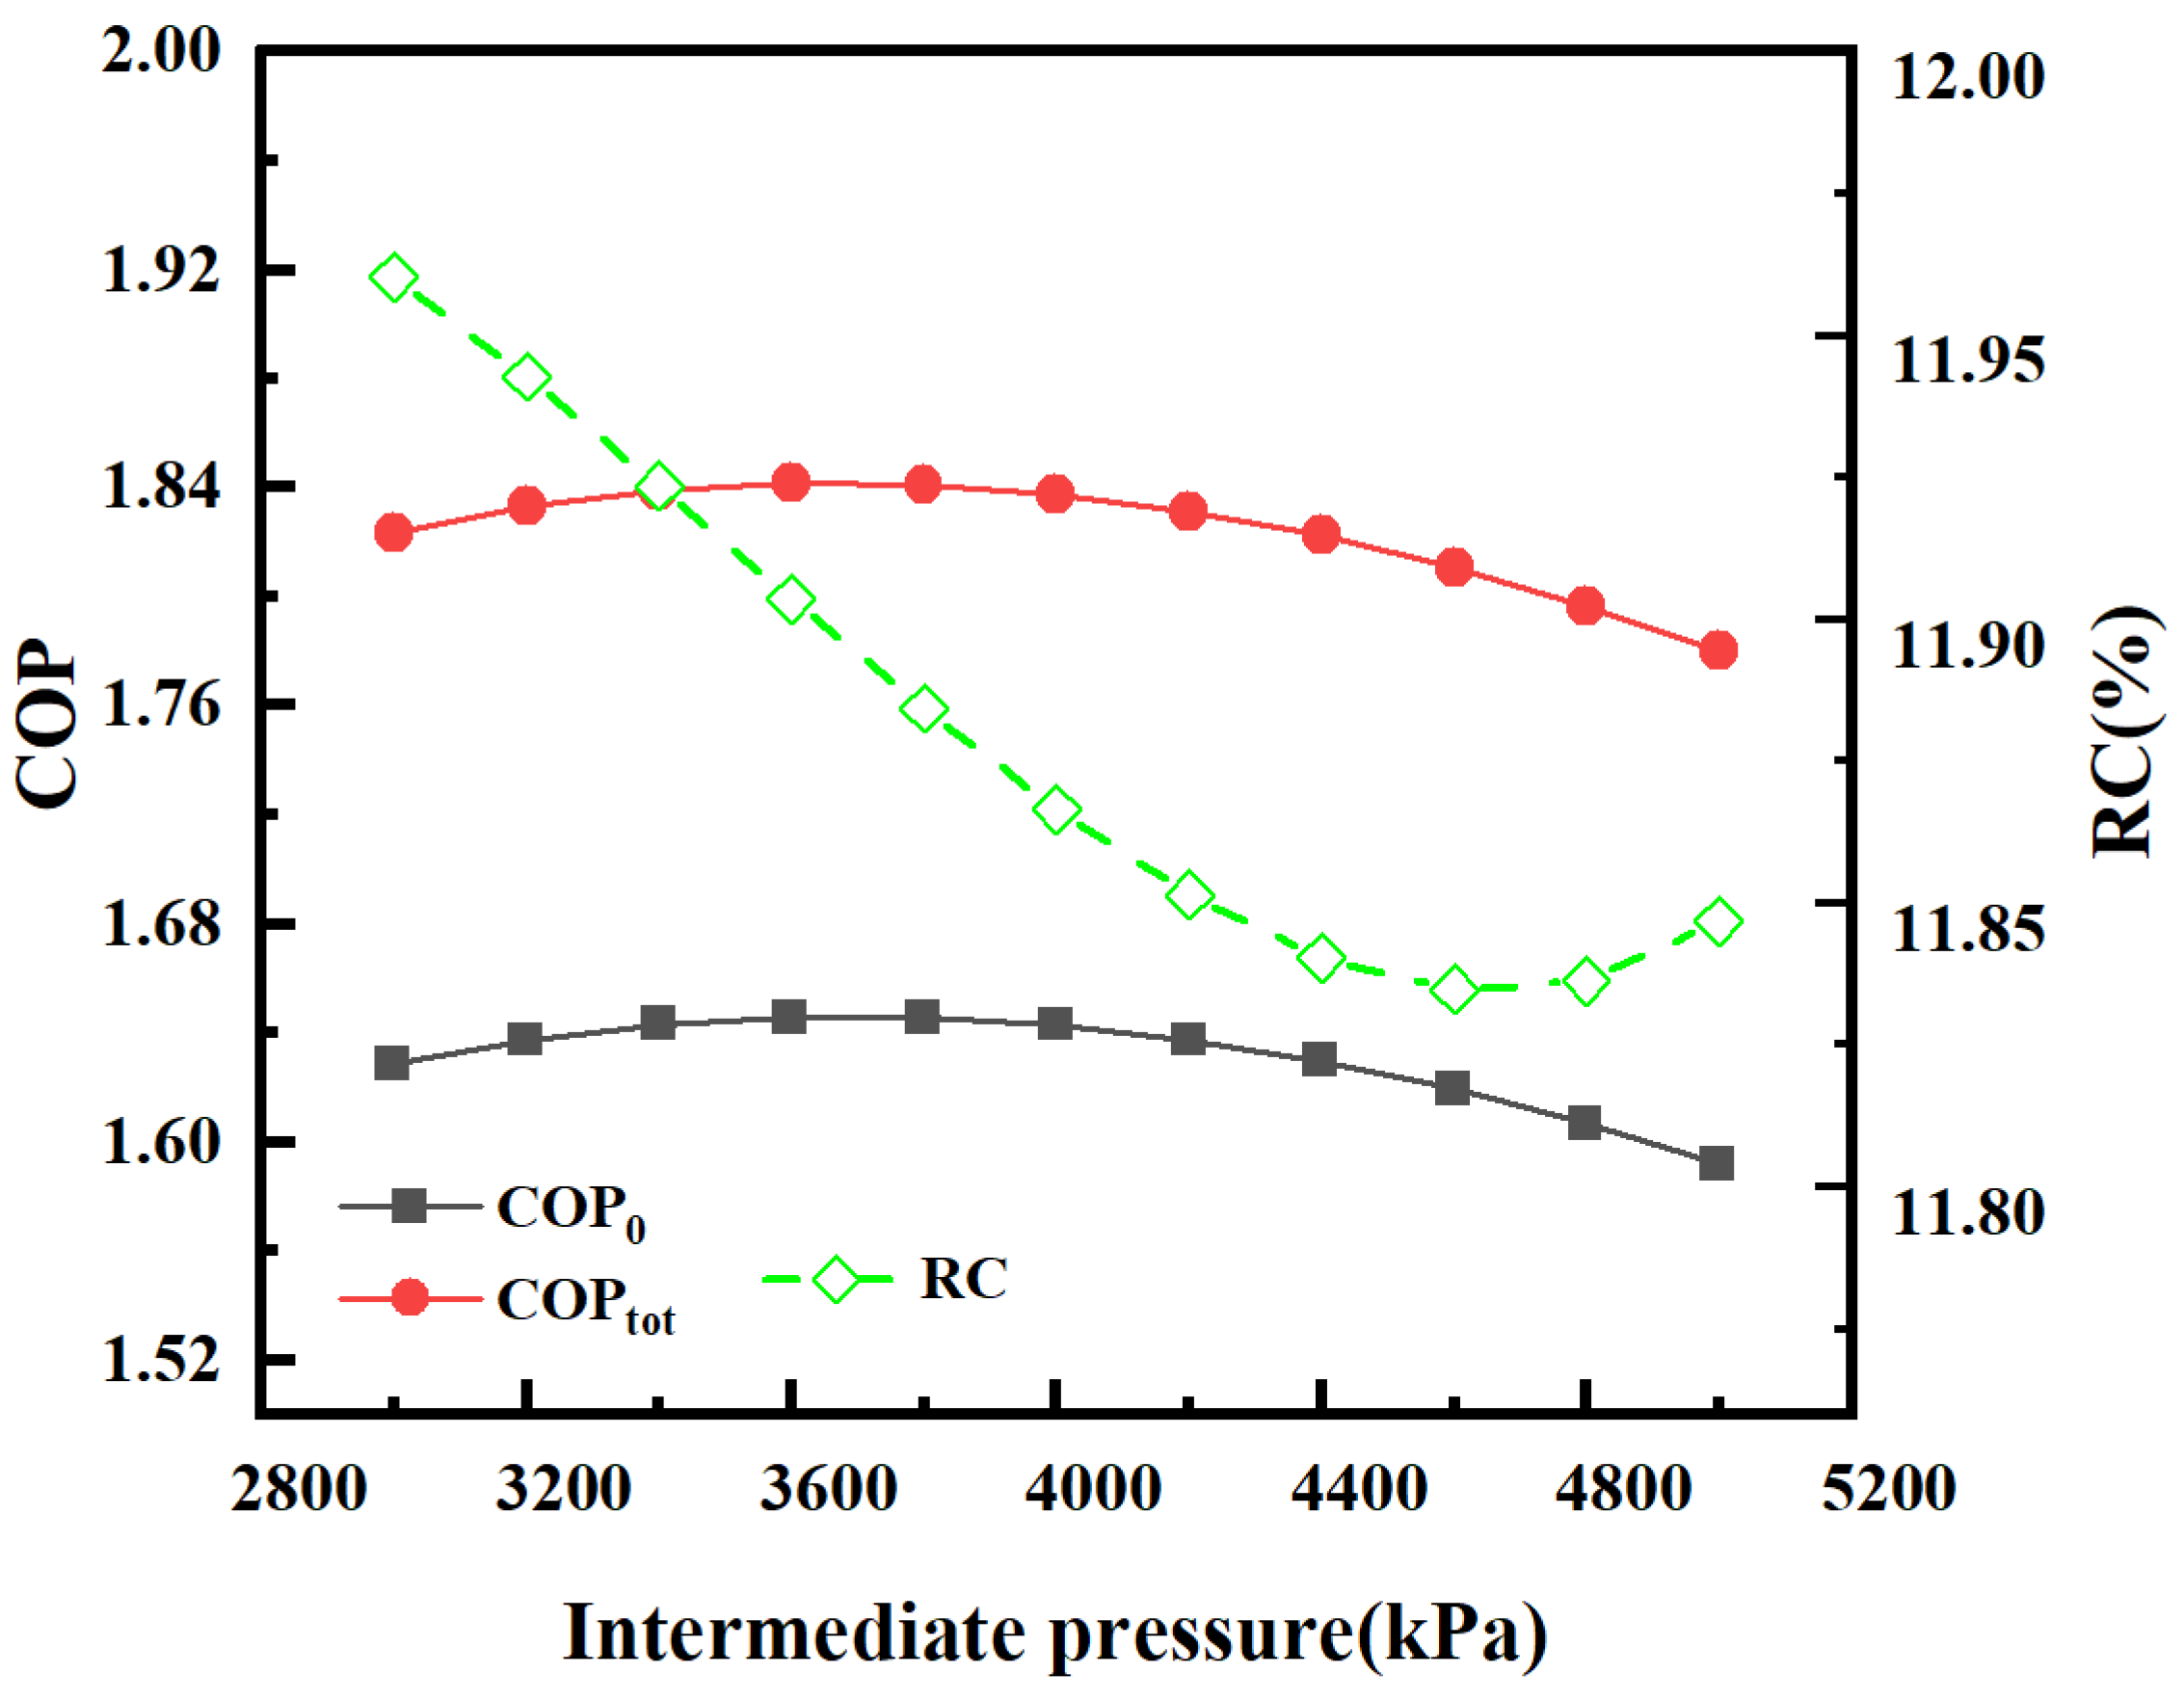
5.1.1. Analysis of Influence of Intermediate Pressure Change on COP

The COP variations of the transcritical CO2 cycle and the coupling cycle versus the intermediate pressure are shown in Figure 6. We set the high-pressure compressor outlet pressure (P3) to 12,000 kPa and changed the intermediate pressure (Pm) from 3000 kPa to 5000 kPa. In this case, the values of both COPtot and COP0 tended to rise first and then fall. As the intermediate pressure rose at the beginning, the overall power consumption of the system decreased, and the rate of increase in the power consumption of the low-pressure compressor at this time was less than the rate of decrease of the high-pressure compressor. However, as the intermediate pressure continued to increase, the rate of increase in the power consumption of the low-pressure compressor was gradually higher than that of the high-pressure compressor, so the overall COP showed such a trend. In addition, compared with the independent CO2 cycle, the COP of the coupled system with the addition of waste heat recovery could be increased by 11.8% to 12%, which shows that our optimization scheme is effective.

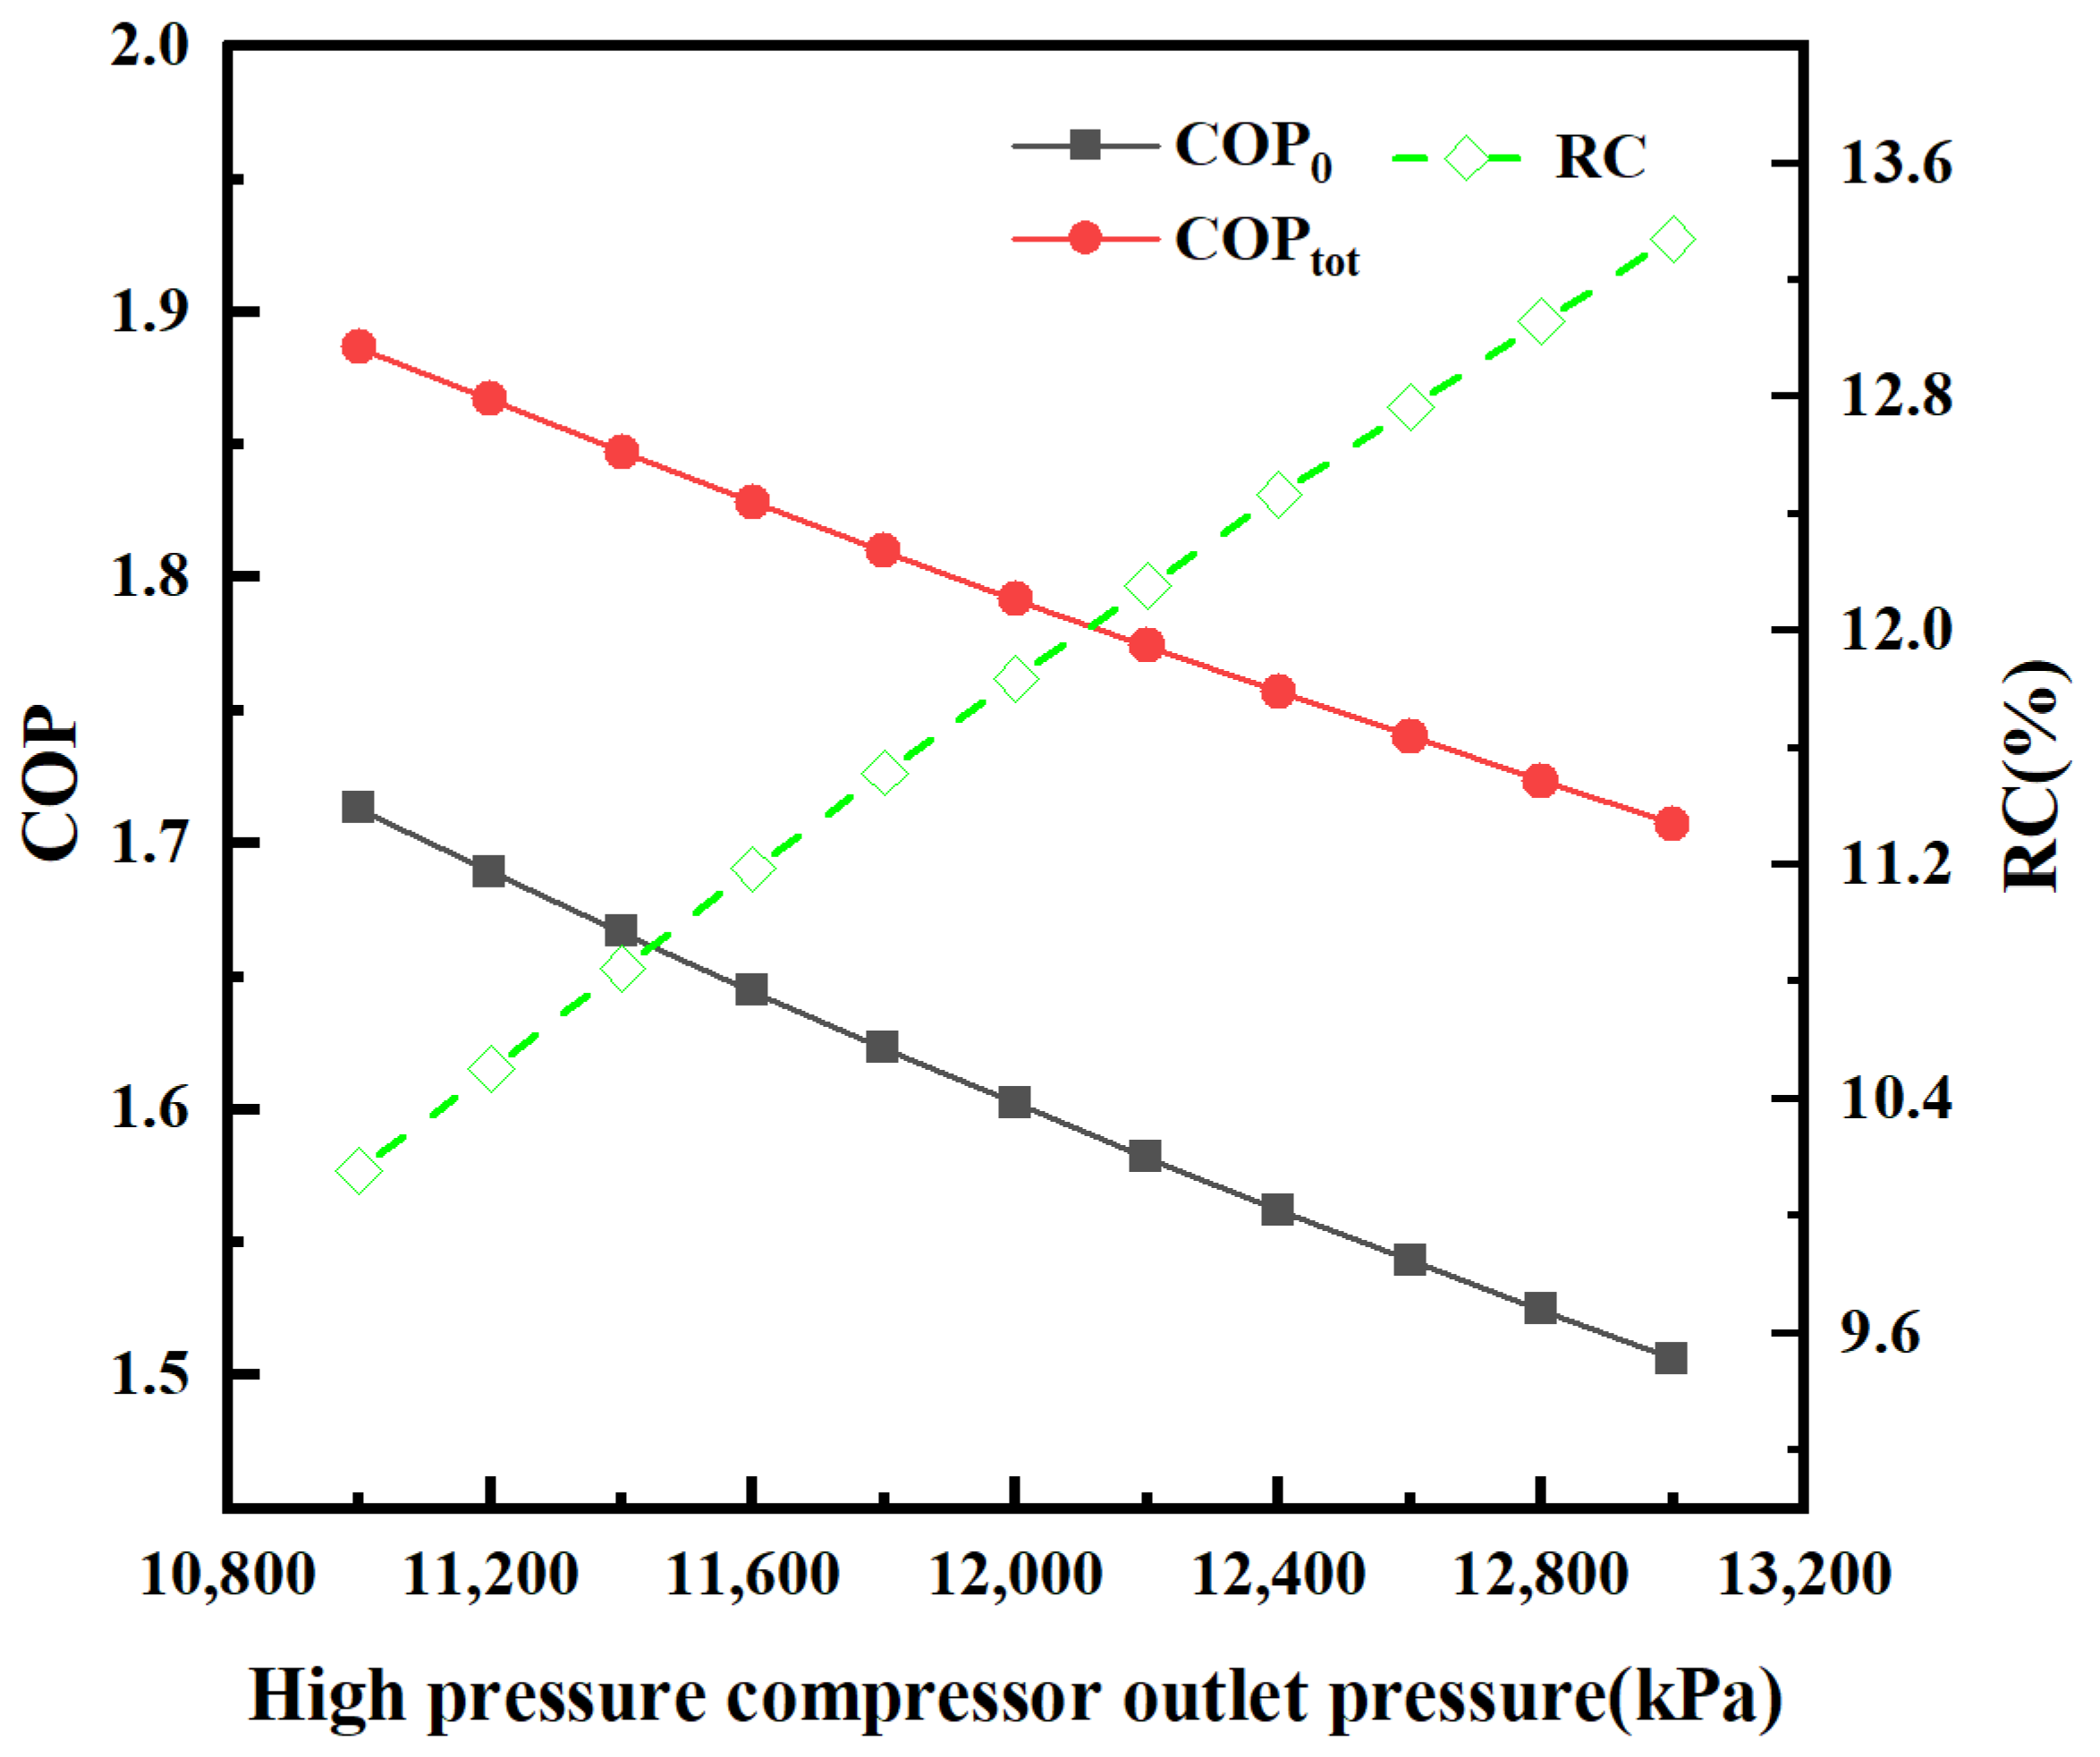
5.1.2. Analysis of Influence of Outlet Pressure on COP of High-Pressure Compressor

Figure 7 shows the COP variation in the CO2 cycle and the coupled cycle in relation to the output pressure of the high-pressure compressor. The intermediate pressure was taken as the optimum value and the high-pressure compressor outlet pressure was varied from 11,000 kPa to 13,000 kPa. In this case, the values of both COPtot and COP0 gradually decreased. As the cooling capacity remained unchanged, the power consumption increased continuously as the compressor outlet pressure increased so it showed the trend in the figure. In addition, the COP of the coupled system could be increased by 10% to 13% after adding waste heat recovery, which shows that our optimization is effective.

5.2. Exergy Analysis

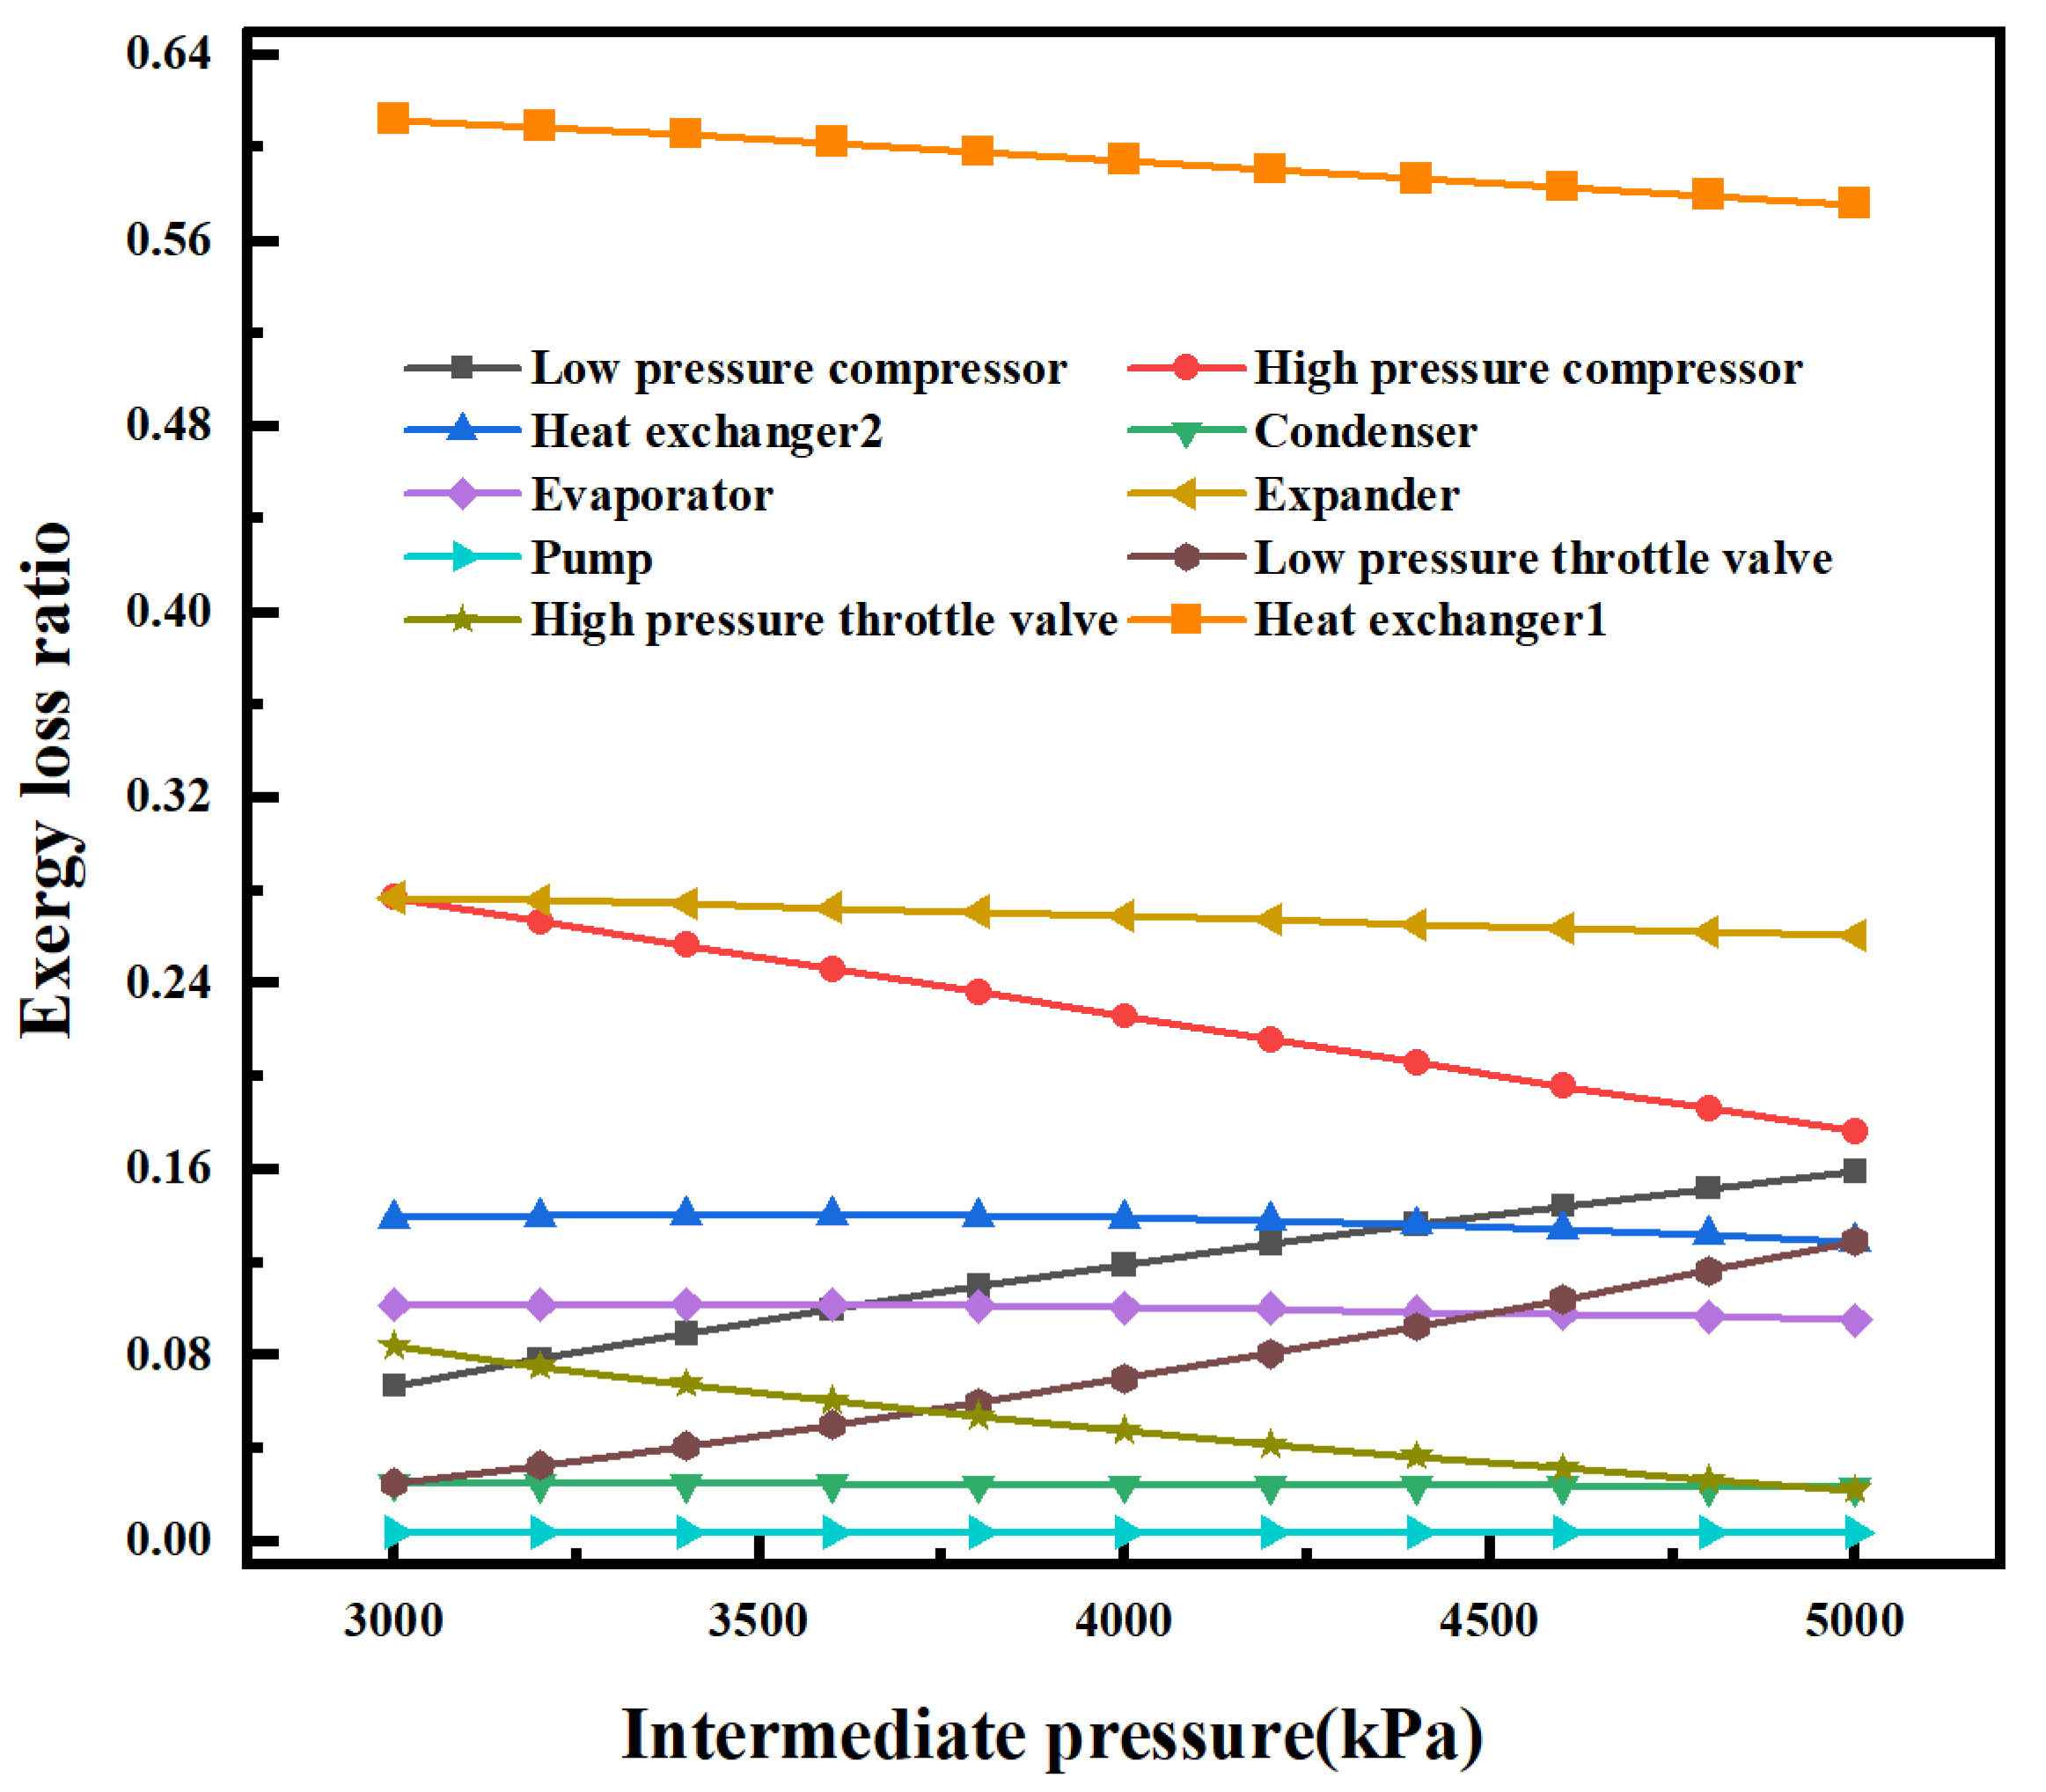
5.2.1. Analysis of the Influence of Intermediate Pressure Change on Exergy Loss Ratio

The changes in the exergy loss rate of all components in the coupling system relative to the intermediate pressure are shown in Figure 8. When the intermediate pressure changed from 3000 kPa to 5000 kPa, in this case, among all the components of the coupled system, the largest exergy loss was heat exchanger 1. As can be seen from the system diagram, in the ORC cycle, in order to provide the expander with enough heat to generate electricity, the working fluid needs to absorb enough heat in heat exchanger 1 to achieve warming, so the temperature difference of the fluid in heat exchanger 1 was large. Therefore, in the resultant diagram, heat exchanger 1 had a significantly higher exergy loss than the other components of the system.

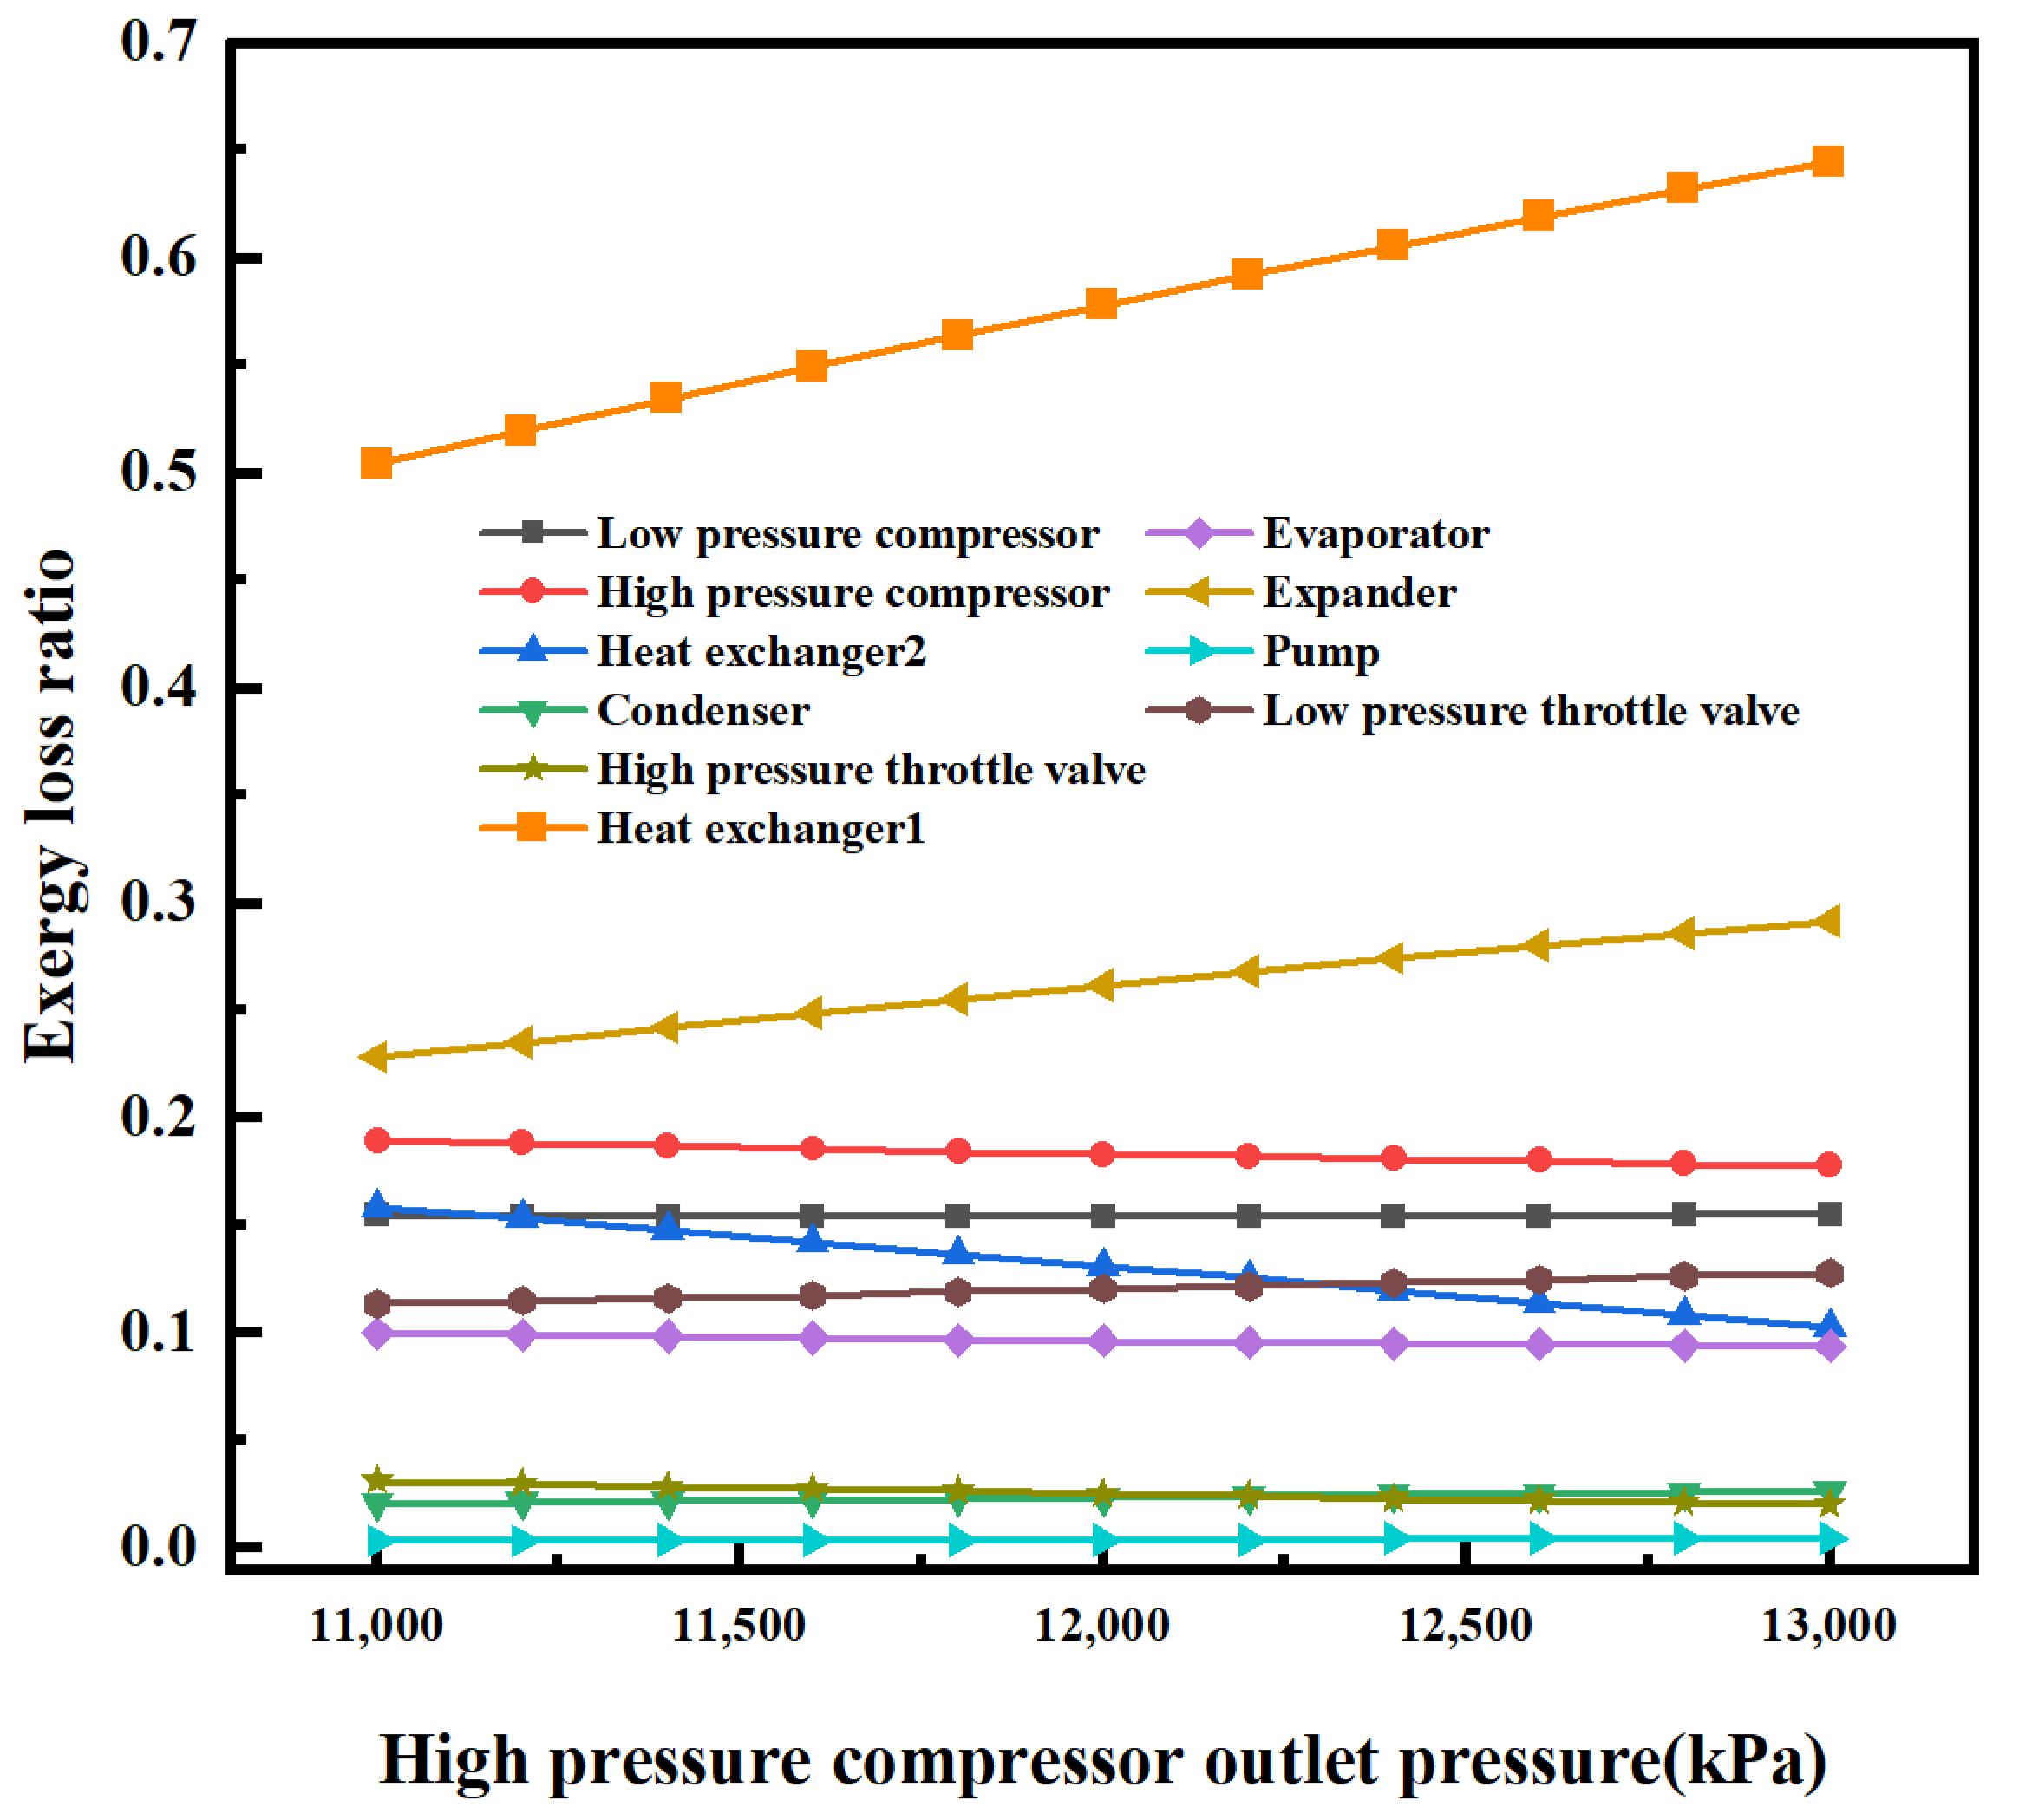
5.2.2. Analysis of the Influence of Exergy Loss Ratio on the Change of Outlet Pressure of High-Pressure Compressor

Figure 9 shows the relationship between the exergy loss rate of each component in the coupled system and outlet pressure of the high-pressure compressor. When the outlet pressure of the high-pressure compressor changed from 11,000 kPa to 13,000 kPa, heat exchanger 1 had a significantly higher exergy loss than the other system components in this case. In addition, it is worth noting that the dissipation losses of the pump, condenser, and high-pressure throttle were smaller compared to the other components.

5.3. Economic Analysis

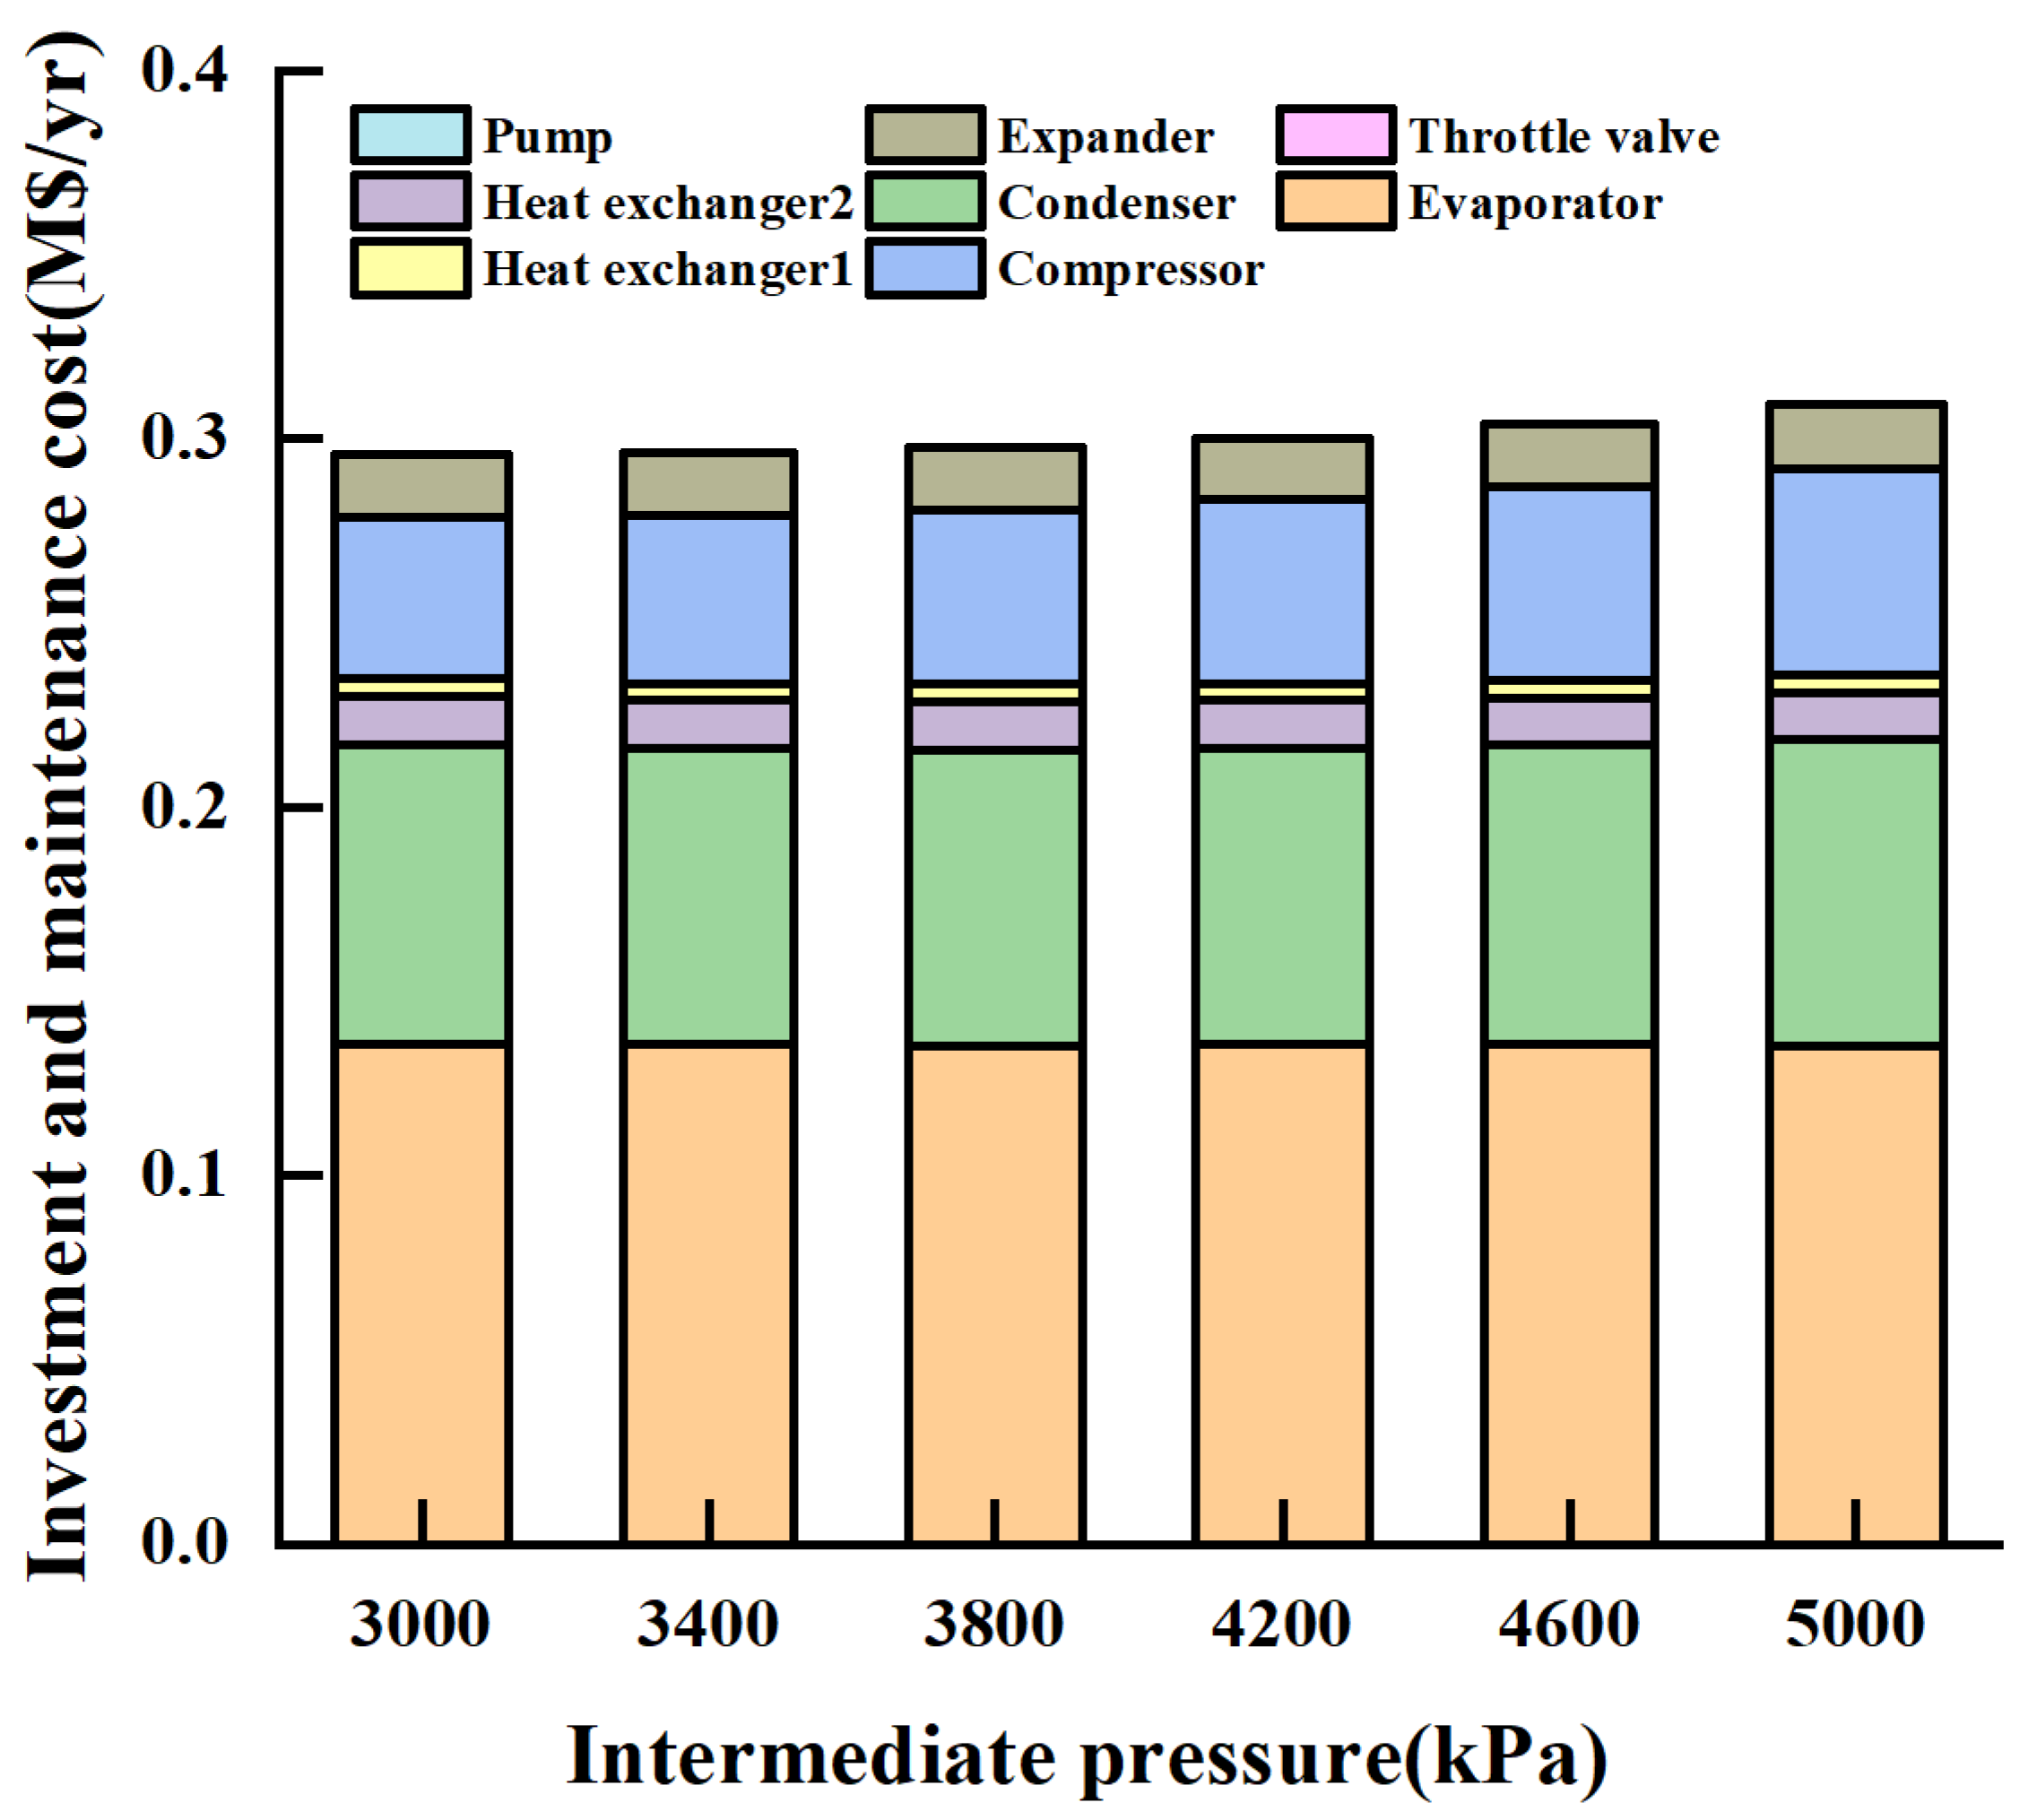
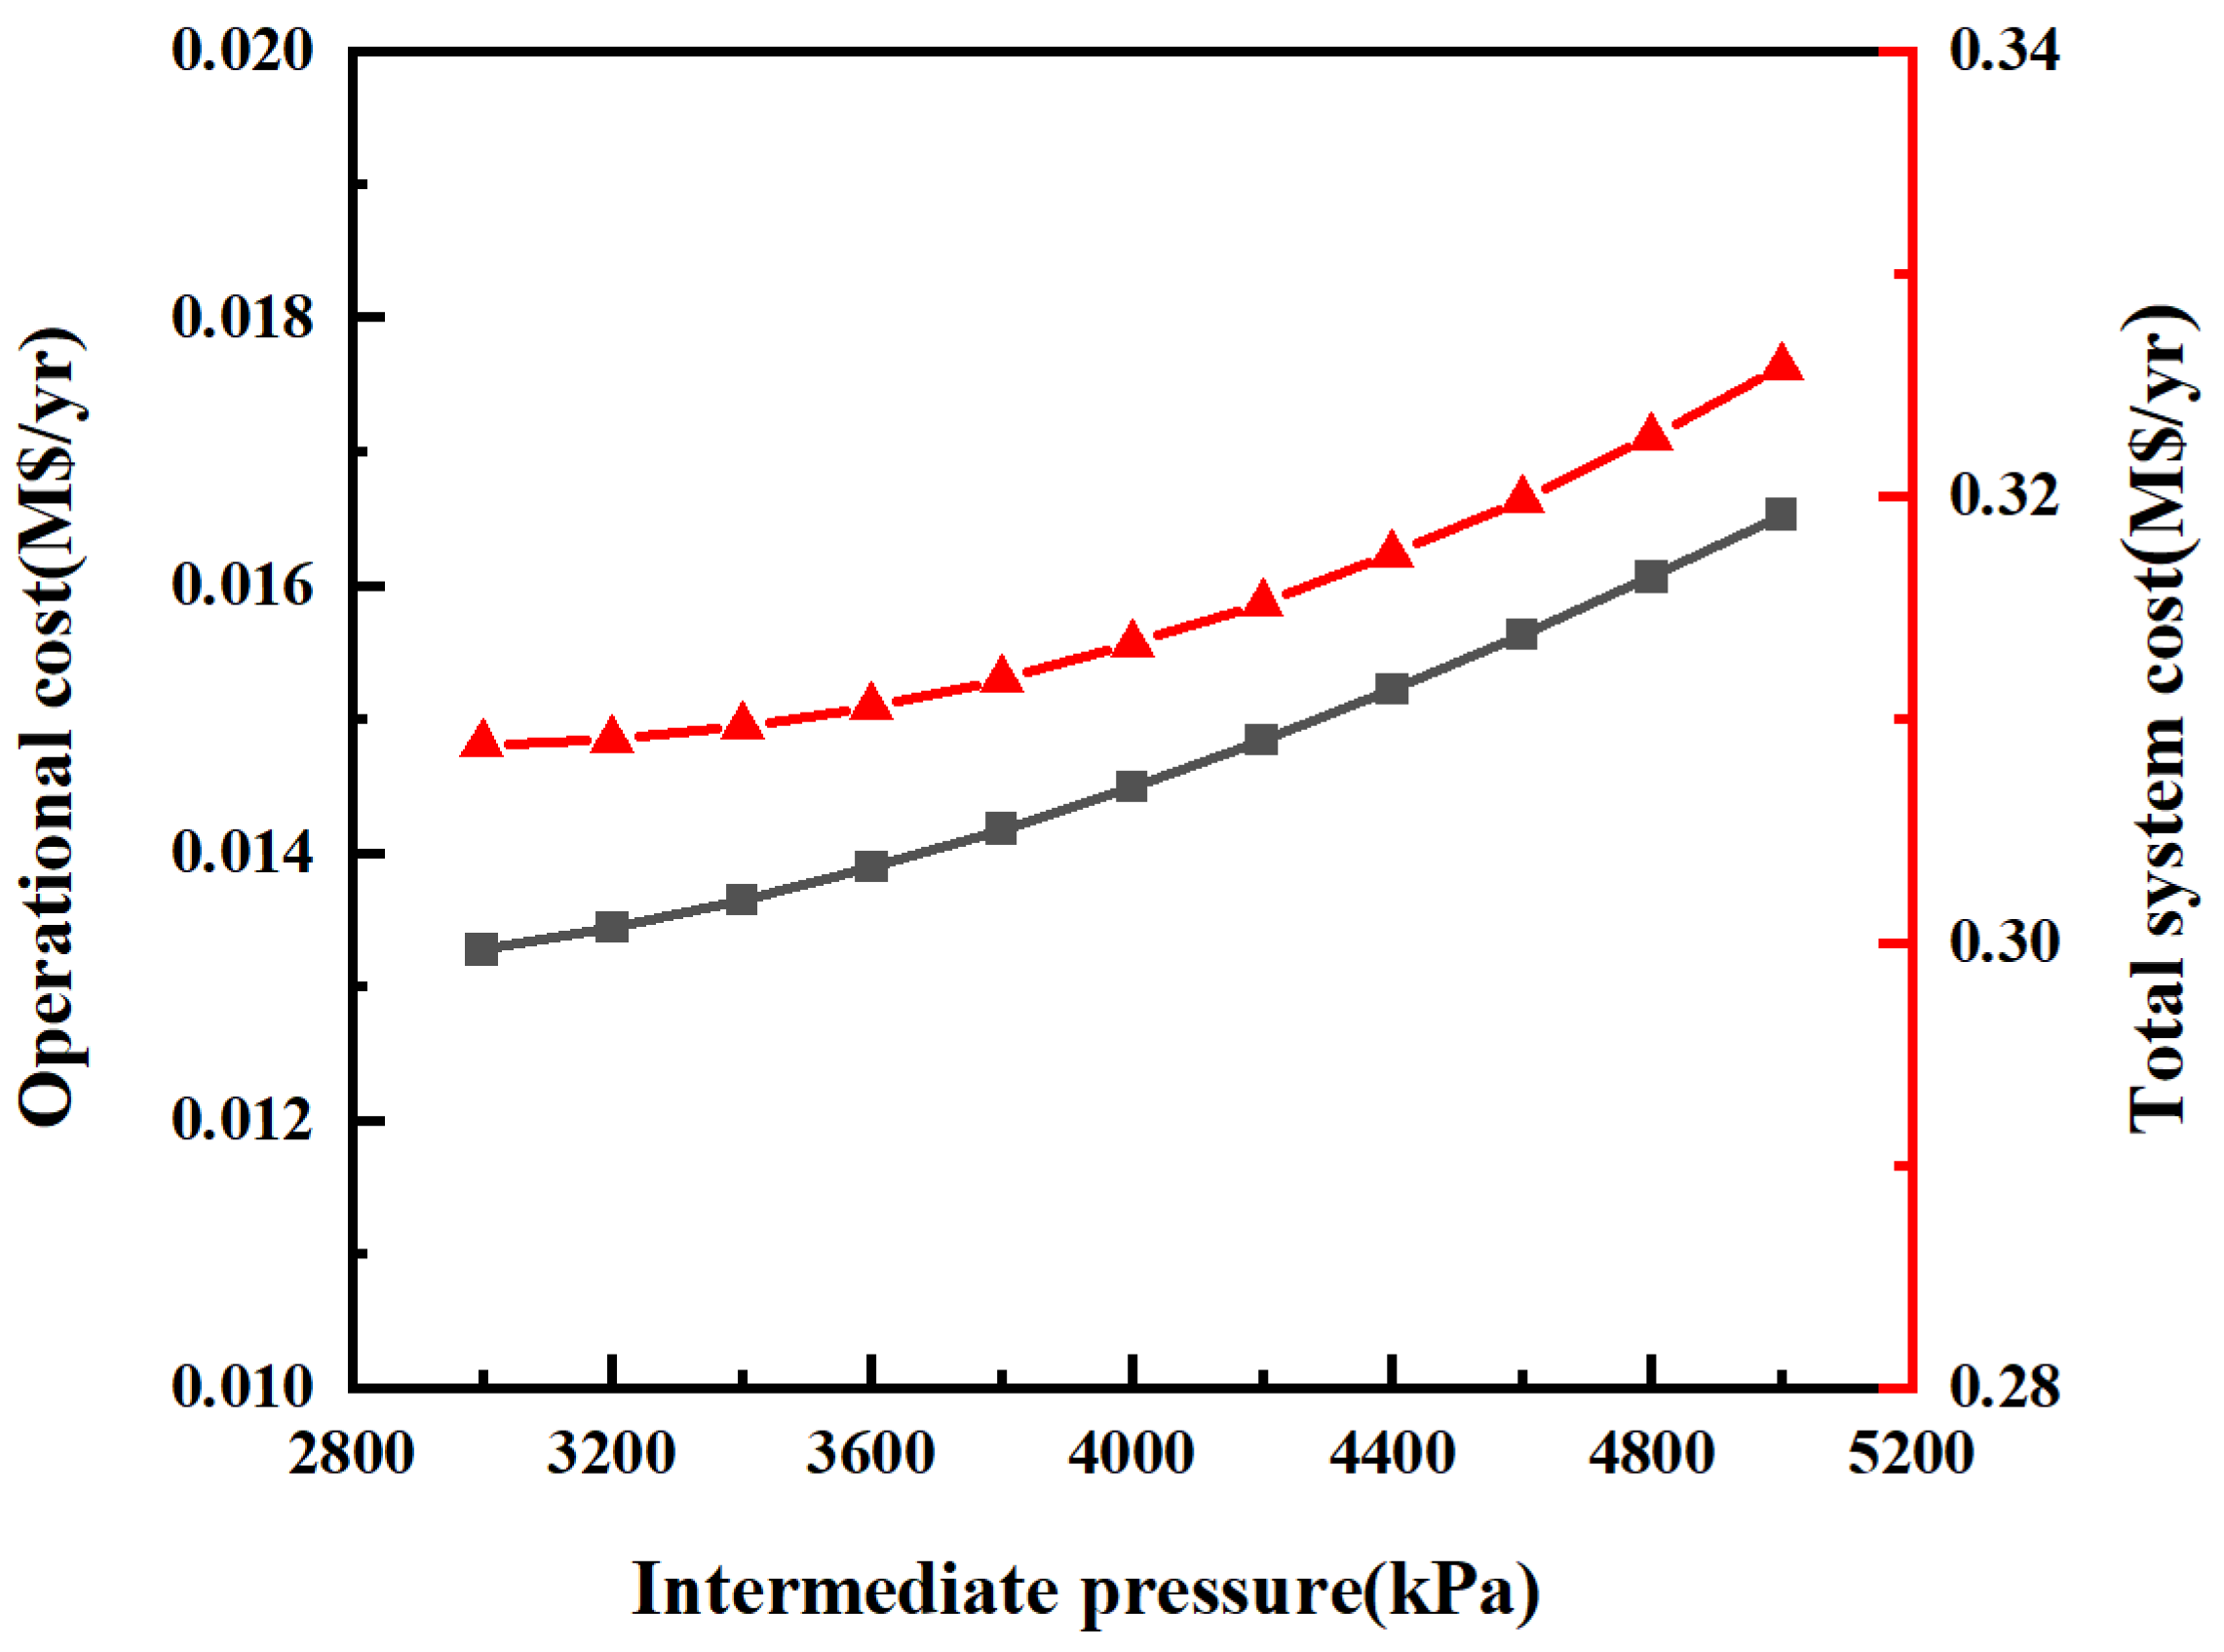
5.3.1. Economic Analysis of Coupling Systems under Different Intermediate Pressure

The capital investment and maintenance costs of each component in the coupling system are shown in Figure 10, and the operating costs and total costs of the whole system are shown in Figure 11. The specific data can be referred to in Table 6, which shows the specific cost information of each component, represented by 4000 kPa and 5000 kPa. When the intermediate pressure changed from 3000 kPa to 5000 kPa, it is obvious from the bar graph that among all the components of the system, the evaporator was more costly, followed by the condenser and compressor. In the dotted line graph, we can more directly understand the trend of the total system cost with the change of intermediate pressure, that is, as the intermediate pressure keeps increasing, the total system cost keeps increasing.

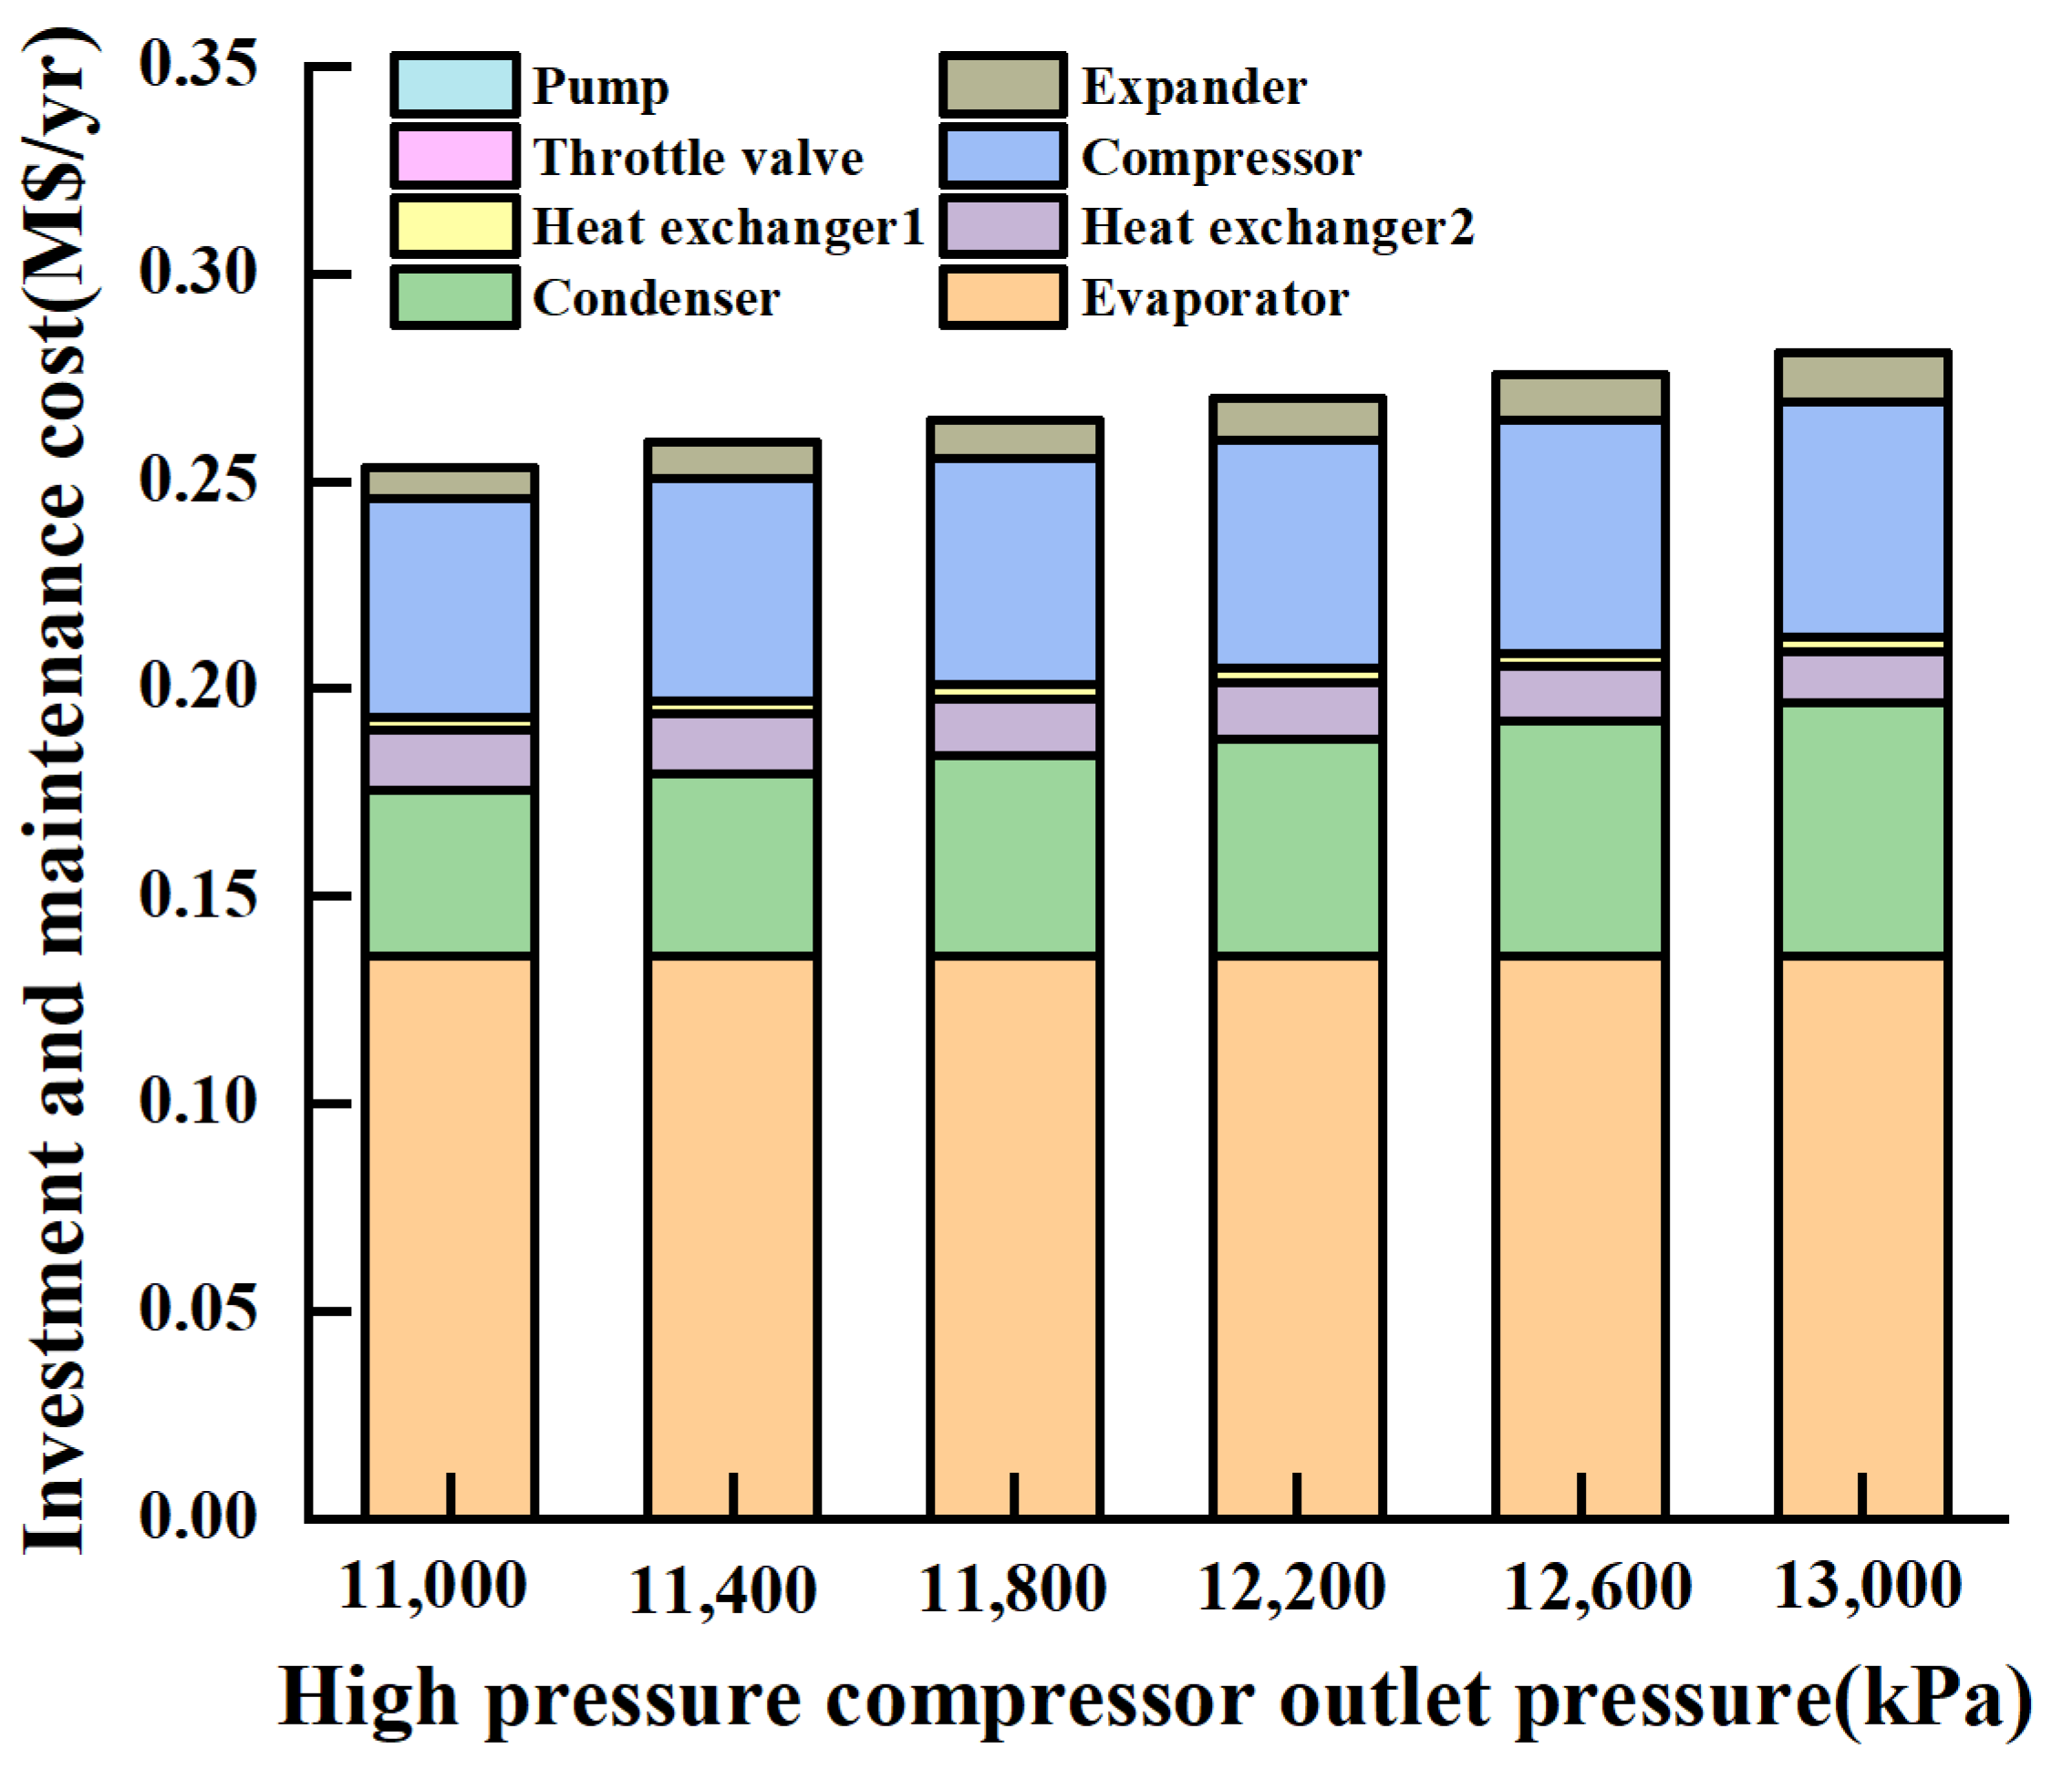
5.3.2. Economic Analysis of Coupling System under Different High Pressure Compressor Outlet Pressure

The capital investment and maintenance costs of each component in the coupling system are shown in Figure 12, and the operating costs and total costs of the whole system are shown in Figure 13. The specific data can be found in Table 7, represented by 12,000 kPa and 13,000 kPa, which shows the specific cost information of each component. As the high-pressure compressor outlet pressure changed from 11,000 kPa to 13,000 kPa, it can be seen in the bar graph that the evaporator had the highest cost, followed by the condenser and compressor. In the dotted line graph, we can understand the change trend more intuitively, that is, as the high pressure compressor outlet pressure increases, the total system cost also keeps increasing.

6. Conclusions

The thermodynamic and economic analyses of the coupling system between the ORC and the CO2 transcritical two-stage compression cycle were conducted in this article. Modeling calculations using MATLAB software combined with the REFPROP database to find the relevant parameters, and the effects of high-pressure compressor output pressure and intermediate pressure on the system’s COP and exergy loss ratio and economic cost were investigated. The following are the key conclusions:
  • In terms of the energy analysis, the effect of adding an ORC system for waste heat recovery on the system performance was simulated. It was verified that the system COP increased with the increase in the high-pressure compressor outlet pressure, while the trend increased and then decreased with the increase in intermediate pressure, and the results prove that the optimized energy efficiency had a large improvement.
  • In terms of the exergy analysis, the exergy loss rate of each component of the coupled system was calculated. Heat exchanger 1 had the largest heat loss and was significantly higher than the other components when the intermediate pressure and the high-pressure compressor outlet pressure were varied, respectively.
  • In terms of economic analysis, the economic cost of the coupled system was calculated. Among all of the components, the evaporator had the highest capital investment and maintenance costs, followed by the condenser and the compressor. Furthermore, as the intermediate pressure and the high-pressure compressor outlet pressure increase, the total system cost also continuously increases.

Author Contributions

K.H.: Conceptualization, Methodology, Software, Investigation, Visualization, Project administration, Funding acquisition, Writing-review and editing. Y.Z.: Data curation, Formal analysis, Validation, Writing-original draft. W.Y.: Resources, Supervision. Z.L.: Methodology, Software. H.S.: Formal analysis, Validation. Z.S.: Methodology, Formal analysis. All authors have read and agreed to the published version of the manuscript.

Funding

This work was supported by the Tianjin Enterprise Science and Technology Specialist Project (Grant No. 22YDTPJC00250).

Data Availability Statement

Not applicable.

Conflicts of Interest

The authors declare no conflict of interest.

Nomenclature

Abbreviations
COPCoefficient of performance
CRFCapital recovery factor
Symbols
AArea (m2)
C ˙ Cost rate ($/year)
FCorrection factor
hSpecific enthalpy (kJ/kg)
I ˙ Exergic loss (kW)
iAnnual interest rate
M ˙ Mass flow rate (kg/s)
nSystem lifetime (years)
NAnnual operational hours (h)
Q ˙ Heat transfer rate (kW)
RExergic loss ratio
RCChange rate
sSpecific entropy (kJ/kg K)
TTemperature (K or °C)
UOverall heat transfer coefficient (kW/m2 K)
W ˙ Power consumption (kW)
Z ˙ Capital cost rate ($/year)
ZCapital cost ($)
Greek symbols
α e l Cost of electricity ($/kWh)
Φ Maintenance factor
η Efficiency(%)
Δ Difference
Subscripts
0Ambient state
cCondenser
ciCondenser side water inlet
coCondenser side water outlet
comdLow-pressure compressor
comgHigh-pressure compressor
eExpander
eiEvaporator side air inlet
eoEvaporator side air outlet
evEvaporator
heHeat exchanger
kkth component
netNet work
pPump
thdLow-pressure stage throttle valve
thgHigh-pressure stage throttle valve
totThe whole system

References

  1. Kasaeian, A.; Hosseini, S.M.; Sheikhpour, M.; Mahian, O.; Yan, W.M.; Wongwises, S. Applications of eco-friendly refrigerants and nanorefrigerants: A review. Renew. Sustain. Energy Rev. 2018, 96, 91–99. [Google Scholar] [CrossRef]
  2. Emani, M.S.; Kumar Mandal, B. The use of natural refrigerants in refrigeration and air con-ditioning systems: A review. Iop. Conf. 2018, 377, 012064. [Google Scholar]
  3. Wang, H.; Zhao, L.; Cao, R.; Zeng, W. Refrigerant alternative and optimization under the constraint of the greenhouse gas emissions reduction target. J. Clean. Prod. 2021, 296, 126580. [Google Scholar] [CrossRef]
  4. Zhao, Y.A.; Bf, A.; Hm, B.; Lei, Z.A.; Cd, B.; Bing, L.A. Analysis of lower gwp and flammable alternative refrigerants. Int. J. Refrig. 2021, 126, 12–22. [Google Scholar]
  5. Aktemur, C.; Ozturk, I.T.; Cimsit, C. Comparative energy and exergy analysis of a subcritical cascade refrigeration system using low global warming potential refrigerants. Appl. Therm. Eng. 2021, 184, 116254. [Google Scholar] [CrossRef]
  6. Halon, T.; Gil, B.; Zajaczkowski, B. Comparative investigation of low-GWP binary and ternary blends as potential replacements of HFC refrigerants for air conditioning systems. Appl. Therm. Eng. 2022, 210, 118354. [Google Scholar] [CrossRef]
  7. Belman-Flores, J.M.; Pérez-García, V.; Ituna-Yudonago, J.F.; Rodríguez-Muñoz, J.L.; Ramí-rez-Minguela, J.D.J. General aspects of carbon dioxide as a refrigerant. J. Energy S. Afr. 2014, 25, 96–106. [Google Scholar]
  8. Du, Y.; Tian, G.; Pekris, M. A comprehensive review of micro-scale expanders for carbon dioxide related power and refrigeration cycles. Appl. Therm. Eng. 2022, 201, 117722. [Google Scholar] [CrossRef]
  9. Zhang, Z.; Tian, L.; Chen, Y.; Tong, L. Effect of an internal heat exchanger on performance of the transcritical carbon dioxide refrigeration cycle with an expander. Entropy 2014, 16, 5919–5934. [Google Scholar]
  10. Casi, Á.; Aranguren, P.; Araiz, M.; Alegría, P.; Astrain, D. Impact of a thermoelectric subcooler heat exchanger on a carbon dioxide transcritical refrigeration facility. Appl. Therm. Eng. 2022, 215, 118866. [Google Scholar]
  11. Zhang, F.; Chen, B.; Liao, G.; Jiaqiang, E. Performance assessment and comparative study on novel carbon dioxide based power cycles for the cascade engine waste heat recovery. Appl. Therm. Eng. 2022, 214, 118764. [Google Scholar] [CrossRef]
  12. Dai, B.; Liu, S.; Zhu, K.; Sun, Z.; Ma, Y. Thermodynamic performance evaluation of transcritical carbon dioxide refrigeration cycle integrated with thermoelectric subcooler and expander. Energy 2017, 122, 787–800. [Google Scholar] [CrossRef]
  13. Crespi, F.; Gavagnin, G.; Sánchez, D.; Martínez, G.S. Analysis of the thermodynamic potential of supercritical carbon dioxide cycles: A systematic approach. J. Eng. Gas Turbines Power 2018, 140, 051701. [Google Scholar] [CrossRef]
  14. Kang, J.; Zhou, Z. Current Situation and Prospect of Supercritical Carbon Dioxide Cycle Power Generation Technology. World Sci. Res. J. 2021, 7, 111–121. [Google Scholar]
  15. Sadeghi, S.; Javani, N.; Ghandehariun, S.; Ahmadi, P. Design and optimization of a novel wind-powered liquefied air energy storage system integrated with a supercritical carbon dioxide cycle. Energy Storage 2021, 3, e274. [Google Scholar] [CrossRef]
  16. Sharan, P.; Neises, T.; Turchi, C. Thermal desalination via supercritical CO2 Brayton cycle: Optimal system design and techno-economic analysis without reduction in cycle efficiency. Appl. Therm. Eng. 2019, 152, 499–514. [Google Scholar] [CrossRef]
  17. Mohammadi, K.; Ellingwood, K.; Powell, K. Novel hybrid solar tower-gas turbine combined power cycles using supercritical carbon dioxide bottoming cycles. Appl. Therm. Eng. 2020, 178, 115588. [Google Scholar]
  18. Baheta, A.T.; Hassan, S.; Reduan, A.R.B.; Woldeyohannes, A.D. Performance investigation of transcritical carbon dioxide refrigeration cycle. Procedia Cirp. 2015, 26, 482–485. [Google Scholar] [CrossRef]
  19. Purjam, M.; Thu, K.; Miyazaki, T. Thermodynamic modeling of an improved transcritical carbon dioxide cycle with ejector: Aiming low-temperature refrigeration. Appl. Therm. Eng. 2021, 188, 116531. [Google Scholar] [CrossRef]
  20. Kwan, T.H.; Shen, Y.; Wu, Z.; Yao, Q. Performance analysis of the thermoelectric device as the internal heat exchanger of the trans-critical carbon dioxide cycle. Energy Convers. Manag. 2020, 208, 112585. [Google Scholar] [CrossRef]
  21. Dzido, A.; Wołowicz, M.; Krawczyk, P. Transcritical carbon dioxide cycle as a way to improve the efficiency of a Liquid Air Energy Storage system. Renew. Energy 2022, 196, 1385–1391. [Google Scholar] [CrossRef]
  22. Srinivasan, K. Identification of optimum inter-stage pressure for two-stage transcritical carbon dioxide refrigeration cycles. J. Supercrit. Fluids 2011, 58, 26–30. [Google Scholar]
  23. Sun, Y.; Wang, J.; Xie, J. Performance Optimizations of the Transcritical CO2 Two-Stage Compression Refrigeration System and Influences of the Auxiliary Gas Cooler. Energies 2021, 14, 5578. [Google Scholar] [CrossRef]
  24. Mohammadi, S.H. Theoretical investigation on performance improvement of a low-temperature transcritical carbon dioxide compression refrigeration system by means of an absorption chiller after-cooler. Appl. Therm. Eng. 2018, 138, 264–279. [Google Scholar]
  25. Liu, Y.; Liu, J.; Yu, J. Theoretical analysis on a novel two-stage compression transcritical CO2 dual-evaporator refrigeration cycle with an ejector. Int. J. Refrig. 2020, 119, 268–275. [Google Scholar]
  26. Teng, S.; Wang, M.; Xi, H.; Wen, S. Energy, exergy, economic (3E) analysis, optimization and comparison of different ORC based CHP systems for waste heat recovery. Case Stud. Therm. Eng. 2021, 28, 101444. [Google Scholar]
  27. Gupta, P.R.; Tiwari, A.K.; Said, Z. Solar organic Rankine cycle and its poly-generation applications—A review. Sustain. Energy Technol. Assess. 2022, 49, 101732. [Google Scholar]
  28. Canbolat, A.S.; Bademlioglu, A.H.; Kaynakli, O. A modeling of electricity generation by using geothermal assisted organic Rankine cycle with internal heat recovery. Energy Sources Part A Recovery Util. Environ. Eff. 2019, 1–17. [Google Scholar] [CrossRef]
  29. Roy, D.; Samanta, S.; Ghosh, S. Techno-economic and environmental analyses of a biomass based system employing solid oxide fuel cell, externally fired gas turbine and organic Rankine cycle. J. Clean. Prod. 2019, 225, 36–57. [Google Scholar]
  30. Ni, T.; Si, J.; Lu, F.; Zhu, Y.; Pan, M. Performance analysis and optimization of cascade waste heat recovery system based on transcritical CO2 cycle for waste heat recovery in waste-to-energy plant. J. Clean. Prod. 2022, 331, 129949. [Google Scholar] [CrossRef]
  31. Toolbox, S.M. MATLAB; Mathworks Inc.: Natick, MA, USA, 1993. [Google Scholar]
  32. Lemmon, E.W.; Huber, M.L.; Mclinden, M.O. Nist Standard Referencedatabase 23: Reference Fluid Thermodynamic and Transport Properties-Refprop. 9.0; NIST NSRDS: Gaithersburg, MD, USA, 2010. [Google Scholar]
  33. Zhao, R.; Shen, J.; Hu, K.; Bian, Y. Thermo dynamic analysis of transcritical CO2 two-stage compression booster system. Refrigeration 2018, 46, 81–86. [Google Scholar]
  34. Aminyavari, M.; Najafi, B.; Shirazi, A.; Rinaldi, F. Exergetic, economic and environmental (3E) analyses, and multi-objective optimization of a CO2/NH3 cascade refrigeration system. Appl. Therm. Eng. 2014, 65, 42–50. [Google Scholar]
  35. Singh, K.K.; Kumar, R.; Gupta, A. Comparative energy, exergy and economic analysis of a cascade refrigeration system incorporated with flash tank (HTC) and a flash intercooler with indirect subcooler (LTC) using natural refrigerant couples. Sustain. Energy Technol. Assess. 2020, 39, 100716. [Google Scholar]
  36. Navidbakhsh, M.; Shirazi, A.; Sanaye, S. Four E analysis and multi-objective optimization of an ice storage system incorporating PCM as the partial cold storage for air-conditioning applications. Appl. Therm. Eng. 2013, 58, 30–41. [Google Scholar] [CrossRef]
  37. Bejan, A.; Tsatsaronis, G.; Moran, M.J. Thermal Design and Optimization; John Wiley & Sons: Hoboken, NJ, USA, 1995. [Google Scholar]
  38. Smith, R. Chemical Process Design and Integration; John Wiley & Sons: Chichester, UK, 2005. [Google Scholar]
  39. Fettaka, S.; Thibault, J.; Gupta, Y. Design of shell-and-tube heat exchangers using multiobjective optimization. Int. J. Heat Mass Transf. 2013, 60, 343–354. [Google Scholar]
  40. Herath, H.; Wijewardane, M.A.; Ranasinghe, R.; Jayasekera, J. Working fluid selection of organic rankine cycles. Energy Rep. 2020, 6, 680–686. [Google Scholar] [CrossRef]
  41. Chen, Y.G. Pinch point analysis and design considerations of CO2 gas cooler for heat pump water heaters. Int. J. Refrig. 2016, 69, 136–146. [Google Scholar] [CrossRef]
Figure 1. Schematic diagram of a CO2 transcritical two stage compression refrigeration system based on an ORC system.
Energies 16 01675 g001
Figure 2. T–S diagram of the CO2 transcritical two stage compression refrigeration system based on an ORC system.
Energies 16 01675 g002
Figure 3. Calculation flow diagram of the coupled system performance analysis.
Energies 16 01675 g003
Figure 4. Temperature distribution inside heat exchanger 1.
Energies 16 01675 g004
Figure 5. Validation of the presented model with the study by Yun-Guang Chen [41].
Energies 16 01675 g005
Figure 6. COP of the coupling cycle and CO2 cycle varied with the intermediate pressure.
Energies 16 01675 g006
Figure 7. COP of the coupling cycle and CO2 cycle varied with the outlet pressure of a high-pressure compressor.
Energies 16 01675 g007
Figure 8. Exergy loss rate of each component of the coupling system varied with the intermediate pressure.
Energies 16 01675 g008
Figure 9. Exergy loss rate of each component of the coupling system varied with the outlet pressure of the high-pressure compressor.
Energies 16 01675 g009
Figure 10. The capital input and maintenance cost of each component of the coupling system varied with the intermediate pressure.
Energies 16 01675 g010
Figure 11. Operating costs and total costs of the components of a coupled system varied with the intermediate pressures.
Energies 16 01675 g011
Figure 12. The capital input and maintenance cost of each component of the coupling system varied with the outlet pressure of the high-pressure compressor.
Energies 16 01675 g012
Figure 13. The operating costs and total costs of each component of the coupling system varied with the outlet pressure of the high-pressure compressor.
Energies 16 01675 g013
Table 1. Energy and exergy balance equations for the coupled system components [34].
ComponentEnergy Balance EquationExergy Balance EquationProportion of Exergy Loss of Each Component
Evaporator Q ˙ = M ˙ 1 ( h 1 h 7 ) I ˙ e v a = M ˙ 1 × ( ( h 1 h 7 ) T 0 ( s 1 s 7 ) ) M ˙ e v ( ( h e i h e o ) T 0 ( s e i s e o ) ) R e v a = I ˙ e v a / I ˙ t o t
Compressor 1 W ˙ 1 = M ˙ 9 ( h 3 h 9 ) I ˙ c o m g = M ˙ 9 × T 0 ( s 3 s 9 ) R c o m g = I ˙ c o m g / I ˙ t o t
Compressor 2 W ˙ 2 = M ˙ 1 ( h 2 h 1 ) I ˙ c o m d = M ˙ 1 × T 0 ( s 2 s 1 ) R c o m d = I ˙ c o m d / I ˙ t o t
Heat exchanger 1 Q ˙ h e 1 = M ˙ o r c ( h b h a ) I ˙ h e 1 = M ˙ o r c ( ( h b h a ) T 0 ( s b s a ) ) R h e 1 = I ˙ h e 1 / I ˙ t o t
Heat exchanger 2 Q ˙ h e 2 = M ˙ 3 ( h 10 h 4 ) I ˙ h e 2 = M ˙ 3 ( ( h 10 h 4 ) T 0 ( s 10 s 4 ) ) R h e 2 = I ˙ h e 2 / I ˙ t o t
Throttle valve 1 h 4 = h 5 I ˙ t h g = M ˙ 4 × T 0 × ( s 4 s 5 ) R t h g = I ˙ t h g / I ˙ t o t
Throttle valve 2 h 6 = h 7 I ˙ t h d = M ˙ 6 × T 0 × ( s 6 s 7 ) R t h d = I ˙ t h d / I ˙ t o t
Expander W ˙ e = M ˙ o r c ( h b h c ) η 3 I ˙ e = M ˙ o r c ( ( h b h c ) T 0 ( s b s c ) ) R e = I ˙ e / I ˙ t o t
Condenser Q ˙ c = M ˙ o r c ( h c h d ) I ˙ c = M ˙ o r c ( ( h c h d ) T 0 ( s c s d ) ) M ˙ c ( ( h c o h c i ) T 0 ( s c o s c i ) ) R c = I ˙ c / I ˙ t o t
Pump W ˙ p = M ˙ o r c ( h a h d ) I ˙ p = M ˙ o r c ( ( h a h d ) T 0 ( s a s d ) ) R p = I ˙ p / I ˙ t o t
Table 2. Input parameters and values adopted in the thermodynamic analysis.
ParametersValue
Two-stage CO2 cycle
Cooling capacity ( Q ˙ )100 kW
Cold storage temperature ( T 0 )263.15 K
Evaporation temperature ( T e v )253.15 K
Evaporator superheat5 K
Heat exchanger 2 outlet temperature ( T 4 )303.15 K
Indicated efficiency of compressor ( η 1 , η 2 )0.75
ORC cycle
Condenser outlet temperature ( T d )303.15 K
Temperature at point f inside heat exchanger 1 ( T f )343.15 K
Heat exchanger 1 outlet temperature ( T b )353.15 K
Isentropic efficiency of expander ( η e )0.85
Isentropic efficiency of pump ( η p )0.85
External work efficiency of expander ( η 3 )0.9
Table 4. Comparison of the COP values of the CO2 system obtained by system modeling with the corresponding values reported in the literature [18]. (R: reported; M: modeling; D: difference).
Evaporating Pressure (MPa)Gas Cooler Pressure (MPa)Gas Cooler Exit Temperature (°C)COP
RMD
Group 1411403.163.170.32%
Group 2410353.823.912.36%
Group 3413353.183.200.63%
Table 5. Comparison of the calculated values of thermal efficiency of the ORC system obtained by system modeling with the corresponding values reported in the literature [40]. (R: reported; M: modeling; D: difference).
Evaporating Temperature (°C)Condensation Temperature (°C)Working FluidThermal Efficiency
RMD
Group 1101.2335R245fa0.1330.1246.77%
Group 2104.6135R245fa0.1380.1296.52%
Group 3107.8135R245fa0.1440.1346.94%
Table 6. The capital investment and maintenance costs of components under the different intermediate pressures.
ComponentCapital Cost Function (M$/yr)
4000 kPa5000 kPa
Compressor0.04840.0559
Evaporator0.13540.1354
Throttle valve1.1376 × 10−81.1378 × 10⁻⁸
Expander0.01690.0174
Heat exchanger 10.00480.0048
Heat exchanger 20.01310.0131
Condenser0.08030.0828
Pump7.2690 × 10−97.4911 × 10⁻⁹
Table 7. The capital investment and maintenance costs of the components at different high pressure compressor outlet pressures.
ComponentCapital Cost Function (M$/yr)
12,000 kPa13,000 kPa
Compressor0.05470.0564
Evaporator0.13540.1354
Throttle valve1.1385 × 10−81.1215 × 10⁻⁸
Expander0.00980.0119
Heat exchanger 10.00340.0038
Heat exchanger 20.01360.0124
Condenser0.05060.0611
Pump5.8801 × 10−97.1016 × 10⁻⁸
Disclaimer/Publisher’s Note: The statements, opinions and data contained in all publications are solely those of the individual author(s) and contributor(s) and not of MDPI and/or the editor(s). MDPI and/or the editor(s) disclaim responsibility for any injury to people or property resulting from any ideas, methods, instructions or products referred to in the content.

