
Performance Simulation of Solar Trough Concentrators: Optical and Thermal Comparisons


Abstract
:1. Introduction
2. Models and Methods
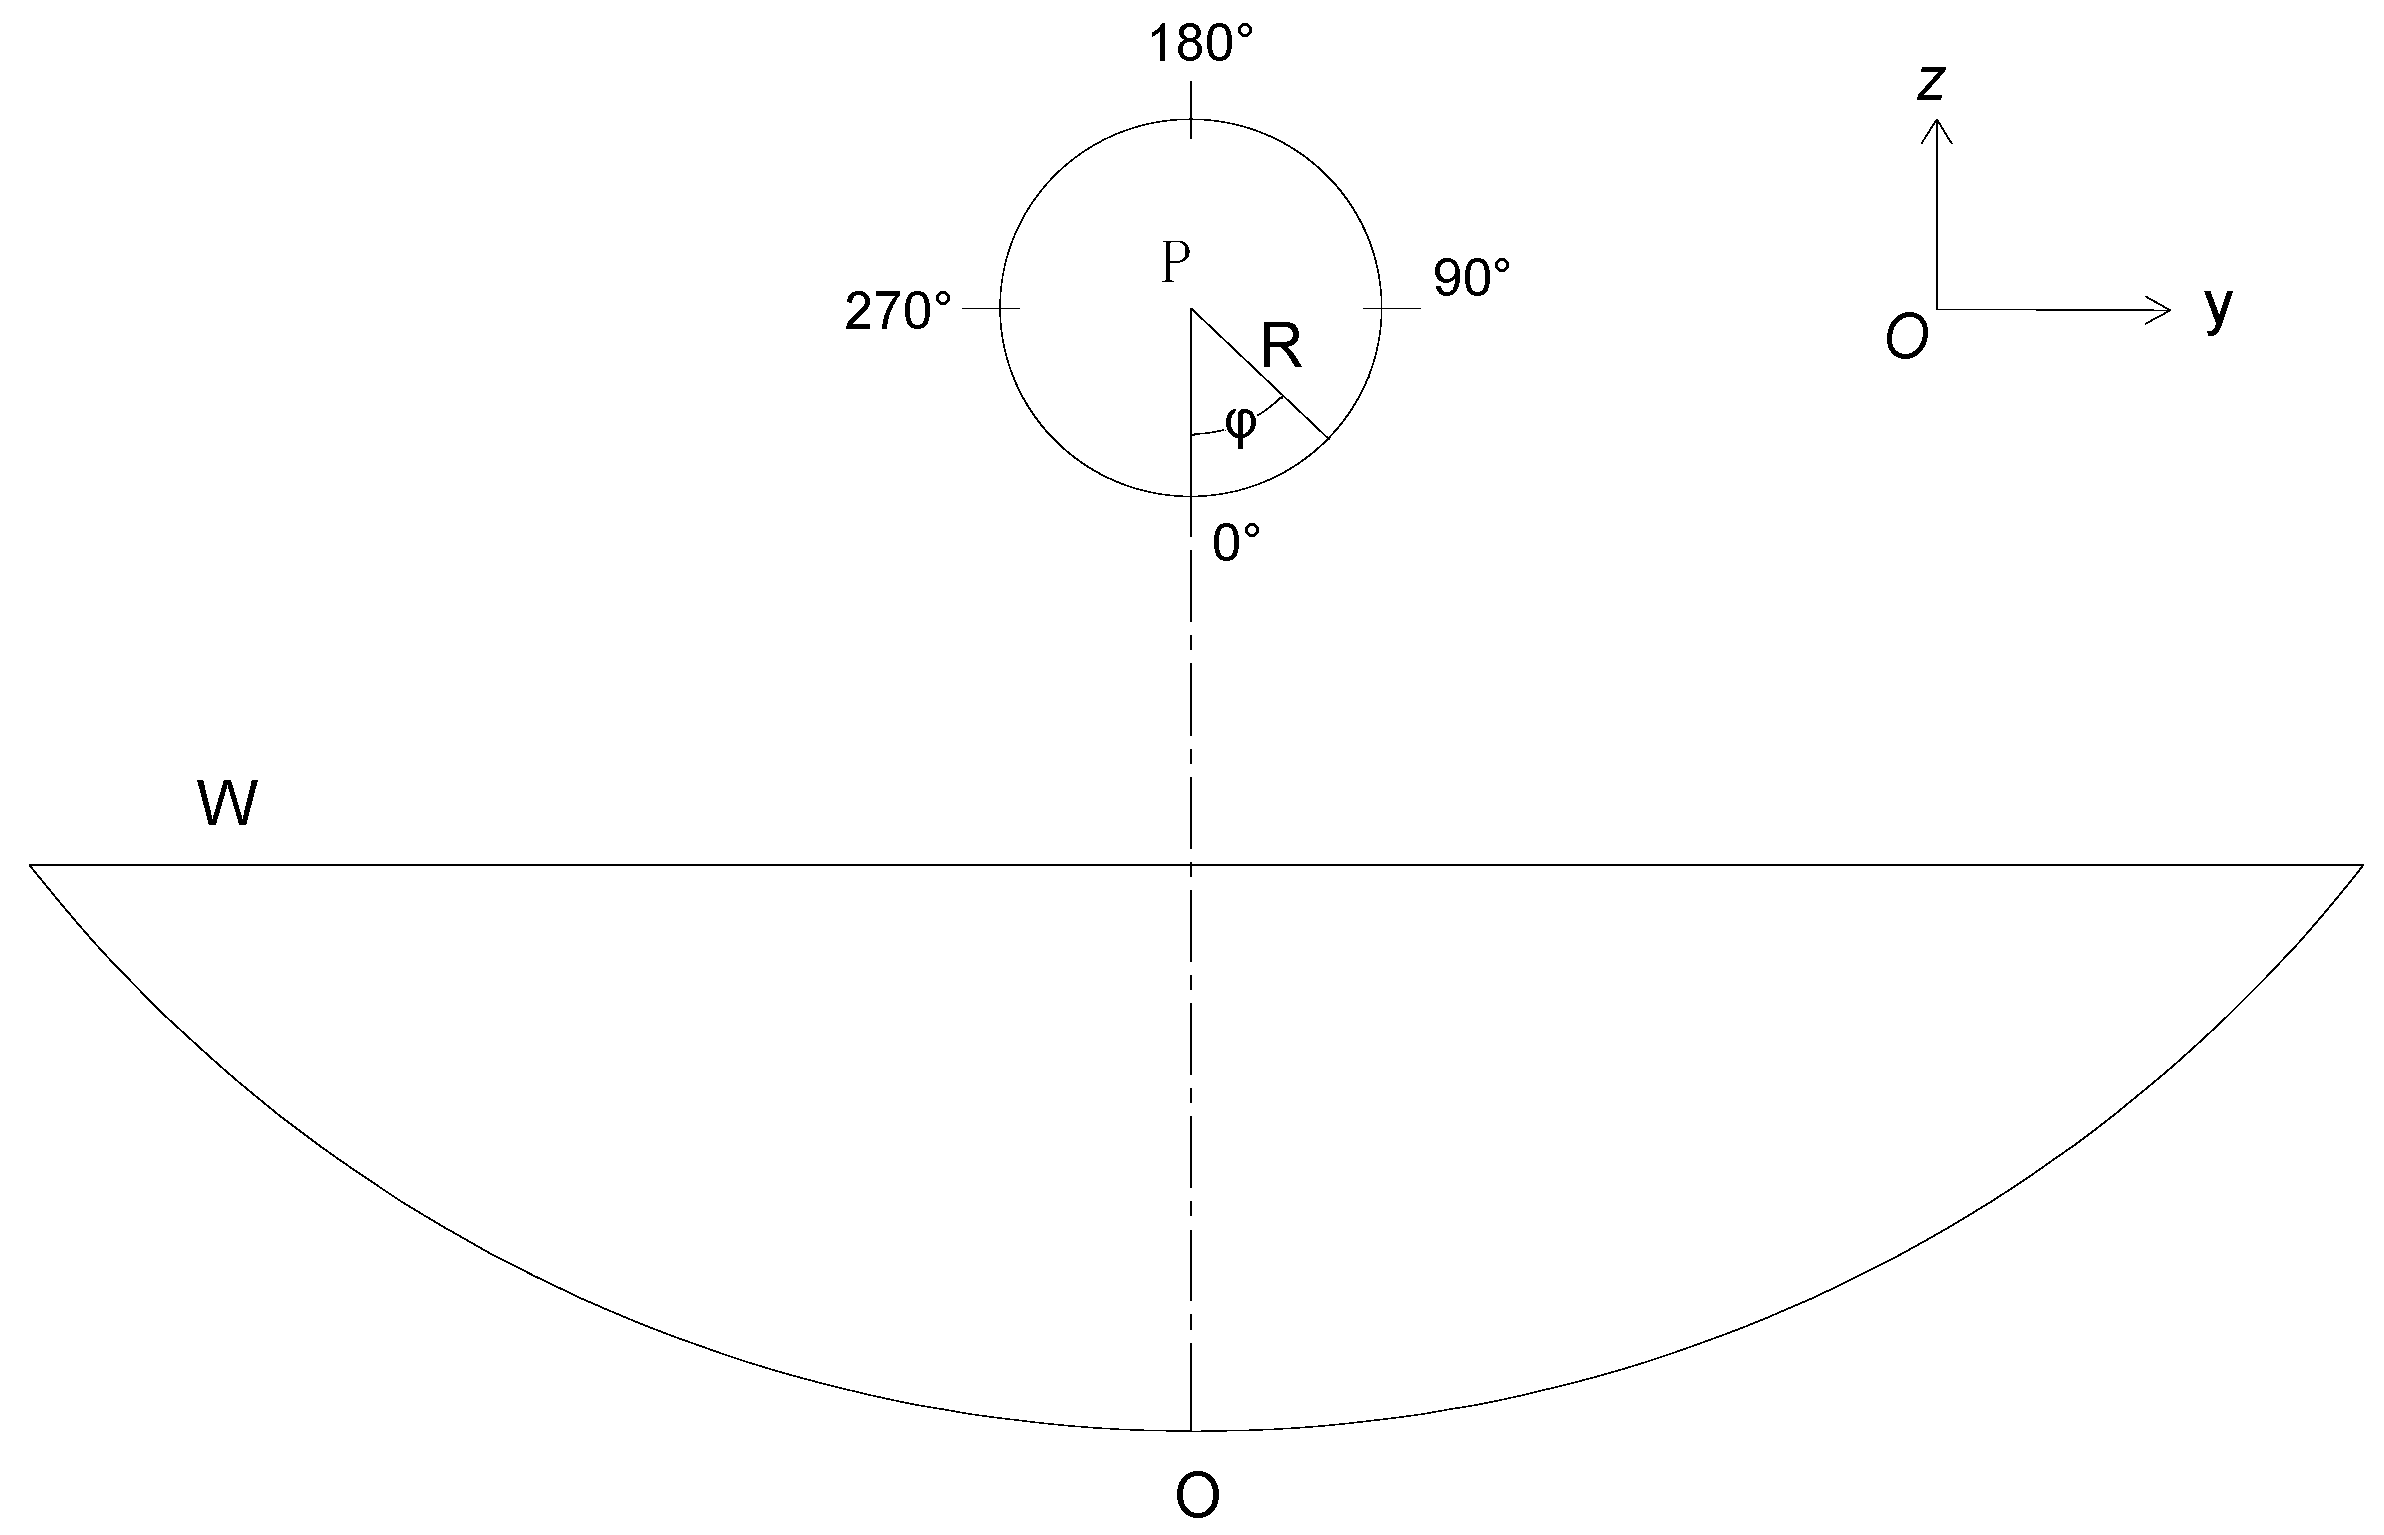
2.1. PTC
2.2. CPC
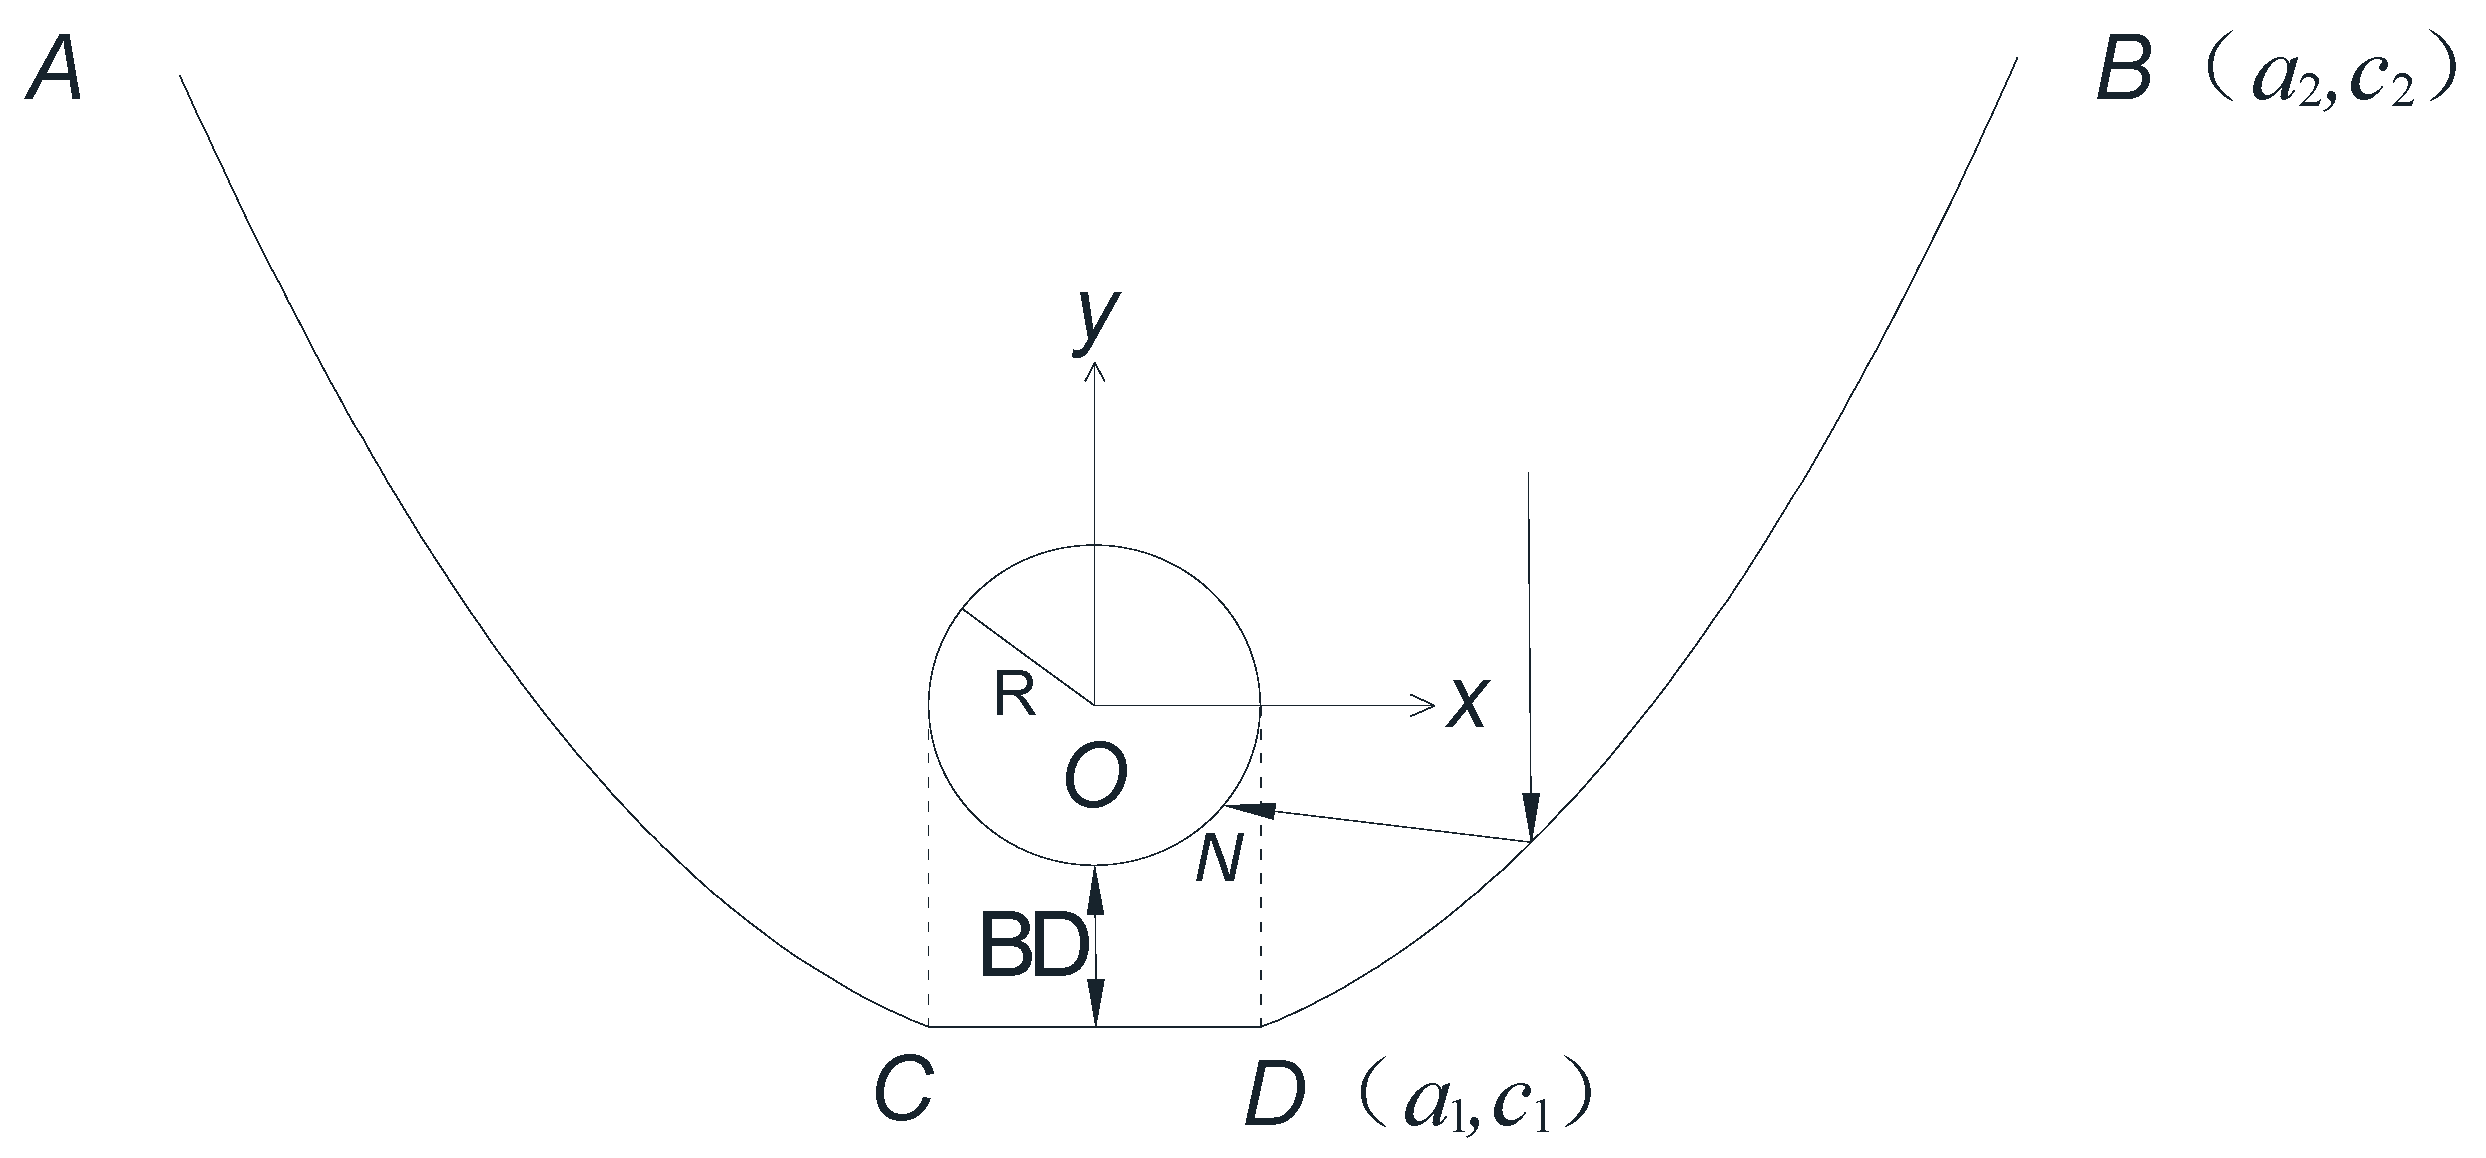
2.3. SUC
2.4. TTC
2.5. Geometry of the STCs
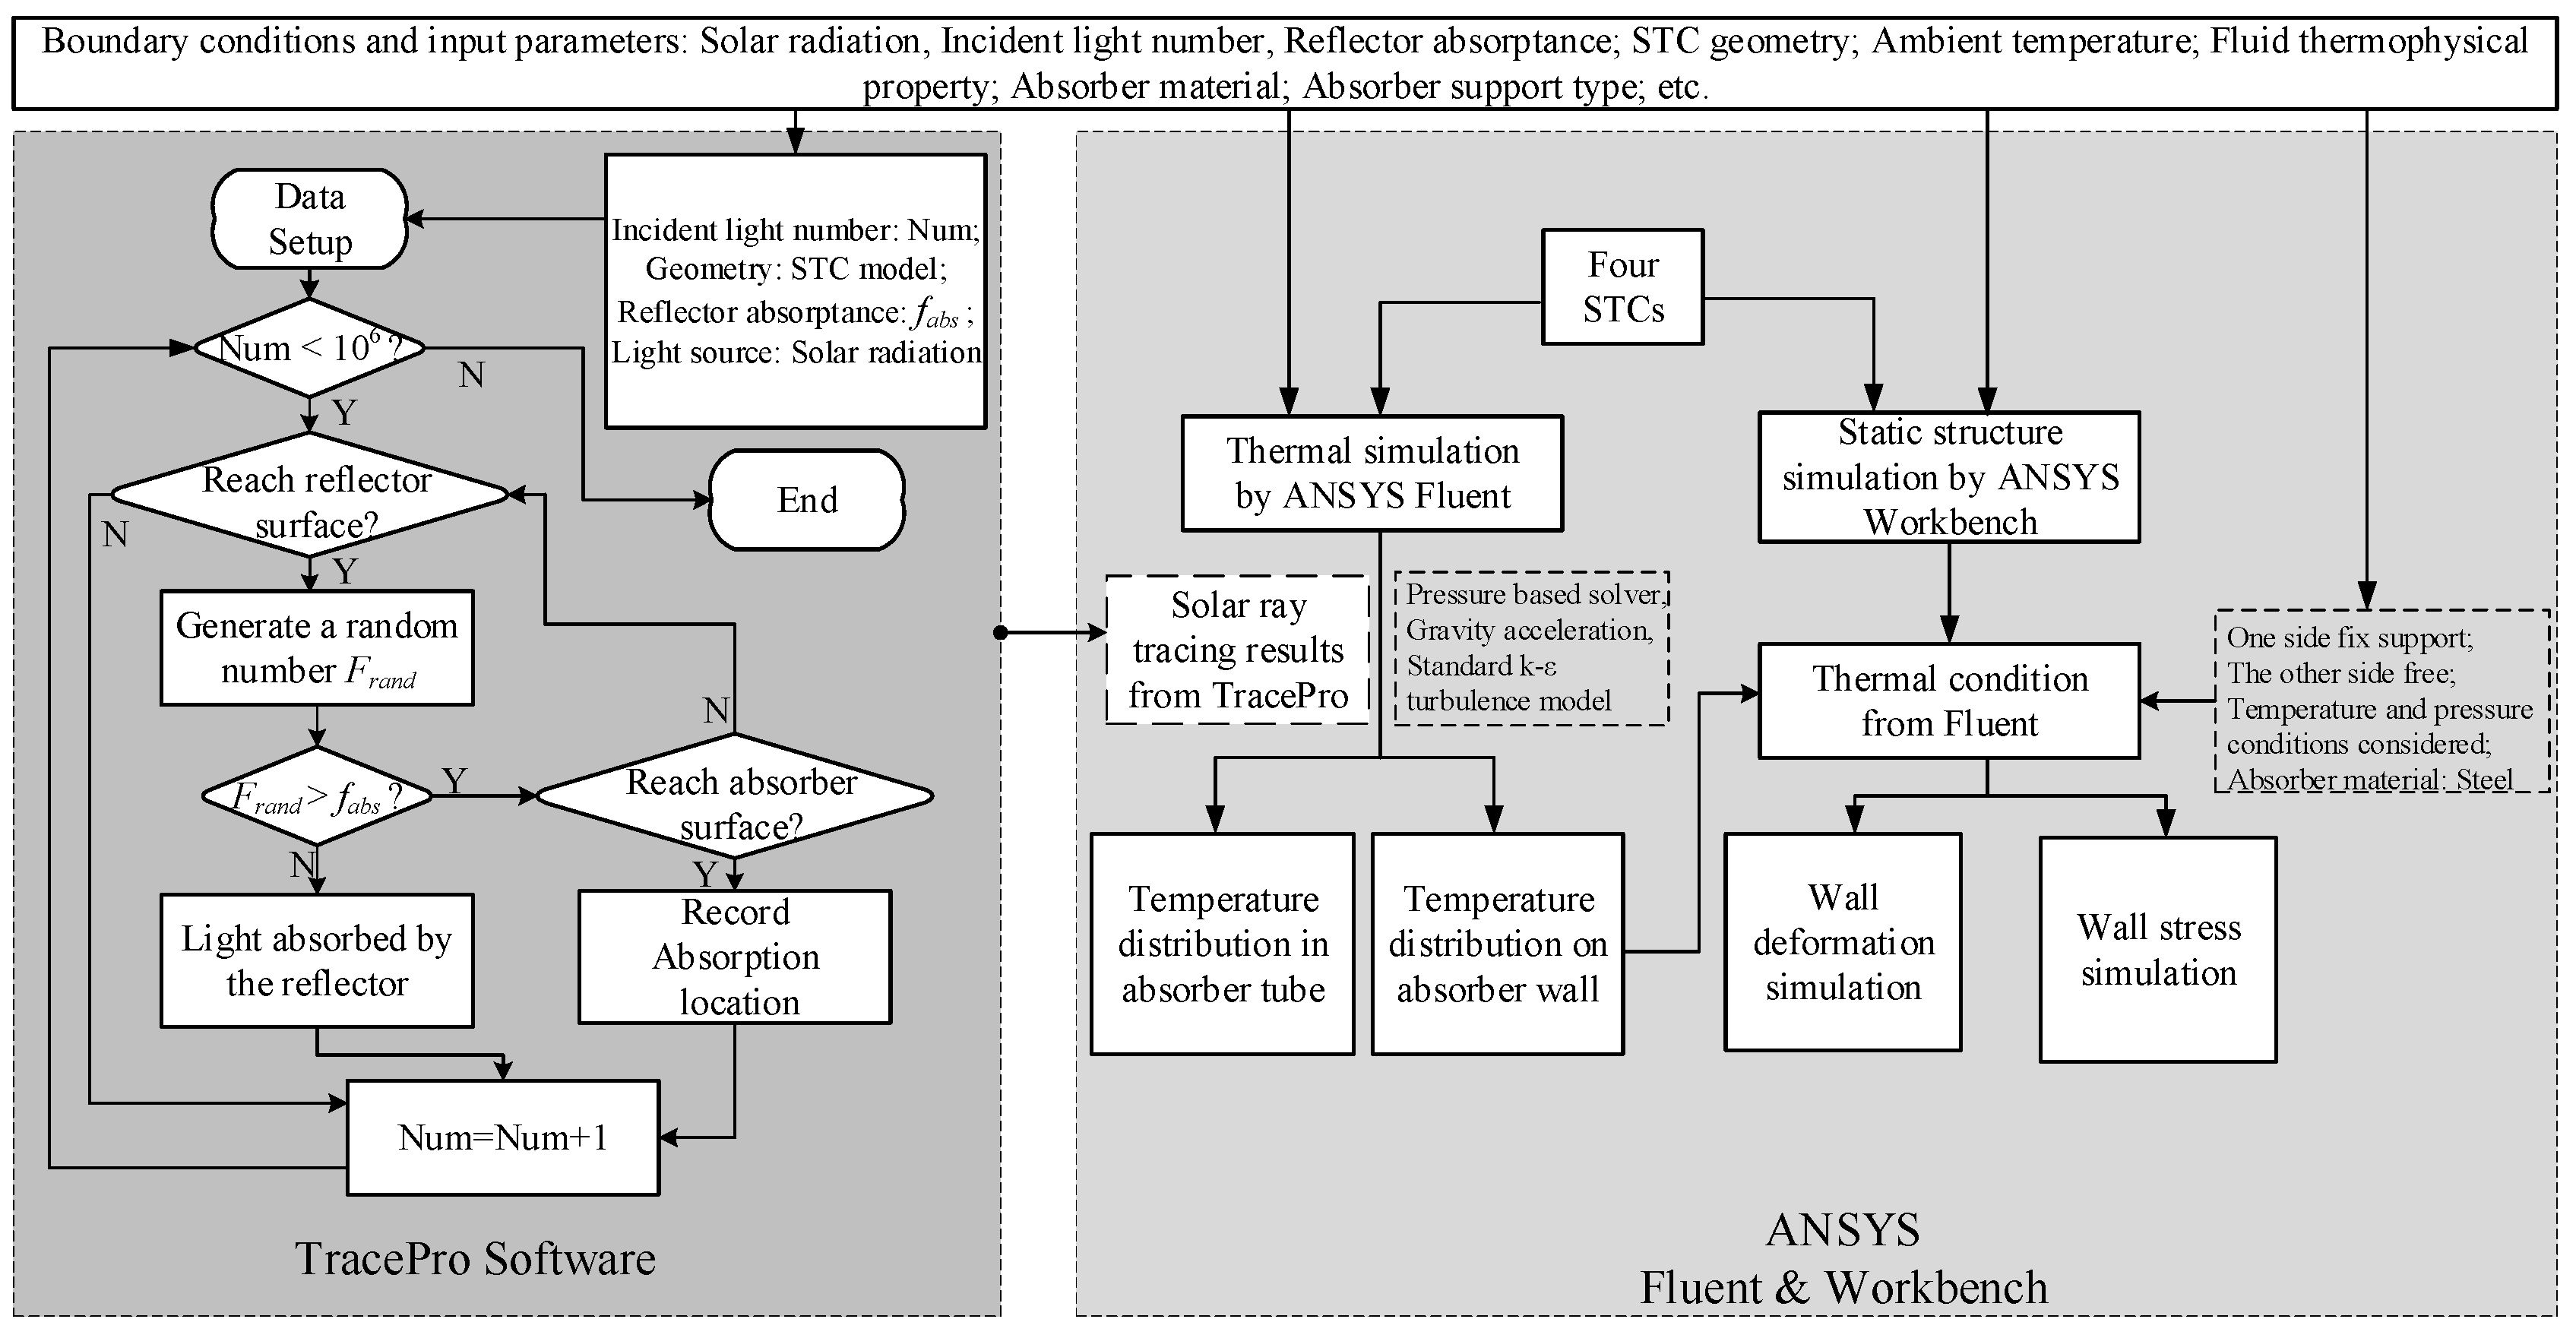
2.6. Simulation Methods
3. Results and Discussion
3.1. Model Validation
3.2. Ray Tracing Results
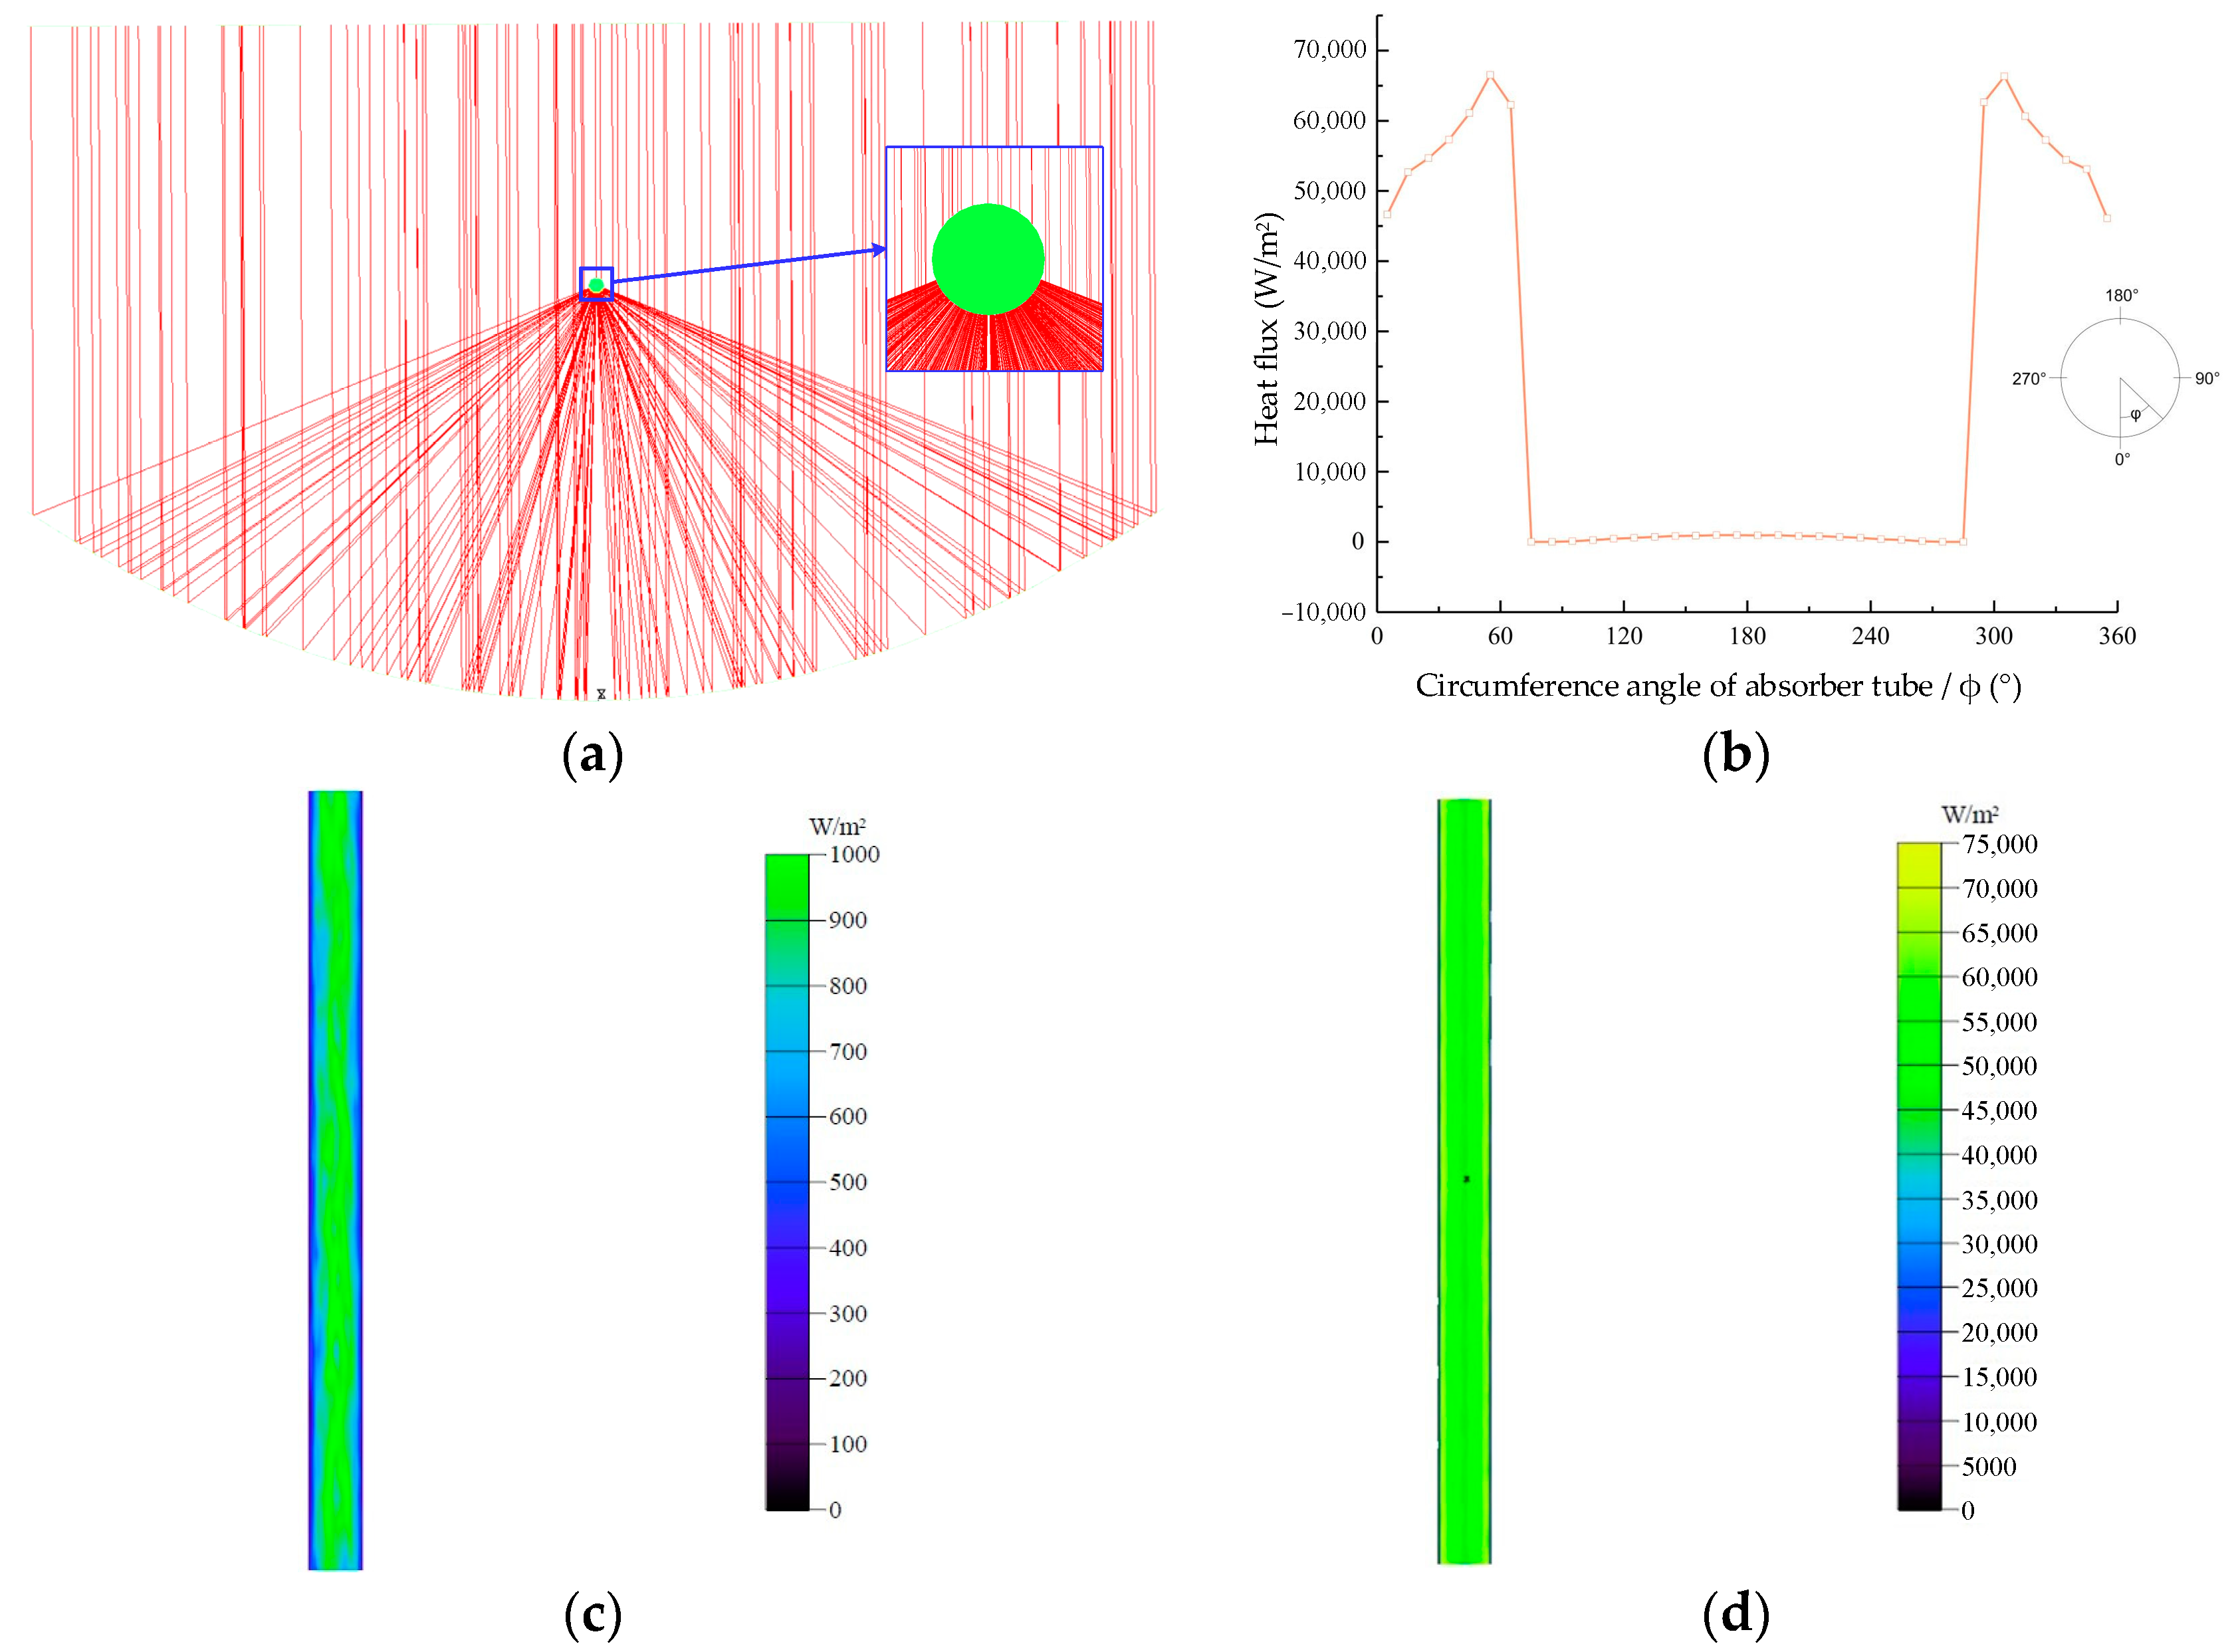
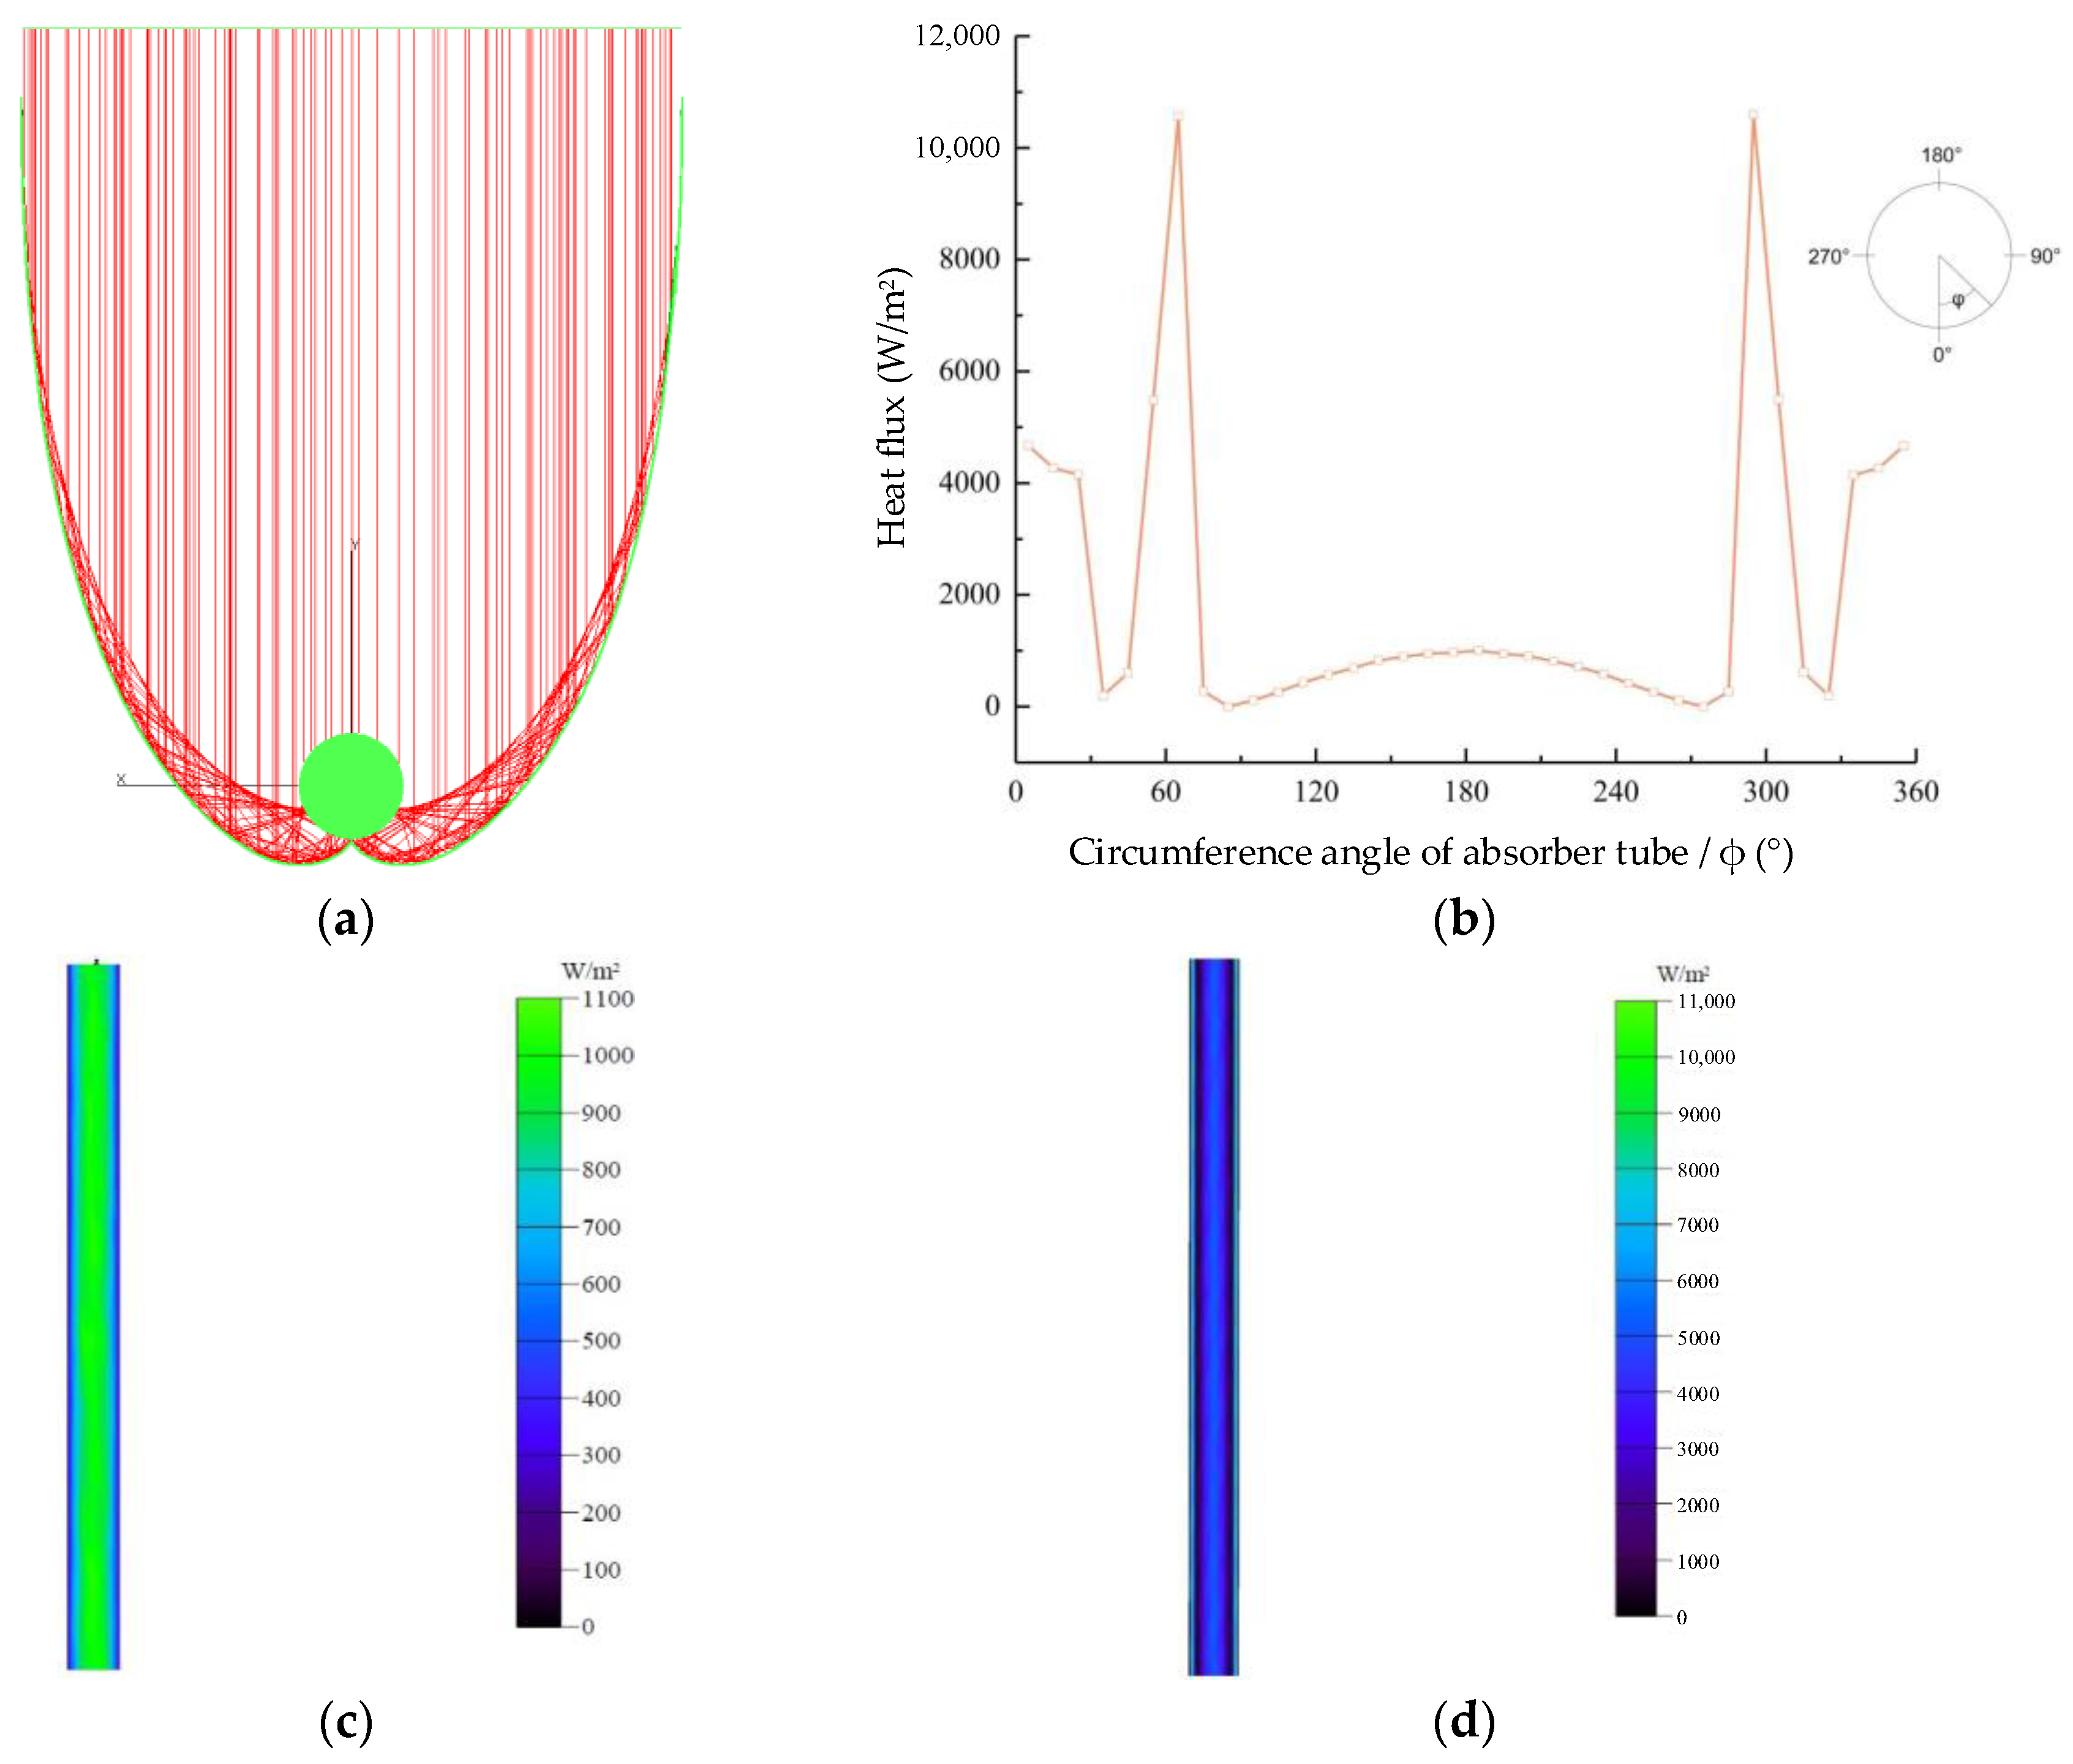
3.2.1. PTC Results
3.2.2. CPC Results
3.2.3. SUC Results
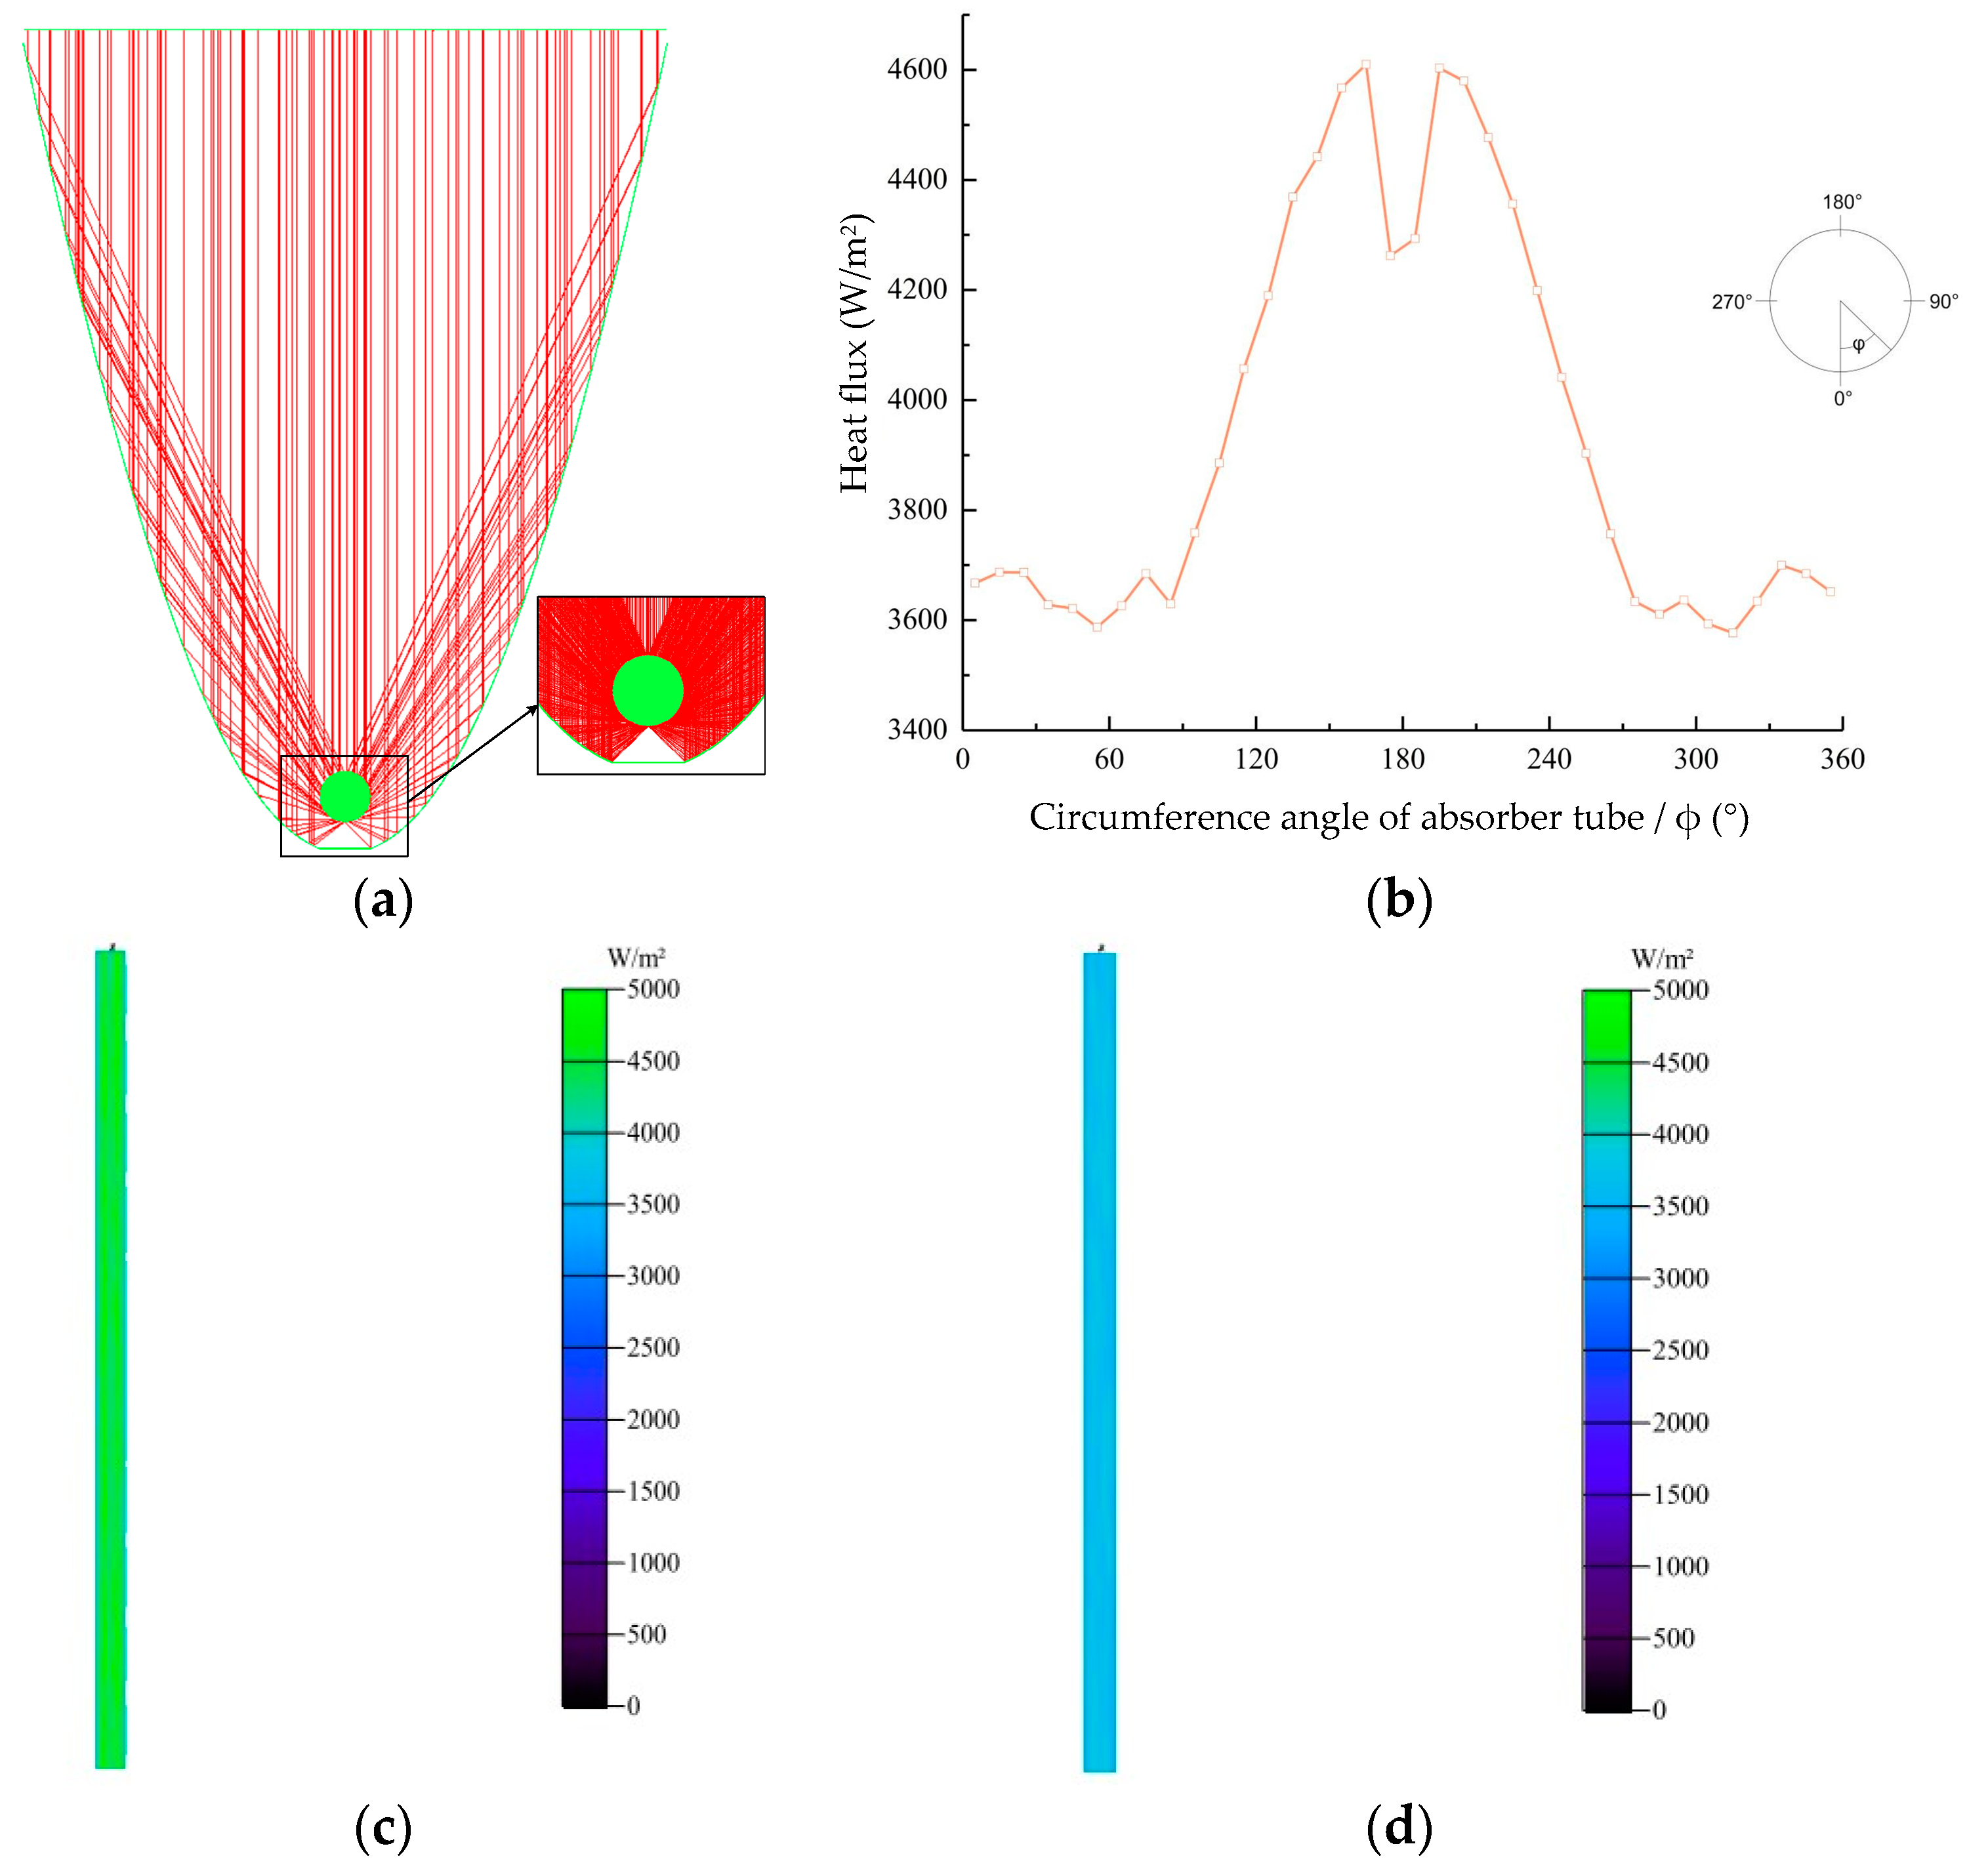
3.2.4. TTC Results
3.3. Absorber Tube Radiation Distribution Comparison
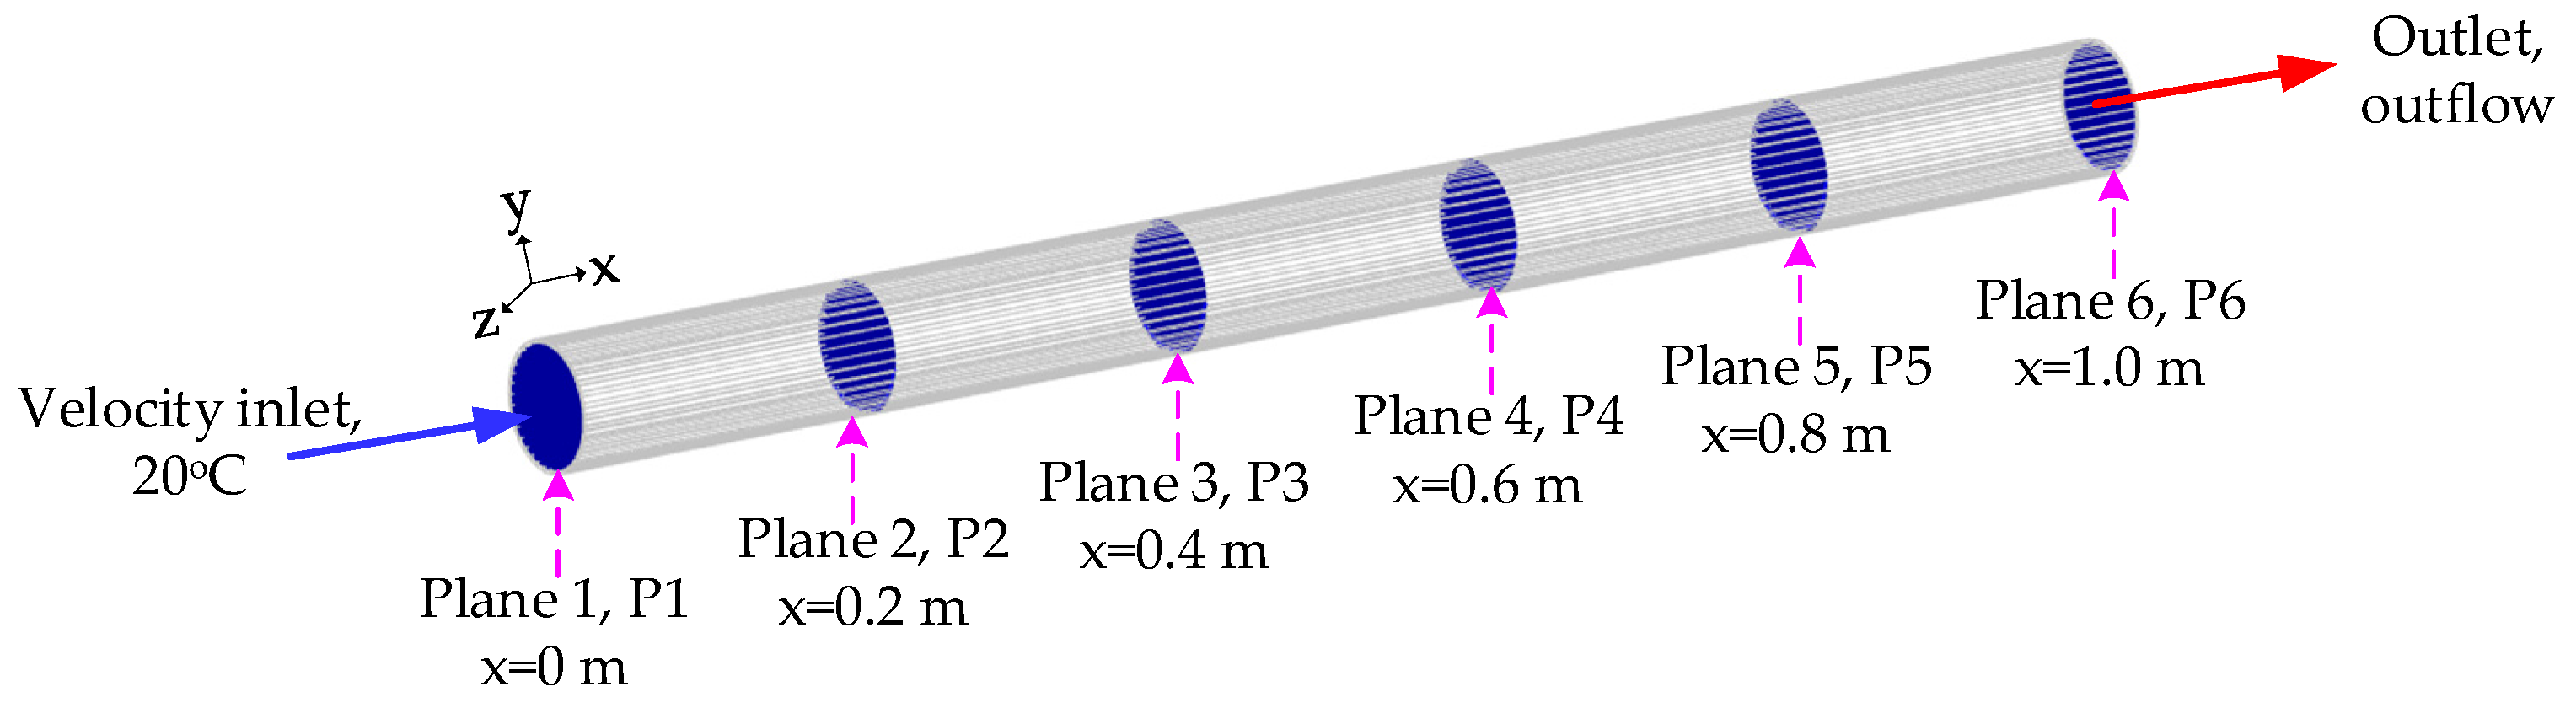
3.4. Performance Evaluation in an SWH System
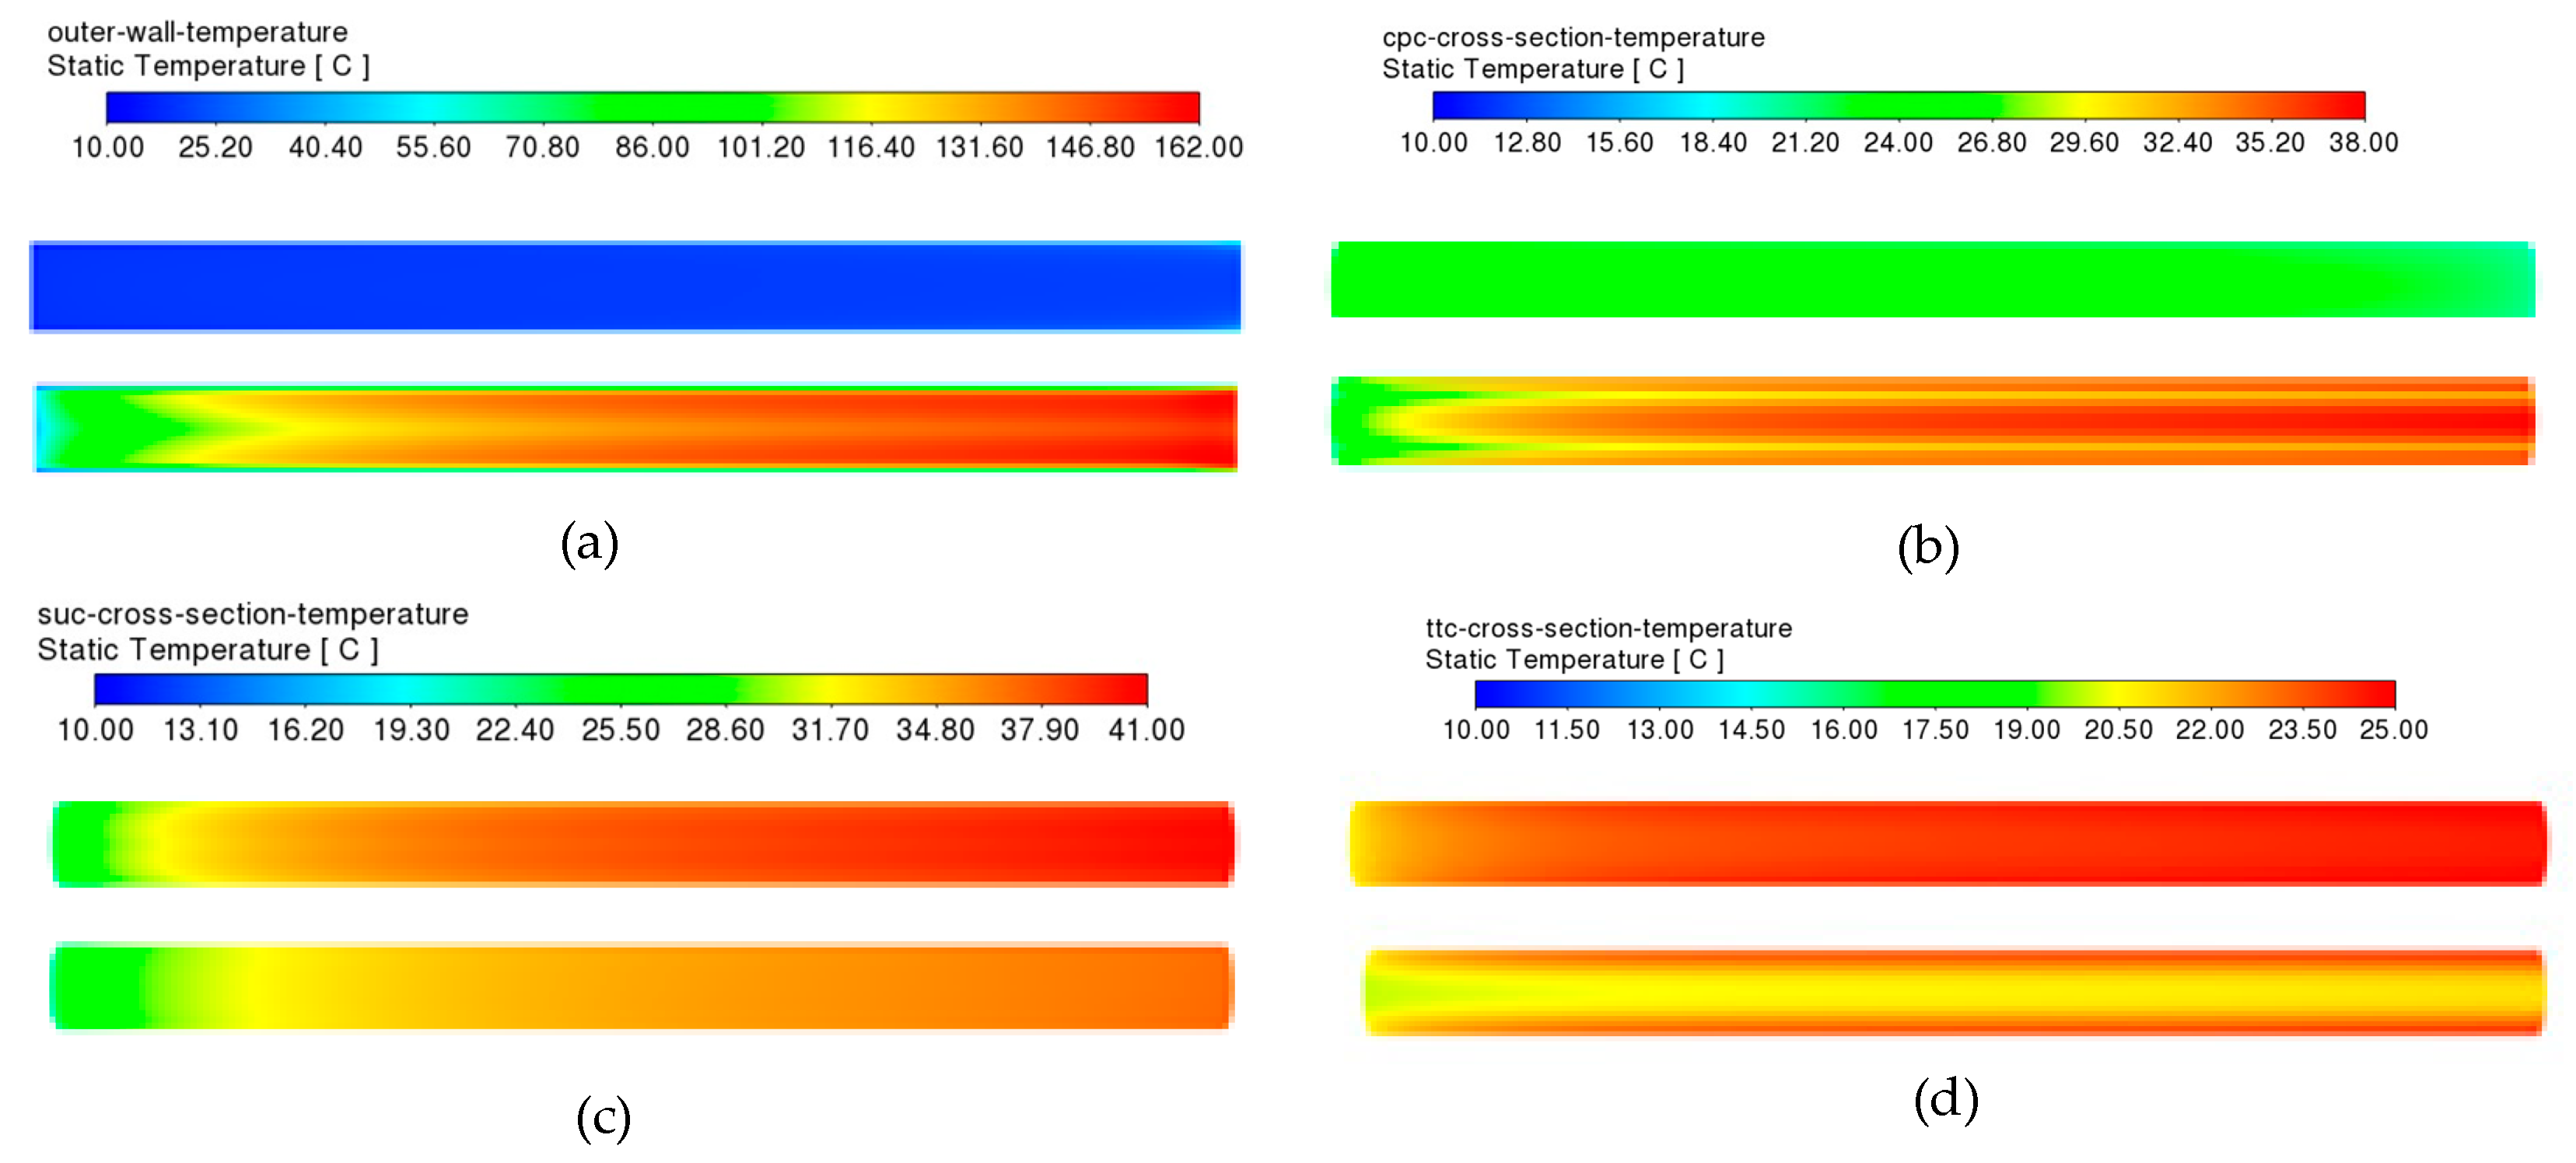
3.4.1. Comparison of Top and Bottom Wall Temperature Distributions
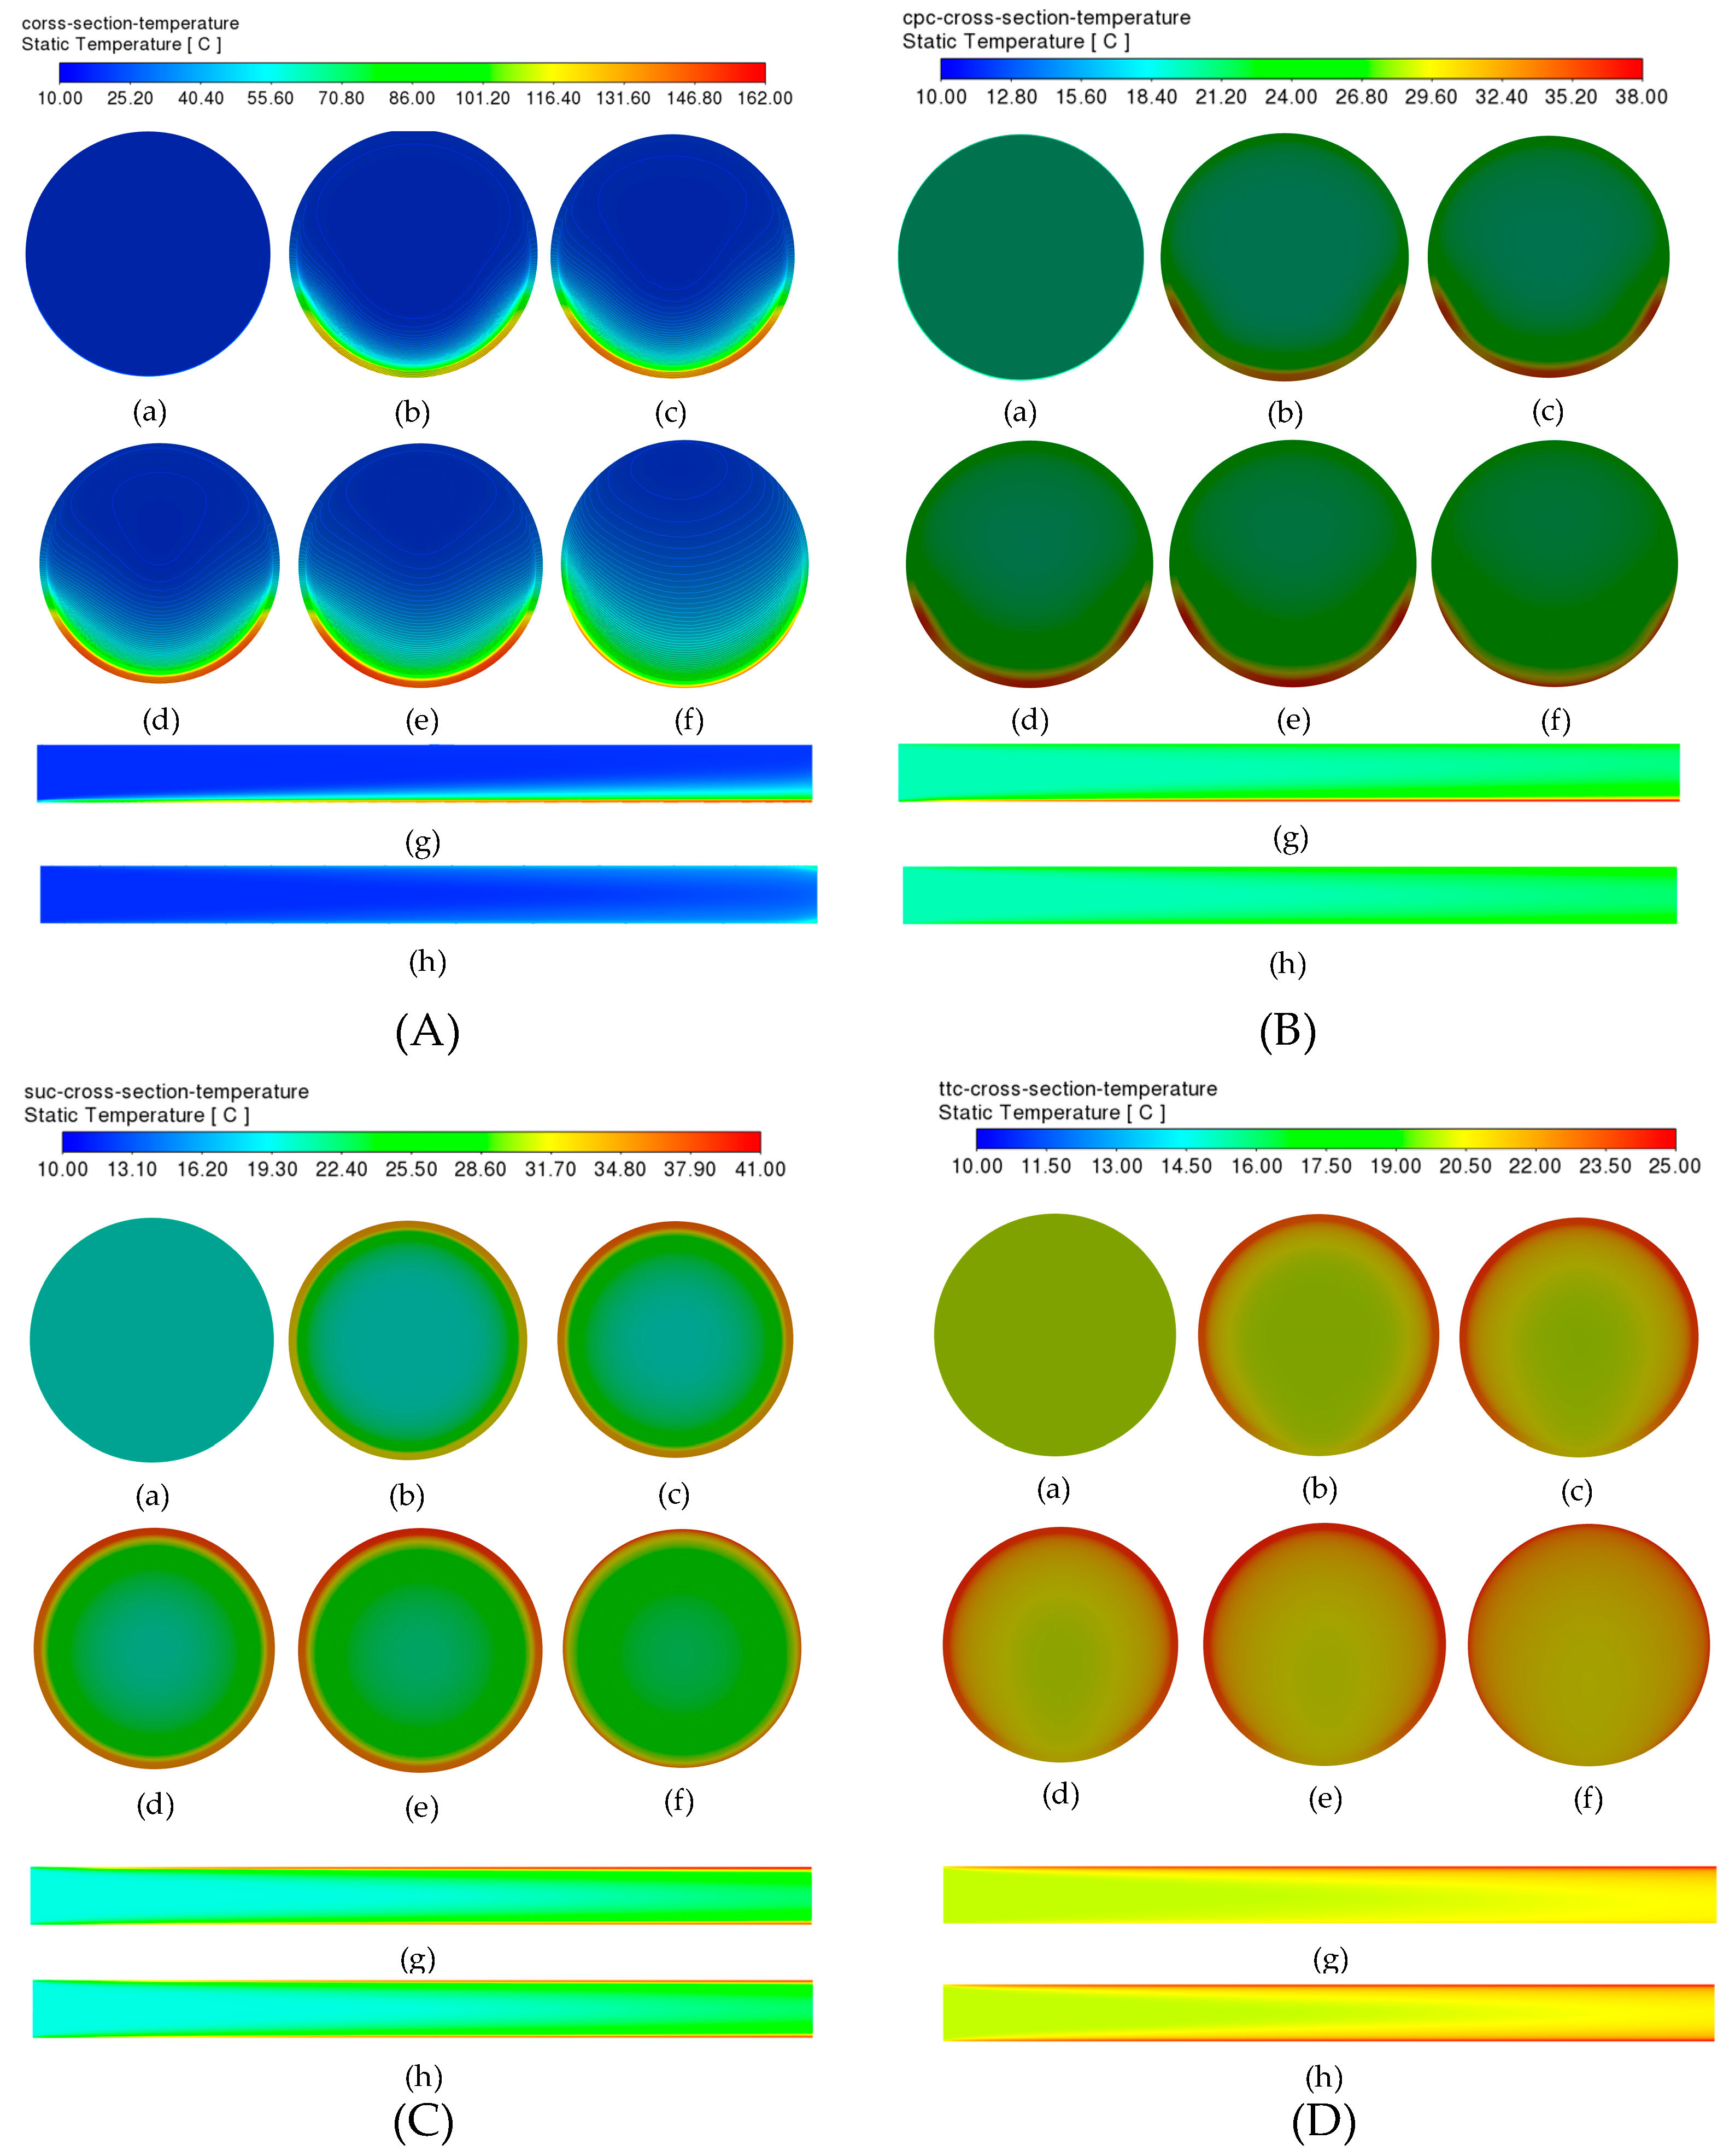
3.4.2. Comparison of Cross-Section Temperature Distribution
3.4.3. Thermal Deformation Comparison
3.5. STC Application
4. Conclusions
- (1)
- As a concentrator with a high concentration ratio, PTC has the highest solar flux with two peaks at 55° and 305° on the receiver cross-section. The CPC can generate the highest heat flux among the three low concentrators (viz. the CPC, the SUC and the TTC). There are two peaks at 65° and 300° and one secondary peak at 0° on the cross-section of the CPC. There is a dark area at the bottom of the TTC at the angle of −30°–+30° due to the absorber shielding. More uniform solar radiation distribution is found on the SUC receivers than that on the other three STCs.
- (2)
- The PTC has the worst uniformity of 0.32% among the four STCs. Compared with the CPC and the PTC, the light distribution on the TTC absorber tube is more uniform. But the TTC’s light reception ratio is poorer, whose no-light area reaches 1/6 of the whole surface. The SUC holds the highest uniformity of 87.38%, and its reflected light can reach every location of the absorber.
- (3)
- The PTC wall temperatures are much higher than the other three STCs’ even though the PTC inlet water velocity is twice the other three STCs’. The top wall temperatures of the PTC and CPC are much smaller than those at the bottom. The top wall temperature of the TTC is larger than that at the bottom. The temperature uniformity at the cross-section of the SUC is the best among the four STCs. The water temperatures inside the STCs are directly in response to their wall temperature, with the highest temperature rise in the PTC and the smallest in the TTC.
- (4)
- The STCs‘ thermal deformations are positively correlated to their wall temperatures. And the receivers deform towards the direction of low-temperature areas. The radial deformation of the SUC is much larger than those of the other three STCs. The highest equivalent stress is found in PTC. The smallest equivalent stress is found in the SUC, which is beneficial to the long-term operation of the SWH system.
Author Contributions
Funding
Data Availability Statement
Conflicts of Interest
Nomenclature
| Aa | Solar collecting area [m2] |
| Ar | Absorber tube area [m2] |
| STC | Solar trough concentrator |
| BD | Bottom distance [m] |
| Bmax | Maximum solar radiation on the absorber [W/m2] |
| Bmin | Minimum solar radiation on the absorber [W/m2] |
| C | Concentration ratio |
| CPC | Compound parabolic concentrator |
| DSG | Direct steam generation |
| f | Focal length [m] |
| fabs | Absorptance of the wall |
| Frand | Random number between 0 and 1 |
| H | Center height of the absorber tube [m] |
| h | Vertical height of the reflector [m] |
| L | Tube length [m] |
| MED-VC | Multi-Effect Distillation-Vapor Compression |
| MCRT | Monte Carlo Ray Tracing |
| NUM | Incident light number |
| ORC | Organic Rankine cycle |
| P | Focal point of the parabola |
| PTC | Parabolic trough concentrator |
| PVT | PV-thermal |
| R | Absorber tube radius [m] |
| SWH | Solar water heating |
| SUC | Surface uniform concentrator |
| TTC | Trapezoid trough concentrator |
| U | Uniform index |
| W | Opening width [m] |
| Greek symbols | |
| ϕ | Circumference angle of absorber tube [°] |
| θ | Acceptance half-angle of the CPC [°] |
| δ | Reflecting surface inclination angle [°] |
References
- Padilla, R.V.; Demirkaya, G.; Goswami, D.Y.; Stefanakos, E.; Rahman, M.M. Heat transfer analysis of parabolic trough solar receiver. Appl. Energy 2011, 88, 5097–5110. [Google Scholar] [CrossRef]
- Wang, Q.L.; Yang, H.L.; Hu, M.K.; Cao, J.Y.; Pei, G.; Yang, H.X. Optimization strategies and verifications of negative thermal-flux region occurring in parabolic trough solar receiver. J. Clean Prod. 2021, 278, 123407. [Google Scholar] [CrossRef]
- Avargani, V.M.; Divband, M. Performance evaluation of a solar water heating system with glass-covered parabolic trough concentrators under different system tracking modes. J. Therm. Anal. Calorim. 2022, 147, 4873–4888. [Google Scholar] [CrossRef]
- Bellos, E.; Tzivanidis, C.; Antonopoulos, K.A.; Gkinis, G. Thermal enhancement of solar parabolic trough collectors by using nanofluids and converging-diverging absorber tube. Renew. Energy 2016, 94, 213–222. [Google Scholar] [CrossRef]
- Freeman, J.; Hellgardt, K.; Markides, C.N. An assessment of solar-powered organic Rankine cycle systems for combined heating and power in UK domestic applications. Appl. Energy 2015, 138, 605–620. [Google Scholar] [CrossRef]
- Nafey, A.S.; Sharaf, M.A. Combined solar organic Rankine cycle with reverse osmosis desalination process: Energy, exergy, and cost evaluations. Renew. Energy 2010, 35, 2571–2580. [Google Scholar] [CrossRef]
- Zou, B.; Dong, J.K.; Yao, Y.; Jiang, Y.Q. An experimental investigation on a small-sized parabolic trough solar collector for water heating in cold areas. Appl. Energy 2016, 163, 396–407. [Google Scholar] [CrossRef]
- Calise, F. High temperature solar heating and cooling systems for different Mediterranean climates: Dynamic simulation and economic assessment. Appl. Therm. Eng. 2012, 32, 108–124. [Google Scholar] [CrossRef]
- Coccia, G.; Di Nicola, G.; Sotte, M. Design, manufacture, and test of a prototype for a parabolic trough collector for industrial process heat. Renew. Energy 2015, 74, 727–736. [Google Scholar] [CrossRef]
- El Fadar, A.; Mimet, A.; Perez-Garcia, M. Study of an adsorption refrigeration system powered by parabolic trough collector and coupled with a heat pipe. Renew. Energy 2009, 34, 2271–2279. [Google Scholar] [CrossRef]
- Sanda, A.; Moya, S.L.; Valenzuela, L. Modelling and simulation tools for direct steam generation in parabolic-trough solar collectors: A review. Renew. Sustain. Energy Rev. 2019, 113, 109226. [Google Scholar] [CrossRef]
- Temiz, M.; Dincer, I. Concentrated solar driven thermochemical hydrogen production plant with thermal energy storage and geothermal systems. Energy 2021, 219, 119554. [Google Scholar] [CrossRef]
- Sharaf, M.A.; Nafey, A.S.; Garcia-Rodriguez, L. Exergy and thermo-economic analyses of a combined solar organic cycle with multi effect distillation (MED) desalination process. Desalination 2011, 272, 135–147. [Google Scholar] [CrossRef]
- Kabeel, A.E.; Elkelawy, M.; Alm, H.; Alghrubah, E.D.A. Investigation of exergy and yield of a passive solar water desalination system with a parabolic concentrator incorporated with latent heat storage medium. Energy Convers. Manag. 2017, 145, 10–19. [Google Scholar] [CrossRef]
- Su, Z.; Gu, S.; Vafai, K. Modeling and simulation of ray tracing for compound parabolic thermal solar collector. Int. Commun. Heat Mass. 2017, 87, 169–174. [Google Scholar] [CrossRef]
- Abdullahi, B.; AL-Dadah, R.K.; Mahmoud, S.; Hood, R. Optical and thermal performance of double receiver compound parabolic concentrator. Appl. Energy 2015, 159, 1–10. [Google Scholar] [CrossRef]
- Ustaoglu, A.; Alptekin, M.; Okajima, J.; Maruyama, S. Evaluation of uniformity of solar illumination on the receiver of compound parabolic concentrator (CPC). Sol. Energy 2016, 132, 150–164. [Google Scholar] [CrossRef]
- Waghmare, S.A.; Gulhane, N.P. Optical evaluation of compound parabolic collector with low acceptance angle. Optik 2017, 149, 359–371. [Google Scholar] [CrossRef]
- Xu, R.J.; Zhang, X.H.; Wang, R.X.; Xu, S.H.; Wang, H.S. Experimental investigation of a solar collector integrated with a pulsating heat pipe and a compound parabolic concentrator. Energy Convers. Manag. 2017, 148, 68–77. [Google Scholar] [CrossRef]
- Mohan, G.; Kumar, U.; Pokhrel, M.K.; Martin, A. A novel solar thermal polygeneration system for sustainable production of cooling, clean water and domestic hot water in United Arab Emirates: Dynamic simulation and economic evaluation. Appl. Energy 2016, 167, 173–188. [Google Scholar] [CrossRef]
- Sonsaree, S.; Asaoka, T.; Jiajitsawat, S.; Aguirre, H.; Tanaka, K. A small-scale solar Organic Rankine Cycle power plant in Thailand: Three types of non-concentrating solar collectors. Sol. Energy 2018, 162, 541–560. [Google Scholar] [CrossRef]
- Dai, Y.J.; Hu, H.M.; Ge, T.S.; Wang, R.Z.; Kjellsen, P. Investigation on a mini-CPC hybrid solar thermoelectric generator unit. Renew. Energy 2016, 92, 83–94. [Google Scholar] [CrossRef]
- Brogren, M.; Nostell, P.; Karlsson, B. Optical efficiency of a PV-thermal hybrid CPC module for high latitudes. Sol. Energy 2000, 69, 173–185. [Google Scholar] [CrossRef]
- Tiwari, G.N.; Mishra, A.K.; Meraj, M.; Ahmad, A.; Khan, M.E. Effect of shape of condensing cover on energy and exergy analysis of a PVT-CPC active solar distillation system. Sol. Energy 2020, 205, 113–125. [Google Scholar] [CrossRef]
- Sharma, D.K.; Sharma, D.; Ali, A.H.H. Energy, exergy, environmental impact, and economic analyses of evacuated tube compound parabolic concentrator-powered solar thermal domestic water heating system. Environ. Sci. Pollut. Res. 2022, 29, 82390–82410. [Google Scholar] [CrossRef]
- Arunkumar, T.; Velraj, R.; Denkenberger, D.C.; Sathyamurthy, R.; Kumar, K.V.; Ahsan, A. Productivity enhancements of compound parabolic concentrator tubular solar stills. Renew. Energy 2016, 88, 391–400. [Google Scholar] [CrossRef]
- Zheng, H.F.; Tao, T.; Dai, J.; Kang, H.F. Light tracing analysis of a new kind of trough solar concentrator. Energy Convers. Manag. 2010, 52, 2373–2377. [Google Scholar] [CrossRef]
- Wang, J.; Yu, L.; Jiang, C.; Yang, S.; Liu, T.T. Optical analysis of solar collector with new V-shaped CPC. Sol. Energy 2016, 135, 780–785. [Google Scholar] [CrossRef]
- Reddy, K.S.; Satyanarayana, G.V. Numerical study of porous finned receiver for solar parabolic trough concentrator. Eng. Appl. Comp. Fluid 2008, 2, 172–184. [Google Scholar] [CrossRef]
- Wang, Z.; Tian, R.; Qi, J.; Li, P.; Wei, Q. Structural Design and Optical Performance of Inverted Trapezoidal Cavity Receiver. Acta Opt. Sin. 2017, 37, 1222003. [Google Scholar]
- Venegas-Reyes, E.; Martin-Dominguez, I.R.; Carrasco, U.D.; Enciso, R.A.P. Optical design and simulation of a circular trough solar concentrator with trapezoidal secondary reflector. In Proceedings of the 11th ISES Eurosun 2016 Conference, Palma, Spain, 11–14 October 2016; pp. 1136–1143. [Google Scholar]
- Yang, Y.; Wei, Q.Y.; Hou, J.Y.; Liu, H.; Zhao, L. Solar concentrator with uniform irradiance for particulate photocatalytic hydrogen production system. Int. J. Hydrogen Energy 2016, 41, 16040–16047. [Google Scholar] [CrossRef]
- Wei, Q.Y.; Yang, Y.; Liu, H.J.; Liu, M.C.; Cao, F.; Zhao, L. Experimental study on direct solar photocatalytic water splitting for hydrogen production using surface uniform concentrators. Int. J. Hydrogen Energy 2018, 43, 13745–13753. [Google Scholar]
- Cao, F.; Li, Y.; Wang, L.; Zhu, T.Y. Thermal performance and stress analyses of the cavity receiver tube in the parabolic trough solar collector. IOP Conf. Ser. Earth Environ. Sci. 2016, 40, 012067. [Google Scholar] [CrossRef]
- Wang, L.; Sun, J.; Zhang, Z.; Wei, J.J. A trans-dimensional multi-physics coupled analysis method for direct-steam-generation parabolic-trough loop. Appl. Therm. Eng. 2021, 193, 117011. [Google Scholar]
- Zhang, C.Z.; Xu, G.Q.; Quan, Y.K.; Li, H.W.; Song, G. Optical sensitivity analysis of geometrical deformation on the parabolic trough solar collector with Monte Carlo Ray-Trace method. Appl. Therm. Eng. 2016, 109, 130–137. [Google Scholar] [CrossRef]
- Duffie, J.A.; Beckman, W.A. Solar Engineering of Thermal Process, 3rd ed.; John Wiley & Sons, Inc.: New York, NY, USA, 2006; pp. 322–373. [Google Scholar]
- Liu, T.; Wang, J.; Bing, Q.; Yang, F.; Feng, W.; Wang, D. Simulation study of concentrating characteristics of trough solar collector. Acta Energy Sol. Sin. 2017, 38, 3202–3209. [Google Scholar]
- Cao, F.; Wei, Q.; Liu, H.; Lu, N.; Zhao, L.; Guo, L. Development of the direct solar photocatalytic water splitting system for hydrogen production in Northwest China: Design and evaluation of photoreactor. Renew. Energy 2018, 121, 153–163. [Google Scholar] [CrossRef]
- Cao, F.; Liu, H.; Wei, Q.; Zhao, L.; Guo, L. Experimental study of direct solar photocatalytic water splitting for hydrogen production under natural circulation conditions. Int. J. Hydrogen Energy 2018, 43, 13727–13737. [Google Scholar] [CrossRef]


| STC Type | Parameter | Value | Concentration Ratio, C |
|---|---|---|---|
| PTC | Opening width, W | 5 m | 22.75 |
| Absorber tube radius, R | 0.035 m | ||
| Tube length, L | 1 m | ||
| CPC | Acceptance half-angle, θ | 30° | 2 |
| Absorber tube radius, R | 0.035 m | ||
| Tube length, L | 1 m | ||
| SUC | Absorber tube radius, R | 0.02 m | 4 |
| Bottom distance, BD | 0.04 m | ||
| Tube length, L | 1 m | ||
| TTC | Opening width, W | 0.18 m | 1.21 |
| Absorber tube radius, R | 0.02 m | ||
| Height, H | 0.05 m | ||
| Absorber tube central height, h | 0.03 m | ||
| Reflector tilted angle, θ | 36° | ||
| Tube length, L | 1 m |
| STC Type | Central Angle of Reflected Light (°) | None-Light Central Angle (°) | Light Reception Ratio (-) | Uniformity (-) |
|---|---|---|---|---|
| PTC | 140 | 40 | 100% | 0.32% |
| CPC | 160 | 20 | 100% | 2.12% |
| SUC | 360 | 0 | 100% | 87.38% |
| TTC | 260 | 60 | 70% | 80.50% |
| STC Type | Inlet | Outlet | Outer Wall | ||
|---|---|---|---|---|---|
| Boundary Condition | Velocity | Temperature | Boundary Condition | Heat Flux | |
| PTC | Velocity inlet | 0.02 m/s 1 | 20 °C | Outflow | Solar ray-tracing results as shown in Figure 7 |
| CPC | Velocity inlet | 0.01 m/s | 20 °C | Outflow | Solar ray-tracing results as shown in Figure 8 |
| SUC | Velocity inlet | 0.01 m/s | 20 °C | Outflow | Solar ray-tracing results as shown in Figure 9 |
| TTC | Velocity inlet | 0.01 m/s | 20 °C | Outflow | Solar ray-tracing results as shown in Figure 10 |
| STC Type | Light Reception | Uniformity | Concentration Ratio | Absorber Types | Application Field |
|---|---|---|---|---|---|
| PTC | Full area | Low | High | Circular tubes, flat plates, cavity receivers | High-temperature solar thermal, DSG, CPV |
| CPC | Full area | Low | Low | Circular tubes, flat plates, cavity receivers | Solar thermal, solar photocatalysis, solar desalination |
| SUC | Full area | High | Low | Circular tubes, cavity receivers | Solar thermal, solar photocatalysis, solar PV |
| TTC | Part area | High | Low | Flat plates, cavity receivers | Solar thermal, solar PV |
Disclaimer/Publisher’s Note: The statements, opinions and data contained in all publications are solely those of the individual author(s) and contributor(s) and not of MDPI and/or the editor(s). MDPI and/or the editor(s) disclaim responsibility for any injury to people or property resulting from any ideas, methods, instructions or products referred to in the content. |
© 2023 by the authors. Licensee MDPI, Basel, Switzerland. This article is an open access article distributed under the terms and conditions of the Creative Commons Attribution (CC BY) license (https://creativecommons.org/licenses/by/4.0/).
Share and Cite
Cao, F.; Pang, J.; Gu, X.; Wang, M.; Shangguan, Y. Performance Simulation of Solar Trough Concentrators: Optical and Thermal Comparisons. Energies 2023, 16, 1673. https://doi.org/10.3390/en16041673
Cao F, Pang J, Gu X, Wang M, Shangguan Y. Performance Simulation of Solar Trough Concentrators: Optical and Thermal Comparisons. Energies. 2023; 16(4):1673. https://doi.org/10.3390/en16041673
Chicago/Turabian StyleCao, Fei, Jiarui Pang, Xianzhe Gu, Miaomiao Wang, and Yanqin Shangguan. 2023. "Performance Simulation of Solar Trough Concentrators: Optical and Thermal Comparisons" Energies 16, no. 4: 1673. https://doi.org/10.3390/en16041673
APA StyleCao, F., Pang, J., Gu, X., Wang, M., & Shangguan, Y. (2023). Performance Simulation of Solar Trough Concentrators: Optical and Thermal Comparisons. Energies, 16(4), 1673. https://doi.org/10.3390/en16041673