Article

Selecting the Safe Area and Finding Proper Ventilation in the Spread of the COVID-19 Virus

1
Center of Computational Energy, Department of Mechanical Engineering, Hakim Sabzevari University, Sabzevar 9617976487, Iran
2
Department of Mechanical Engineering, Andong National University, Andong 36729, Republic of Korea
3
Department of Power Engineering and Turbomachinery, Silesian University of Technology, 44-100 Gliwice, Poland
4
Institute of Advanced Aerospace Technology, Seoul National University, Seoul 08826, Republic of Korea
5
School of Biomedical Engineering, University of Technology Sydney, Sydney, NSW 2007, Australia
6
Department of Mechanical and Aerospace Engineering, Clarkson University, Potsdam, NY 13699-5725, USA
*
Authors to whom correspondence should be addressed.
Energies 2023, 16(4), 1672; https://doi.org/10.3390/en16041672
Submission received: 24 December 2022 / Revised: 29 January 2023 / Accepted: 6 February 2023 / Published: 7 February 2023

Abstract

:
Coughing and sneezing are the main ways of spreading coronavirus-2019 (SARS-CoV-2). People sometimes need to work together at close distances. This study presents the results of the computational fluid dynamics (CFD) simulation of the dispersion and transport of respiratory droplets emitted by an infected person who coughs in an indoor space with an air ventilation system. The resulting information is expected to help in risk assessment and development of mitigation measures to prevent the infection spread. The turbulent flow of air in the indoor space is simulated using the k-ε model. The particle equation of motion included the drag, the Saffman lift, the Brownian force and gravity/buoyancy forces. The innovation of this study includes A: Using the Eulerian–Lagrangian CFD model for the simulation of the cough droplet dispersion. B: Assessing the infection risk by the Wells–Riley equation. C: A safer design for the ventilation system (changing the ventilation supplies and exhausts in the indoor space and choosing the right location for air ventilation). The droplet distribution in the indoor space is strongly influenced by the air ventilation layout. The air-curtain flow pattern significantly reduces the dispersion and spreading of virus-infected cough droplets. When the ventilation air flow occurs along the room length, it takes about 115 s for the cough droplets to leave the space. However, when the ventilation air flow is across the width of the indoor space and there are air curtain-type air flow patterns in the room, it takes about 75 s for the cough droplets to leave the space.

1. Introduction

The emergence of the SARS-CoV-2 virus has affected people’s lives worldwide in recent years. In addition, many people live or work in closed spaces. Therefore, the ventilation system is very important, and designing the right location for the inlet and exit of the ventilation airflow is critical because it can increase or prevent the spread of virus- carrying droplets in indoor spaces. It is also necessary to check the infection risk of people in indoor areas and, if possible, place people in locations to lower their chances of contracting this virus.
Many studies have been made on the virus structure and numerical prediction of virus transmission (particles created by coughing or sneezing). Bar et al. [1] investigated the physical conditions of the virus and the size, volume, and mass of droplets containing the virus. Accordingly, the saliva droplets are mostly water with a density close to water. Mucus droplets have a lot of non-volatile compounds with a higher viscosity. Li et al. [2] performed multiple simulations and examined the biological conditions of the virus. They provided a deep insight into the spreading and transmission of the COVID-19 virus. The results show that respiratory infection is the main route of virus transmission and the urban environment has a significant effect on the infection risk.
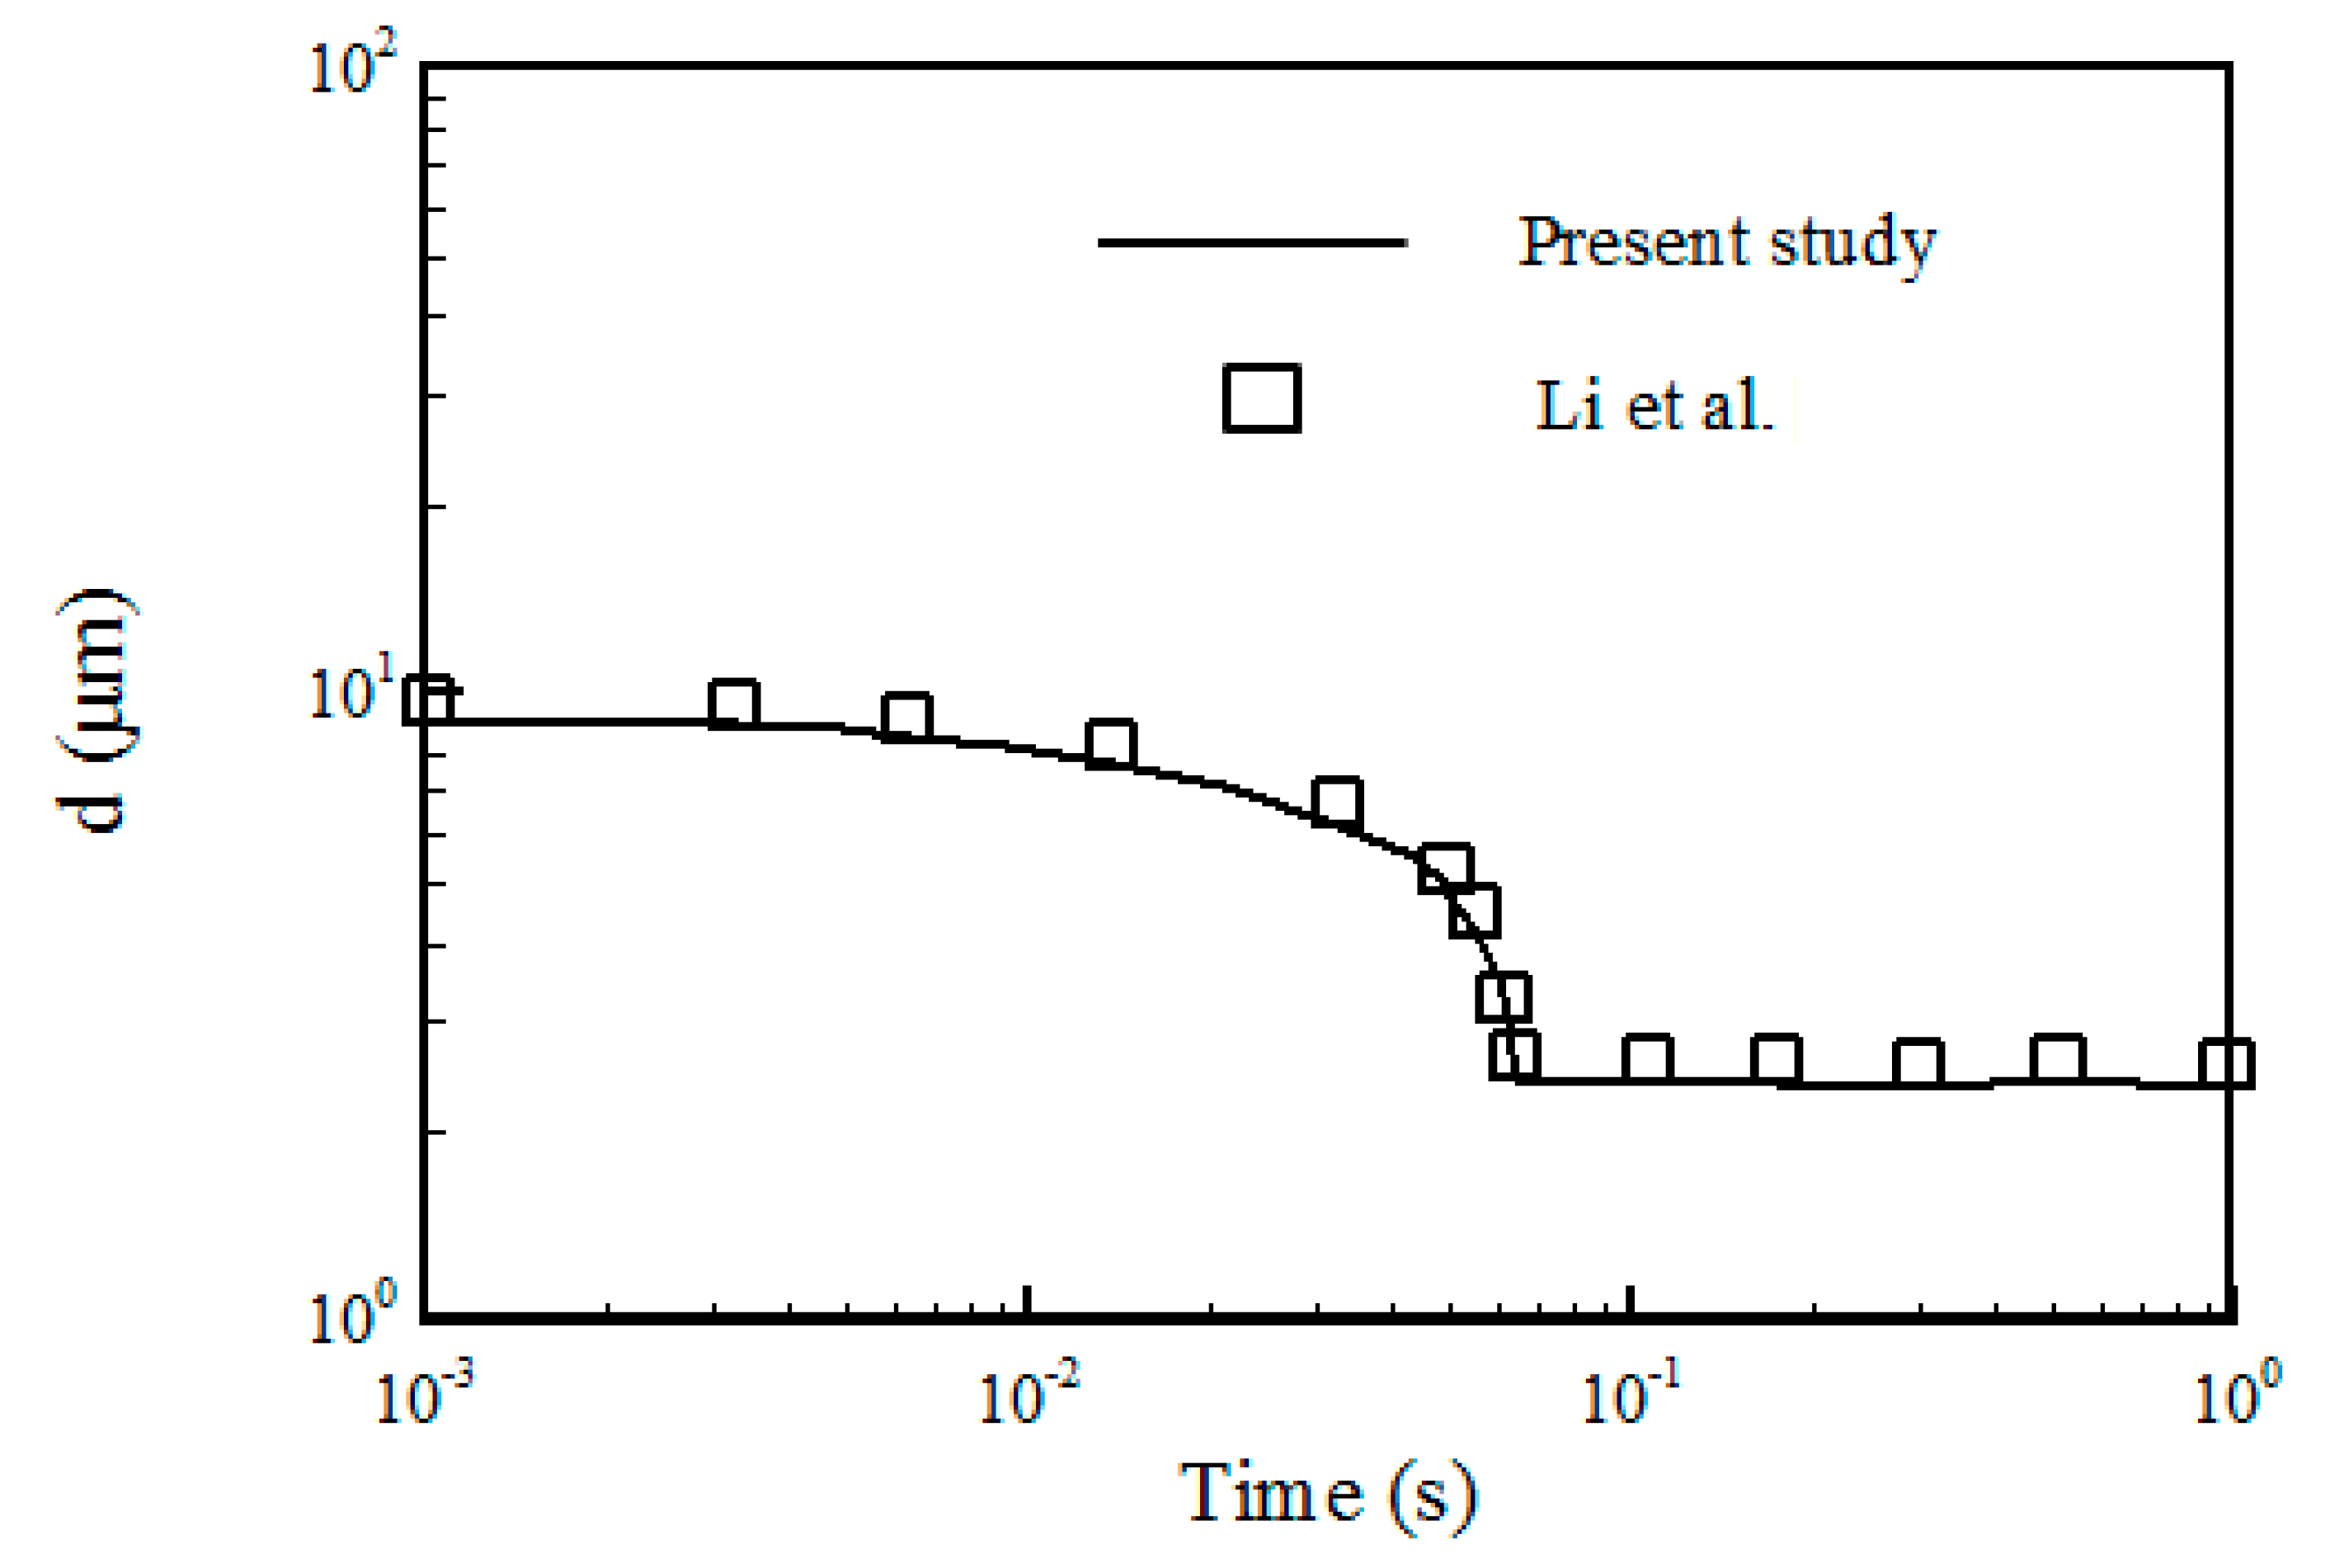
It is essential to use an appropriate turbulence model in calculations. Recently, Li et al. [3] showed that the performance of supply/exhaust openings had a substantial impact on the distribution of pollutant particles in clean rooms. They used the RNG k-ε turbulence model and the Eulerian–Lagrangian approach for particle tracking. Redrow et al. [4] examined the dispersion of droplets emitted from patients’ mouths using the k-ε RNG turbulence model. Their simulation included the evaporation and diffusion of sputum particles expelled by humans coughing or sneezing.
The results of the research on the influenza virus indicate that the spread of respiratory viruses in indoor environments is mainly caused by air circulation. Liu et al. [5] performed a numerical analysis and investigated particle dispersion in laboratory conditions. They used the standard k-ε turbulence model and the Eulerian–Lagrangian approach for particle tracking. Miranda et al. [6] studied the ventilation conditions in school classrooms. Analysis of different variables and their effect on particle emission was evaluated. Mirzaie et al. [7] examined the distribution of droplets containing the SARS-CoV-2 virus in a classroom with and without seat partitions. They used the Lagrangian method to track droplets. Their results showed that using partitions could help reduce infections. In the absence of seat partitions, the concentration of respiratory droplets around the student seats close to the infected speaker was higher. Ahmadzadeh et al. [8] studied particle dispersion in a classroom. They examined the conditions of the spread of Covid-19 in an indoor environment. They concluded that opening the classroom window had a significant effect on reducing virus-carrying particles. Asif et al. [9] studied preventive measures and emerging technologies in detecting and preventing the spread of COVID-19 virus-carrying droplets. They showed that wearing a mask effectively prevented the spread of the disease. Kim et al. [10] studied the effect of using a face mask and if it provides the necessary immunity against the virus. Additionally, making masks of recycled materials and modifying them chemically has a significant impact on reducing environmental problems. It also turns them into materials with a high added value. Motamedi et al. [11] proposed a framework for assessing the infection risk in relation to both spatial and temporal characteristics. First, a verified CFD model of exhaled droplets is created, and then its performance is assessed using an office case study affected by various ventilation techniques, including cross ventilation, single ventilation, mechanical ventilation, and no ventilation cases. To assess the infection probability of the ventilation cases, two indicators of local and general infection risks were utilized. Their results show that the single ventilation case has the highest infection probability.
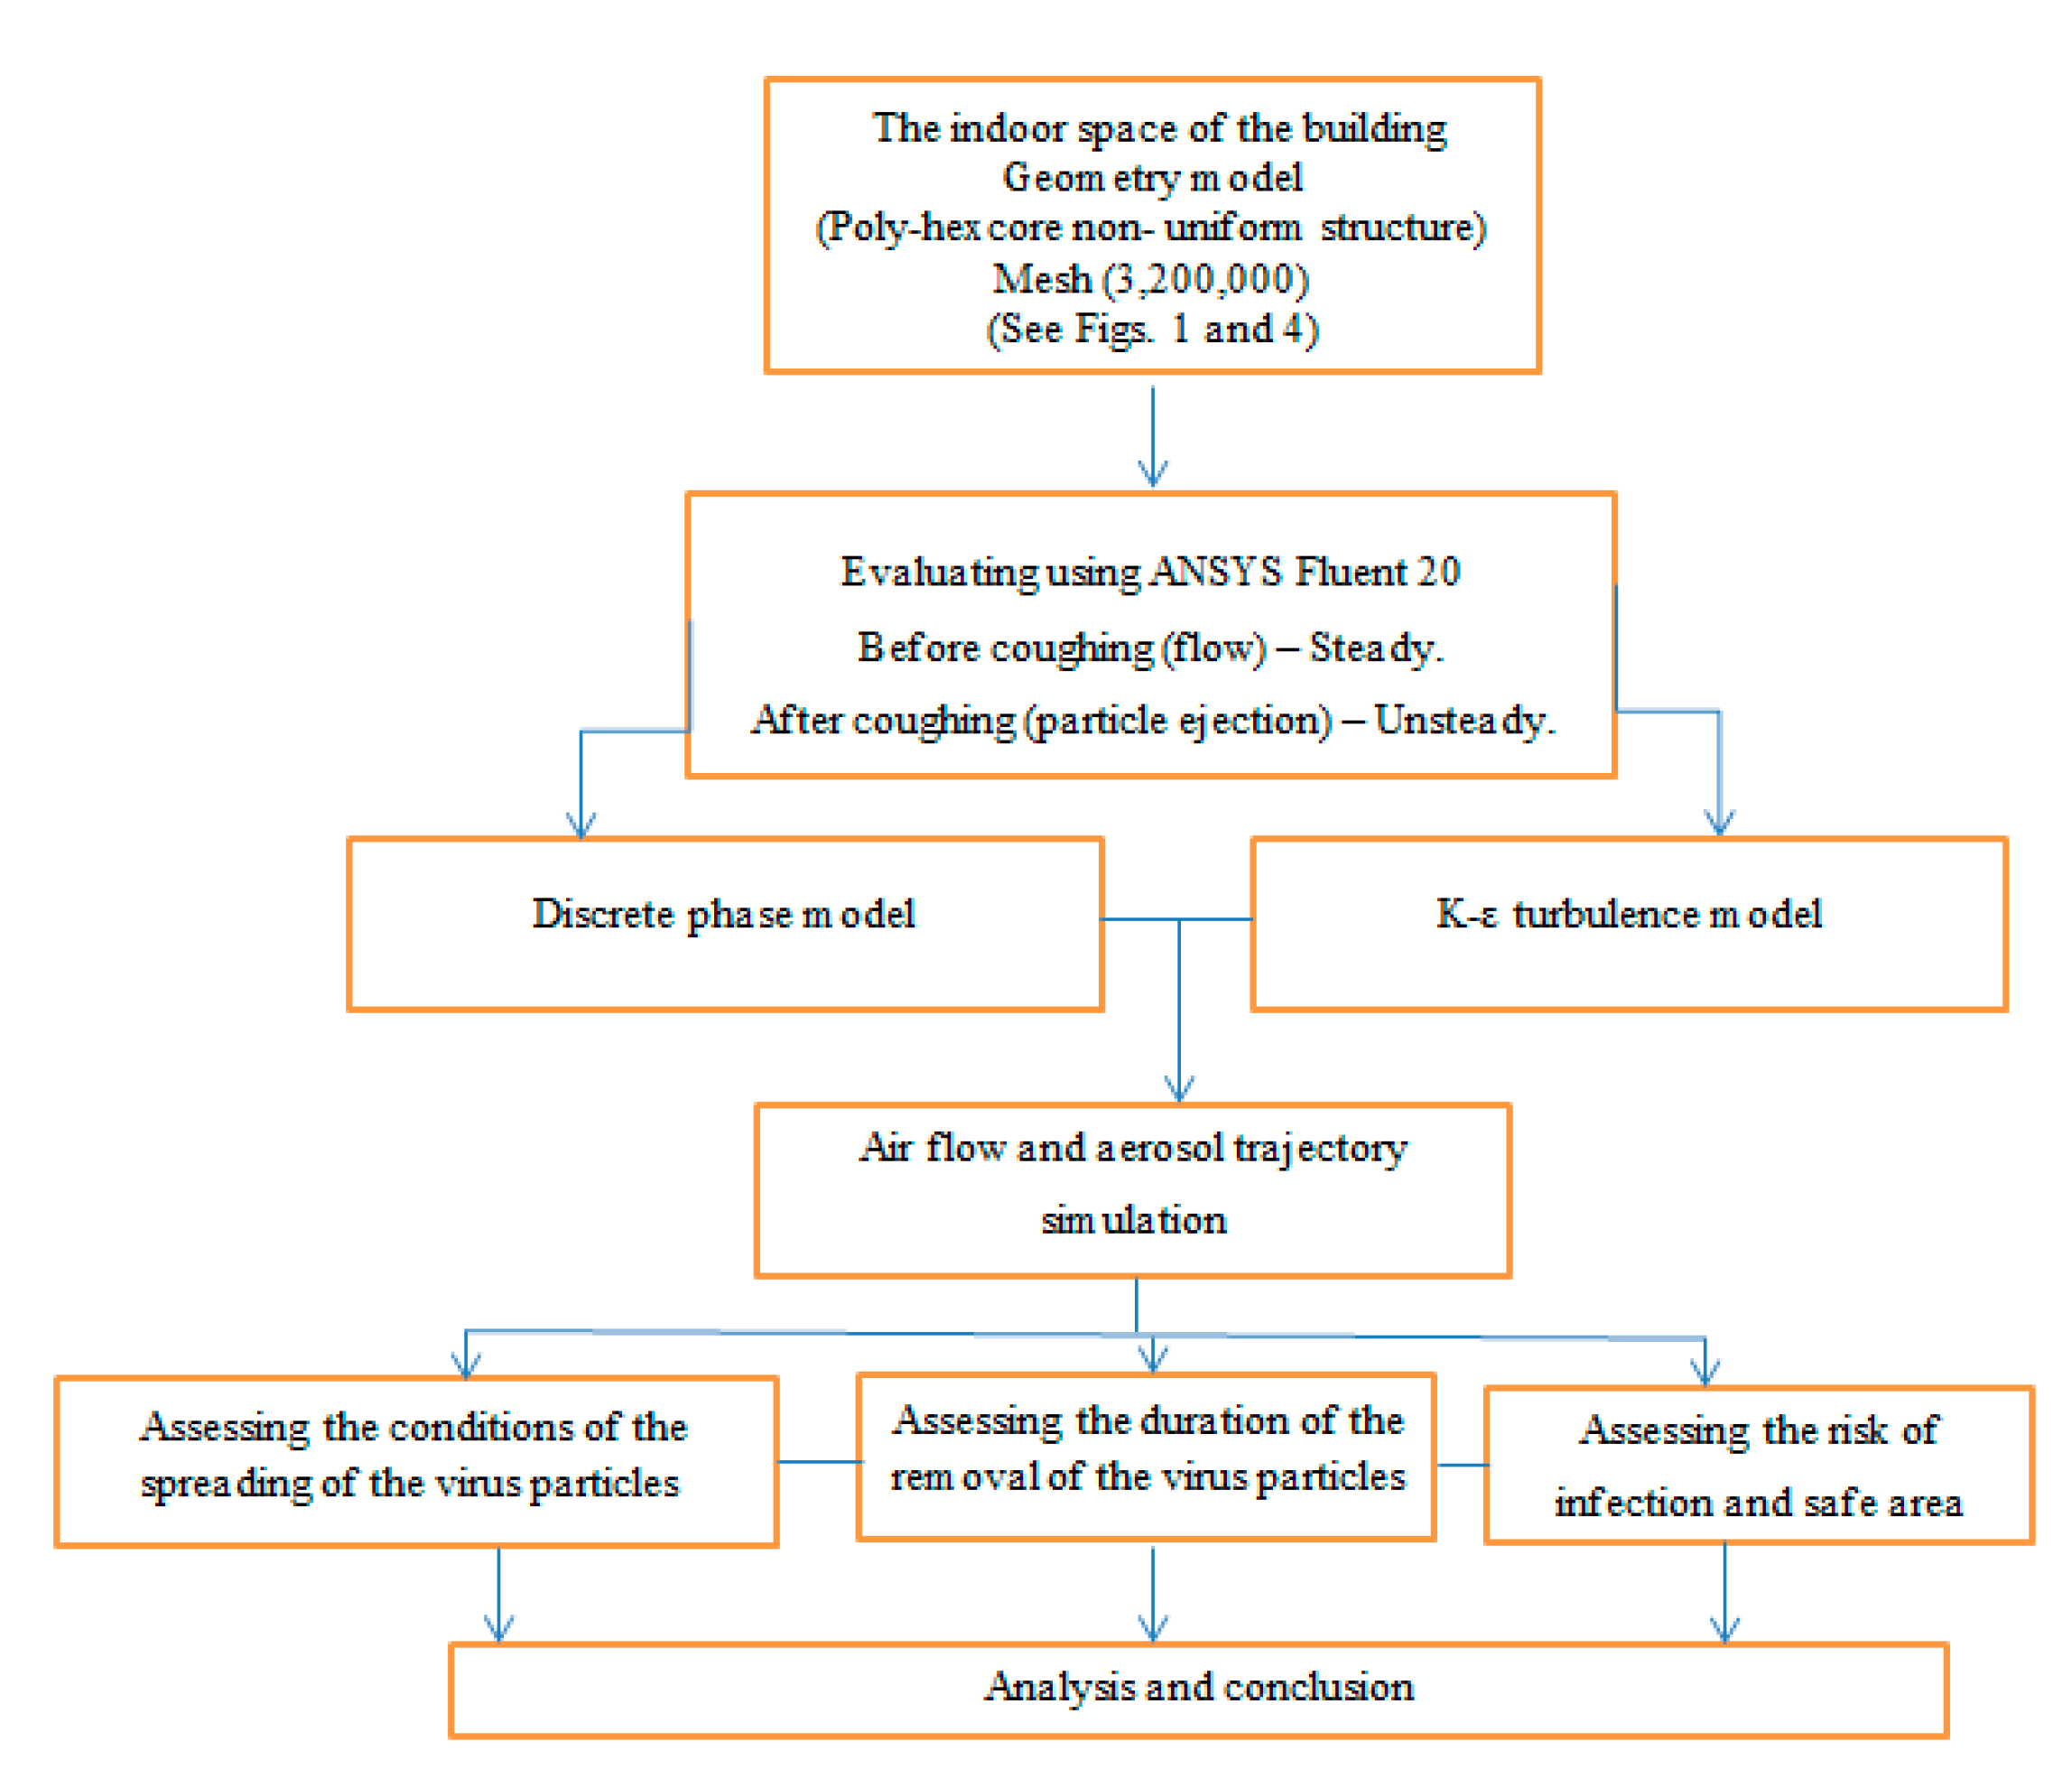
Nowadays, more research in the field of COVID-19 virus in order to finding a way to prevent further spread of this virus is very important. One of the issues that can affect the further spread and transmission of this virus is the discussion of how to design air ventilation systems in a specific space. Most modern buildings use mechanical ventilation systems. Mechanical ventilation systems use fans and ducts to bring the fresh air inside the target space. The main aim of this paper is to design a proper placement of inlet and exhaust ducts of a ventilation system in order to create a safe area in a space, so that the infection risk at this point reaches its lowest level. Various research and methods have been suggested to reduce the spread of virus particles in the spaces, such as leaving the doors and windows open, partitioning the area, and using an additional fan to remove the particles. These methods are not reasonable, as they waste more money and energy. In addition, there is a need for an independent ventilation system and a costly redesign of the interior of the room. This paper, however, presents a new method to design the appropriate location of the air ventilation ducts, so that it is a practical method and leads to logical results in order to reduce the spread of the virus, and it does not cause significant costs and energy waste like other methods. In other words, the new approach suggests suitable locations for the ventilation supply and exhaust registers that ensure proper space ventilation, reduce the spread of droplets and particles in the area, and decrease the possibility of occupants being infected with the virus. The simulation is conducted using an Eulerian–Lagrangian scheme, the infection risk is evaluated using the Wells–Riley equation, and, finally, a safe area is defined by changing the position of the ventilation supply and exhaust registers.

2. Methodology

2.1. Test Cases

In this research, two cases are considered; Figure 1 shows Case 1, when the ventilation air flow is along the length of the indoor space. Figure 2 shows Case 2, when the ventilation air flow is across the width of the indoor space. In Fig. 1 and 2, the room area is devided in 3 regions, namely A, B and C.
It is known that the respiratory droplet emitted by one person infected with the COVID-19 virus in an indoor environment causes the contamination of other people in that space. Figure 1 shows a large 10 m × 6 m × 3 m (L × W × H) room that is considered in this study. The ventilation air flow along the length of the indoor space and the 0.5 m2 ventilation supply and exhaust registers are also shown in the figure. The height of the mouth/nose through which air is inhaled or exhaled is 1.65 m.
Figure 2 shows the room with the ventilation system inlet and outlet. The flow rates and other information are the same as in Figure 1. The ventilation air flow across the width of the indoor space is similar to an air curtain. Figure 3 shows the division of the room space into 15 areas using a virtual screen. It is assumed that an infected person in region C (see Figure 1 and Figure 2) at the interface of sections A1 and A2 in Figure 3 is coughing and emitting respiratory droplets of various sizes. The average concentrations of cough droplets are evaluated as a function of time for different locations in the room (as noted before, the height of the infected person’s breathing area is 1.65 m above the floor).

2.2. Numerical Model

2.2.1. Boundary Conditions and Simulation

We assume that one of the three 1.85 m tall persons infected with COVID-19 and standing in the indoor space shown in Figure 1 and Figure 2 is coughing and emitting virus-infected droplets into the environment. In the first stage, the air flow is simulated for the steady ventilation flow in the room. Then respiratory droplets are introduced into the room space along with the air flow in six droplet groups (similar to the cough from a sick person’s mouth), and the simulation continues. In the simulation, we used the k-ε RNG model [3]. The RH in the cough air stream, the temperature in the cough air stream, the RH in this area, and the outside temperature are 100%, 37 °C, 50%, and 25 °C, respectively. The duration of the cough is 0.35 s, and the simulation of the dispersion of the droplets after their release continues for about 115 s. Ansys-Fluent (CFD) software was used in these simulations. The boundary conditions of the air flow are shown in Table 1. A user-defined function (UDF) is applied at the mouth to generate the time-varying velocity in the cough air flow rate. The time-varying air flow velocity during coughing is modeled as a combination of gamma functions. Based on the experimental study of Gupta et al. [12], the maximum air velocity of coughed droplets is 12.1 m/s. Droplet evaporation can play an essential role in the spread of COVID-19 with two effects. First, changing the size of the droplets during evaporation affects the movement and retention time of the droplets in the gaseous phase. Second, the compounds in the droplet, including water and some other compounds, affect the survival of the virus. A UDF is applied for the evaporation of droplets in the cough air flow rate [13]. According to Table 2, cough drops coming out of the mouth are divided into six groups [4] (see Table 2).

2.2.2. Grid Independence

As shown in Figure 4, a non-uniform multi-hexcore structure mesh is used in all simulations in ANSYS-Fluent. Table 3 presents the mesh size’s effect on the volume-average pressure in solution domain of the room (ANSYS fluent theory guide) [14]. One of the methods for analyzing a mesh independency is the GCI method. The Grid Convergence Independency method (GCI method) is based on RE, described herein, is an acceptable and recommended method that has been evaluated over several hundred CFD cases. This policy facilitates CFD and the grid resolution using a dimensionless indicator for the relative density of the grid [15,16]. Three sets of computational grids, 1-fine (4,800,000 cells), 2-medium (3,200,000 cells), and 3-coarse (2,100,000 cells), are calculated and analyzed by Grid Convergence Index (GCI) [15] to obtain an optimal computational mesh. p is the order of accuracy, GCI is Grid Convergence Method, ε is the relative error between two grids, 1 is a fine mesh, 2 is a medium mesh, and 3 is a coarse mesh. Table 3 shows that the difference between values of pressure predicted in mesh 3,200,000 and 4,800,000 is very low. Therefore, the mesh with 3,200,000 is selected for subsequent simulations. Y+ less than 1 was considered for mesh generation, and by increasing the number of meshes from 3,200,000 to 4,800,000, no change was observed and 3,200,000 is selected. Finally, it can be seen from the calculation results of GCI in Table 3 that the GCI values of grid are important. The medium mesh is selected to save computation time and cost.

2.2.3. Results Validation

In this study, 3 validations have been performed according to Li et al. [3], Lu et al. [17], and Gupta et al. [12]. For the first validation, the present numerical model for simulation of particle motion was validated by comparison with Li et al. [3] for evaporation of a 10 μm droplet (mass flow rate of 5.24 × 10⁻¹¹ kg/s) expelled by the coughing. The evaporation model is presented in Figure 5. It is assumed that the droplets leave the mouth at a temperature of 37 °C, and the room temperature is 17 °C. Figure 5 shows a good agreement between the present predictions and the results of Li et al. [3].
For the second validation, the validation of the Airflow velocity of a single cough by Gupta et al. [12] was used. Gupta et al. [12] performed an experimental study of cough airflow rate. Their results are reproduced in Figure 6. Accordingly, the cough duration is 0.35 s, and the air velocity reaches a maximum of 12.1 m/s. Gupta et al. [12] measured the cough airflow rates for 25 subjects (12 females and 13 males). According to Figure 6, a good agreement can be seen between the current study and the results of Gupta et al. [12].
The third validation is presented for the airflow pattern in the three-dimensional two-zone room shown in Figure 7 and Figure 8, which is studied earlier by Lu et al. [17]. The room (L × H × W = 5 m × 2.4 m × 3 m) is separated using a partition in the middle with a small door opening on the centerline of the room. The door width and height are 0.7 m and 0.95 m, respectively. In addition, the thickness of the partition is ignored compared with the size of the room. A supply and exhaust diffuser with the length, width, and height of, respectively, 1 m, 0.15 m, and 0.5 m are located on the front and the back walls, as shown in Figure 7. The numerical study of Lu et al. [17] is reproduced in Figure 8a for comparison. The airflow velocity vector patterns at the room mid-section (z = 1.5 m) are simulated, and the results are shown in Figure 8b. It is seen that the present prediction of the velocity vector field is in good agreement with that of [17].

2.2.4. Step Independence Study

For the selected mesh, it is necessary to choose a proper time step for simulation. A series of simulations are performed into the simulation time (the values in Table 4 and Table 5) for time steps of 0.003 s, 0.005 s, 0.007 s, and 0.009 s. The corresponding particle properties, CAvg and FAvg as a function of time, are evaluated in Table 4 and Table 5, respectively. According to Table 4 and Table 5, as the time step gets smaller, the differences between the particle properties becomes negligible. As the values of the properties for the last time steps are very close, the time step of 0.005 is selected for the subsequent simulations.

2.3. Modeling Assumptions

Assumptions of the present study are:
  • The droplets stick to surfaces upon contact with no resuspension.
  • The evaporation of cough droplets is included in the simulations.
  • The mass and the molar fractions of water vapor at the droplet surface assume liquid-vapor equilibrium [18].
  • Droplet collisions in dilute concentrations are neglected.
  • Cough droplets have a uniform temperature of 37◦C and a spherical shape [19].
  • The respiratory droplet with SARS-CoV-2 viruses behaves like water in terms of physical properties [1].
  • The number of droplets released when coughing is proportional to the velocity of the airflow [20].
  • The heat transfer effects between the surrounding environment and the people’s bodies are ignored.

2.4. Governing Equations

This section presents the ventilation air flow, the turbulence model, and the discrete phase equations:
ρ t + · ρ V = 0
ρ V t + V · V = P + · μ + μ T V + V T + S
ρ C p T t + V · T = · [ K + K T T + T T + S T
t ρ k + x i ρ k u i = x j α k   μ e f f   k x j + G k ρ ε + S k
t ρ ε + x i ρ ε u i = x j α ε   μ e f f   ε x j + C 1 ε ε k G k C 2 ε ρ ε 2 k R ε + S ε
The RNG k-ε turbulence model was used to simulate the flow [21]. First, the steady-state ventilation air flow was simulated. Then, the transient cough air flow and ejected respiratory droplets of different sizes at the velocity of 10 m/s were simulated. Using Newton’s second law, the paths of virus-carrying droplets were evaluated in the Lagrangian framework [22,23]:
d V d d t = F D V V d + g ρ d ρ ρ d + F L + F B
Here, F L , and F B are the Saffman lift and the Brownian forces per unit mass of the particle, respectively, and FD is the drag coefficient [24]. It follows that:
F D = 18 μ d 2 ρ d C C
C C = 1 + 2 K d 1.257 + 0.4 e 1.1 d 2 K
Here, CC is the Cunningham coefficient [25,26]. m ˙ and N Tn are the mass flow rate, and the residual cough particles and droplets in space, respectively.
m ˙ = 4 3 π r 3 × ρ d × n t
N T n = N t N T × 100
The droplet shape is assumed to be spherical during the evaporation process. The heat and the droplet mass balance equations are solved for calculating the droplet diameter at each time step. The energy balance equation for a droplet evaporating due to heat convection is written as:
m p c p d T p d t = A p h T T p h f g   d m p d t
where the evaporation rate and the mass transfer coefficient are as follows:
d m d t = A p k c   ρ   l n 1 + B m
k c = D d p 2.0 + 0.6 R e d 1 / 2 S c 1 / 3
where the Schmidt number is defined as:
S c = μ ρ + D a
Here, B m is the Spalding mass number for species ( B m = Y s Y 1 Y s ) , and Y s and Y are the mass fractions. Here, Y = X M p P ρ   RT and the molar fraction of water vapor X s = P sat Ts P , and l n   P sat = A B T p + C , where A, B, and C are taken from [27,28,29], respectively. We used a UDF (user-defined function) to calculate the velocity of the air flow containing the cough drops coming out of the patient’s mouth. The air velocity of a cough, as reported by [30], is used in the numerical simulation. It follows that:
V = 1.93 × 10³ t2 + 30.5 × 10 t0 < t ≤ 0.077(15)
V = 2.68 × 10² t2 − 1.26 × 10 t + 1.99 × 100.077 < t ≤ 0.265
V = 4.10 × 10² t2 − 3.14 × 10² t + 5.98 × 100.265 < t ≤ 0.35
In this study, the average volume fraction of particles during the calculation period in the cough flow is about (3.38 × 10⁻⁵ percent). Furthermore, we assumed cough droplets with a uniform temperature of 37 °C and a spherical shape. The droplets coming out of the mouth during the cough have different diameters, from a few micrometers to hundreds of micrometers. In addition, the velocity of the droplets leaving the mouth is equal to the speed of the cough air flow.
X ¯ = 1 V X d V
The change in the size of the respiratory droplets during evaporation and the presence of organic substances and non-volatile compounds in the droplets affect their movement and the time they stay in the air. In addition, these factors could also affect the survival of the virus. Many droplets come out of the human body during coughing. With time, the water in the droplets evaporates, then the droplets gradually become smaller and, finally, reach the state of equilibrium between the droplet and the vapor phase [13].

Wells–Riley Equation and Risk of Infection

The Wells–Riley equation [31,32] has been commonly used to assess virus transmission through the air, considering the inhalation dose. The quantum is the virus dose that, if inhaled, would cause a person to become infected. The probability of infection of a person who inhales one quantum is 1 − 1/e [33]. Accordingly,
P = D S = 1 e x p   I q p t Q = 1 e x p   ( N s )
where P, D, S, p and q, are the probability of infection, the infected people, the susceptible people, the number and the breathing rate of sensitive people, and the amount of quantum production, respectively. According to Equation (17), t is the duration of exposure to the infection, Q is the amount of ventilation, and Ns is the number of quanta one inhales. It is assumed that all people are relaxed, and their respiration rate is 10 L/min. Note that Equation (17) assumes fully mixed concentrations.
Miller et al. [34] reviewed and analyzed data from 32 COVID-19 patients with the production rate of quanta of 970/h. Based on the average of 15 coughs per hour in their study, the authors of [34] estimate the quantum production number to be 20 per cough. The distribution of quanta with the droplets changes over time. Based on the concentration of exhaled droplets calculated with the CFD software, the total number of quanta a susceptible person inhales is given as [35]:
N ( x ,   t 0 ) = c   p 0 t 0 v x ,   t f ( t )   d t
Here N(x, t 0 ) is the number of quanta that a person inhales in the time duration of 0 to t0, v x ,   t is the average droplet concentration, f (t) is the virus viability (usually taken as 1), and c is the density of the number of quanta in droplets or concentration in the respiratory fluid, and p is the breathing rate.

2.5. Modeling Procedure

Figure 9 shows the modeling and structure of CFD calculations in the space under consideration.

3. Results

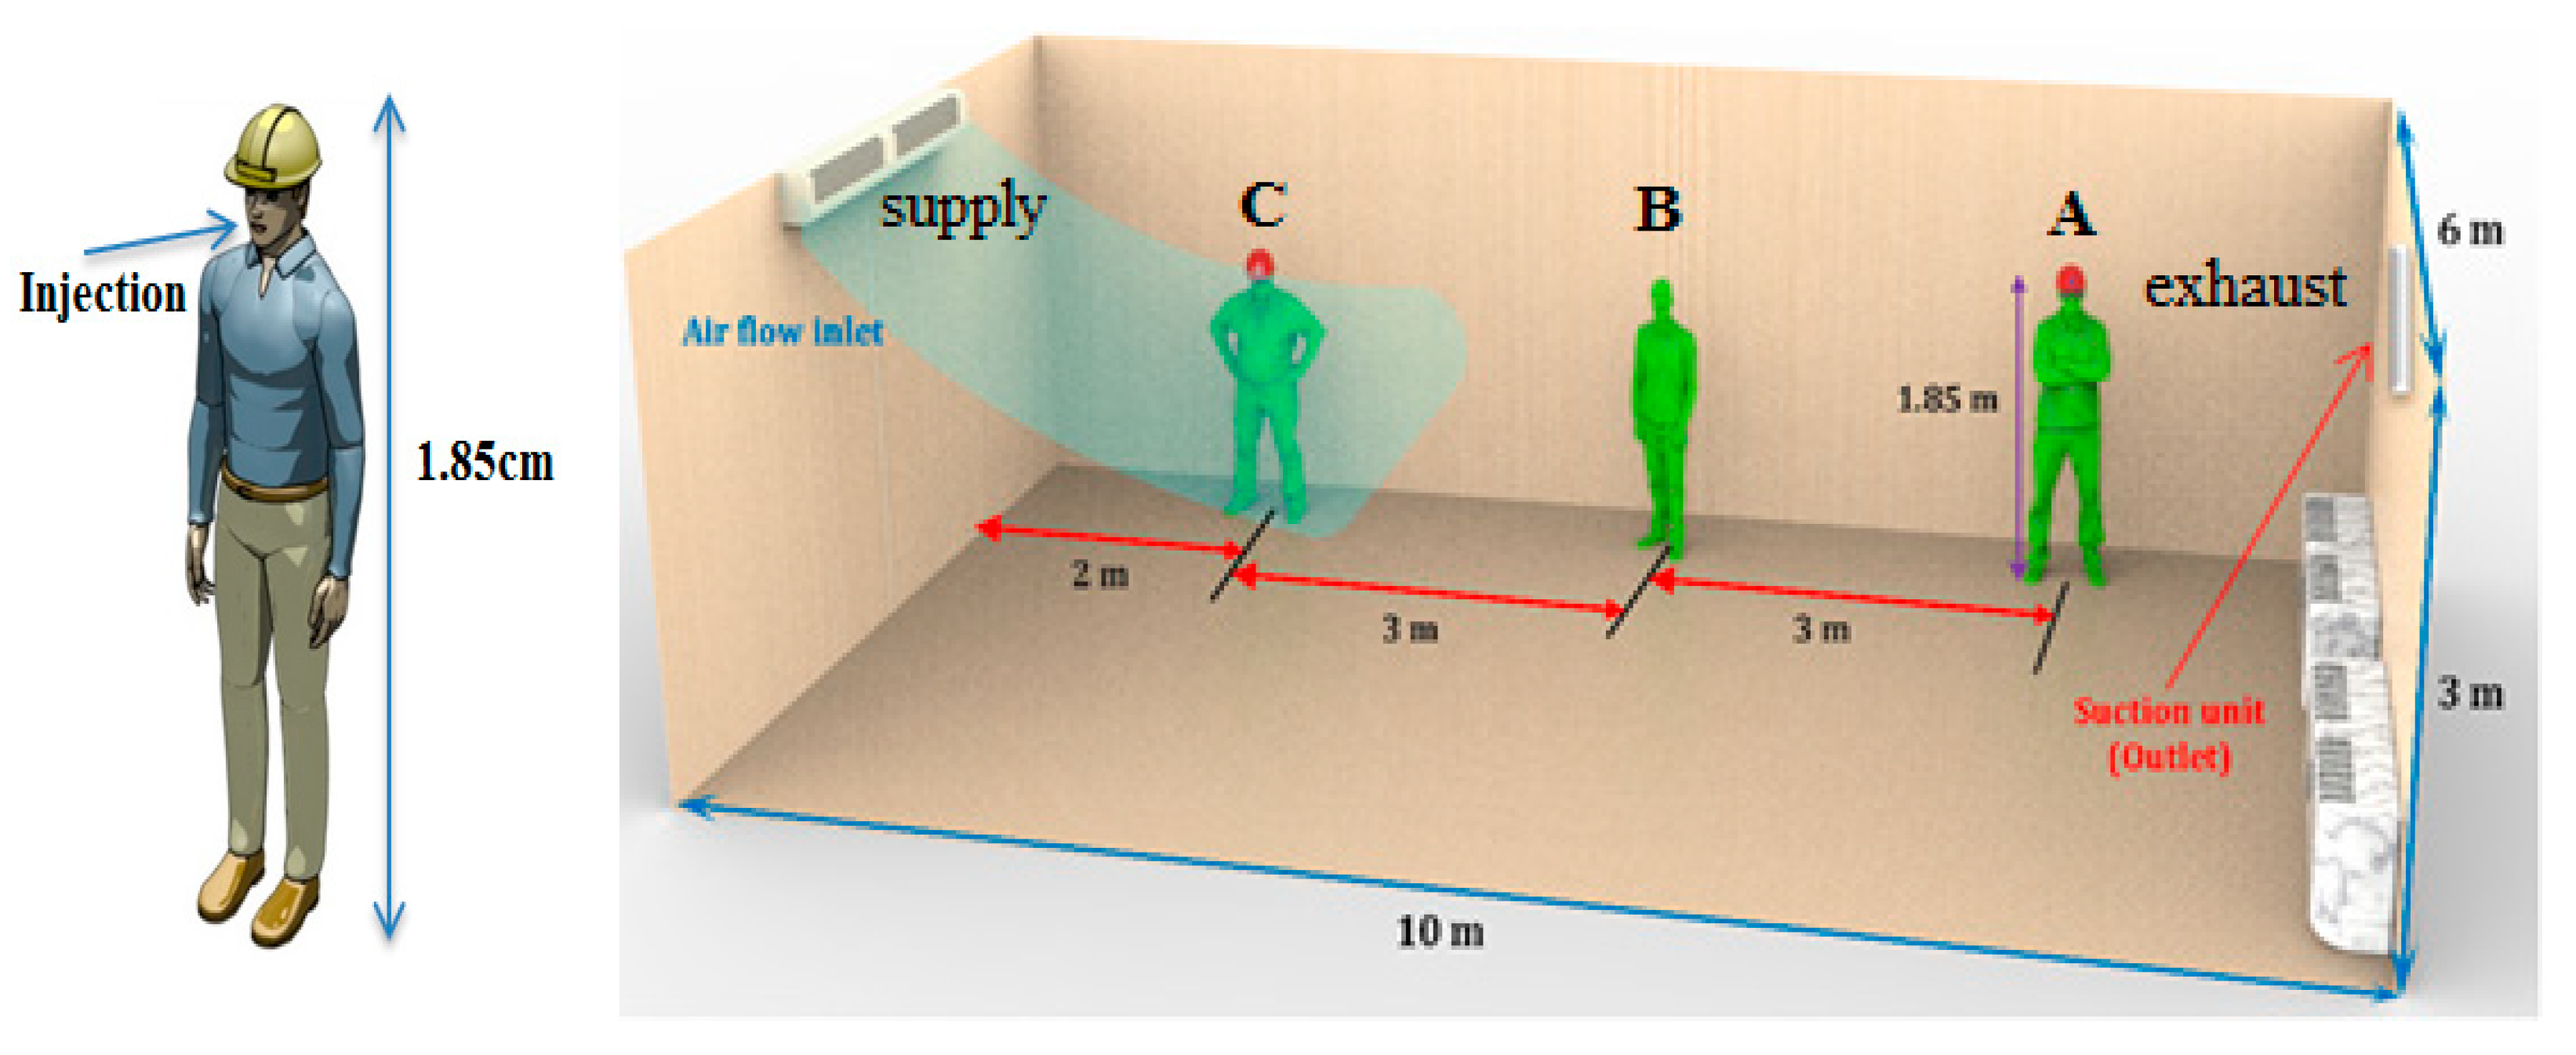
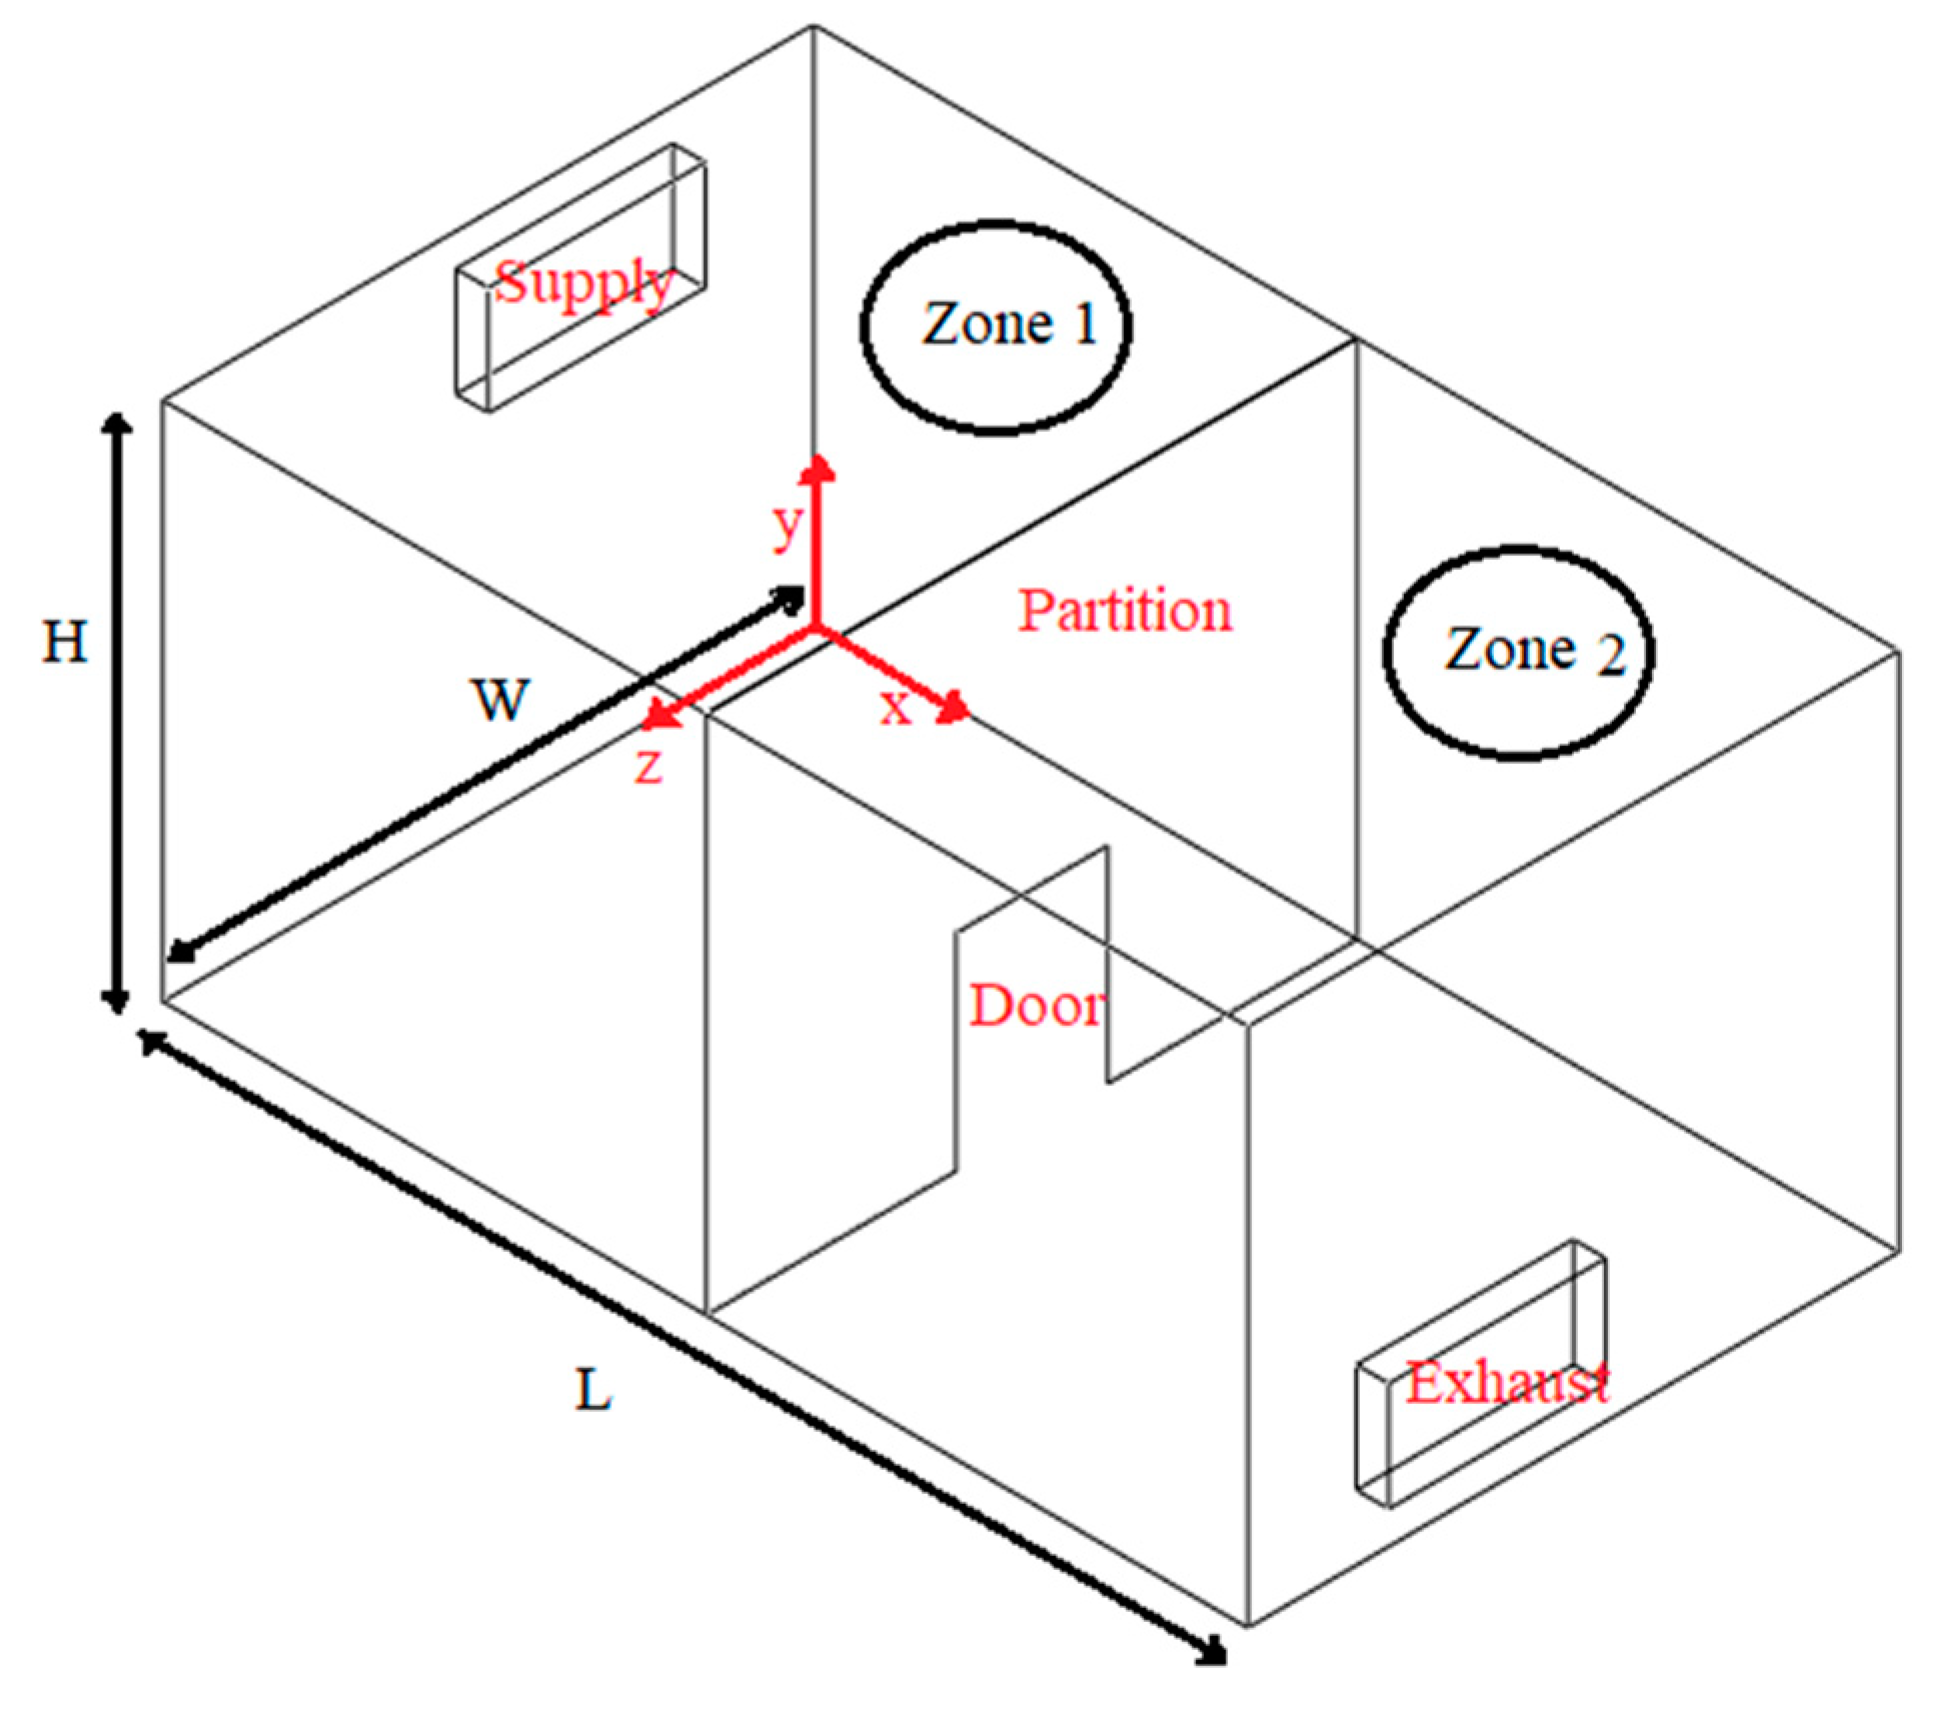
This article examines the transport and distribution of respiratory droplets in buildings and indoor spaces (with a ventilation system). In addition, appropriate locations of the ventilation supply and exhaust registers are discussed, and the risks of infection for different cases are assessed. The cases considered are:
  • Case 1: Ventilation air flow along the length of the indoor space (Figure 1).
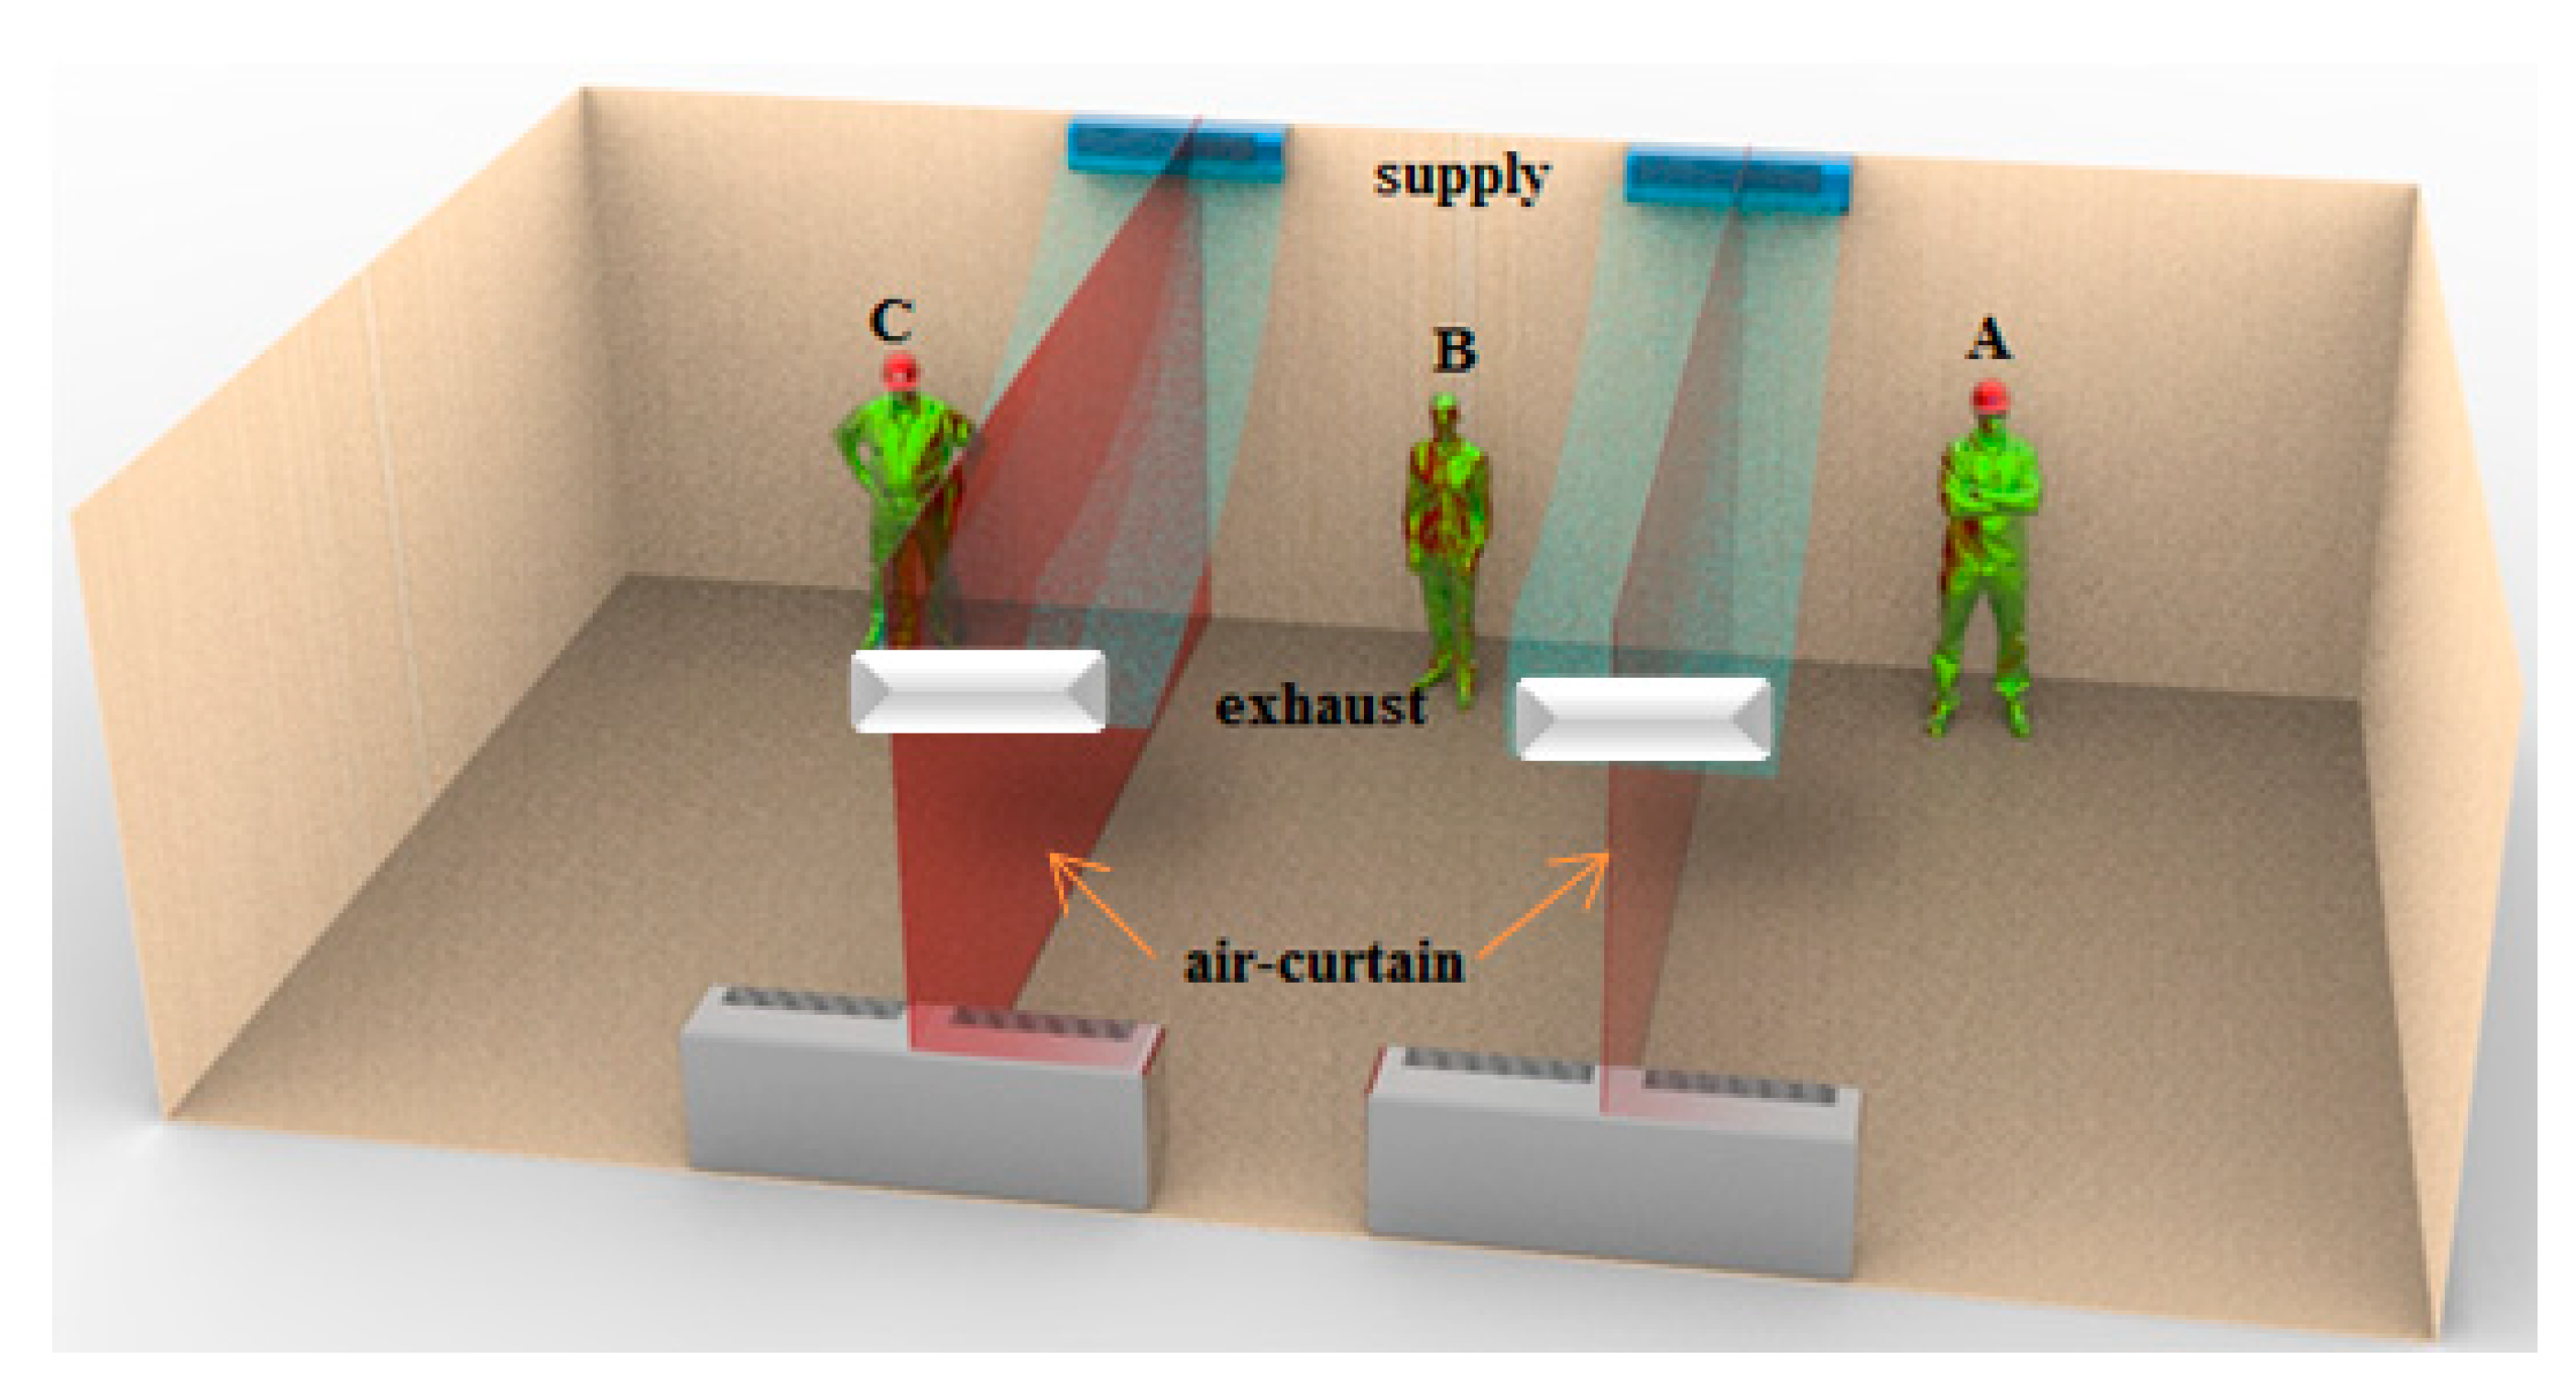
  • Case 2: Ventilation air flow across the width of the indoor space and creation of an air curtain-type flow pattern (Figure 2).
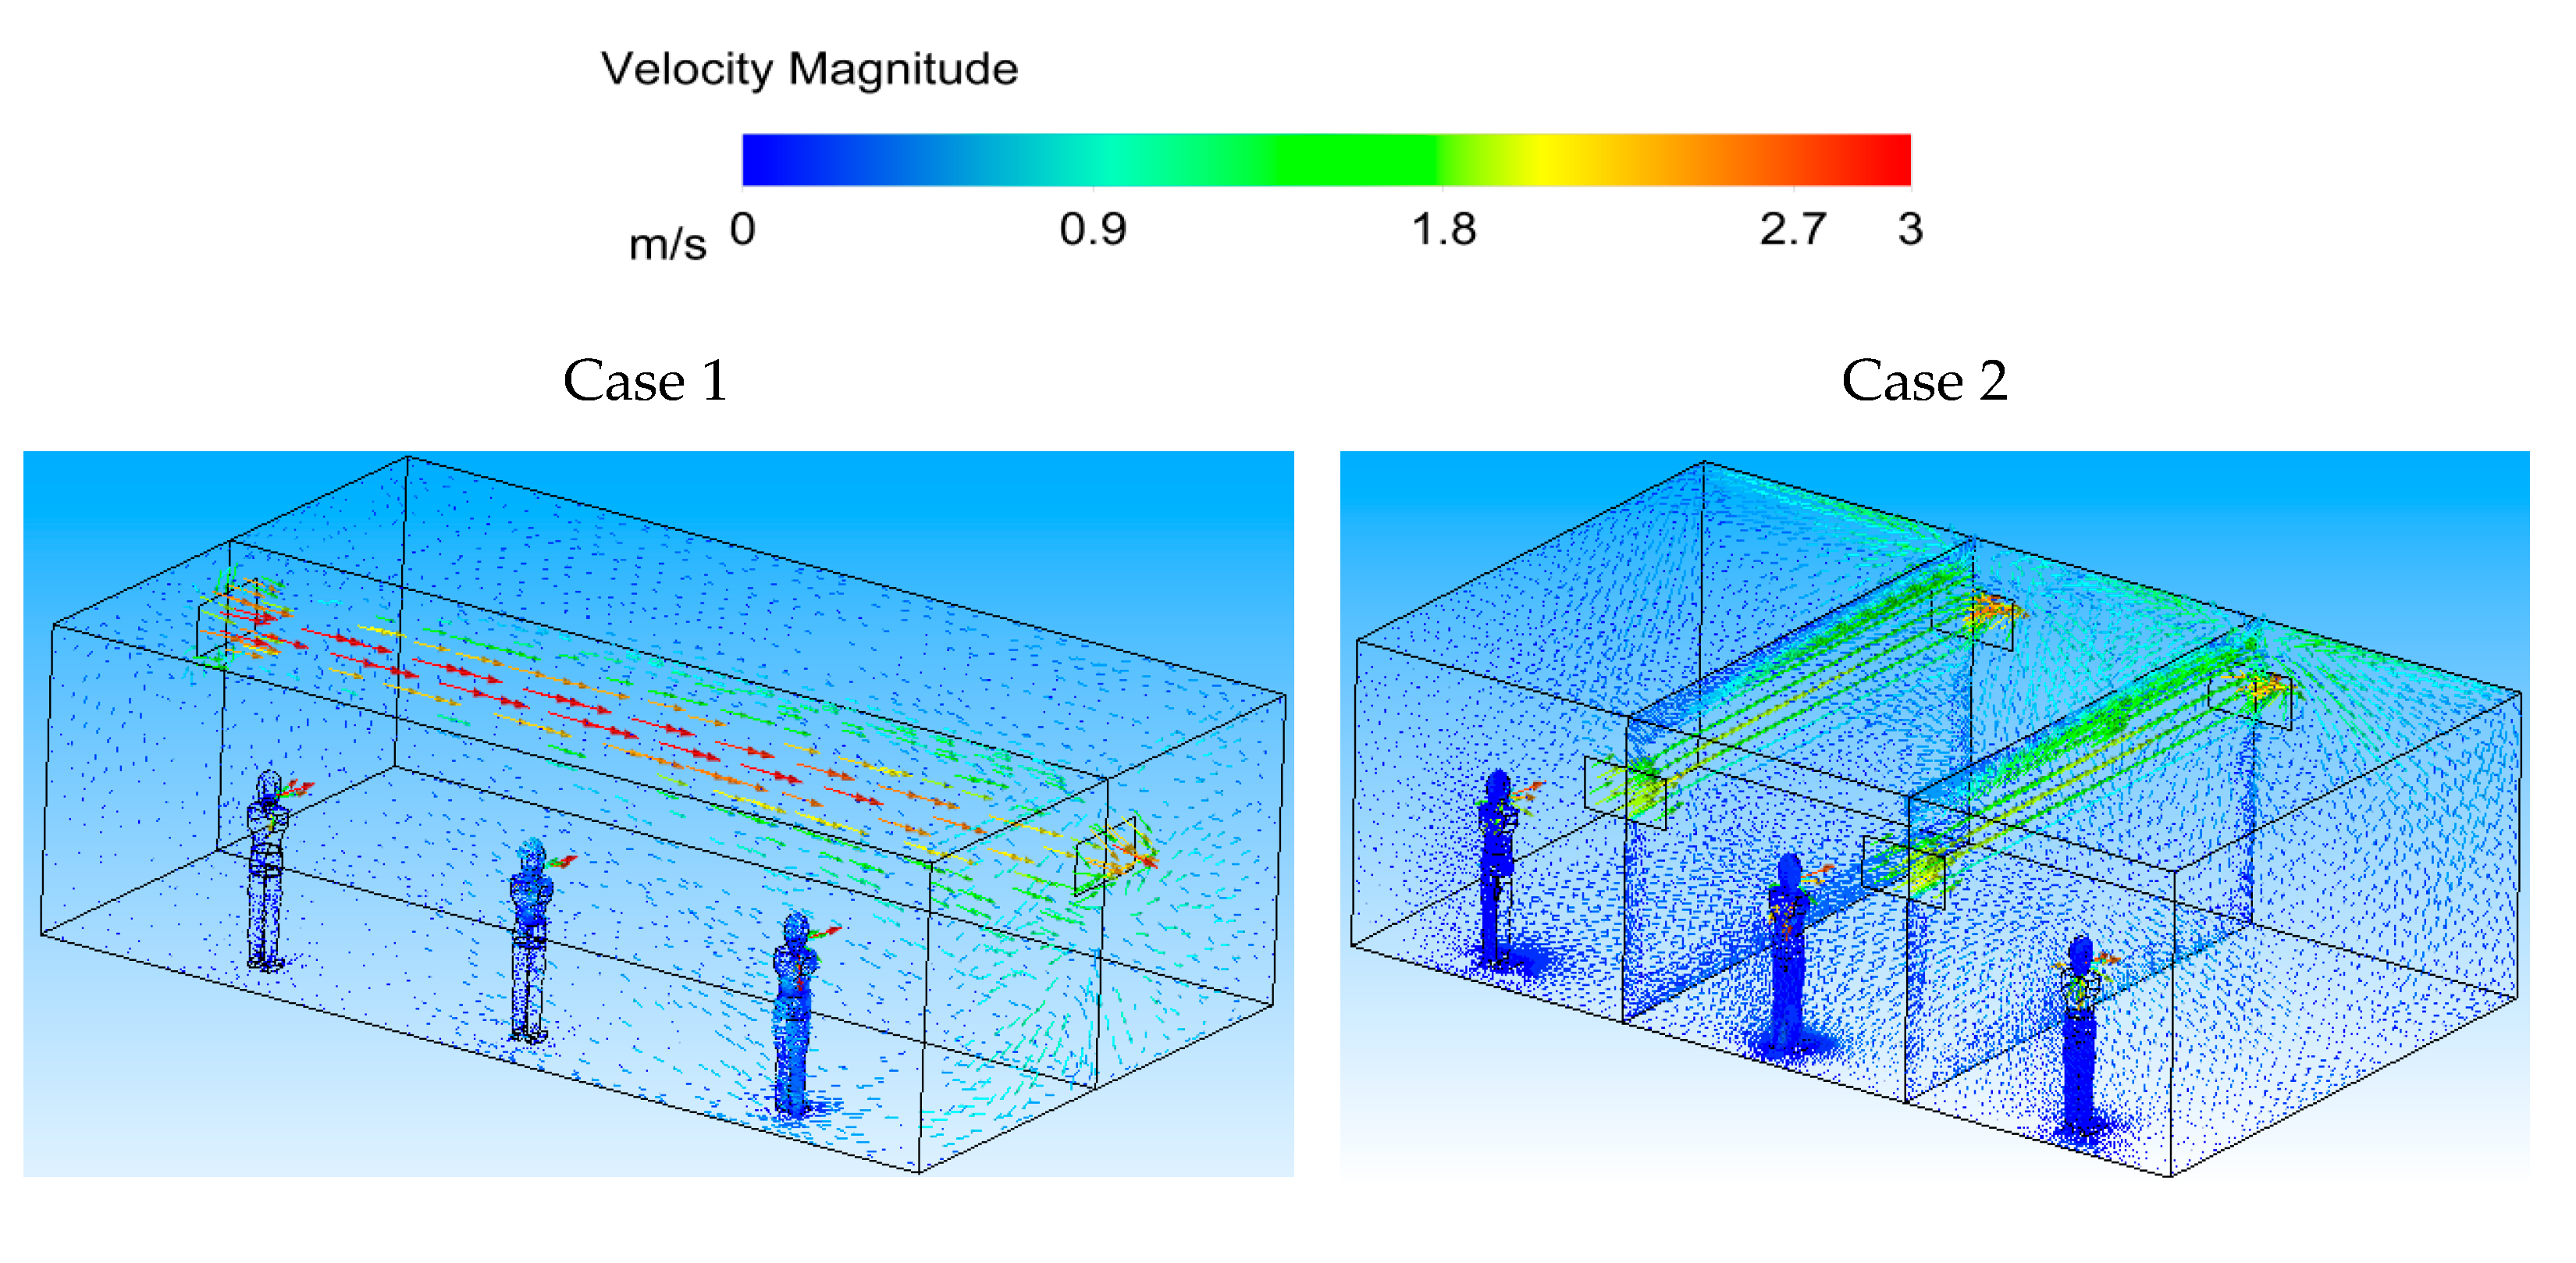
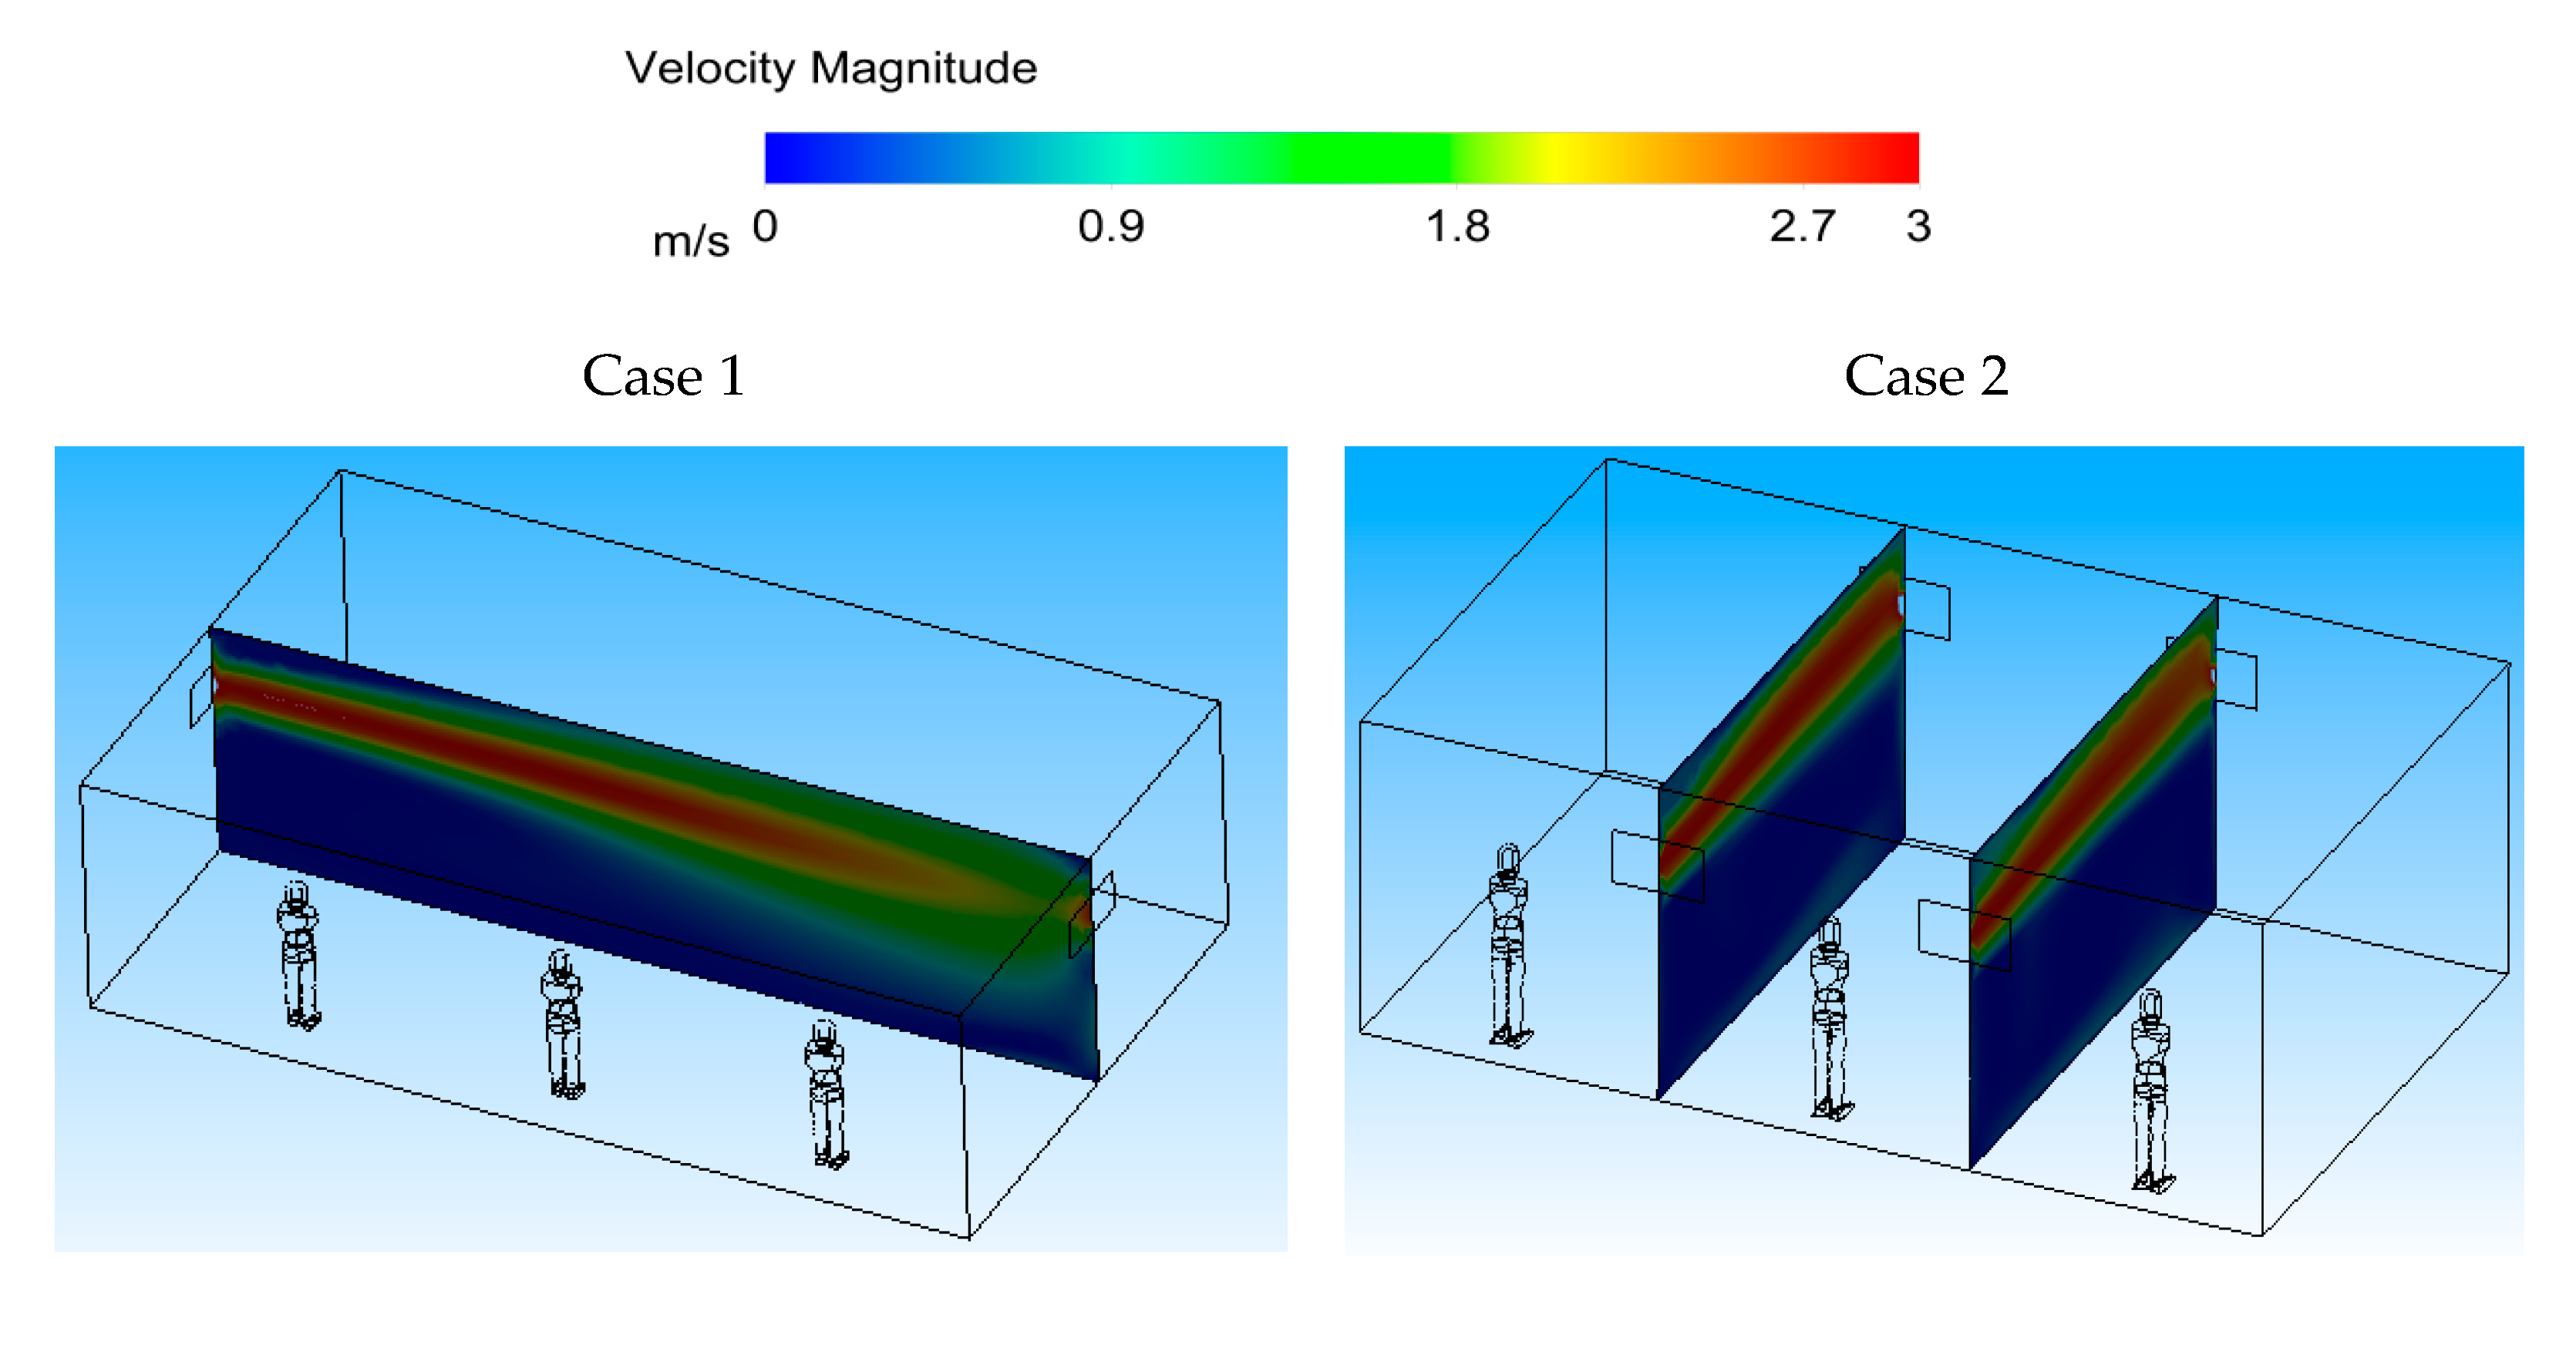
Figure 10 (Case 1) shows the velocity contour in the middle planes of the space in both cases, and at two sections across the width of the room for Case 2. It can be seen that the ventilation air flow entering the area spreads throughout the room for Case 1. For Case 2, however, the ventilation air flow spreads across the room width, creating an air-curtain-type flow pattern. 
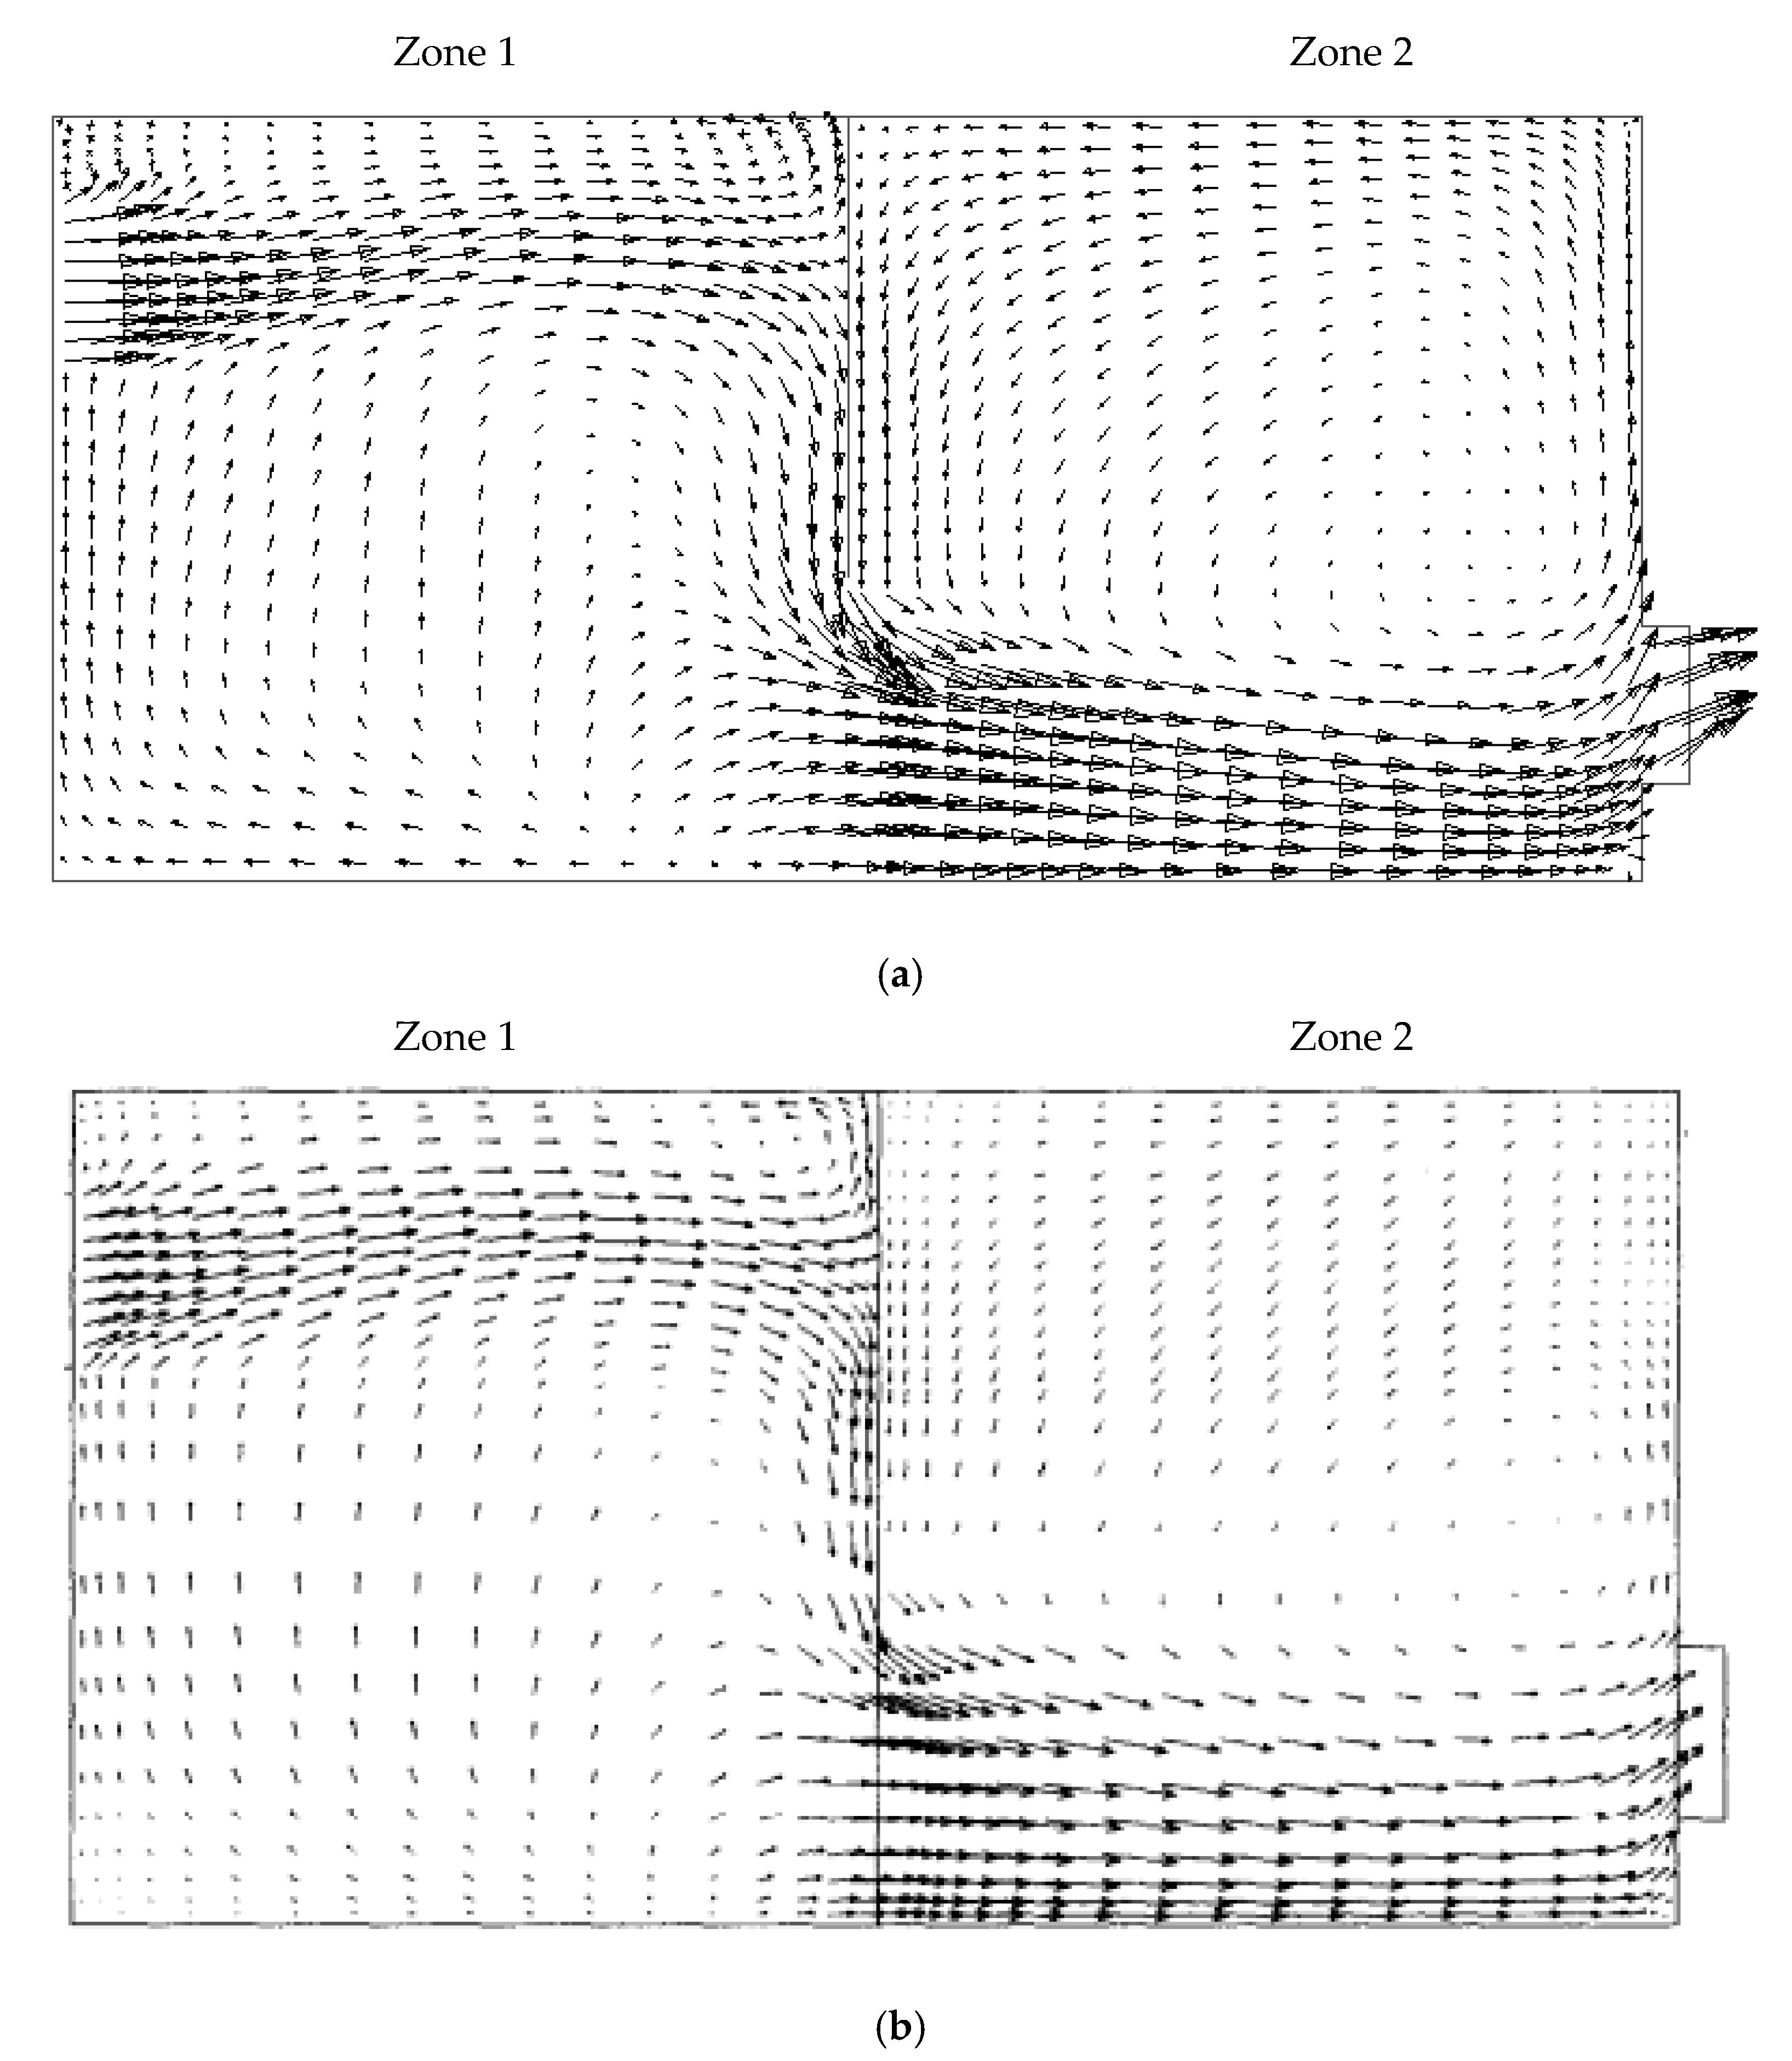
Figure 11 shows the velocity vector diagrams in the middle planes of the space along and across the area (input–output registers) for two cases. It is known that the ventilation air flow in the space proceeds under constant flow conditions.
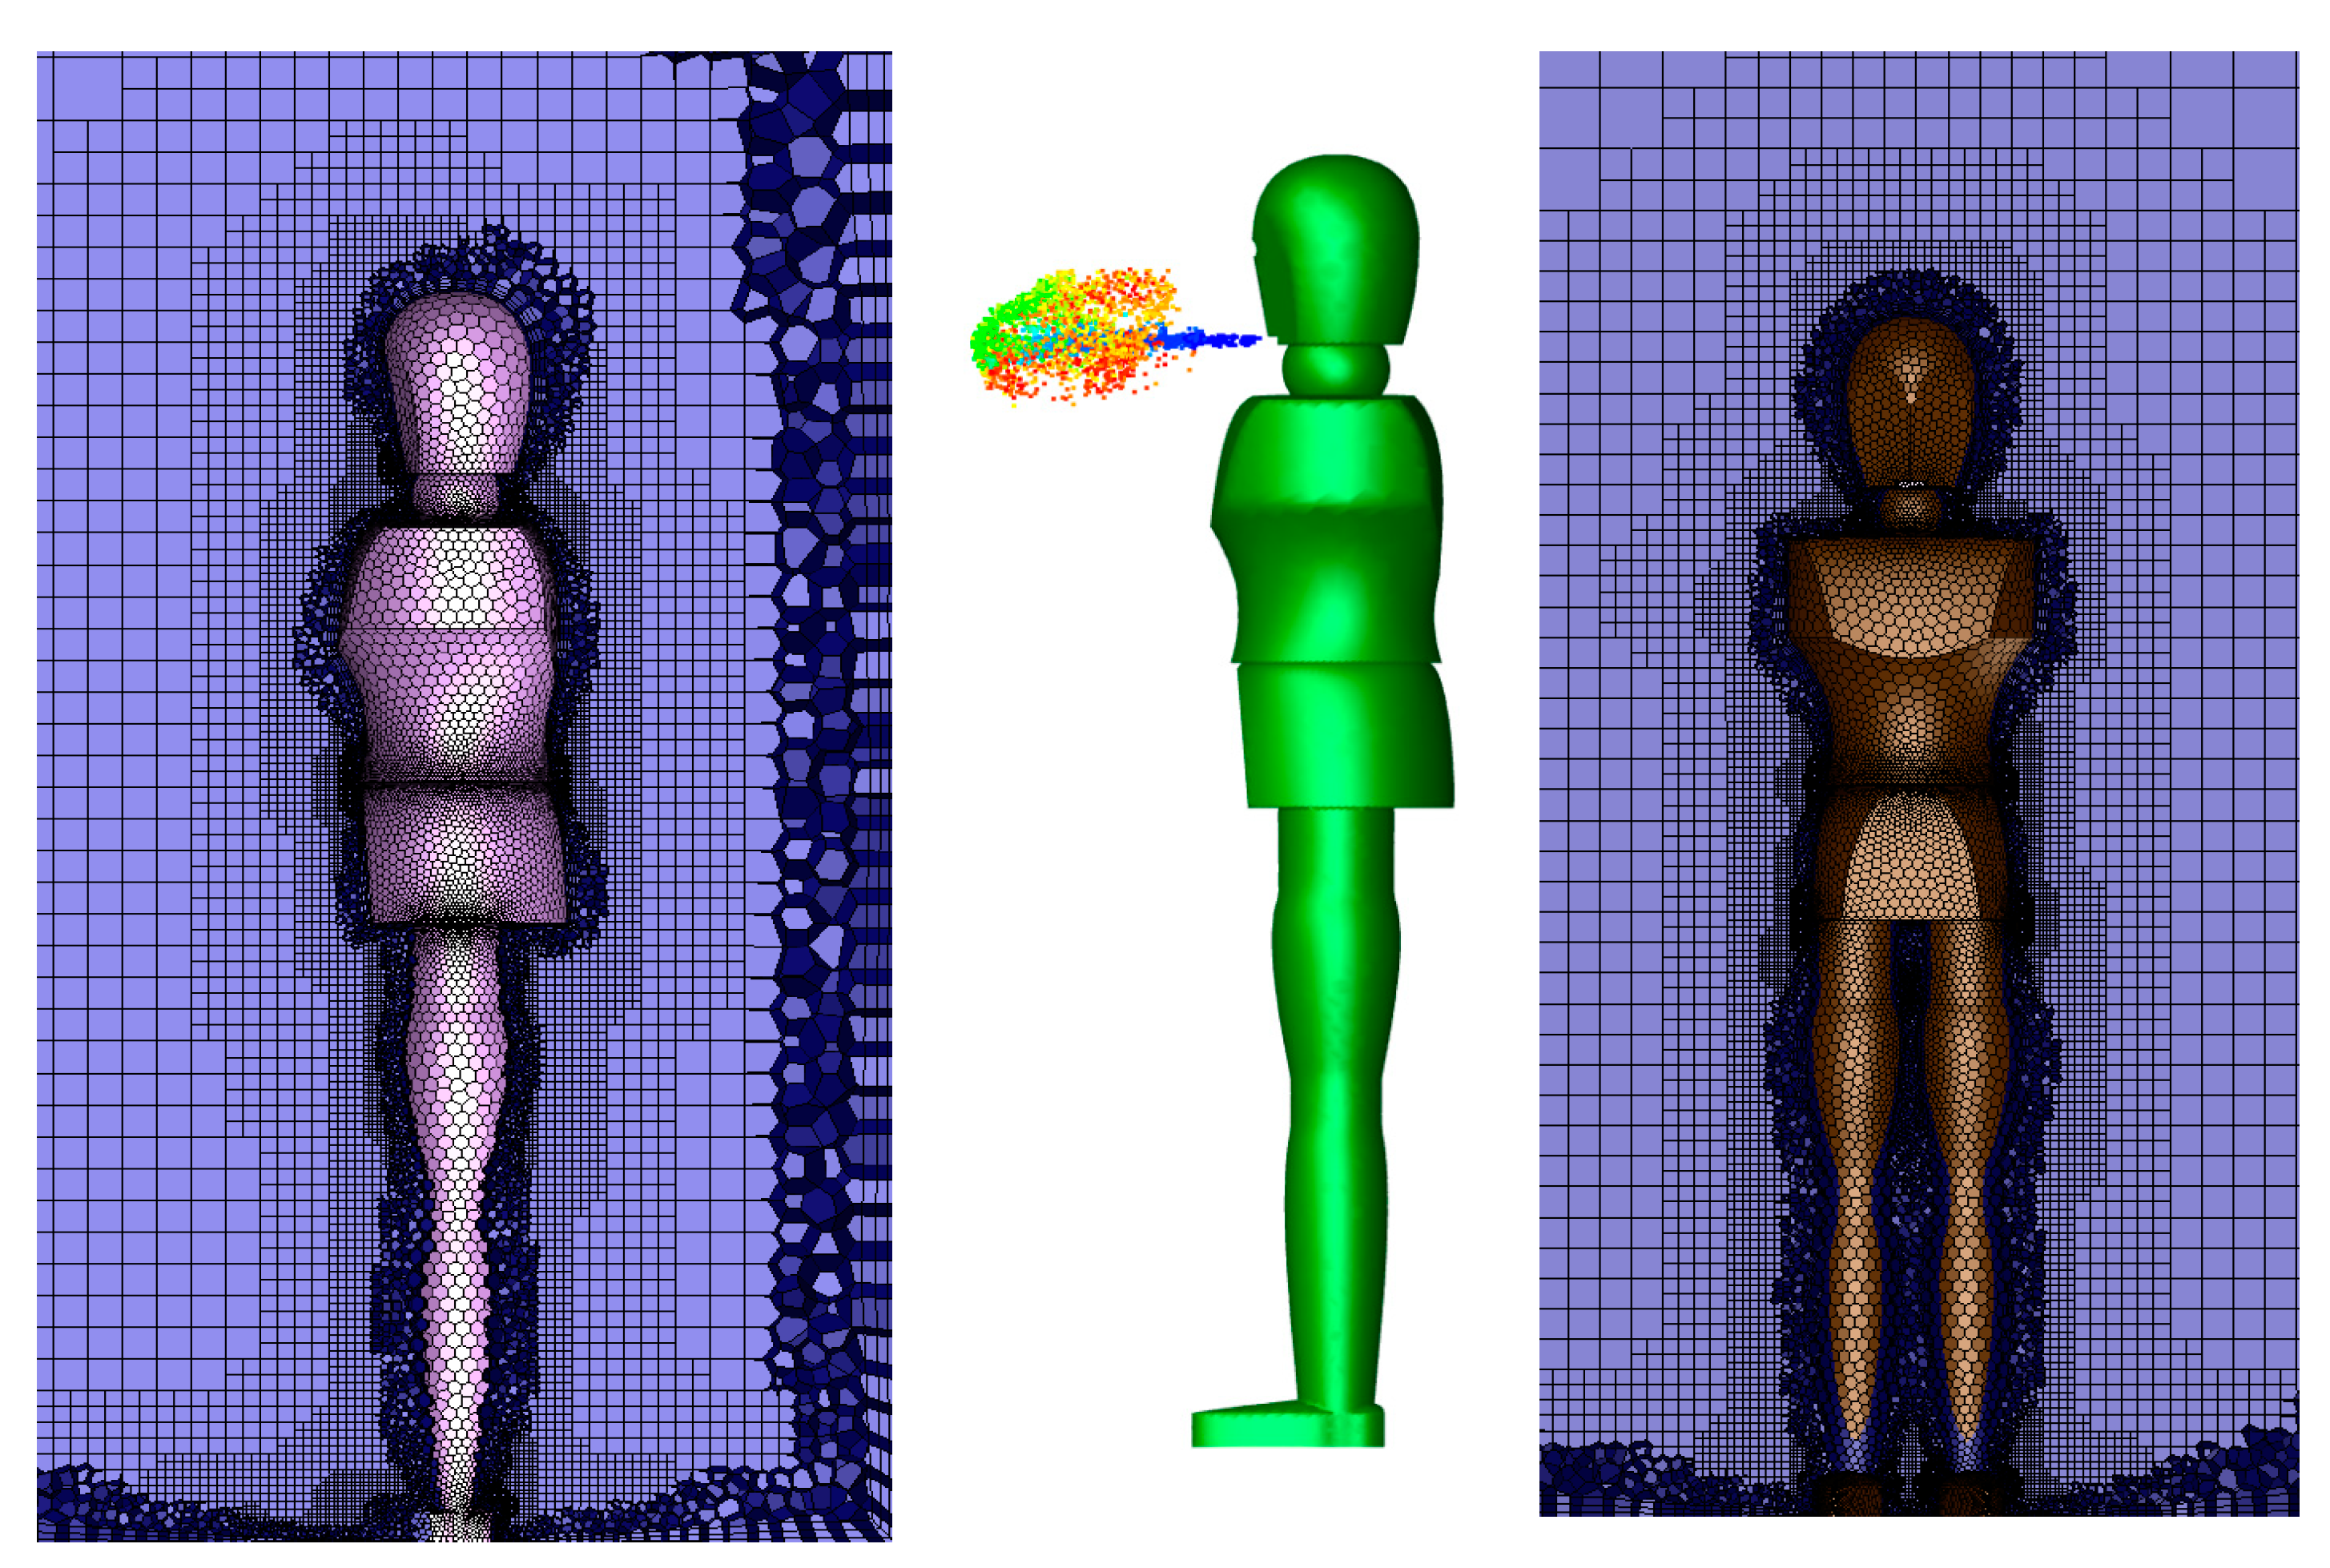
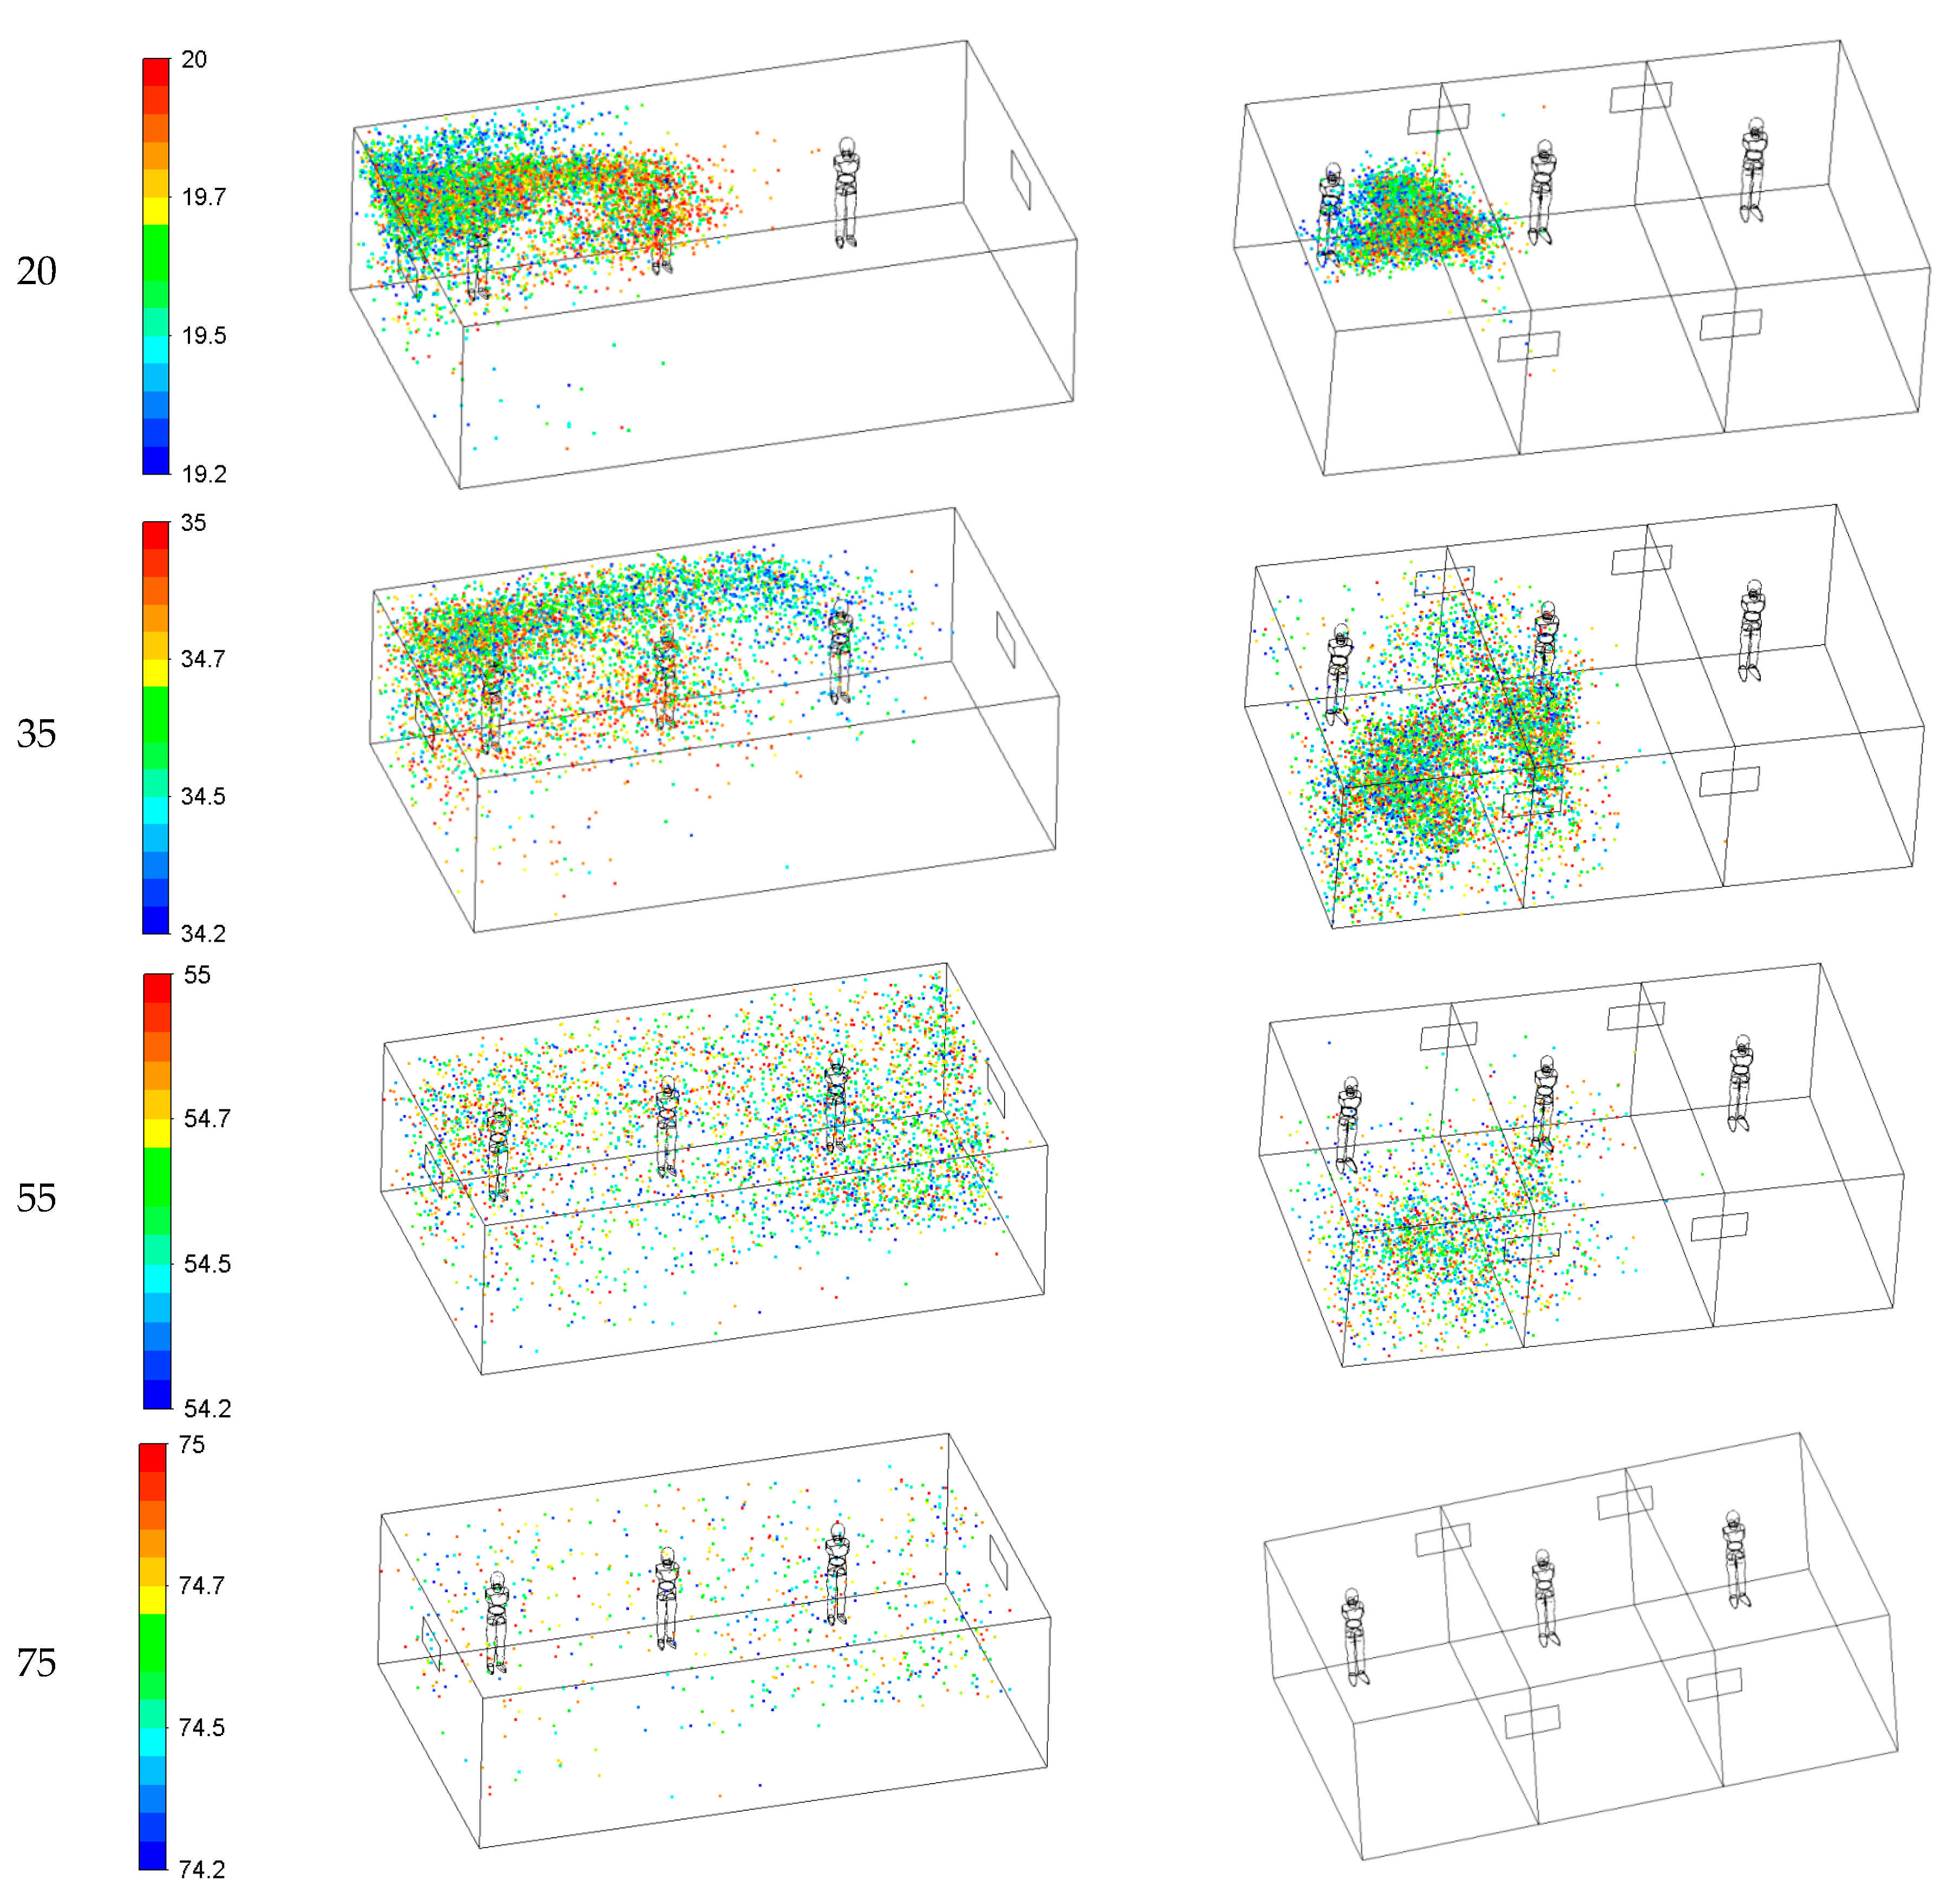
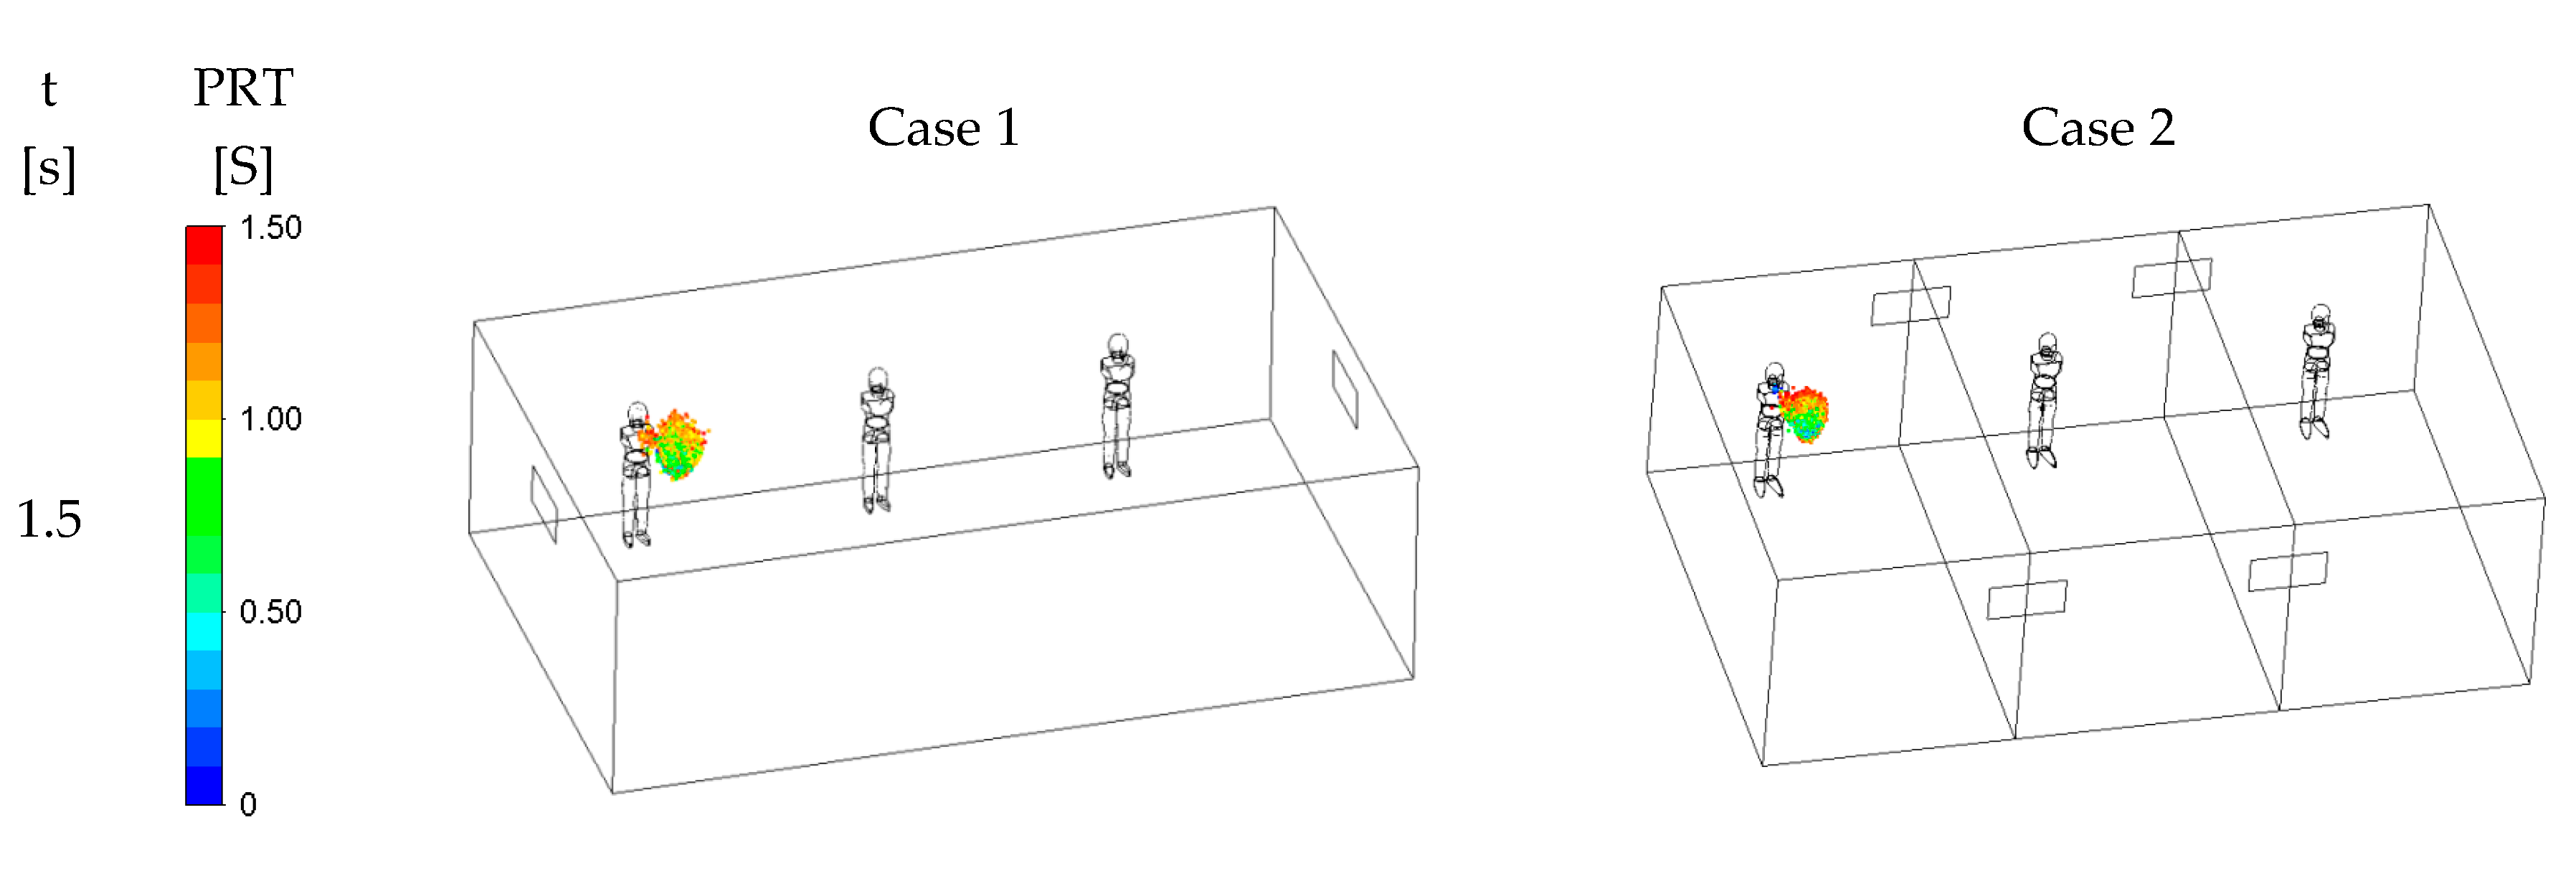
Figure 12 illustrates the dispersion of cough droplets in 2 ventilation systems at different times (Case 1 and 2). The droplet size changes due to evaporation affecting their movement, their residence time (the time for which the droplets remain suspended in the air), and their removal through the exhaust. Case 1 results show that at 1.5 s, the emitted droplets stay close to the patient’s face and then spread in the room. Twenty seconds after coughing, the drops spread over half of the room near the inlet, and their peak concentration moves toward the middle of the space. At t = 35 s, the respiratory droplets enter the other side of the room and spread throughout the space. Finally, the droplet concentration reduces significantly at 75 s after the coughing, while a small fraction of the respiratory droplets remains suspended in the air in the room.
Case 2 shows that, at 1.5 s after the coughing, the emitted droplets stay close to the patient’s face and then spread further away. The Case 2 ventilation system generates air curtain-type flow patterns in the room. At t = 20 s, the air curtain prevents the particles from spreading to the other side of the room. At 35s, Case 1 shows that the respiratory droplets enter the other side of the space and spread throughout the area. However, in Case 2, due to the air curtain, cough droplets do not penetrate the other side of the air curtain. Finally, at 75 s after the cough, there are almost no droplets in the room. As shown in Figure 12, in Case 2, ventilation air flows across the room width and generates air-curtain flow patterns, and prevents the droplets from spreading to the other areas. This means that forming air curtains prevents droplets from spreading and creates safe spaces in the room.
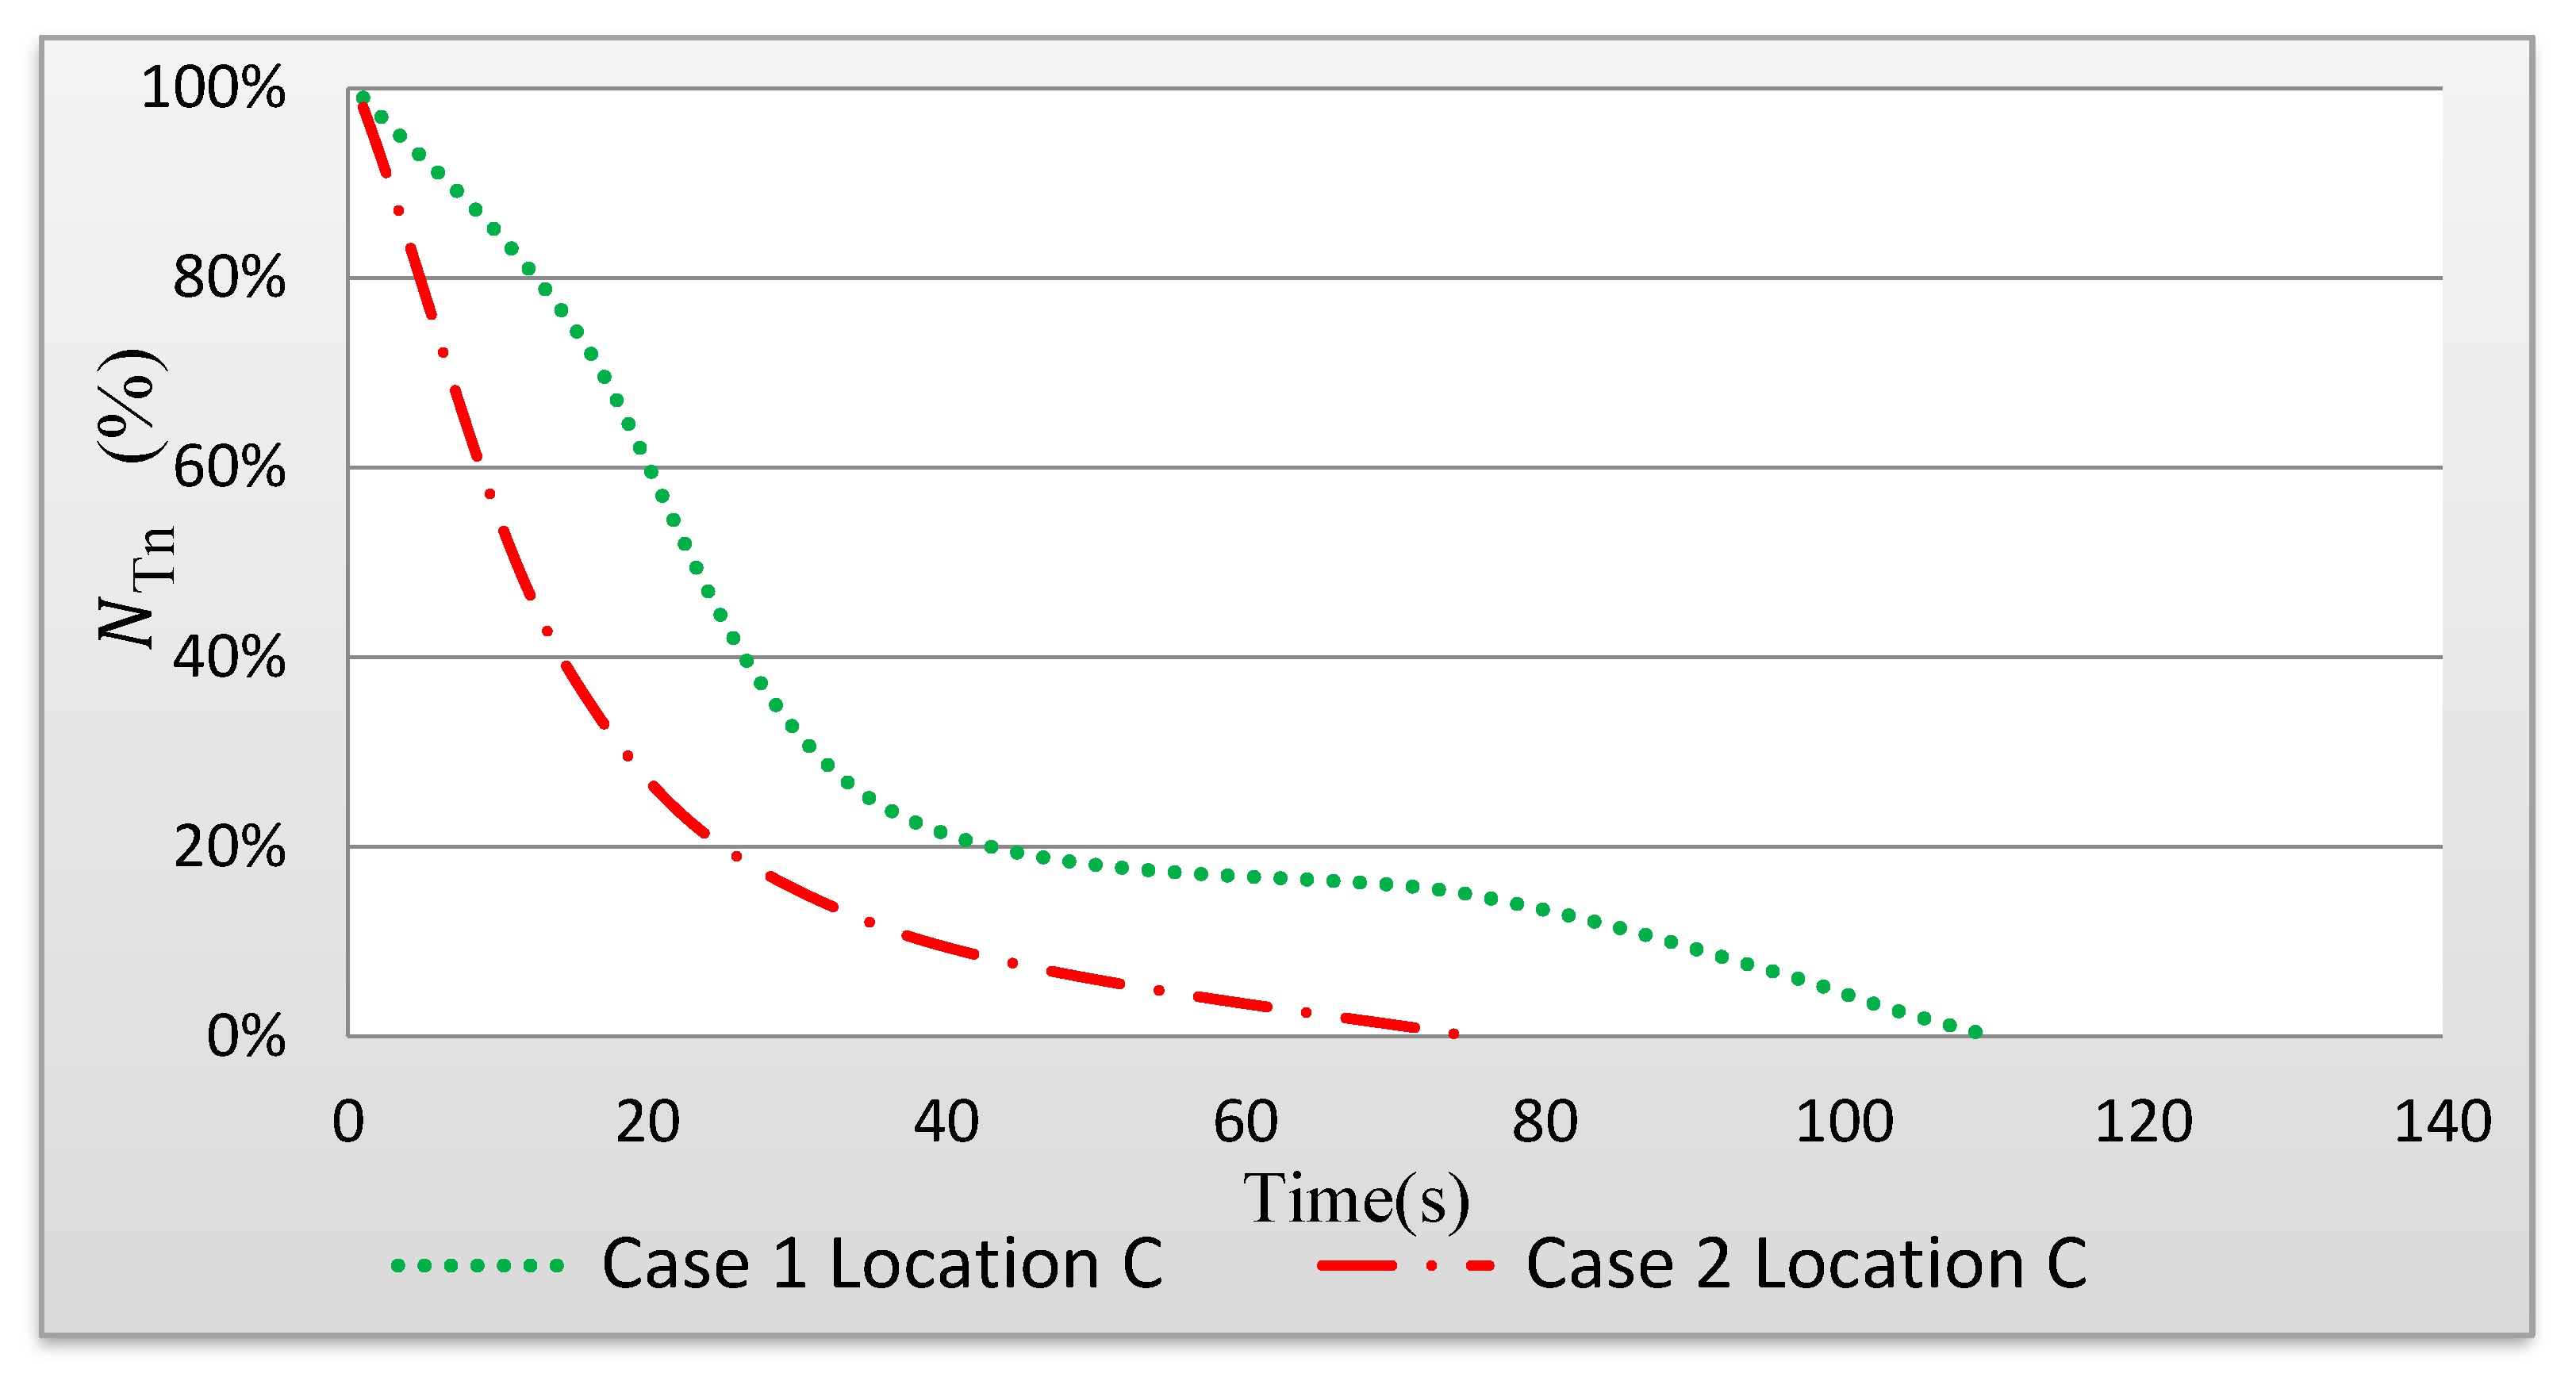
Figure 13 shows the time-dependent changes in the fraction of droplets remaining in the space (NTn). When the ventilation air flow is along the length of the indoor space (Case 1), it takes 115 s to clear the area of the droplets. However, when there is a ventilation air flow across the width of the indoor space (air curtain), it takes 75 s for the droplets to leave the area (Case 2).
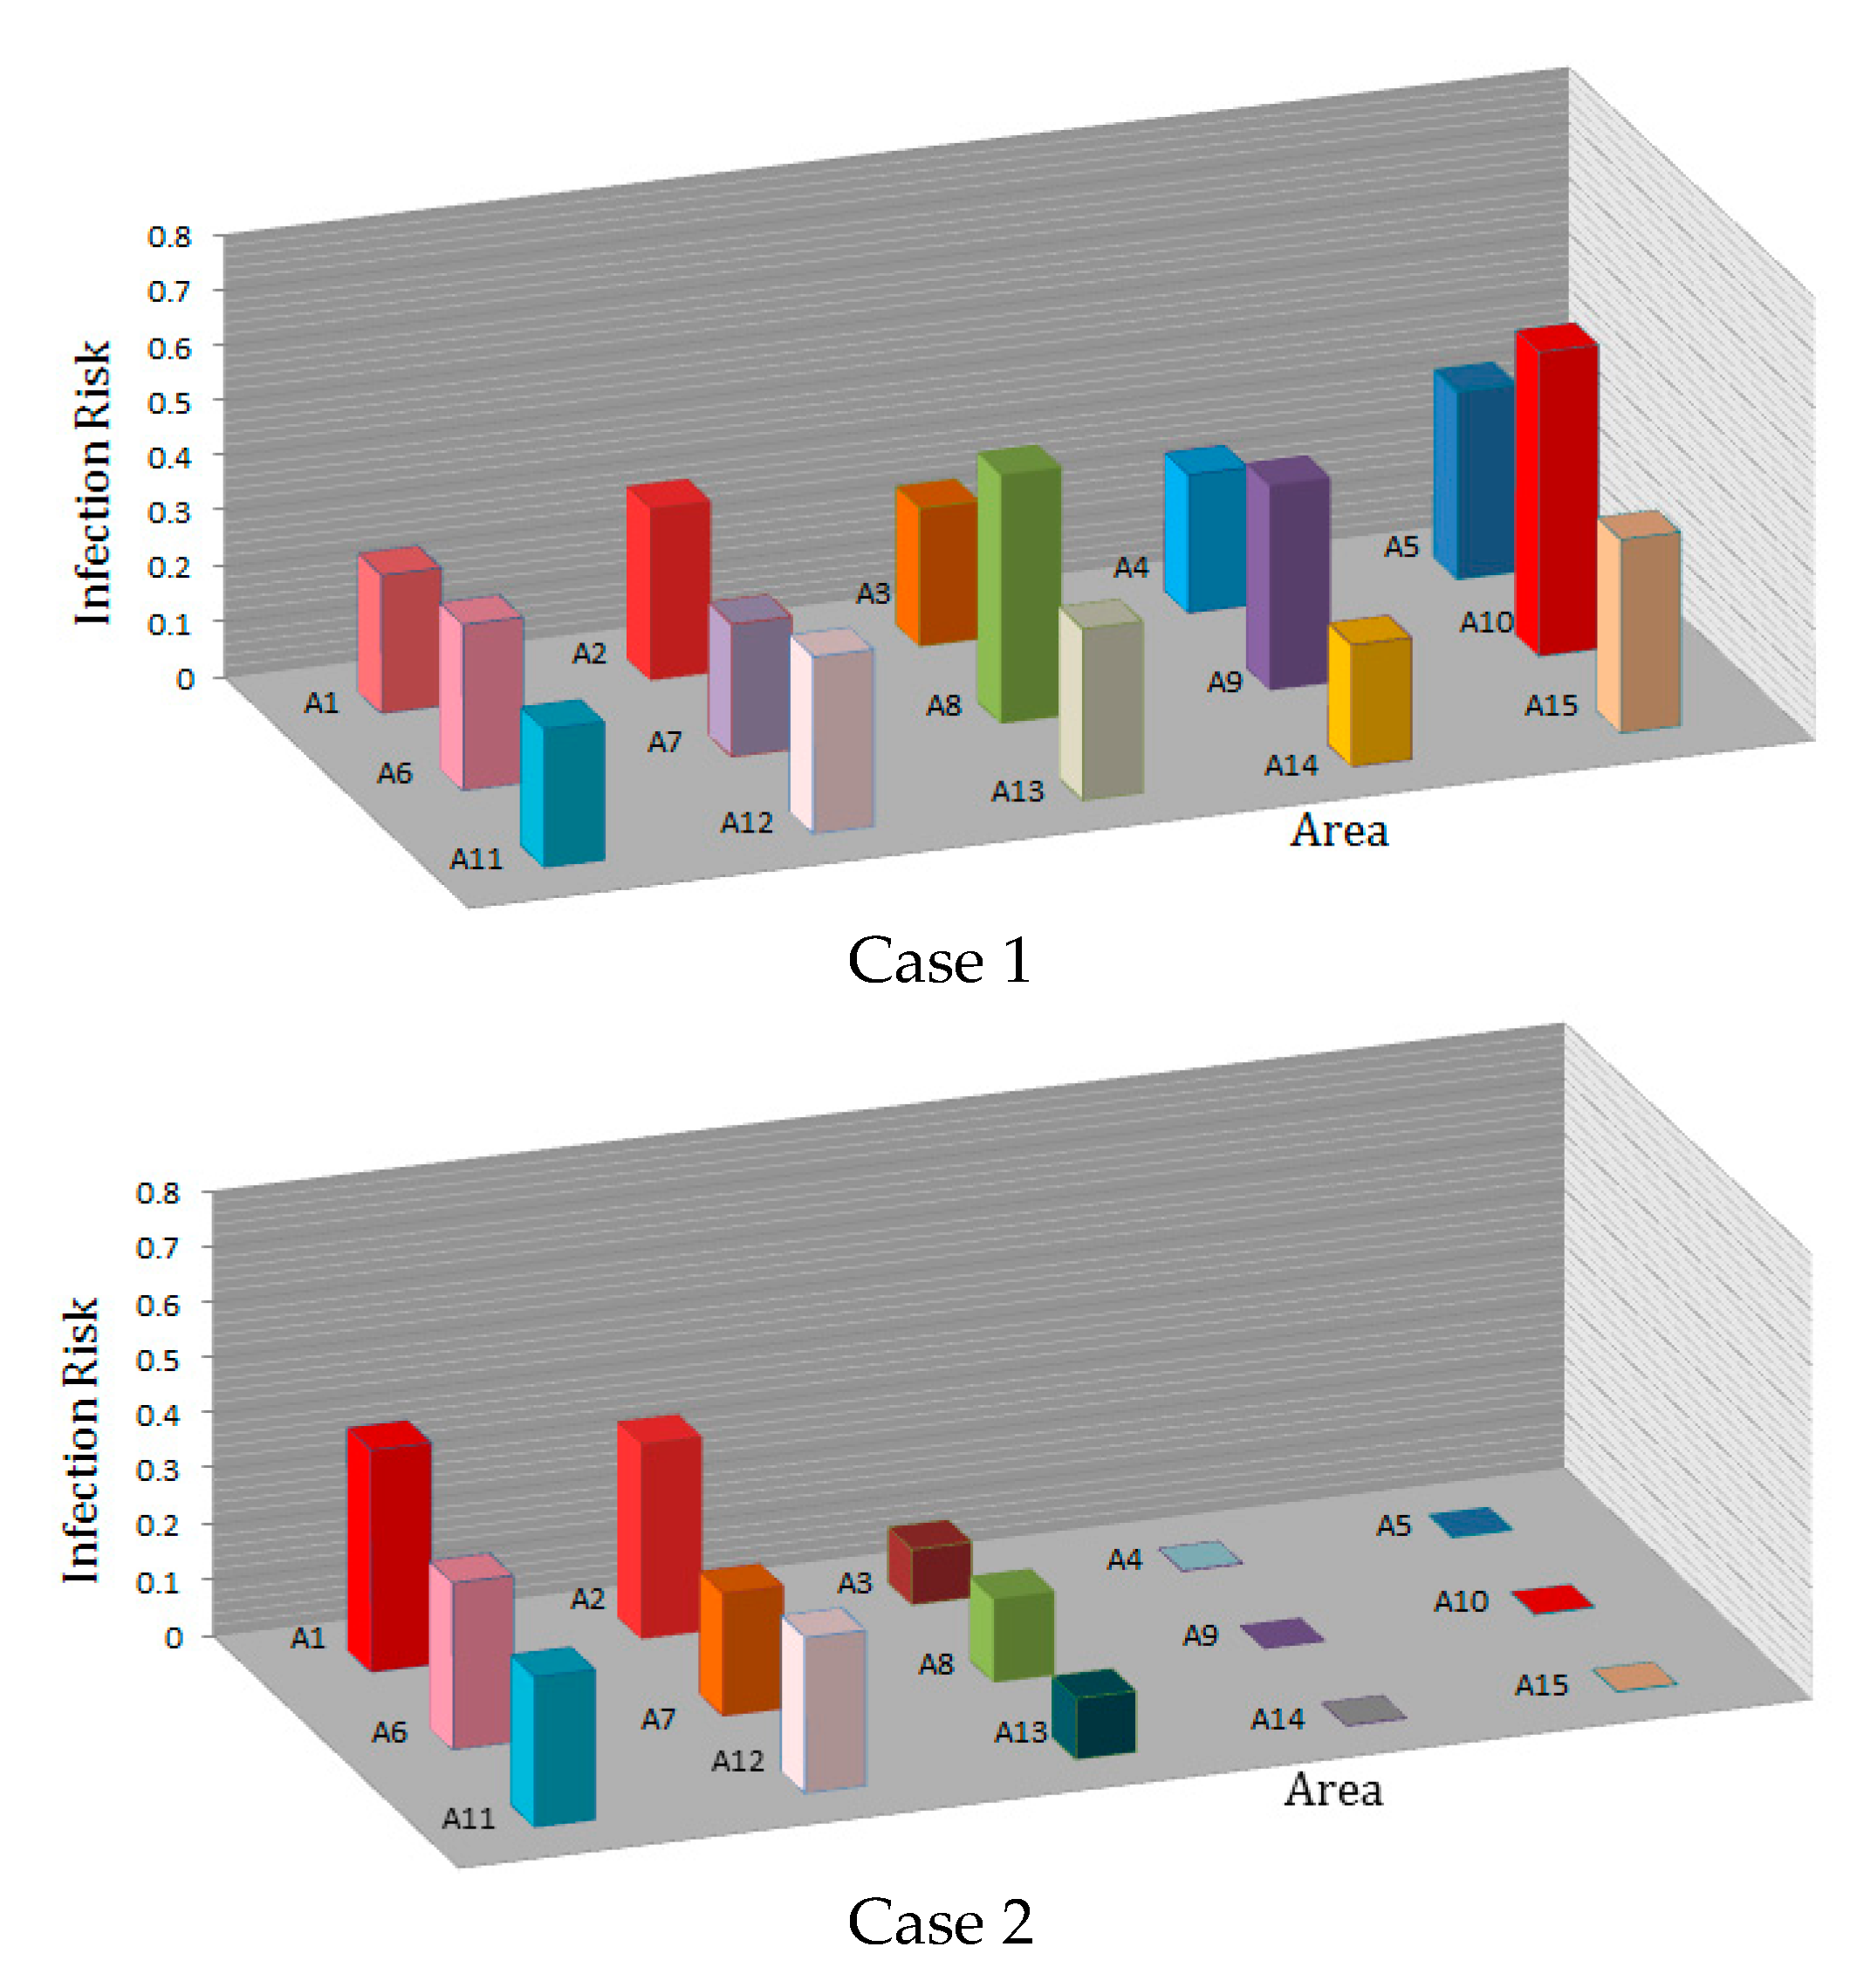
Figure 14 shows the infection risk based on the average droplet concentration in each area in the time interval from 0 to 115 s. Again, the distance between the coughing person and the ventilation outlet determines the residence time of the droplets before they escape through the outlet.
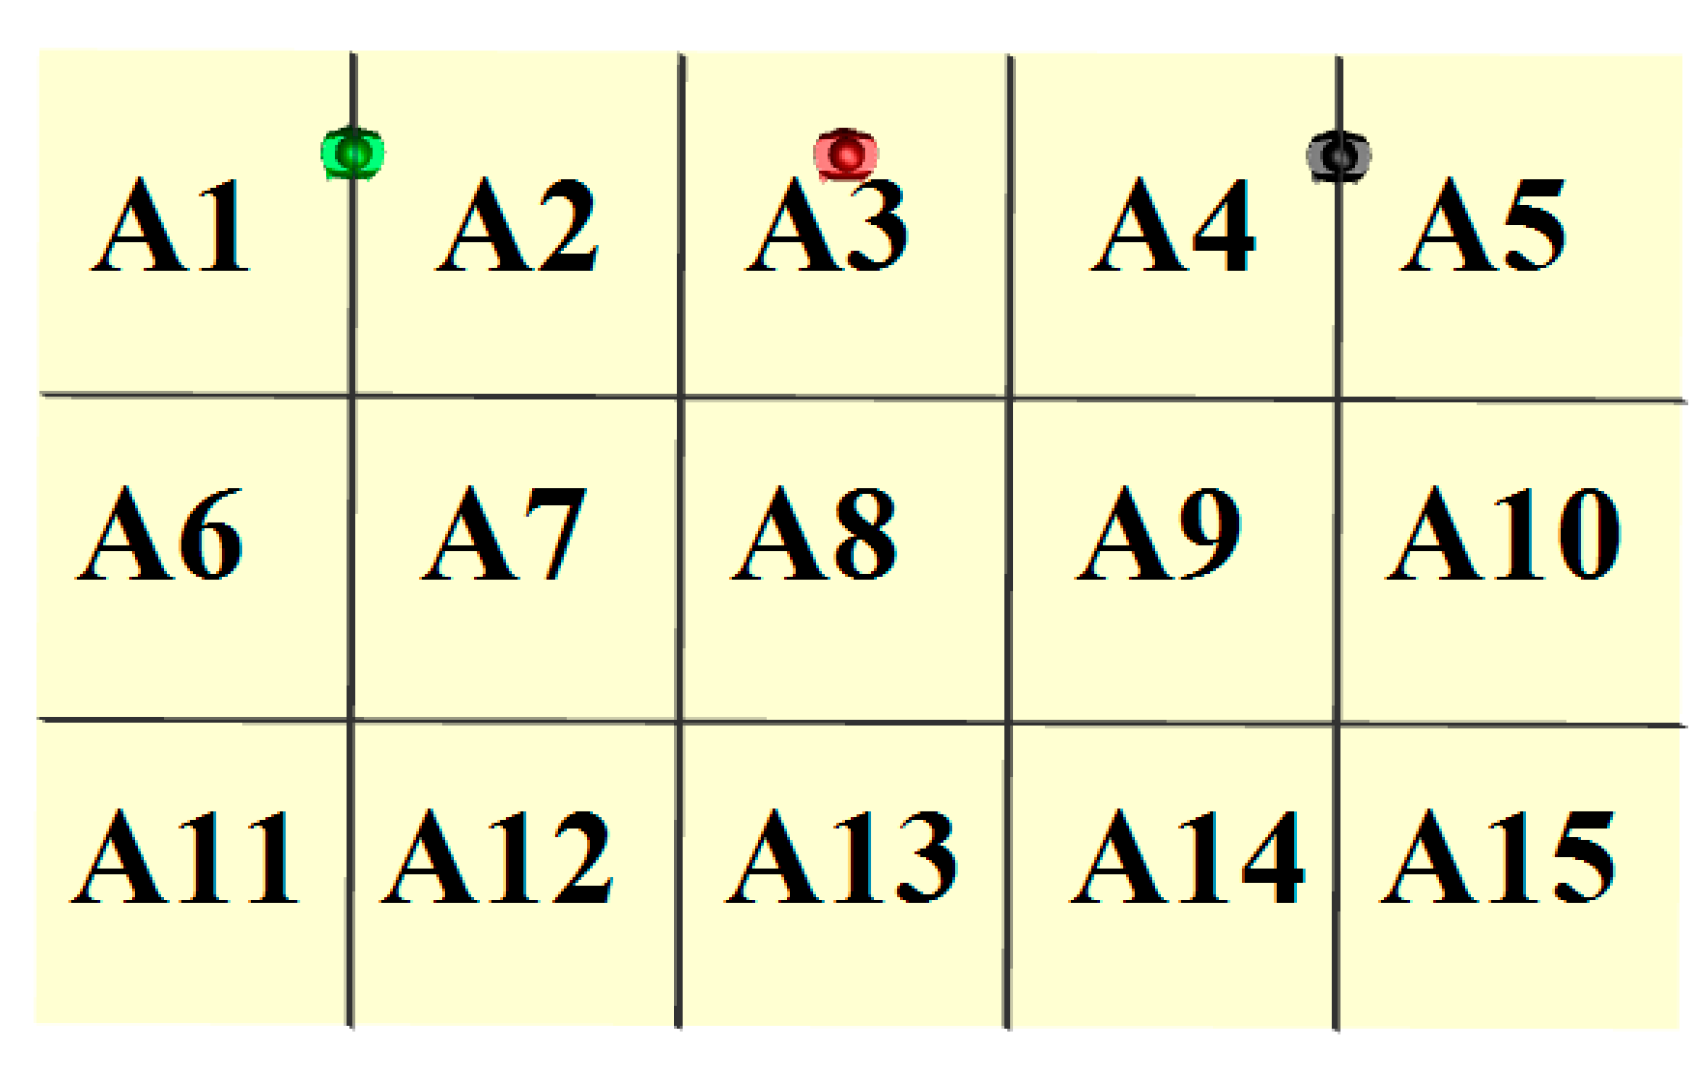
For the ventilation system in Case 1, the droplets remain around the patient’s face for about 3 s after the coughing and then spread in the room. In this case, the ventilation inlet and outlet are located along the room, the cough droplets spread throughout the room, and people in all areas are at high risk of infection. When the coughing person is at location C, and the ventilation air flow proceeds along the length of the indoor space (see Figure 3), the infection risk in areas A1, A2, A7, A8, A9, and A10 are 23%, 27%, 19%, 33%, 30%, and 48%, respectively.
For the ventilation system in Case 2, the air curtain prevents and delays the spreading of the cough droplets in the room and the chance of infecting other occupants is reduced. When the coughing person is at location C, for the ventilation system in Case 2 with inlet and outlet registers on the side of the indoor space (see Figure 3), the infection risk in areas A1, A2, A7, A8, A9, and A10 are 37%, 32%, 15%, 10%, 0.05%, and 0.05%, respectively. In this case, the infection risk in areas A4, A5, A9, A10, A14, and A15 significantly reduced.
The comparison between the infection risks for Case 1 and Case 2 ventilation systems shows that people on the other side of the air curtain generally run a lower risk of infection. In addition, the average infection risk of people in a space with air curtain-type air flow patterns significantly reduced compared to Case 1 ventilation with no air curtain. For example, when the coughing person is in area C, the infection risk of a person in area A10 decreases from 57% to 0.05%. When there is no air curtain-type air flow pattern, persons in all areas run a high risk of infection.

4. Conclusions

The dispersion of cough droplets was investigated using CFD simulations and assuming realistic conditions with the presence of 2 ventilation systems in the indoor space environment of a building. The results of the simulation of a patient’s cough, the dispersion of droplets, and the risk of infection are as follows:
  • In Case 1, it takes 115 s to clear the area of the droplets compared to 75 s in Case 2.
  • In Case 1, the droplets spread all over the room after a while, but, in Case 2, they remain only in a part of the space for all the time, so in Case 2, there is always a safe area with a low risk of infection of Covid-19 virus
  • When curtain-type air flow patterns are formed in the room, the infection risk of people at the other end of the room decreases significantly. For example, the risk in area A10 decreases from 48% in Case 1 to 0.05% in Case 2, and in area A9 the infection risk is reduced from 30% in Case 1 to 0.05% in Case 2.
To sum up, the presence of the curtain-type air flow pattern (Case2) causes less diffusion of droplets in the space, and the particles leave the area earlier. In Case 2, there is always a safe area with a low risk of infection of Covid-19 virus. Therefore, it can be concluded that proper design of the location of the supply and exhaust registers in a ventilation system may have a significant effect on the spread of virus particles in the area and also on the possibility of occupants being infected with the virus.

Author Contributions

Conceptualization, S.K.; methodology, E.L.; software, S.K.; validation, S.K.; formal analysis, S.K.; investigation, S.K.; resources, S.K.; data curation, S.K.; writing—original draft preparation, S.K.; writing—review and editing, S.K., E.L., S.S., S.D., F.S., B.J.L., M.E.W., H.D.K., G.A.; visualization, S.K.; supervision, E.L., S.D. and G.A.; project administration, E.L. All authors have read and agreed to the published version of the manuscript.

Funding

This research was supported by the Brain Pool program funded by the Ministry of Science and ICT through the National Research Foundation of Korea (Grant: NRF-2022H1D3A2A02090885).

Data Availability Statement

The data that support the findings of this study are available from the corresponding author upon reasonable request.

Conflicts of Interest

The authors declare no conflict of interest.

Nomenclature

ASurface area (m2)
ACAverage droplet concentration (Kg/m3)
Aii-th area (i = 1,2,..,8)
ANNumber of particles
CAvgVolume—average concentration
CCCunningham coefficient (-)
CpDensity of the number of quanta in droplets (-)
DdDroplet diameter (μm)
FAvgVolume—average volume fraction
FBBrownian force (-)
FTHThermophoretic force (-)
FLSaffman lift force (-)
f(t) Virus viability
GGravity (m/s2)
INumber of infectors (-)
IIEjection time(s)
KTurbulence kinetic energy (J/kg)
KTFluid thermal conductivity (W/m K)
mpMass flow rate (kg/s)
NNumber of droplets (-)
NTTotal number of droplets (-)
NtDroplets at given times (-)
NTnDroplets remaining in the space (-)
N m Number of mesh elements (-)
NsTotal number of quanta (-)
PPressure (Pa)
PAvgAverage pressure in the domain under consideration (Pa)
PRTParticle residence time(s)
PopOperating pressure (pa)
QAir supply rate (m3/s)
QGeneration rate of quanta (quanta/s)
RHRelative humidity (-)
PrtParticle removal time(s)
SNumber of susceptible persons (-)
ScSchmidt number (-)
STSource term (C)
TTime (s)
TTemperature conditions (C)
TAvgVolume average temperature in domain solving (C)
u, v, wVelocity components (m/s)
Gk, Sε, Sk, αk, αε, Rε, C 1 ε , C 2 ε Turbulent kinetic energy and modelconstants (-)
VVelocity vector (m/s)
VAvgAverage velocity in the flow domain under consideration (m/s)
VvVentilation velocity (m/s)
WWater mass fraction (Kg/mol)
Greek symbols
ERate of dissipation of turbulence kinetic energy
H Particle removal efficiency (-)
MKinetic viscosity (Pa s)
PBreathing rate per person (m3/s)
ρaDensity (kg/m3)
ρ d Droplet density
v x ,   t Droplet concentration
Subscripts
SatSaturation (-)
TTotal (-)
x, y, zCartesian directions (-)

References

  1. Bar-On, Y.M.; Flamholz, A.; Phillips, R.; Milo, R. Science Forum: SARS-CoV-2 (COVID-19) by the numbers. eLife 2020, 9, e57309. [Google Scholar] [CrossRef] [PubMed]
  2. Li, S.; Li, Z.; Dong, Y.; Shi, T.; Zhou, S.; Chen, Y.; Wang, X.; Qin, F. Temporal-spatial risk assessment of COVID-19 under the influence of urban spatial environmental parameters: The case of Shenyang city. In Building Simulation; Tsinghua University Press: Beijing, China, 2022; pp. 1–17. [Google Scholar] [CrossRef]
  3. Li, X.; Shang, Y.; Yan, Y.; Yang, L.; Tu, J. Modelling of evaporation of cough droplets in inhomogeneous humidity fields using the multi-component Eulerian-Lagrangian approach. Build. Environ. 2018, 128, 68–76. [Google Scholar] [CrossRef] [PubMed]
  4. Redrow, J.; Mao, S.; Celik, I.; Posada, J.A.; Feng, Z.G. Modeling the evaporation and dispersion of airborne sputum droplets expelled from a human cough. Build. Environ. 2011, 46, 2042–2051. [Google Scholar] [CrossRef]
  5. Liu, Z.; Zhuang, W.; Hu, L.; Rong, R.; Li, J.; Ding, W.; Li, N. Experimental and numerical study of potential infection risks from exposure to bioaerosols in one BSL-3 laboratory. Build. Environ. 2020, 179, 106991. [Google Scholar] [CrossRef] [PubMed]
  6. Miranda, M.T.; Romero, P.; Valero-Amaro, V.; Arranz, J.I.; Montero, I. Ventilation conditions and their influence on thermal comfort in examination classrooms in times of COVID-19. A case study in a Spanish area with Mediterranean climate. Int. J. Hyg. Environ. Health 2021, 240, 113910. [Google Scholar] [CrossRef]
  7. Mirzaie, M.; Lakzian, E.; Khan, A.; Warkiani, M.E.; Mahian, O.; Ahmadi, G. COVID-19 spread in a classroom equipped with partition–A CFD approach. J. Hazard. Mater. 2021, 420, 126587. [Google Scholar] [CrossRef]
  8. Ahmadzadeh, M.; Farokhi, E.; Shams, M. Investigating the effect of air conditioning on the distribution and transmission of Covid-19 virus particles. J. Clean. Prod. 2021, 316, 128147. [Google Scholar] [CrossRef]
  9. Asif, M.; Xu, Y.; Xiao, F.; Sun, Y. Diagnosis of COVID-19, vitality of emerging technologies and preventive measures. Chem. Eng. J. 2021, 423, 130189. [Google Scholar] [CrossRef]
  10. Kim, S.; Yang, X.; Yang, K.; Guo, H.; Cho, M.; Kim, Y.J.; Lee, Y. Recycling respirator masks to a high-value product: From COVID-19 prevention to highly efficient battery separator. Chem. Eng. J. 2022, 430, 132723. [Google Scholar] [CrossRef]
  11. Motamedi, H.; Shirzadi, M.; Tominaga, Y.; Mirzaei, P.A. CFD modeling of airborne pathogen transmission of COVID-19 in confined spaces under different ventilation strategies. Sustain. Cities Soc. 2022, 76, 103397. [Google Scholar] [CrossRef]
  12. Gupta, J.K.; Lin, C.H.; Chen, Q. Flow dynamics and characterization of a cough. Indoor Air 2009, 19, 517–525. [Google Scholar] [CrossRef] [PubMed]
  13. Dbouk, T.; Drikakis, D. Weather impact on airborne coronavirus survival. Phys. Fluids 2020, 32, 093312. [Google Scholar] [CrossRef] [PubMed]
  14. ANSYS Academic Research. ANSYS Fluent Theory Guide. ANSYS Help System; ANSYS Academic Research: Canonsburg, PA, USA, 2020. [Google Scholar]
  15. Celik, I.B.; Ghia, U.; Roache, P.J.; Freitas, C.J. Procedure for estimation and reporting of uncertainty due to discretization in CFD applications. J. Fluids Eng.-Trans. ASME 2008, 130. [Google Scholar] [CrossRef]
  16. Lee, M.; Park, G.; Park, C.; Kim, C. Improvement of grid independence test for computational fluid dynamics model of building based on grid resolution. Adv. Civ. Eng. 2020, 1–11. [Google Scholar] [CrossRef]
  17. Lu, W.; Howarth, A.T.; Adam, N.; Riffat, S.B. Modelling and measurement of airflow and aerosol particle distribution in a ventilated two-zone chamber. Build. Environ. 1996, 31, 417–423. [Google Scholar] [CrossRef]
  18. Deprédurand, V.; Castanet, G.; Lemoine, F. Heat and mass transfer in evaporating droplets in interaction: Influence of the fuel. Int. J. Heat Mass Transf. 2010, 53, 3495–3502. [Google Scholar] [CrossRef]
  19. Chao, C.Y.H.; Wan, M.P.; Morawska, L.; Johnson, G.R.; Ristovski, Z.D.; Hargreaves, M.; Katoshevski, D. Characterization of expiration air jets and droplet size distributions immediately at the mouth opening. J. Aerosol Sci. 2009, 40, 122–133. [Google Scholar] [CrossRef]
  20. Effros, R.M.; Hoagland, K.W.; Bosbous, M.; Castillo, D.; Foss, B.; Dunning, M.; Sun, F. Dilution of respiratory solutes in exhaled condensates. Am. J. Respir. Crit. Care Med. 2002, 165, 663–669. [Google Scholar] [CrossRef]
  21. Shih, T.H.; Liou, W.W.; Shabbir, A.; Yang, Z.; Zhu, J. A new k-ε eddy viscosity model for high Reynolds number turbulent flows. Comput. Fluids 1996, 24, 227–238. [Google Scholar] [CrossRef]
  22. Wang, J.; Sun, L.; Zou, M.; Gao, W.; Liu, C.; Shang, L.; Zhao, Y. Bioinspired shape-memory graphene film with tunable wettability. Sci. Adv. 2017, 3, e1700004. [Google Scholar] [CrossRef]
  23. Li, Y.Y.; Wang, J.X.; Chen, X. Can a toilet promote virus transmission? From a fluid dynamics perspective. Phys. Fluids 2020, 32, 065107. [Google Scholar] [CrossRef] [PubMed]
  24. Li, A.; Ahmadi, G. Dispersion and deposition of spherical particles from point sources in a turbulent channel flow. Aerosol Sci. Technol. 1992, 16, 209–226. [Google Scholar] [CrossRef]
  25. Chen, Y.P.; Deng, Z.L. Hydrodynamics of a droplet passing through a microfluidic T-junction. J. Fluid Mech. 2017, 819, 401–434. [Google Scholar] [CrossRef]
  26. Zhang, C.; Wu, S.; Yao, F. Evaporation regimes in an enclosed narrow space. Int. J. Heat Mass Transf. 2019, 138, 1042–1053. [Google Scholar] [CrossRef]
  27. O’Connell, M.J.; Boul, P.; Ericson, L.M.; Huffman, C.; Wang, Y.; Haroz, E.; Smalley, R.E. Reversible water-solubilization of single-walled carbon nanotubes by polymer wrapping. Chem. Phys. Lett. 2001, 342, 265–271. [Google Scholar] [CrossRef]
  28. Jose, A.; Thibodeaux, M.S. Institutionalization of ethics: The perspective of managers. J. Bus. Ethics 1999, 22, 133–143. [Google Scholar] [CrossRef]
  29. Landy, L. Reviewing the musicology of electroacoustic music: A plea for greater triangulation. Organ. Sound 1999, 4, 61–70. [Google Scholar] [CrossRef]
  30. Dao, H.T.; Kim, K.S. Behavior of cough droplets emitted from Covid-19 patient in hospital isolation room with different ventilation configurations. Build. Environ. 2022, 209, 108649. [Google Scholar] [CrossRef]
  31. Wells, W.F. Airborne Contagion and Air Hygiene. An Ecological Study of Droplet Infections. Am. J. Clin. Pathol. 1955, 25, 1301. [Google Scholar] [CrossRef]
  32. Riley, E.C.; Murphy, G.; Riley, R.L. Airborne spread of measles in a suburban elementary school. Am. J. Epidemiol. 1978, 107, 421–432. [Google Scholar] [CrossRef]
  33. Yang, Y.; Wang, Y.; Tian, L.; Su, C.; Chen, Z.; Huang, Y. Effects of purifiers on the airborne transmission of droplets inside a bus. Phys. Fluids 2022, 34, 017108. [Google Scholar] [CrossRef] [PubMed]
  34. Miller, S.L.; Nazaroff, W.W.; Jimenez, J.L.; Boerstra, A.; Buonanno, G.; Dancer, S.J.; Noakes, C. Transmission of SARS-CoV-2 by inhalation of respiratory aerosol in the Skagit Valley Chorale superspreading event. Indoor Air 2021, 31, 314–323. [Google Scholar] [CrossRef] [PubMed]
  35. Yang, Y.; Wang, Y.; Su, C.; Liu, X.; Yuan, X.; Chen, Z. Numerical Investigation on the Droplet Dispersion inside a Bus and the Infection Risk Prediction. Appl. Sci. 2022, 12, 5909. [Google Scholar] [CrossRef]
Figure 1. Geometry of the ventilation air flow pattern and mannequins in the indoor space (Case 1).
Energies 16 01672 g001
Figure 2. Diagrams of the ventilation air flow patterns in the room with the inlet and outlet registers on the side walls (Case 2); the mannequins are in the same position as in Figure 1.
Energies 16 01672 g002
Figure 3. Top view of the indoor space.
Energies 16 01672 g003
Figure 4. Mesh structure.
Energies 16 01672 g004
Figure 5. Validation of the present computational results for an evaporating 10 µm droplet by comparison with the data from [3].
Energies 16 01672 g005
Figure 6. Air flow velocity of a single cough due to a pulse air jet as reported by Gupta et al.
Energies 16 01672 g006
Figure 7. 3D view of the zones.
Energies 16 01672 g007
Figure 8. Comparison of the air flow patterns in the mid-plane: (a) present study, (b) Lu et al..
Energies 16 01672 g008
Figure 9. Modeling and the sequence of calculations.
Energies 16 01672 g009
Figure 10. Velocity contours in the middle planes of the space in both cases.
Energies 16 01672 g010
Figure 11. Velocity vector in the middle planes of the space in both cases.
Energies 16 01672 g011
Figure 12. Particle residence time in the indoor space at different times with two ventilation systems.
Energies 16 01672 g012aEnergies 16 01672 g012b
Figure 13. Time-dependent changes in the fraction of droplets remaining in the air (NTn) in the area for Case 1 and Case 2.
Energies 16 01672 g013
Figure 14. Infection risk of individuals in areas A1 to A15 for Case 1 and Case 2 ventilation systems in the time interval from 0 to 115s when an infected person is coughing in area C.
Energies 16 01672 g014
Table 1. Boundary conditions of continuous air flow phase simulations.
SurfaceVariablesBoundary ValueW (Kg/mol)T(°C)
Ventilation inlet Velocity inlet5 m/s0.0072617 °C
Ventilation outletPressure105 KPa-30 °C
Person’s mouthCough velocityUDF0.0353437 °C
Table 2. Specification of injected droplets (COVID-19 viruses).
Dd (μm)mp (kg/s)ANII (s)
0.154.24 × 10−1518000.35
11.25 × 10−1218000.35
101.25 × 10−918000.35
501.57 × 10−718000.35
1001.25 × 10−618000.35
1504.24 × 10−618000.35
Table 3. Independency analysis.
Grid 1-2Grid 2-3
1-Fine, 2-Medium2-Medium, 3-Coarse
pε2,1 (%)GCI2,1(%)ε3,2 (%)GCI3,2 (%)
Average pressure in the domain33.930.490.871.997
Table 4. Time-step independence study of CAvg.
CAvg in Simulation Time (s)
0.40.60.91.5
Time step (s)0.0091.312846 × 10−71.743575 × 10−71.7442261 × 10−71.738135 × 10⁻⁷
0.0071.312863 × 10−71.743583 × 10−71.7442299 × 10−71.740361 × 10⁻⁷
0.0051.312866 × 10−71.743589 × 10−71.7442302 × 10−71.740365 × 10⁻⁷
0.0031.312867 × 10−71.743590 × 10−71.7442302 × 10−71.740366 × 10⁻⁷
Table 5. Time-step independence study of FAvg.
FAvg in Simulation Time (s)
0.40.60.91.5
Time step (s)0.0091.364348 × 10−101.765463 × 10−101.765554 × 10−101.759675 × 10⁻¹⁰
0.0071.364375 × 10−101.765481 × 10−101.765603 × 10−101.760236 × 10⁻¹⁰
0.0051.364387 × 10−101.765491 × 10−101.765611 × 10−101.760238 × 10⁻¹⁰
0.0031.364389 × 10−101.765492 × 10−101.765614 × 10−101.760239 × 10⁻¹⁰
Disclaimer/Publisher’s Note: The statements, opinions and data contained in all publications are solely those of the individual author(s) and contributor(s) and not of MDPI and/or the editor(s). MDPI and/or the editor(s) disclaim responsibility for any injury to people or property resulting from any ideas, methods, instructions or products referred to in the content.

