1. Introduction
“Industry 4.0” is a concept that was proposed at the 2013 Hanover World Expo. It advocates the fourth industrial revolution marked by high digitalization, networking, and self-organization of machines, aiming to improve the intelligence level of industrial production [
1]. The world has entered the era of smart technology led by data. The core is the competition of data capability, which is reflected as digital power plants, smart grids, and energy Internet in the power generation industry [
2,
3]. According to the conditions of China, the dominant position of traditional fossil energy will continue, and it will be in the era of mixed energy for a long time. The proportion of renewable energy in China, such as hydropower and wind power, will increase year by year, and the proportion of thermal power will gradually decline, which has brought great challenges to the thermal power industry. Thermal power plants are required to operate flexibly and adjust peak load deeply; thus, the concept of intelligent power generation is proposed [
4,
5,
6]. Intelligent power generation is based on the digitalization, automation, informatization, and standardization of the power generation process, and takes big data, cloud computing, and the Internet of Things as platforms. It integrates technologies such as intelligent sensing and execution, intelligent control and optimization, and intelligent management and decision-making, and forms a data-driven intelligent power generation operation control management mode with self-learning, self-adapting, self-optimizing, self-restoring, and self-organization, so as to achieve safer, more efficient, cleaner, low-carbon, and flexible production goals [
7,
8,
9,
10].
The research on the online tracking simulation system of power plants lays a solid foundation for the intelligent power generation. The concept of online simulation was put forward in the United States in the middle and late 1990s, mainly because of the need for research on actual system operation mechanisms and controls. The online tracking simulation system consists of a dynamic mechanism model and a tracking mechanism. The tracking mechanism can continuously estimate the model parameters to synchronize the state of the model and the physical object. The information provided by the systems can support operator training, operation, maintenance, and optimization. The online tracking simulation system is an important part of the digital power plant and the basis of the digital twin system of the power plant.
Froisy et al. developed the method of using the nonlinear dynamic mechanism model to solve some challenging process control problems, and also developed some customized online applications of nonlinear state estimation based on the mechanism model [
11]. Hedengren developed many online applications based on nonlinear model predictive control in the polymer field [
12]. It is proved that the additional complexity of using the nonlinear mechanism model is acceptable for the sustainability modeling method. Nakaya proposed a hybrid model of the physical model and statistical model based on historical plant operation data, which uses the virtual input of the tracking simulator to improve the estimation accuracy of the statistical model. The model based on historical data was applied together with the tracking simulator based on the Kalman filter [
13]. Pantelides described the development history, current situation, and future needs of online applications based on the mechanism model [
14]. Kawaguchi applied the online tracking simulator based on the PI control algorithm to the proton exchange membrane fuel cell experiment, and carried out experimental research on the online tracking simulator of the proton exchange membrane fuel cell. The experimental study verified that the online tracking simulator can accurately predict the output voltage of the proton exchange membrane fuel cell [
15]. Martinez proposed an integrated implementation method of the whole life cycle tracking simulation architecture, and established a tracking simulation mechanism for simple physical processes with PI controllers [
16]. At present, the research on the online tracking simulation is mainly focused on linear systems or simple nonlinear systems, and the establishment strategy of online tracking systems for complex nonlinear systems is relatively scarce.
The online tracking simulation system of the power plant can realize the digitalization of the power plant, soft measurement of data, and consolidate the foundation of the intelligent power plant. By creating a high-fidelity mechanism model, it provides a comprehensive physical and functional description of the unit system and equipment, and realizes the unit energy efficiency calculation and working condition analysis. It grasps comprehensive information, provides a verification platform for advanced and intelligent control strategies, carries out the test design, studies key test issues, and promotes the unit performance improvement.
The 660 MW ultra-supercritical circulating fluidized bed boiler is a very advanced unit in the world at present, and its system-level simulation research is very scarce. This paper studies the implementation method of its online tracking simulation system. The online simulation research based on the lumped parameter model lays the foundation for the digital twinning technology of the ultra-supercritical circulating fluidized bed boiler. The online tracking simulation system established in this paper can track the field data in real time, realize the condition monitoring of the unit, and also study the characteristics of the deep peak shaving and flexible operation process of the unit. It can also provide a reliable verification platform for control strategies and control algorithms.
2. Offline Stage
The research phase of the online tracking simulation system corresponds to the life cycle of the power plant. In the model development stage, models of various accuracy levels provided by the Apros are used to establish the system model of the power plant. The research on the online tracking system can be divided into an offline phase and online phase. The contents of the offline stage include the selection of initial conditions, the initialization of the control system, and the error compensation of mass and energy. The contents of online stage include the selection of tracking variables and control variables, the online tracking mechanism, and the expansion of the initial condition database.
2.1. Establishment of the Model
A 660 MW USCFB model was built on the Apros platform [
16], model verification and model validation are carried out according to the boiler design parameters. The simulation scope mainly includes: steam–water system, air–gas system, combustion system, ash circulation system, and control system. The steam–water system includes the main steam and reheat steam, and the air–gas system includes primary air, secondary air, and gas systems.
This paper analyzes the steady-state error of the built model under the design condition of 50% THA. According to the simulation results, the simulation value of the model is consistent with the design value, and most of the relative error is less than 1%, as presented in
Table 1.
2.2. Selection of Initial Conditions
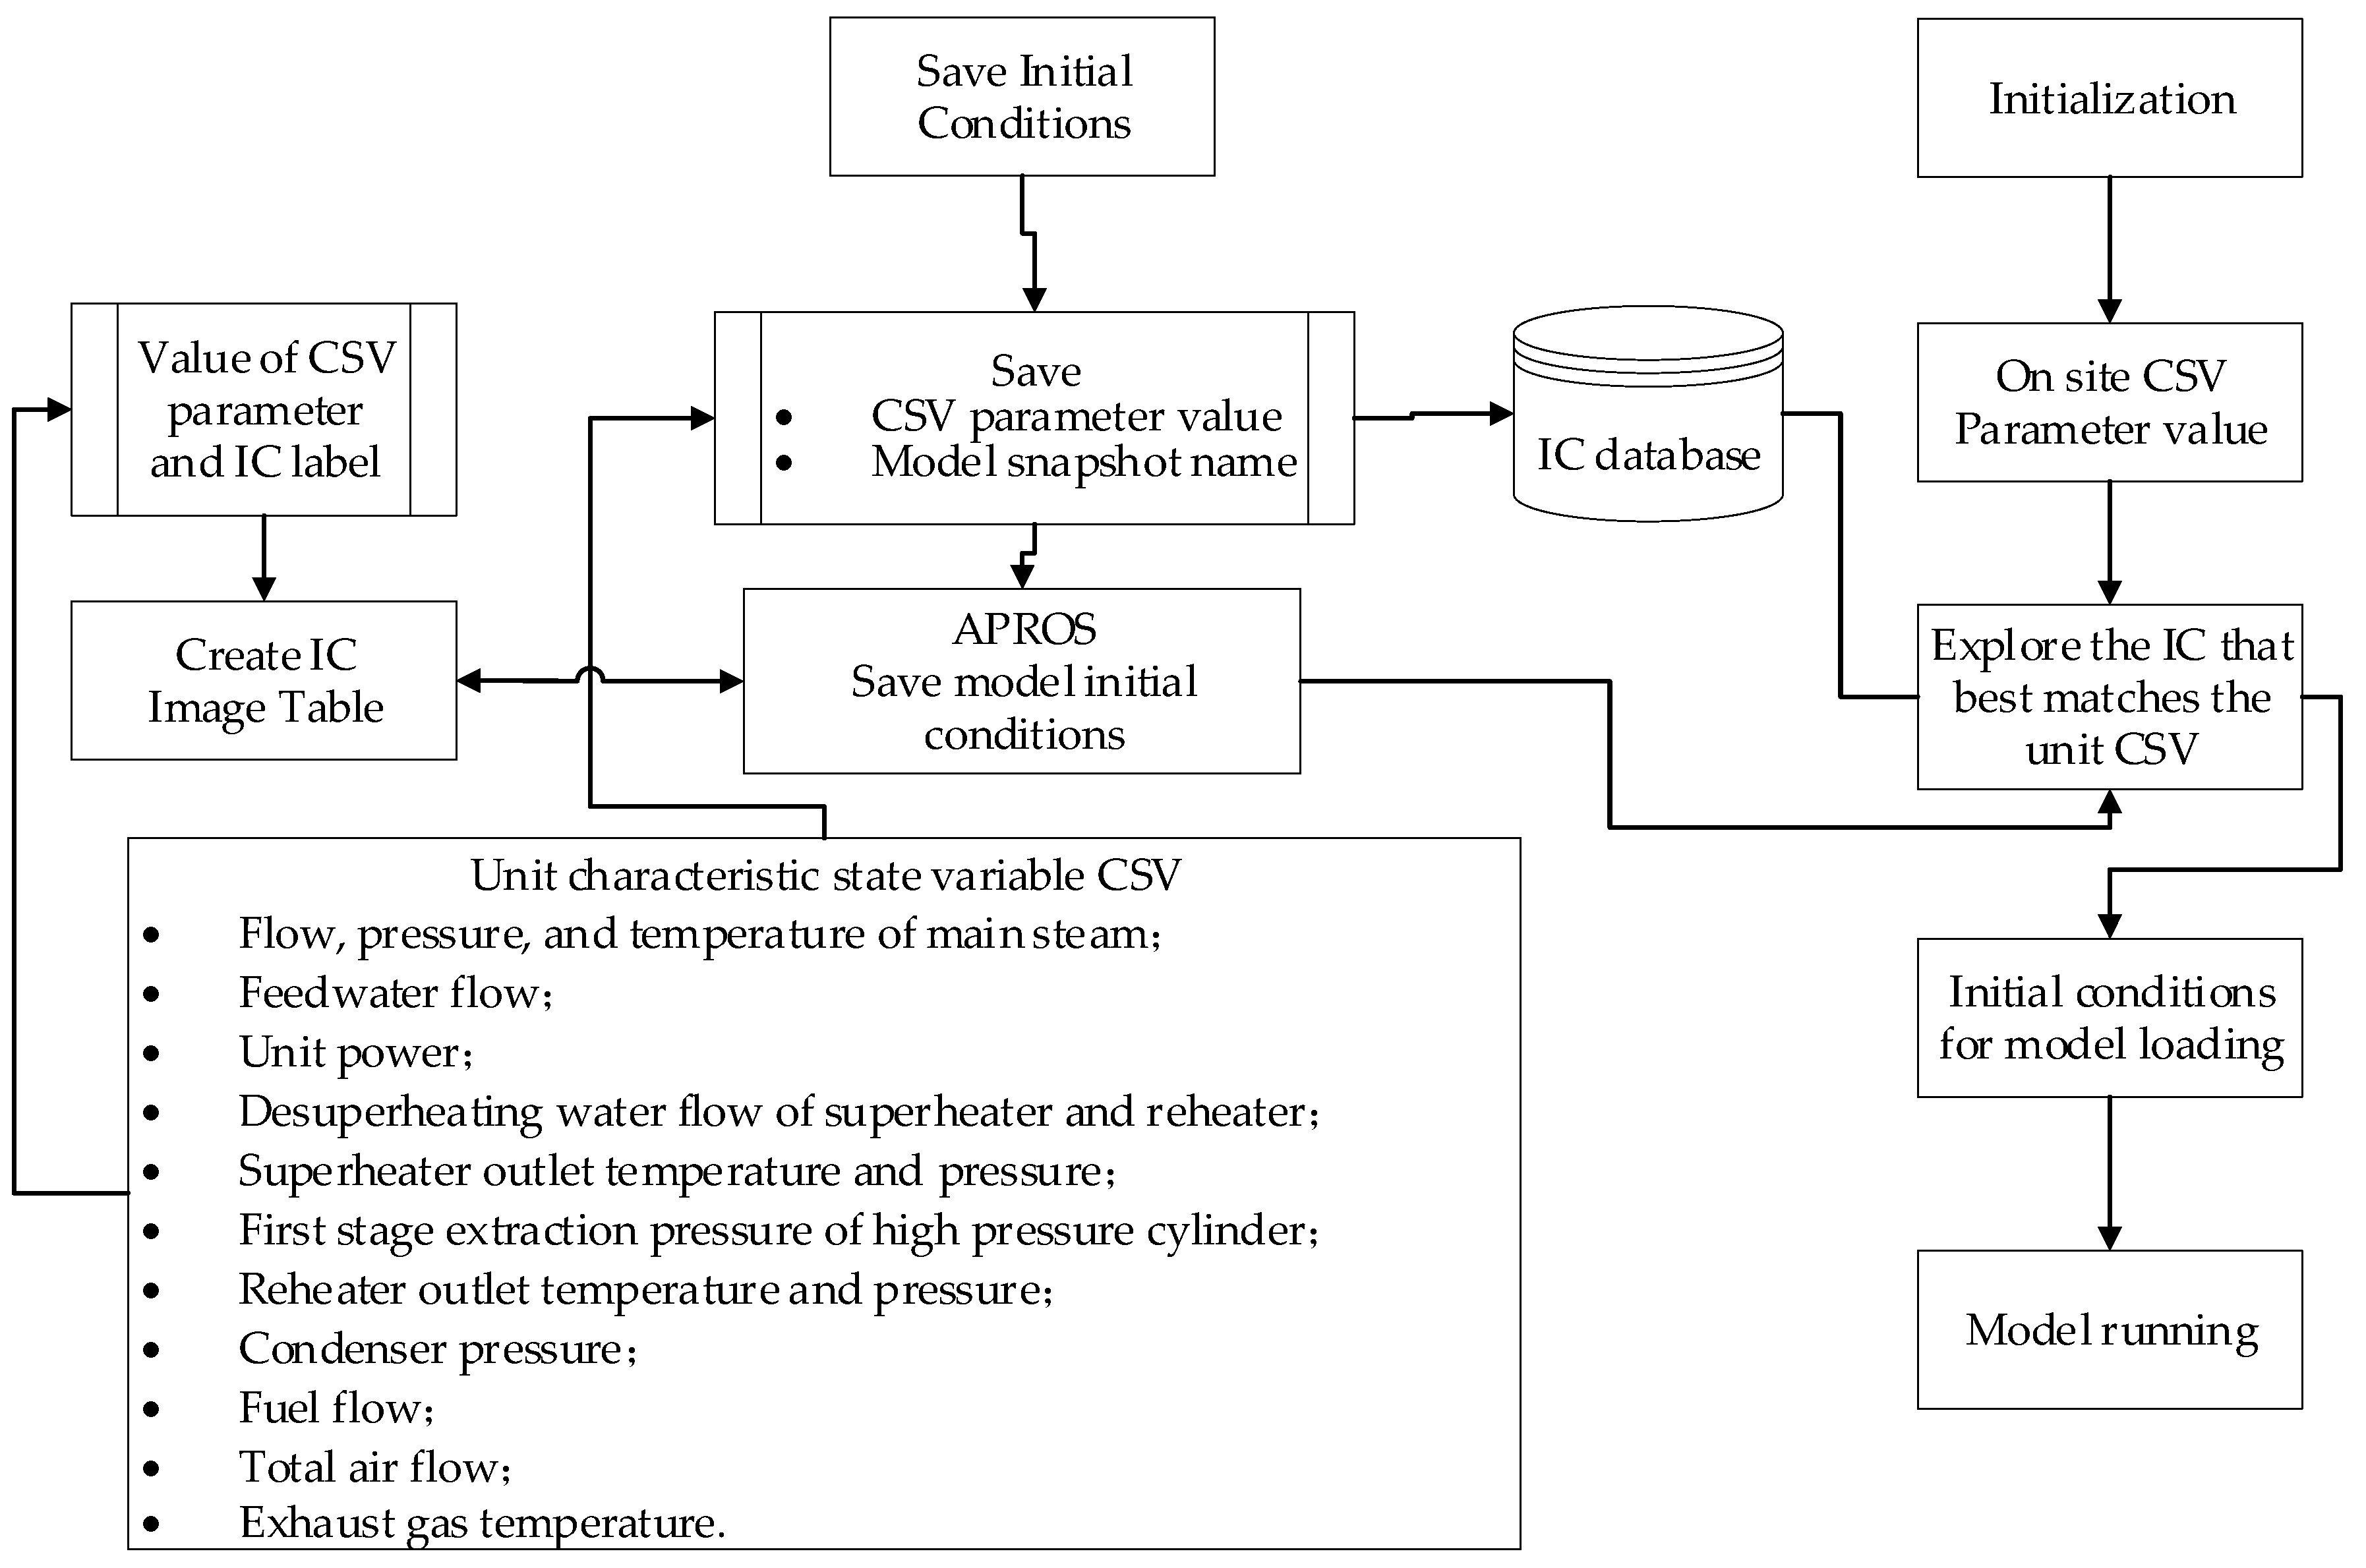
The purpose of the initial condition selection is to match the initial value of the simulation model with the current plant data. In this part, the initial conditions are selected to approximate the current state of the real system by using the previously saved initial condition database and the information available in the actual process. Performing a rough initialization before starting an online simulation reduces the time required for model adaptation, because the simulation system can start in a state close to the real device. This is very important for the boiler system, because the large inertia characteristics of heat transfer, flow process, and the complexity of the system will lead to a long time for model adaptation. Representational state variables are a set of values captured from the real system, which can define the current state of the real system. The initial conditions closest to the plant state described by the characterization of state variables will be found and inputted into the simulation system.
The selection of the initial conditions mainly includes creating IC image, saving IC, and initialization (
Figure 1).
Creating IC image: representational state variables include main steam flow, main steam pressure, main steam temperature, feed water volume, unit power, desuperheating water flow, first stage pressure of the turbine, condenser pressure, fuel flow, total air flow, and exhaust gas temperature.
Saving IC: after the model has run to the desired state, this function will store the current Apros model state and save the characteristic variable values. The saved snapshot can be used as the initial condition of the model for possible matching.
Initialization: in order to search for the most-matching initial conditions in the initial condition database, the Euclidean norm is calculated, which represents the distance between the model and actual system. The most appropriate initial conditions are loaded and initialization is completed.
2.3. Adjustment of the Initial Condition
In the initialization process, the selected IC is only the closest one to the current operating state of the actual power plant, and there is still a deviation. In order to make the plant model reach the same state as the actual plant, these errors need to be corrected. The control system model can drive the model closer to the current state of the power plant, and can make the output of the control model consistent with the output of the actual control system, which avoids the interference generated when the control signal is switched. There are two ways to access the control signal at this stage: the signal of the control system and the signal of the control system model. The advantages of establishing the control system model for control system initialization are as follows: the system can run in ultra-real-time without any problems related to communication synchronization between the actual control system and simulation; the control system model and the power plant model operate in the same simulation environment, which can make the model approach the actual power plant state in a shorter time.
In order to make the simulation model reach the same state as the real physical system, the model may need a mass/energy balance compensation, which is called the “mass energy error compensation” stage. In the offline stage, the initial condition selected by the initialization toolbox is the working condition closest to the current state of the actual process. Therefore, the mass and energy in the simulation model may not be completely consistent with the actual process. When the system forms a closed loop of mass and energy, this deviation will bring great trouble to the subsequent online tracking simulation. For the working fluid side model of the whole power plant, the working fluid is heated in the furnace, heated by the superheater, enters the turbine for work, enters the condenser for condensation, and finally enters the furnace through the feedwater heaters at all levels, which forms a quality closed-loop. When the research object is the whole power plant, the problem of quality compensation cannot be ignored before the online tracking simulation phase. The lumped parameter model based on Apros in this paper takes the mass conservation equation as the state equation, obeys the mass conservation law, and the mass will not be created or disappear. If the quality described by the model in the initial conditions is not equal to the quality of the field object, the deviation will always exist in the system, which may eventually lead to the collapse of the tracking mechanism. Therefore, it is necessary to compensate the system quality before tracking simulation. The same is true for energy compensation. In the phase of “mass and energy error compensation”, the corresponding mass and energy are “added” to or “taken” from the simulation model to make the simulation model and the real system reach the same state. In order to realize the function of “adding” or “removing” corresponding mass and energy to the simulation model, the additional adjustment equipment should be added to the simulation model. These additional adjustment devices can only be put into operation in the “mass energy error compensation” stage. When the “mass energy error compensation” stage is completed, the additional equipment will be cut off, without affecting the operation of the normal simulation model.
3. Online Stage
3.1. Global Sensitivity Analysis
The sensitivity analysis method based on variance is used in this paper. I.M. Sobol [
17] regards the model as a square integrable function f on the k-dimensional hypercube, and expands f into the sum of a group of dimensional increasing functions. Its form is shown in Equation (1).
Each term of the above equation is also a square integrable in its existence domain. One condition of this decomposition is that all terms in the function decomposition are orthogonal, as shown in Equation (2).
Then, we can obtain the terms that define the function decomposition according to the conditional expectation, as shown in the Equations (3)–(5).
Factorize the
f function and square integral to obtain Equation (6):
The above equation is converted into the variance expression (7):
A sensitivity measure
Si directly based on variance, called the first-order sensitivity coefficient, is described as Equation (8):
The first order sensitivity coefficient represents the main influence contribution of each input parameter to the output change, which is also called the importance index by other researchers.
3.2. Online Tracking Mechanism
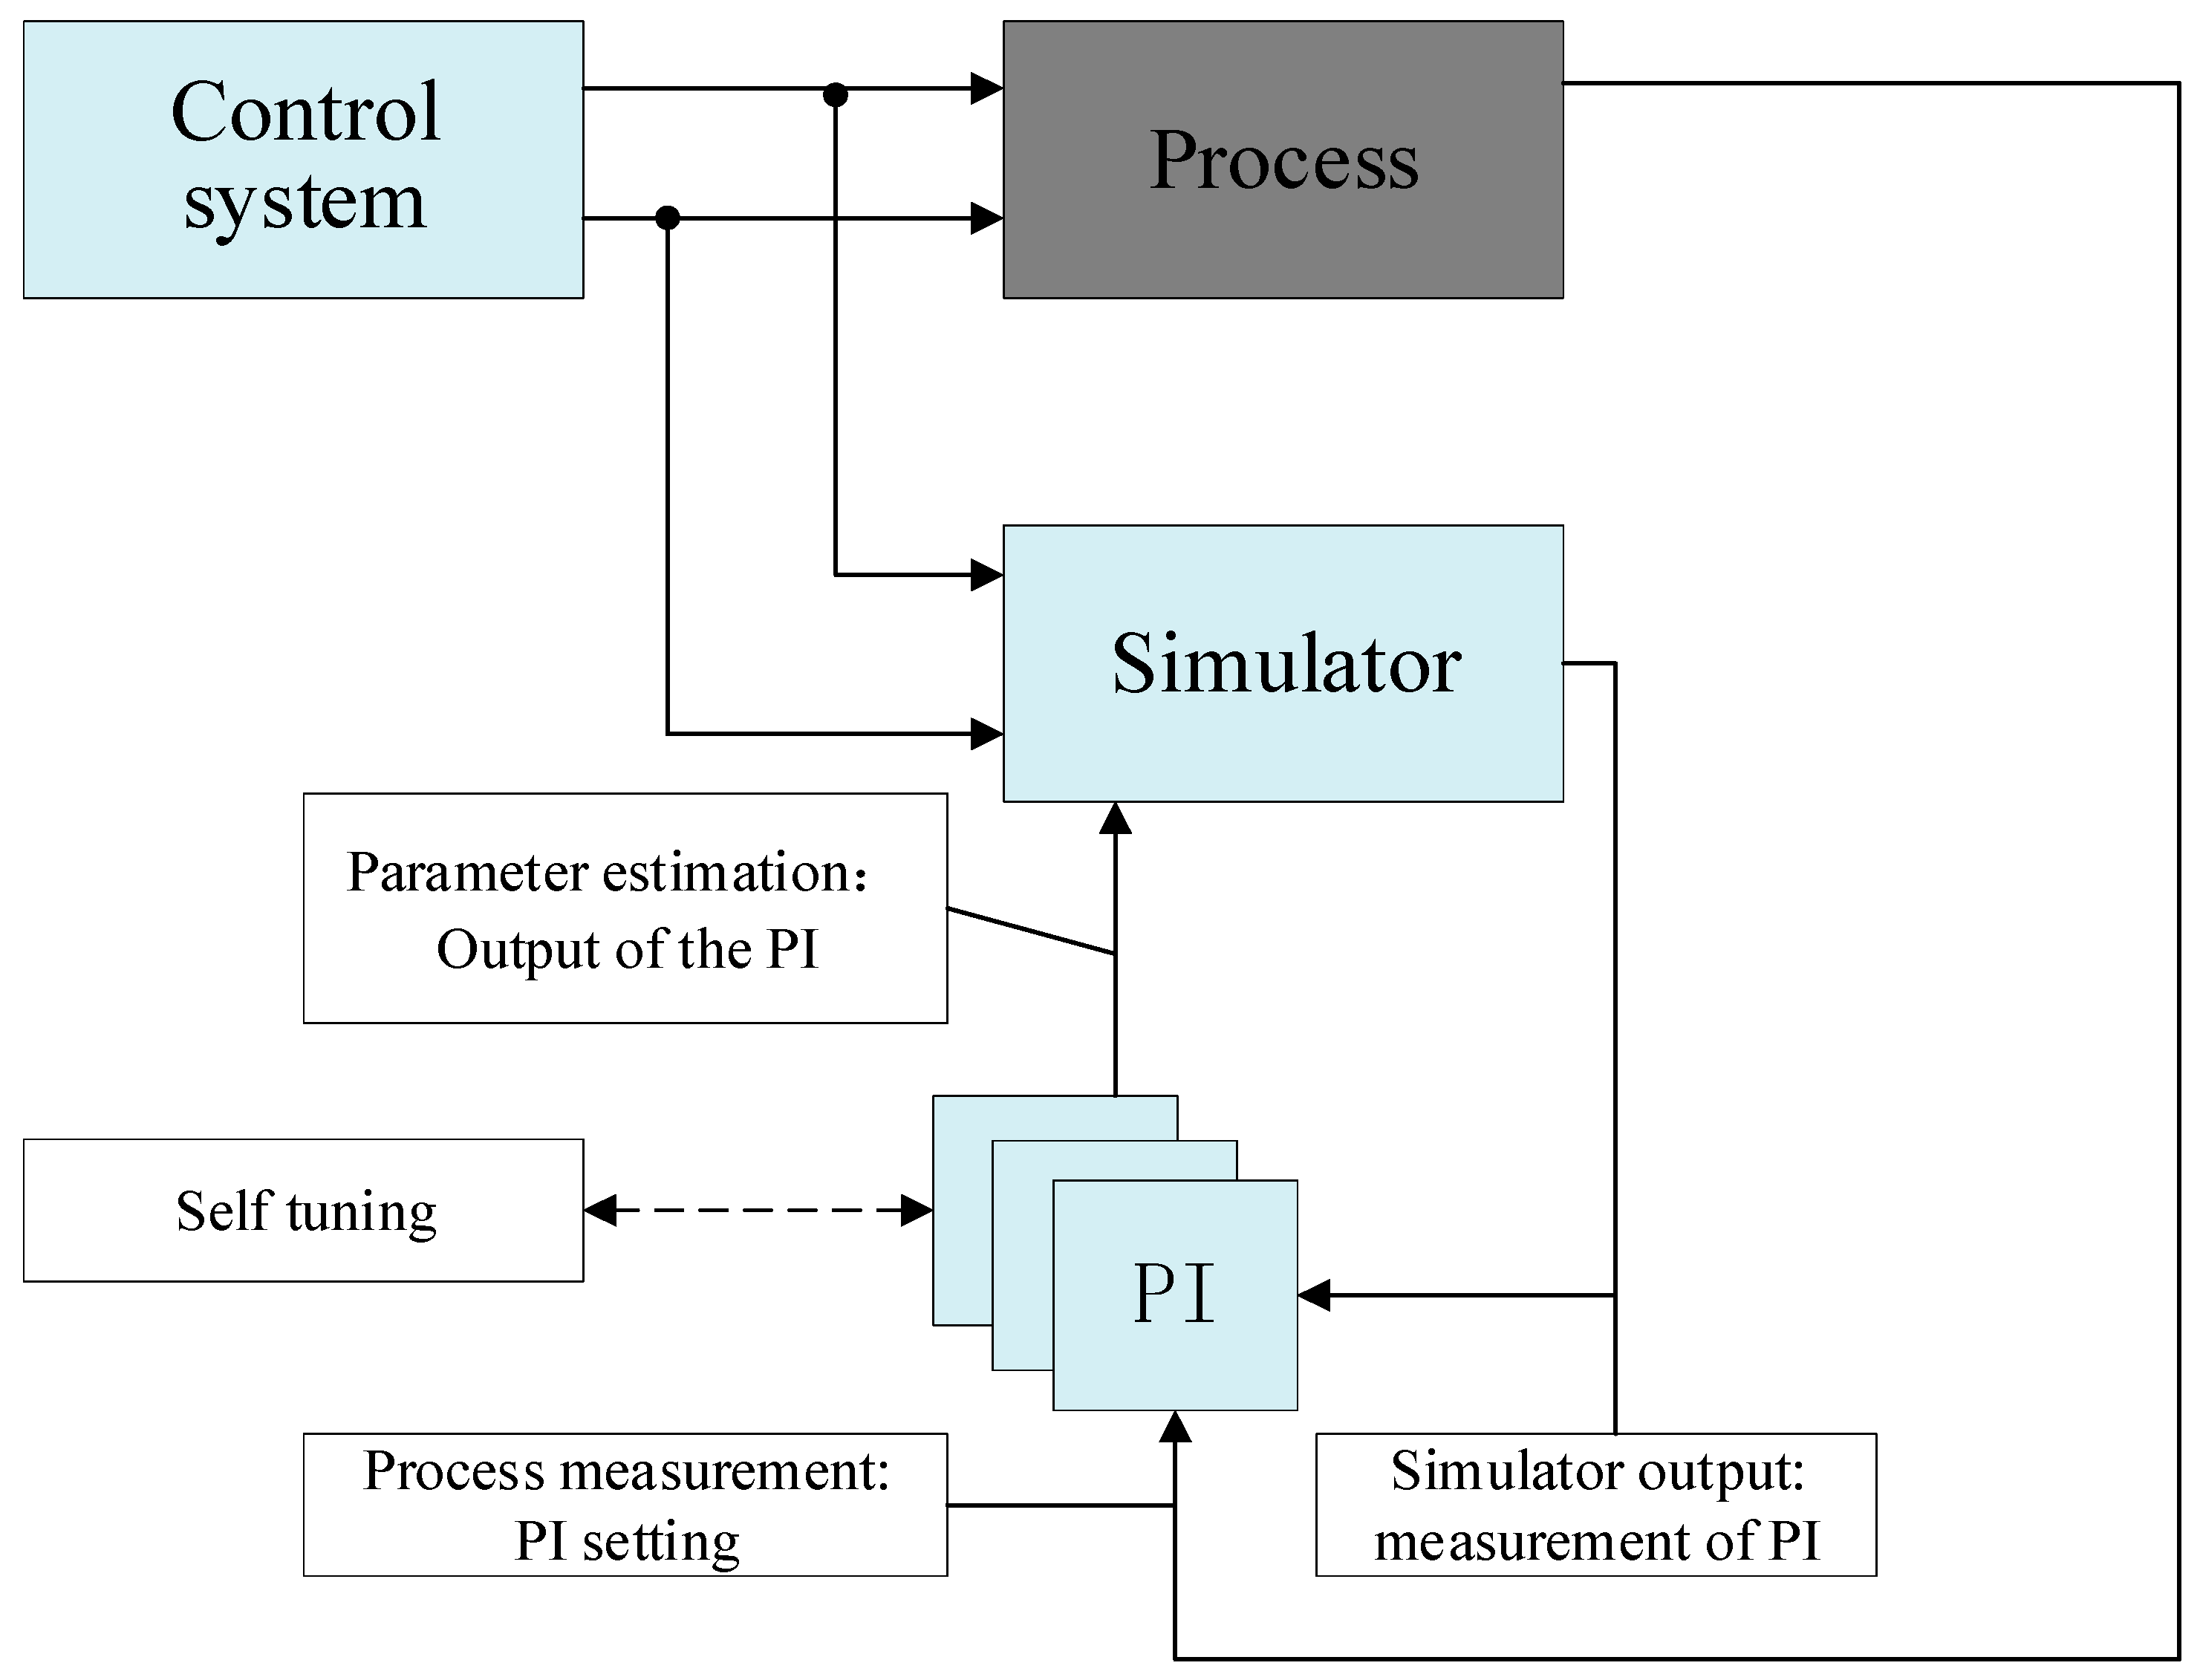
The tracking simulator is a real-time running simulator, which corrects its parameters by comparing the actual process measurement with the simulator output. Neither static nor dynamic models can adapt their characteristics to real physical processes, but the tracking simulator has this ability because of its integrated update mechanism. The tracking simulator is usually used for state estimation of the nonlinear process model (simulation model). In this paper, the PI control algorithm is used to update the parameters.
One way to estimate the state of a process is to run the simulator in parallel with the process. The input of the process is connected to the simulator. However, through this connection, the output of the process and the simulator are usually divergent due to unknown or changing parameters. In order to overcome this difficulty, a tracking simulator is used. The tracking simulator is a real-time running simulator, which is parallel to the process. It uses the process measurement to update its state and parameters, so that the simulator output and process measurement converge. The connection with the PI controller terminal is as follows: the process measurement is connected to the PI setpoint; the simulator output is connected to the PI measurement; the estimated parameter is the PI control signal (
Figure 2).
The tracking variables of the boiler tracking simulation system are the main steam pressure, main steam temperature, reheat steam pressure, and reheat steam temperature. According to the conclusions in the previous section, the control variables of the tracking simulation system are mainly the shape loss coefficient of the steam pipe, the heat transfer coefficient of the superheater, the shape loss coefficient of the reheated steam pipe, and the heat exchanger coefficient of the reheater. This paper designs an online tracking mechanism based on the PI control algorithm for the above tracking variables and control variables, which can adjust the model parameters in real time to maintain the accuracy of the model. Adjust the ‘control variables’ to reduce the difference between the subsequent measurement output (
ymes) and the simulation output (
ysim). The online tracking mechanism is shown as Equation (9) [
13].
The PI controller is used to automatically update the model parameters. The online tracking simulation system established in this paper consists of three PI controllers, each of which is an input-single-output controller based on the PI control algorithm. The deviation between the
ymes and the
ysim of the tracking variable is the input of the PI controller, and the output of the PI controller is the updated model parameter. The PI controller is built on the MATLAB\Simulink platform. The input and output of the controller are read and written to the Apros platform through OPC (Object Linking and Embedding for Process Control) communication technology.
Kp is the proportional coefficient,
Ki is the integral coefficient, ΔΛ represents the change of output value, and Λ(
t) represents the output value of the PI controller at time
t.
The PI controller is connected as follows: the output of the actual process, usually the process measurement (controlled and uncontrolled), is connected to the PI controller set point; the output of the simulator (corresponding process measurement) is connected to the measurement point of the PI controller; the output (control value) of the PI controller is connected to the model with new parameters. One disadvantage of the data update mechanism is that it requires two parameters instead of one. However, since we have described the tracking simulation problem as a control problem that can be solved by decentralized PI control, automatic tuning can be used instead of manual parameter selection.
Assuming that the model has matched the real process, the tracking simulator can be implemented as follows: the known process input is connected to the simulator; the selected unknown inputs/parameters are connected to the PI controller; all PI controllers are in manual mode, and the output is the important parameters that affect the system characteristics obtained from the global sensitivity analysis; each PI controller measurement point is connected to the simulator output, and the PI controller set point is connected to the corresponding process measurement parameters; due to the interaction between control loops, some PI controllers may need to be readjusted.
3.3. Expansion of the IC Database
In the online tracking stage, the PI controller is used to automatically adjust the model parameters to achieve the goal of tracking. After the tracking is completed, the model and the site reach a consistent state. In the offline preparation stage, several measures were taken to ensure that the model state was roughly consistent with the site before starting tracking. If there is a big difference between the two, it will bring much trouble to the subsequent online phase. The most important part of the offline measures is the selection of initial conditions, because this is the basis of the offline preparation stage. Other measures are aimed at correcting the initial conditions. If the initial conditions and field data selected are very moderate, other measures in the offline preparation phase can be omitted, which will bring great convenience to the construction and startup of the entire system. The original IC database is built according to the design working conditions of the boiler, and the number is very limited. Moreover, there is easy deviation between the design working conditions and the actual operating conditions, so other measures in the offline preparation stage are very necessary. Now, the system is in the online phase, and the system status is always matched with the field data, which provides conditions for the expansion of the IC database. After each tracking mechanism is completed, the current state of the system is saved and added to the IC library. Over time, the number of IC libraries has been greatly supplemented, and the IC saved in this process is more consistent with the field data. This provides a solution to the problem that the initial conditions of the system are too different from the field data, and greatly simplifies the offline preparation during the restart of the online tracking system.
4. Simulation and Analysis
In this paper, the 660 MW USCFB is built on Apros platform. On the basis of this model, the online tracking simulation system of the 660 MW USCFB is established. The simulation experiment is carried out under a 100% BMCR working condition to test the tracking ability of the tracking simulation system to the analog signal.
The simulation experiment is designed under a 100% BMCR working condition. The tracking simulation experiment of main steam pressure, main steam temperature, and reheat steam temperature is shown in the
Figure 3,
Figure 4 and
Figure 5. First of all, the step analog signal is set as the field signal to simulate the main steam pressure. At the 500 s, the main steam pressure decreases by 3%; at the 1500 s, the main steam pressure decreases by 3%; and at the 2500 s, the main steam pressure returns to the initial value. The designed tracking simulation simulator starts to act at the 500 s, automatically adjusts the flow resistance coefficient to reduce the main steam pressure, and finally tracks the analog signal. The process at the 1500 s is consistent with the previous process. In the 2500 s, the main steam recovers to the initial value, which is a large step. The tracking mechanism can still quickly complete the automatic adjustment of model parameters, and quickly eliminate the deviation between the model simulation values and analog signals. The settings of the main steam temperature and reheat steam temperature tracking simulation experiment and the main steam pressure tracking simulation experiment are consistent. The results show that the designed tracking simulation mechanism can track the analog signal stably and rapidly, as shown in
Figure 3,
Figure 4 and
Figure 5.
The simulation test of the step signal tracking simulation is set up. Tracking variables are the main steam pressure, main steam temperature, and reheat steam temperature.
Figure 1 represents the tracking simulation results of the main steam pressure. At the 500 s, the signal of the main steam pressure decreases by 5% in a step manner. The tracking algorithm automatically adjusts the shape loss coefficient of the main steam pipe (R
HTS). The steam pressure decreases with the decrease of R
HTS. At about the 1000 s, the simulated value of the main steam pressure and the analog signal coincide. At the 2500 s, the signal of the main steam pressure increases to the initial value in a step manner. The tracking simulation system can still track the analog signal very quickly. In this action, the overshoot of the main steam pressure is relatively large because the step amplitude is twice as large as before.
Figure 4 represents the tracking simulation results of the main steam temperature. The simulation value has a violent oscillation under the action of the PI controller, and then tends to be stable, because the inertia of temperature is larger than that of pressure.
Figure 5 represents the tracking simulation results of the reheat steam temperature.
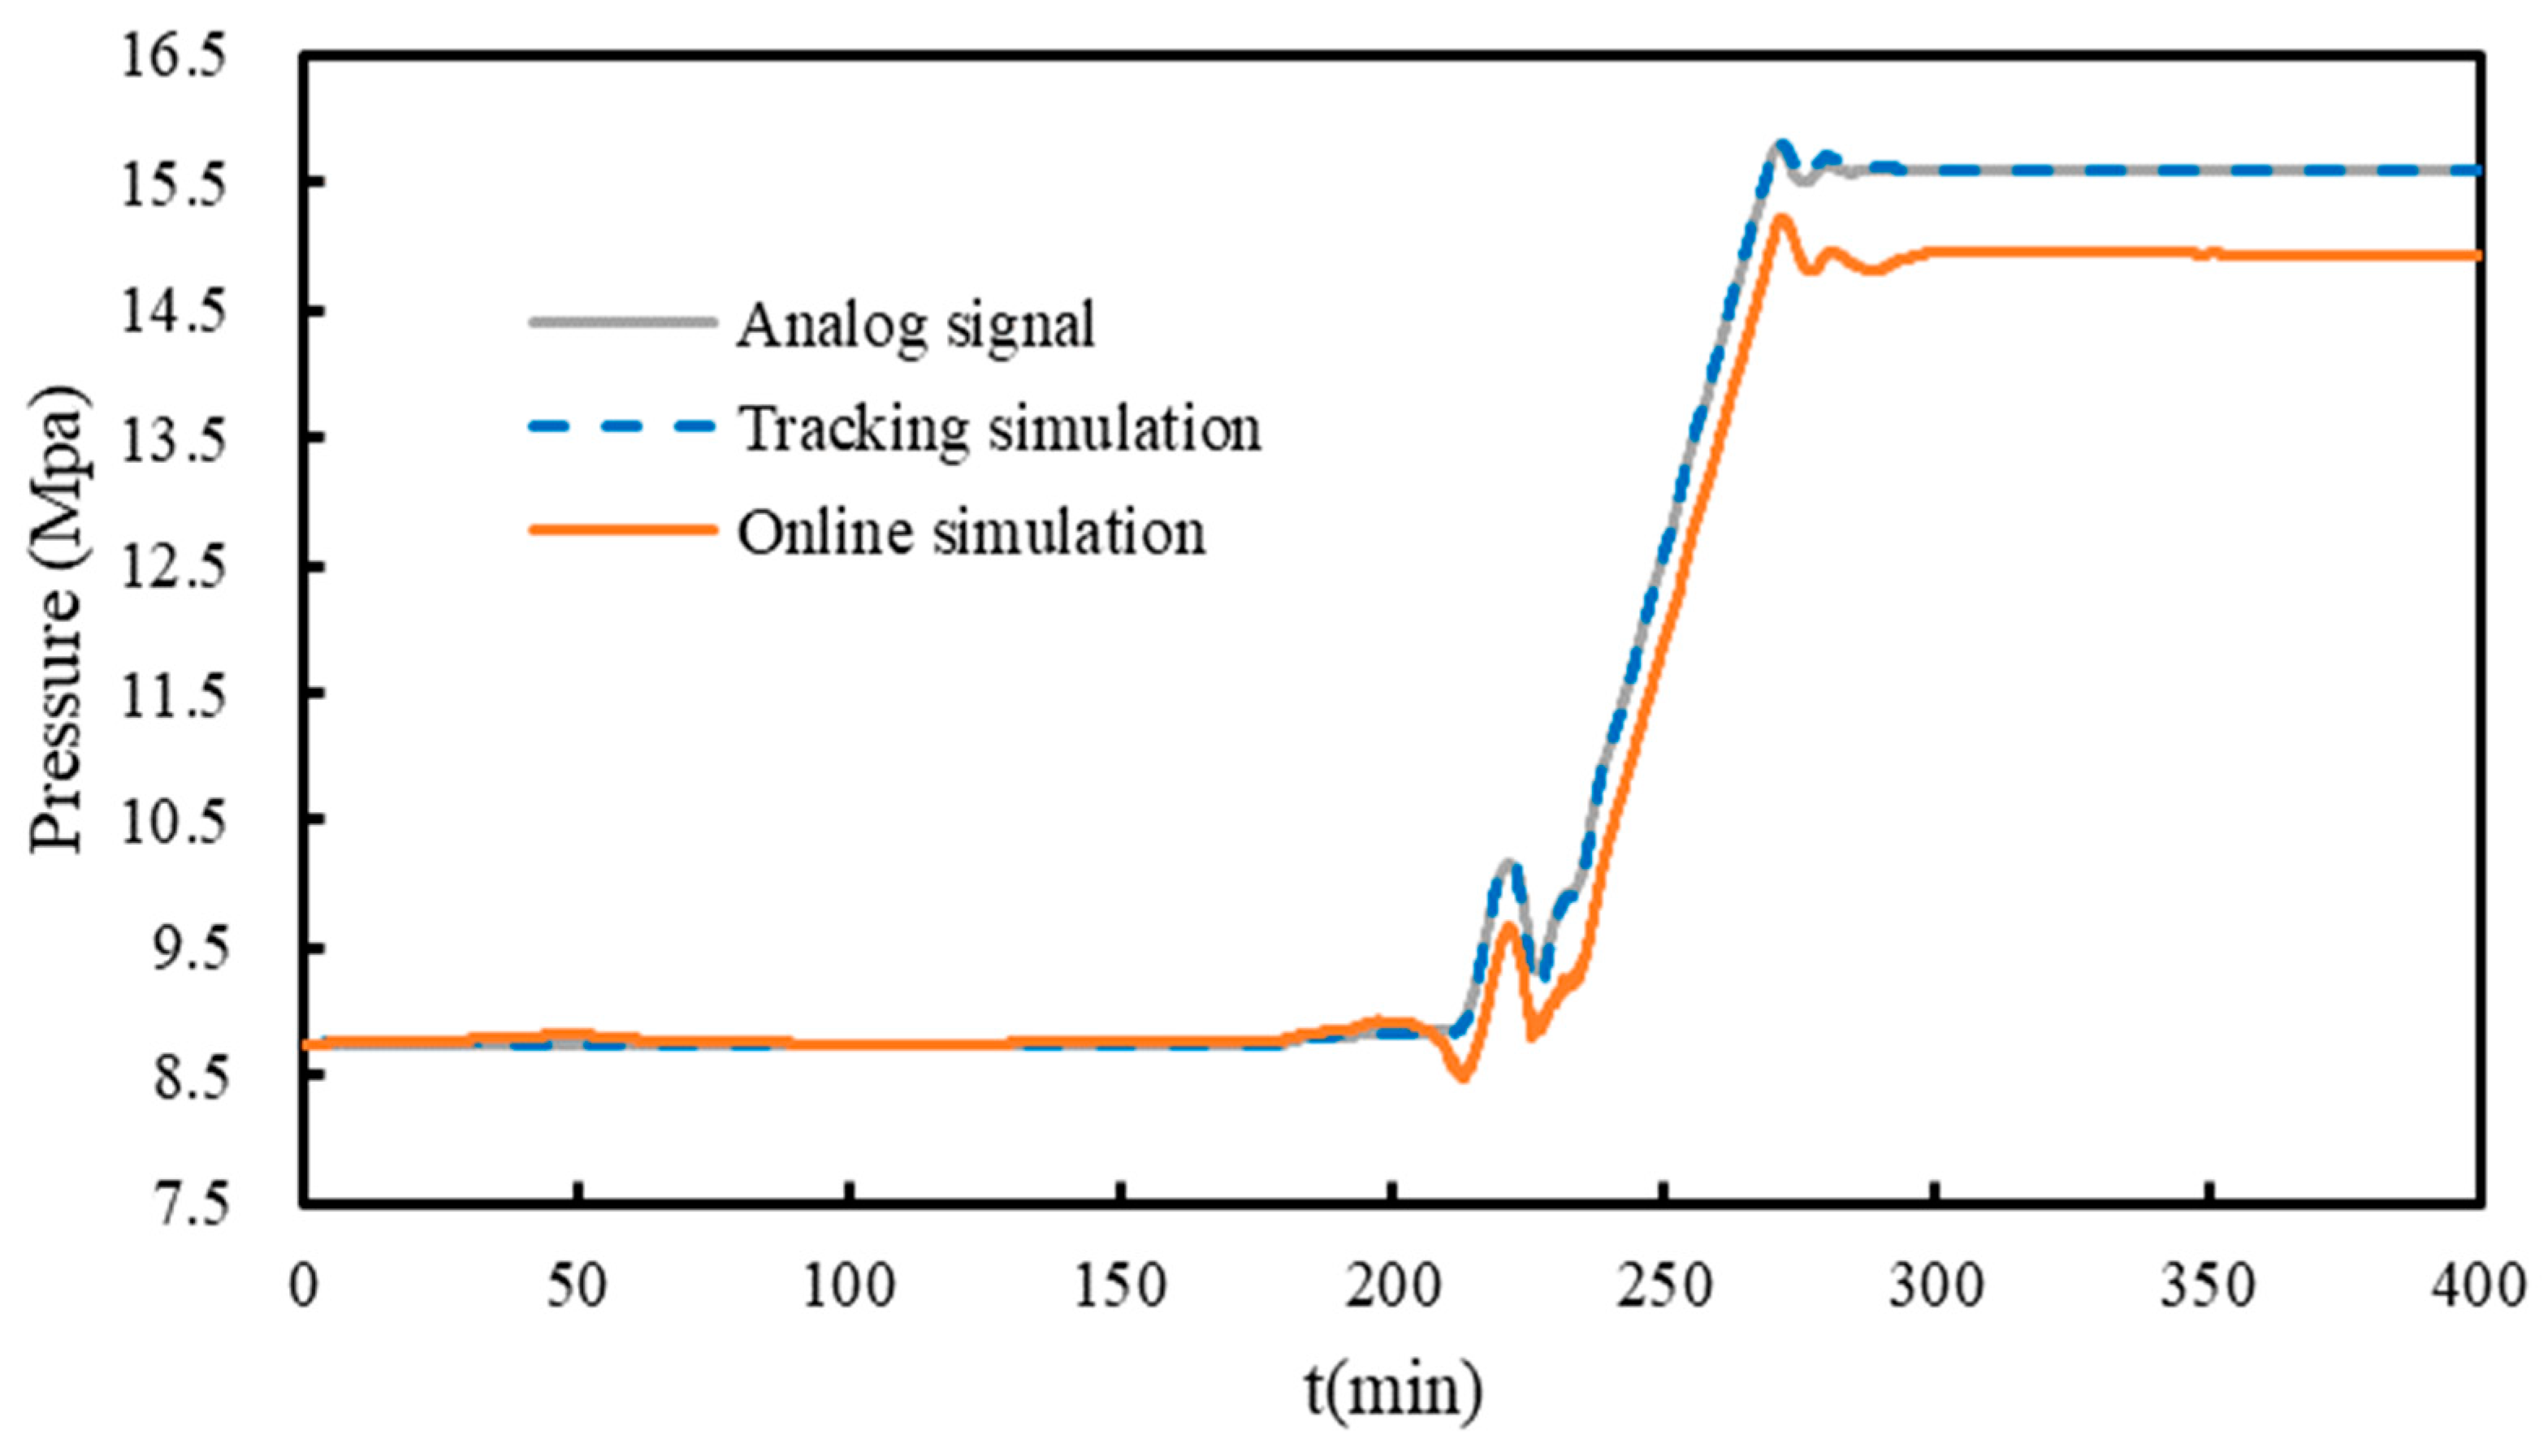
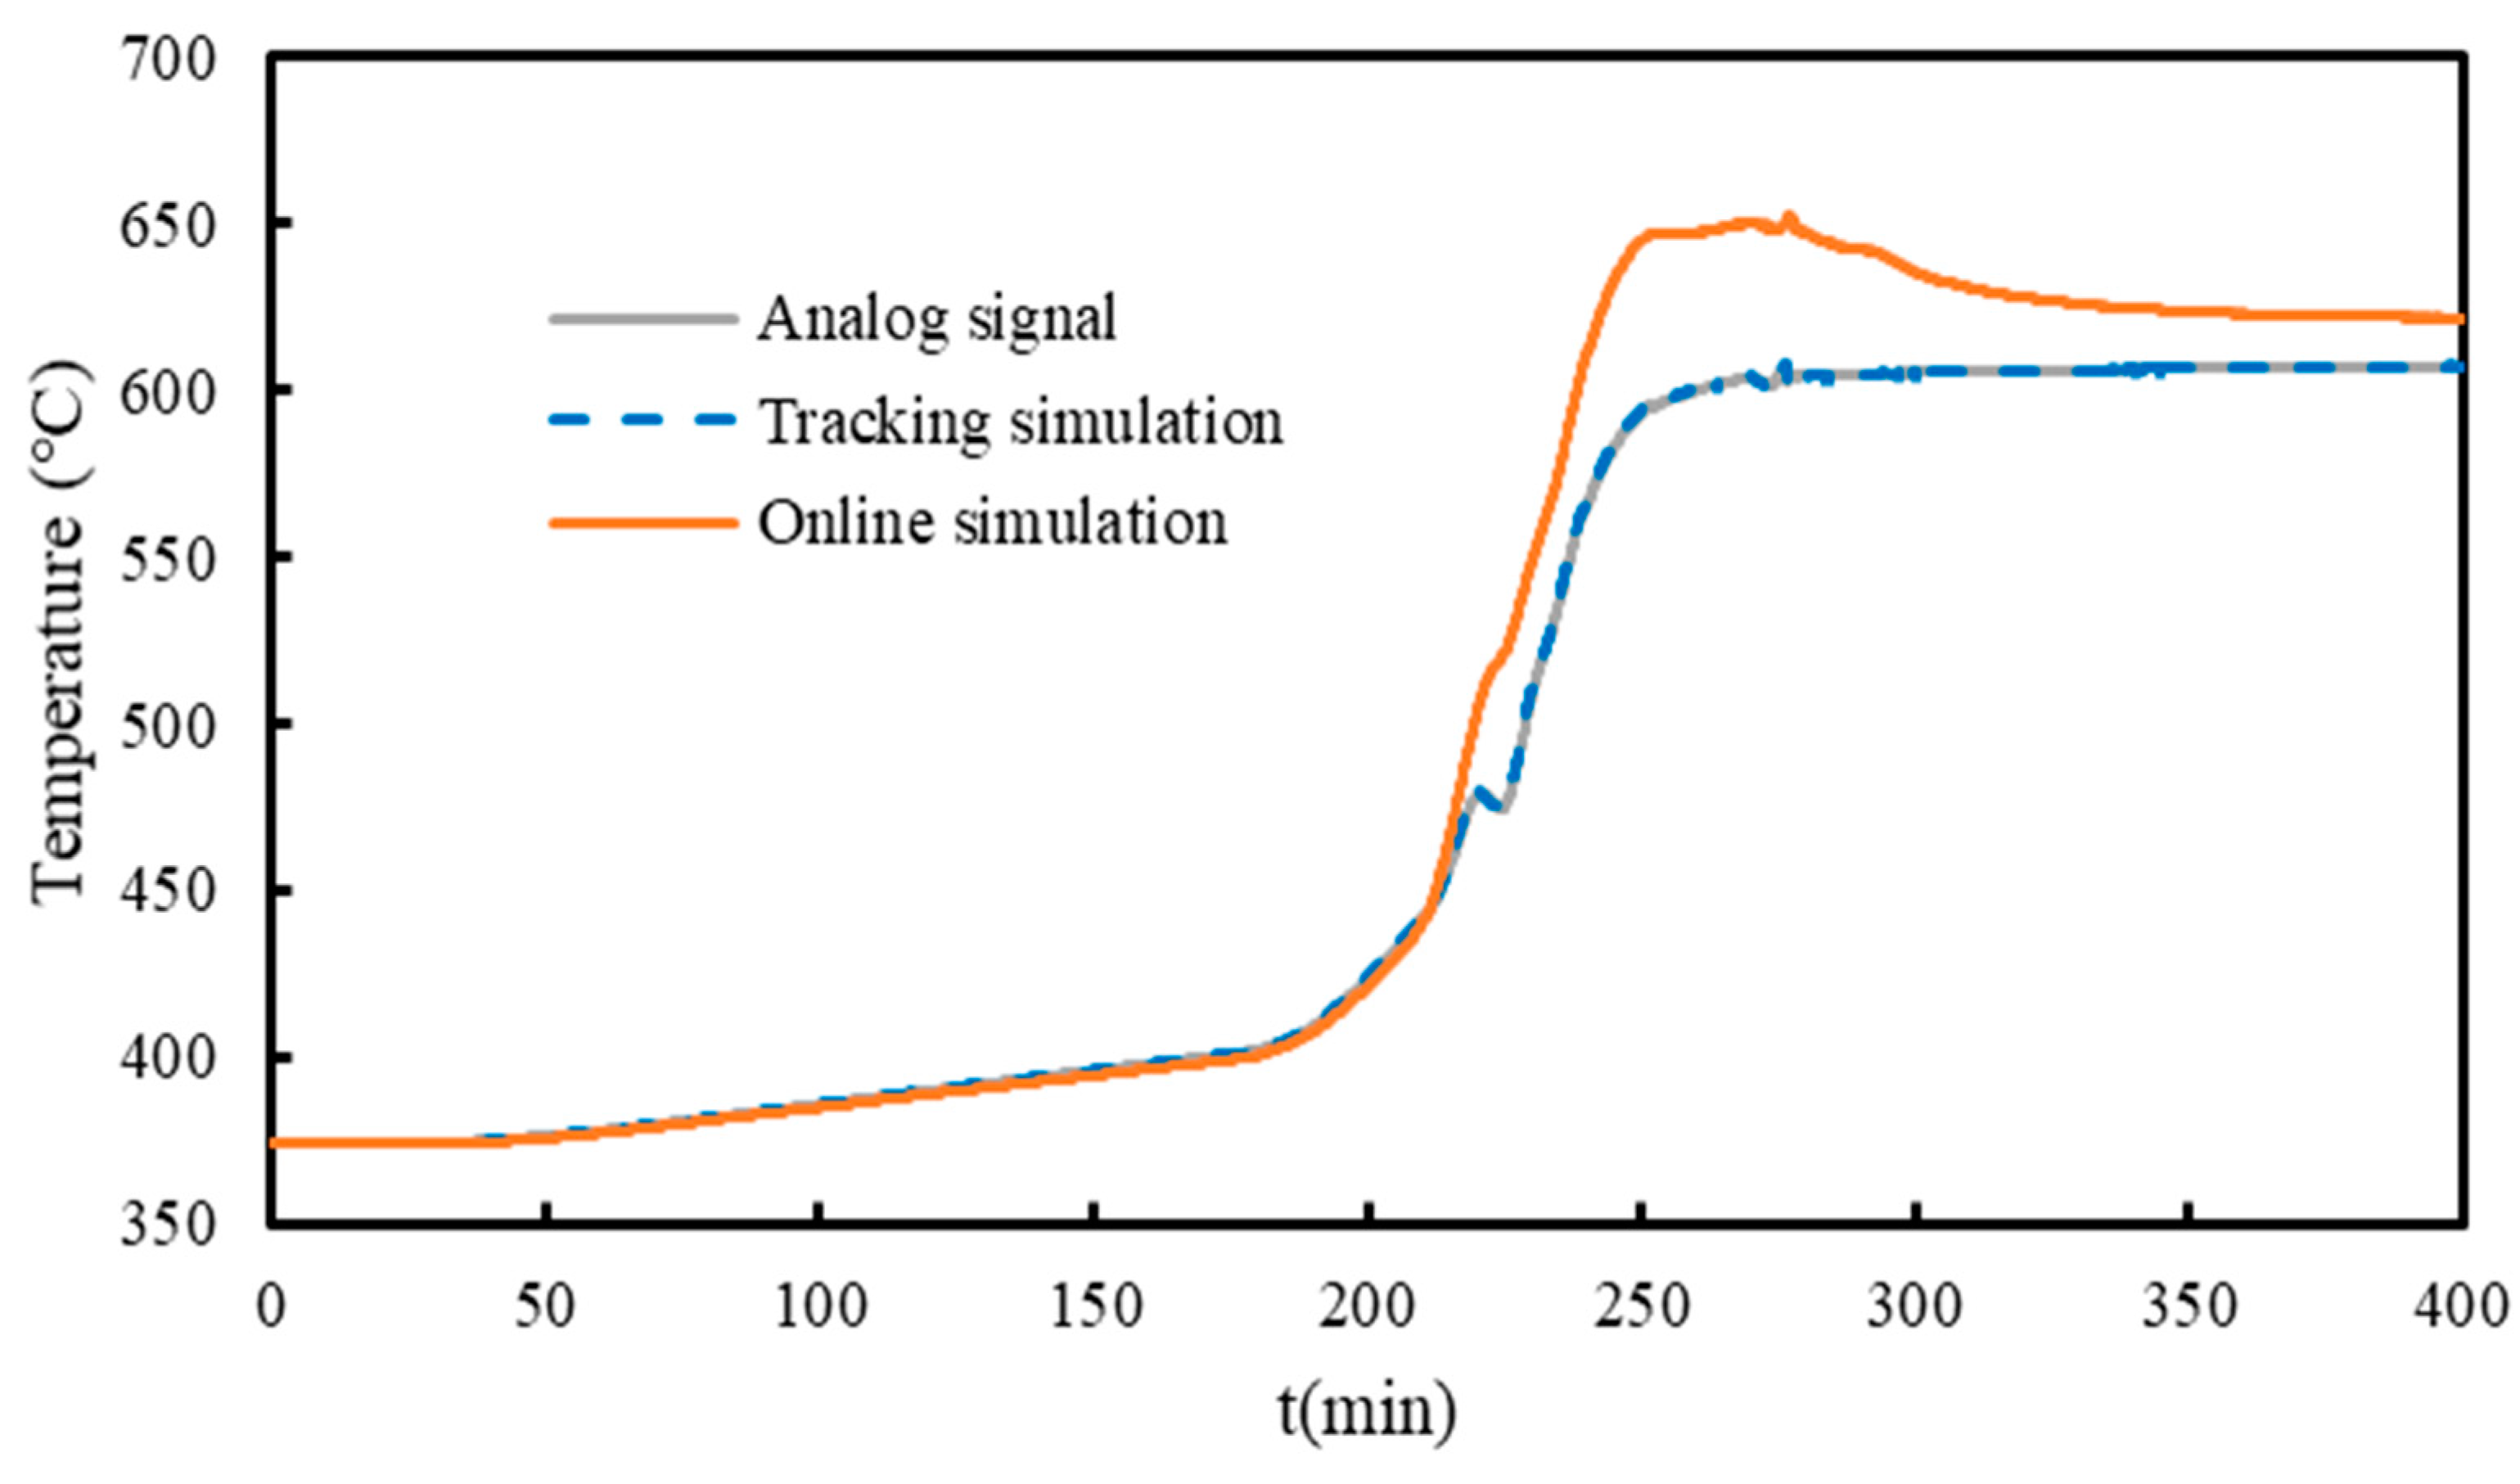
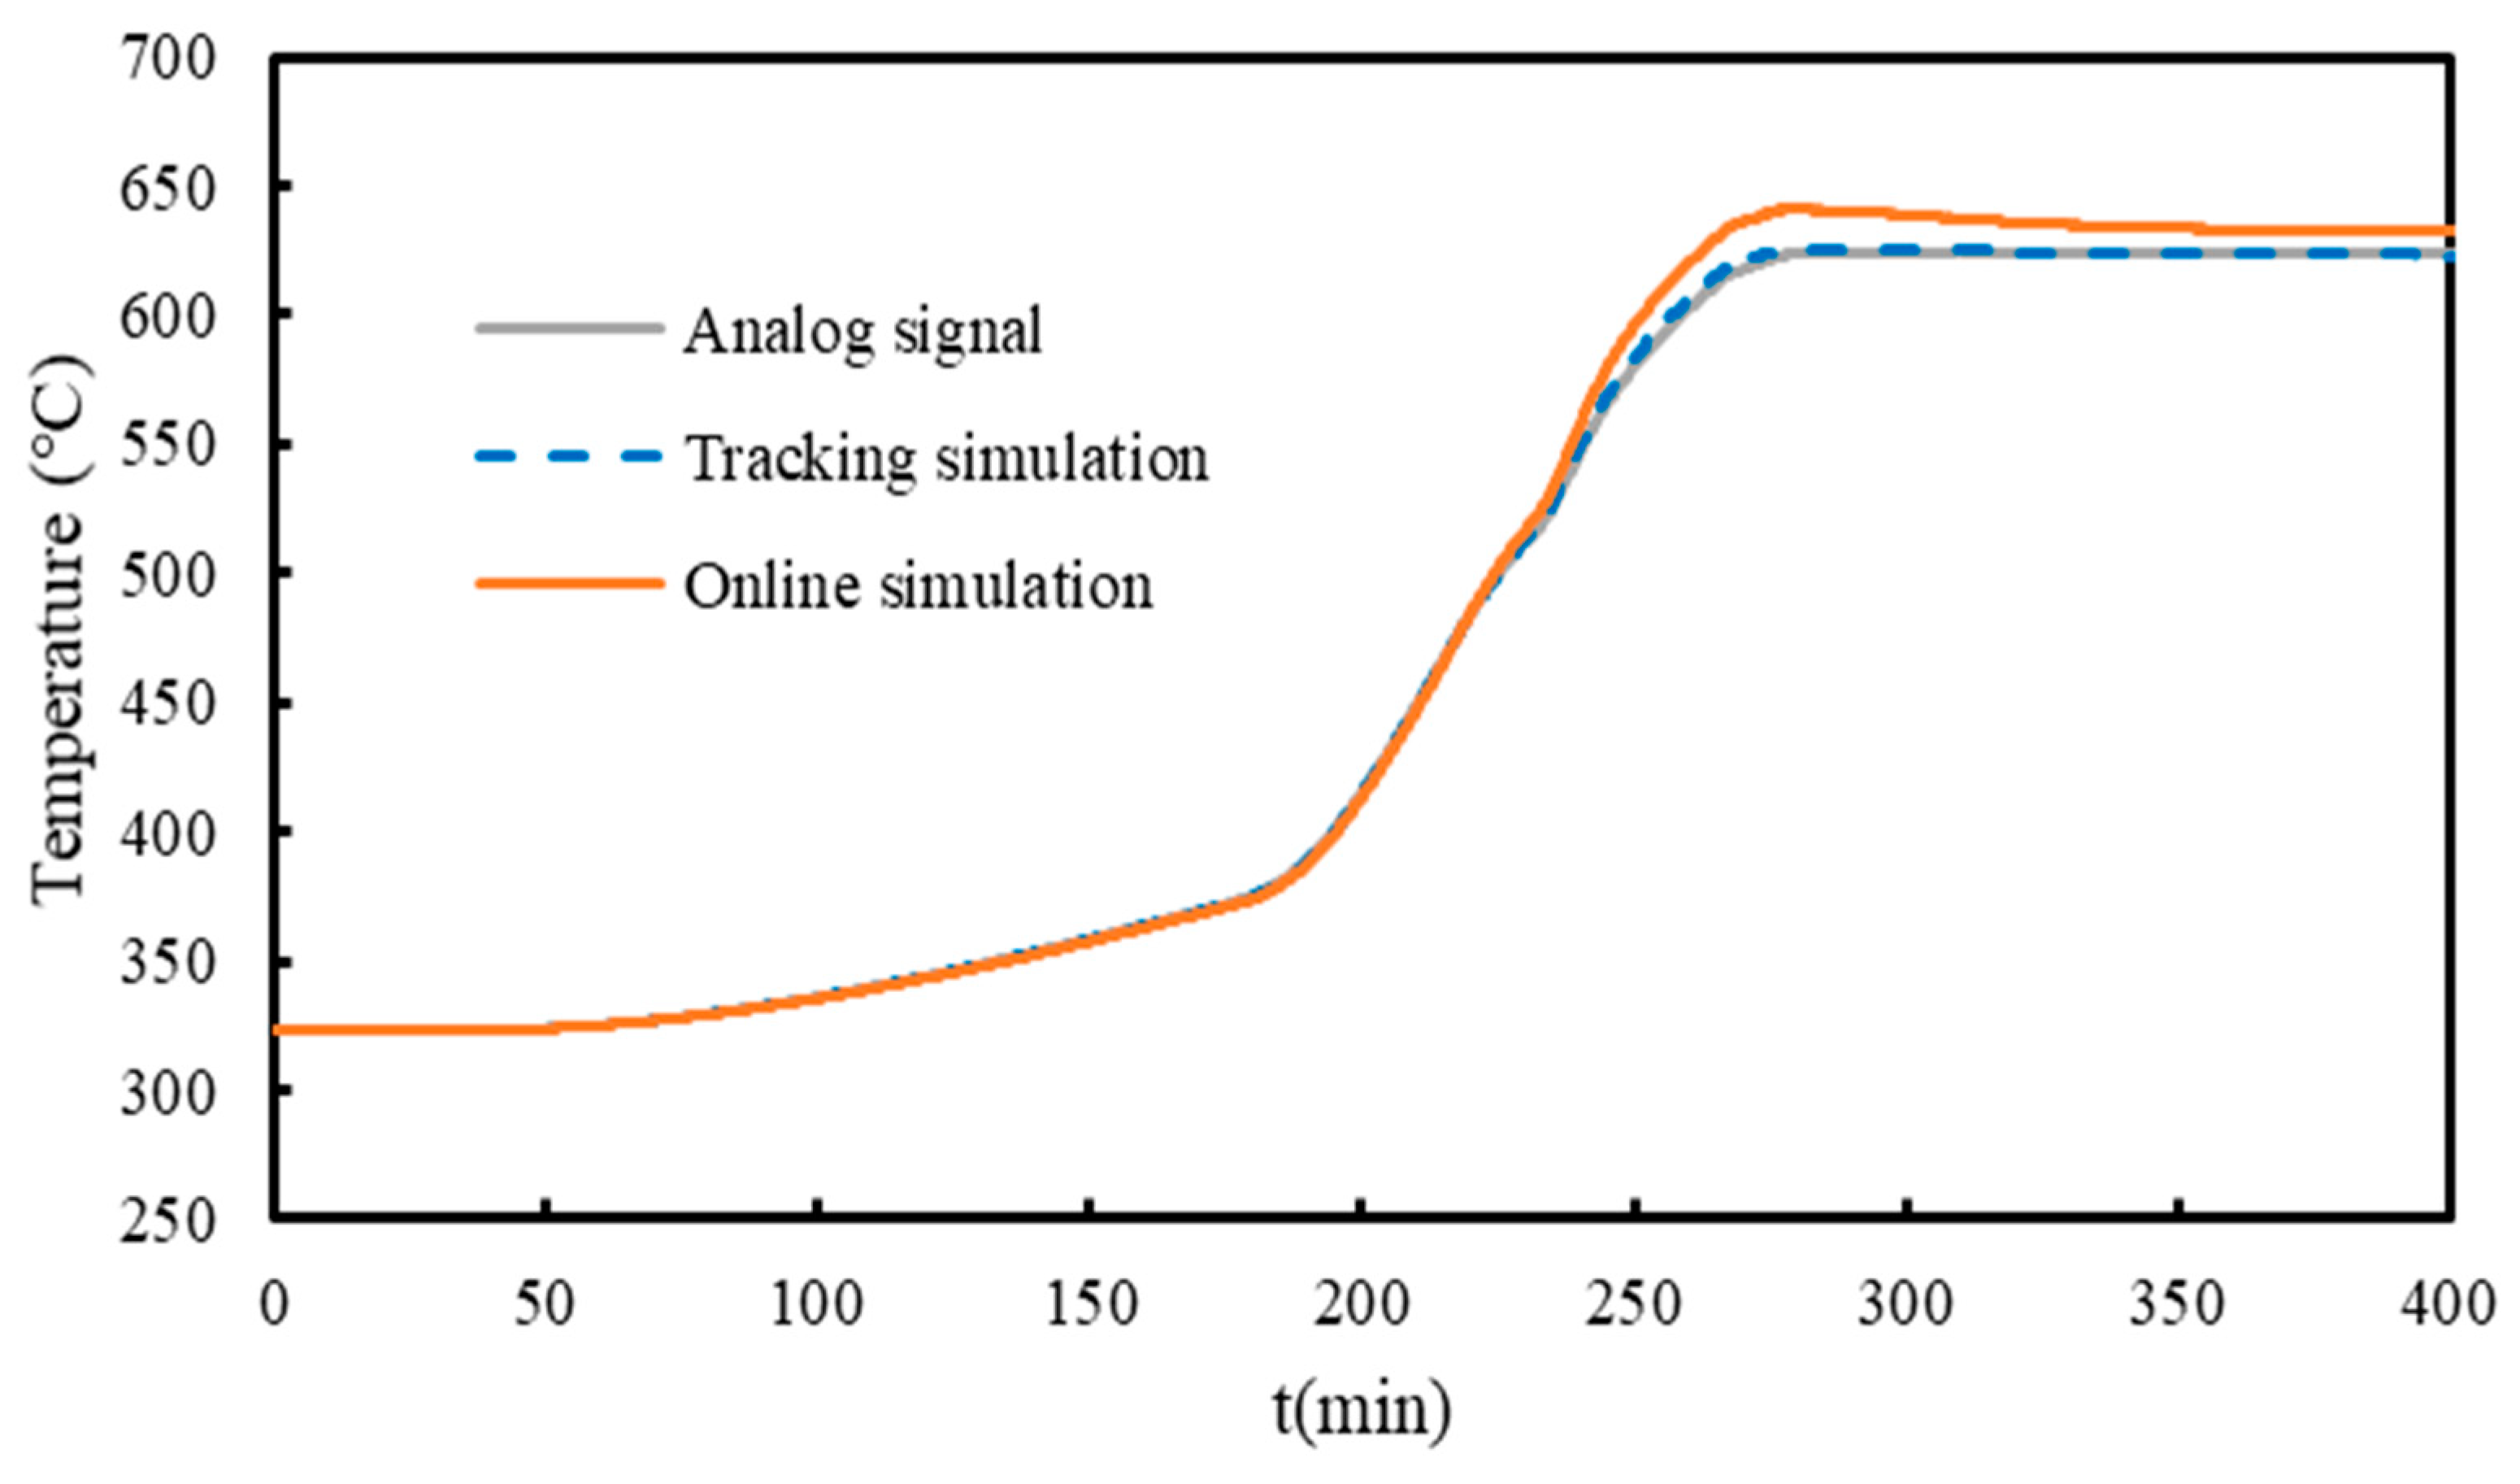
The power plant is under construction, so experimental data cannot be used as an analog signal at this stage. In view of this situation, the author added a tracking simulation test of the cold start process. This analog signal is set according to the start curve and design parameters of the boiler system. During the cold start-up process, the main steam pressure stabilized at 8.73 MPa in the first 200 min, then increased to 15.65 MPa after 50 min, and the main steam temperature increased from 374 °C to 608.02 °C, while the reheat steam temperature increases from 322.98 °C to 625.23 °C, as shown in
Figure 6,
Figure 7 and
Figure 8.
The main steam pressure has hardly changed in the first 200 min. At the early stage of the cold start process, the main steam state will undergo a dry and wet transition process. The steam–water separator will play a role in this process, and the state of the main steam is saturated water vapor. Thus, the main steam pressure will remain basically constant during this period. After that, the main steam pressure experienced a rapid rise and finally stabilized at 15.65 MPa. For the main steam temperature, the main factor that causes the error between the simulated value and the measured signal is the heat transfer coefficient and the main steam flow. Therefore, in the control trial, the deviation of the main steam pressure led to the deviation of the main steam flow, and then the deviation caused by different heat transfer coefficients, thus the deviation of the main steam temperature in the control trial was larger. The simulation results show that the tracking simulation accurately tracks this process. The control trial is carried out when the tracking algorithm is turned off. The online simulation cannot automatically update the model parameters, and the model simulation results will deviate from the signal.
5. Conclusions
In this paper, the implementation strategy of the online tracking simulation system is studied, and an online tracking simulation system is established for the 660 MW USCFB. At the present stage, the establishment of the initial condition database and the energy quality compensation in the case of the closed loop system are studied, and the necessity and implementation methods of the mass and energy compensation are analyzed. In the online phase, the selection methods of tracking variables and control variables are studied. The tracking variables are globally sensitive based on the Sobol algorithm, and the model parameters that are most sensitive to the tracking variables are selected. An online tracking simulation system based on the PI controller is established; then, the tracking simulation tests of the analog step signal under a 100% BMCR working condition and the cold start process are carried out. The step signal is very nonlinear and changes steeply; for a system, if it can meet the requirements under the action of the step signal, it can also meet the requirements under the action of other signals. The simulation test of tracking the simulated signal of the cold start process is closer to the real working condition. The simulation results show that the online tracking simulation system established in this paper can quickly track the analog signal, automatically adjust the model parameters, and eliminate the deviation between the model simulation value and the measured signal. The online tracking simulation system, based on the lumped parameter model, realizes the zero-dimensional digital twinning technology of the USCFB system, lays a solid foundation for the research of three-dimensional digital twinning technology, realizes the online detection of the ultra-supercritical circulating fluidized bed boiler system, and provides a reliable verification platform for advanced control algorithms and control strategies.


