Article

Investigating the Influence of Pore Shape on Shale Gas Recovery with CO2 Injection Using Molecular Simulation

1
National Key Laboratory of High-Efficiency Flexible Coal Power Generation and Carbon Capture Utilization and Storage, Huaneng Clean Energy Research Institute, Beijing 102209, China
2
Institute of Technology for Nanostructures, University Duisburg-Essen, 47057 Duisburg, Germany
3
Huaneng Daqing Thermal Power Co., Ltd., Ranghulu District, Daqing 163159, China
*
Author to whom correspondence should be addressed.
Energies 2023, 16(3), 1529; https://doi.org/10.3390/en16031529
Submission received: 27 December 2022 / Revised: 21 January 2023 / Accepted: 25 January 2023 / Published: 3 February 2023
(This article belongs to the Special Issue Research on Thermo-Chemical Conversion Processes)

Abstract

:
Carbon-dioxide-enhanced shale gas recovery technology has significant potential for large-scale emissions reduction and can help achieve carbon neutrality targets. Previous theoretical studies mainly focused on gas adsorption in one-dimensional pores without considering the influence from the pore geometry. This study evaluates the effects of pore shape on shale gas adsorption. The pure and competitive gas adsorption processes of CO2 and CH4 in nanopores were investigated using molecular simulations to improve the prediction of shale gas recovery efficiency. Meanwhile, quantitative analysis was conducted on the effects of the pore shape on the CO2-EGR efficiency. The results indicate that the density of the adsorption layer in pores is equally distributed in the axial direction when the cone angle is zero; however, when the cone angle is greater than zero, the density of the adsorption layer decreases. Smaller cone-angle pores have stronger gas adsorption affinities, making it challenging to recover the adsorbed CH4 during the pressure drawdown process. Concurrently, this makes the CO2 injection method, based on competitive adsorption, efficient. For pores with larger cone angles, the volume occupied by the free gas is larger; thus, the pressure drawdown method displays relatively high recovery efficiency.

1. Introduction

To promote China’s transition to low-carbon development and attain “carbon neutrality”, CO2 sequestration technology is a necessity. This technology would significantly contribute to accomplishing large-scale, long-term, safe, and stable, deep CO2 emission reduction. This represents a win–win situation, minimising greenhouse gas emissions whilst boosting the recovery rate of shale gas, since the economic advantages of CO2 injection to boost oil and gas production could compensate for the costs of CO2 sequestration. CO2-enhanced gas recovery (CO2-EGR) technology is currently considered very promising, owing to the large amount of shale gas resources and the huge potential geological CO2 storage capacity of shale reservoirs. Based on assessments of world shale oil and gas resources, the recoverable resources from shale gas would measure approximately 7299 trillion cubic feet (tcf) (World Shale Resource Assessments), whilst the potential geological CO2 storage capacity of the world is estimated at 740 Gt [1]. In CO2-EGR technology, CO2 is injected into a shale reservoir, leading to the shale gas in the pore spaces of the shale rock being replaced by CO2. The injected CO2 can then be stored in shale gas reservoirs for decades to hundreds of years. Although it has been proven that CO2-EGR technology can significantly improve shale gas recovery whilst lowering greenhouse gas emissions [2,3,4,5], it is difficult to conduct in situ experiments investigating the recovery mechanisms, given that shale reservoirs have complex conditions, such as high pressure and temperature, and include a large number of nanopores and natural microfractures [6]. At the nanoscale, the interactions among gas molecules, and between pore walls and gas molecules, become particularly significant. Molecular simulation methods, such as grand canonical Monte Carlo (GCMC) simulations, can be useful tools for studying competitive adsorption behaviour and shale gas recovery mechanisms. These methods can both directly reflect the entire process concerning the nanopores and optimise the shale gas recovery path, to achieve increased efficiency of recovery and CO2 sequestration.
Shale gas is predominantly stored in shale pores, where the proportion of adsorbed gas can be as high as 20 to 85% [7]. Gas adsorption on the shale rock surface is determined by the interactions between the gas and the shale rock. Several variables, such as temperature, pressure, gas composition, shale composition, pore structure, surface properties, and water content, can affect the adsorption properties. Shale is primarily composed of clay minerals and organic matter. Several studies have examined the effects of the mineral composition of shale rocks on CH4 adsorption, with the results revealing a strong positive correlation between CH4 adsorption and the total organic carbon (TOC) content [8,9]. Additionally, shales with higher levels of organic matter showed a stronger capacity for CH4 adsorption [8,9,10,11]. Zhang et al. [11] performed experiments to investigate CH4 adsorption in different shale samples. Their experimental results showed that the maximum Langmuir adsorption of CH4 was positively correlated with the TOC content of shale. Two main factors may have accounted for this. Firstly, organic matter in shale reservoirs was the primary source of shale gas and was able to produce hydrocarbons. Secondly, when hydrocarbons were produced, organic matter created many nanoscale pores, which provided the sufficient surface area and pore volume for methane adsorption [12,13]. In general, the TOC content is one of the most important factors affecting shale gas adsorption [11].
Using density functional theory and GCMC simulations, Kurniawan et al. [14] used graphitic slit pores to simulate the organic nanopores in shale reservoirs and studied the adsorption characteristics of methane and its influencing factors. CH4 density distributions were investigated in graphene slits at 318.15 K, and at pressures ranging from 0.1 to 10 MPa. According to the density profiles of the graphene slit pores, CH4 molecules can be divided into adsorption and free states. Sun et al. [15] used graphitic cylindrical pores to investigate the impact of kerogen type and pore size on the flow behaviour of CH4. These simulation results indicated that smaller pores had a stronger affinity for methane and that type III kerogen showed the highest adsorption capacity when compared to type II and type I kerogens.
The CO2/CH4 competitive adsorption properties in nanopores have also been widely studied to improve the effectiveness of CO2-EGR technology. Kurniawan et al. [14] investigated CO2/CH4 competitive adsorption in graphene slit pores, using GCMC simulations, and their results showed that the interaction between CO2 and graphene was stronger than that between CH4 and graphene. Furthermore, Zeng et al. [16] simulated the CO2/CH4 competitive adsorption in organic slit pores and cylindrical pores under pressures of 5–50 MPa and temperatures of 300–360 K. In these cases, the CO2 adsorption was always stronger than CH4. Jessen et al. [17] compared the mechanisms of adsorption and desorption of different gas molecules and their mixtures in coal using both experiments and simulations and, subsequently, developed a one-dimensional gas–solid model to explain the experimental results and trends.
Methane adsorption in carbon nanotubes (CNTs) was also investigated using simulations of molecular dynamics, and equations of state for the adsorbed methane molecules were developed [18]. Yuan et al. [19] further studied the effect of the multi-walled CNT radius on methane adsorption and desorption and found a relationship between the pore radius and methane desorption efficiency. Shale rock is dense, heterogeneous, and complex, with pore structures in a range of nanometres and micrometres [20]. Previous research has focused on gas adsorption through one-dimensional pores, such as graphene and CNTs, without considering the influence of pore geometry of other types on the processes of gas adsorption and desorption.
In this study, atomic-level molecular simulations were conducted to examine the pore-shape effects on shale gas adsorption. The effectiveness of the conventional pressure drawdown and CO2 injection methods for methane desorption was compared, and the impact of the pore shape on this process was further discussed. Corresponding solutions to shale gas recovery were proposed for different application scenarios.

2. Methods

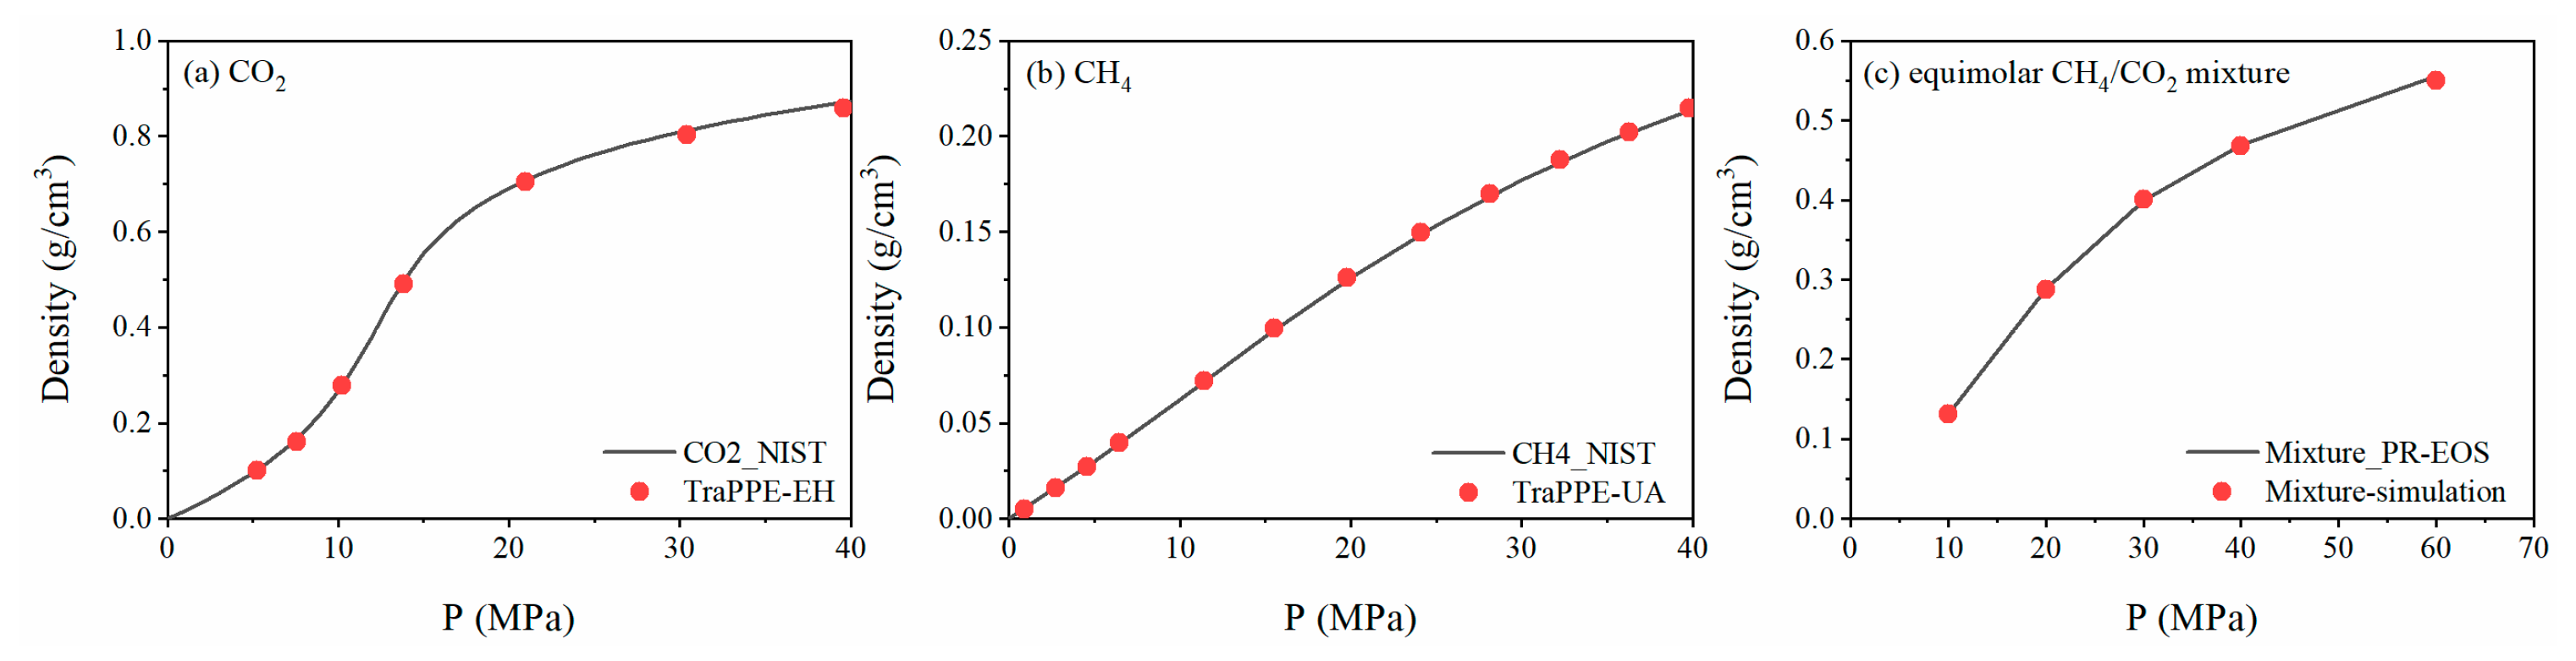
2.1. Simulation Methods

Pores and fractures in shale are intricate and complex, especially considering that shale rocks contain pores of different shapes, such as parallel-plate-shaped, wedge-shaped, or cylindrical pores [21]. Cylindrical pores with two ends open represent a typical pore type in shale [22,23,24]. In this study, cylindrical organic shale nanopores were simulated using CNT structures and heterogeneous pores with one large and one small end, constructed using carbon nanocones (CNCs). The effects of the shape of shale pores on CH4 adsorption and CH4 recovery with CO2 injection were then investigated by altering the cone angle of the CNCs. CO2 molecules were treated as rigid with the TraPPE-EH force field [25]. CH4 molecules were modeled with the TraPPE-UA force field [26]. The atom–atom interaction was calculated as:
E = E ij + E Coul
E ij = 4 ε i j [ ( σ i j r i j ) 12 ( σ i j r i j ) 6 ]
E Coul = 1 4 π ε 0 q i q j r i j
where i and j denote the atomic numbers; r i j denotes the atomic distance; σ i j is the zero-potential distance; ε i j denotes the LJ potential well depth, and ε 0 is the electrostatic constant. The force field parameters for CH4, CO2, and the C atoms of the CNTs and CNCs [27] are listed in Table 1. Interactions between dissimilar atoms followed the Lorentz–Berthelot (LB) mixing rule [28].

2.2. Simulation Setup

According to Zhu et al. [18], an optimal CNT diameter is present when it maximises adsorption as a result of the competition between the size effect and the curvature effect. The CNT (15,15) was found to be the optimal CNT structure corresponding to the maximum CH4 adsorption density. CNCs with various cone angles were built while preserving the same volume as the CNT (15,15); the structures of these are shown in Figure 1. In this study, three CNCs with cone angles of 0°, 19.5°, and 30° were chosen to simulate the shale nanopores (CNTs were considered as CNCs with a cone angle of zero), and the effect of pore shape on CH4 adsorption and CH4 recovery efficiency was subsequently examined.
Prior to the gas adsorption simulation, force fields were validated by comparing the simulation-derived values with the NIST database for pure gas, and the Peng–Robinson equation of state (PR-EOS) [29] for gas mixtures. Figure 2 shows the pressure–density curves for pure gases and the equimolar CH4/CO2 mixture at 338 K for the simulation results, as well as the NIST/PR-EOS values. These results showed that the force field calculations and fluid equation of state correlated very well. The average relative errors between the simulated pressure density values and NIST/PR-EOS values for pure CO2, pure CH4, and the equimolar CH4/CO2 mixture were 1.58%, 0.45%, and 0.38%, respectively.
The GCMC simulations were conducted to study the CH4 adsorption and recovery in CNTs and CNCs at 338 K. The pore structure was treated as rigid and connected to gas molecules at both ends in the GCMC simulations. For gas molecules, three types of moves were attempted: translation, insertion, and deletion; however, additionally, rotational moves were included for CO2 molecules. A total of 1,000,000 cycles were performed per fluid molecule at each experimental pressure. The first half was used for equilibration and the second half was used for sampling. The chemical potentials of the gases were calculated using Widom’s insertion method [30,31]. All the GCMC simulations were conducted using the MCCCS Towhee code [32].
To examine the effects of pore shape on CH4 adsorption and desorption properties, three carbon nanotubes/cones with consistent volumes but varying cone angles were used in the simulation. The system pressure was adjusted by varying the chemical potential of the gases. Simulated pressure ranged from 10 to 40 MPa during CH4 adsorption. The adsorption configuration in the equilibrium state of 30 MPa and 338 K was then used as the initial configuration for the CH4 recovery process. Two CH4 recovery methods, the conventional pressure drawdown and the CO2 injection, were compared. The effects of pore shape on the two CH4 recovery methods were then further studied. At the pressure drawdown stage, the shale reservoir pressure decreased from 30 MPa to 20 MPa, assuming that the gas in the nanopores was in chemical equilibrium with an infinite volume of bulk gas. Further, during the simplified CH4 recovery process with CO2 injection, the system pressure was first lowered from 30 MPa to 20 MPa, similar to the pressure reduction during the pressure drawdown process. Subsequently, CO2 was injected into the system until the bulk mole fraction of CO2 reached 25%, and the system pressure was increased to 26.1 MPa. After the system reached equilibrium, another pressure drawdown process started, with a pressure decrease from 26.1 MPa to 20 MPa. The pressure and bulk gas composition parameters for the two CH4 recovery processes are listed in Table 2. To quantify the efficiency of CH4 recovery and better explain the effects of pore structure on the two processes, the CH4 recovery efficiency, η , was measured as the ratio of the number of CH4 molecules desorbed from the pores throughout the recovery process to the number of CH4 molecules in the pores at the initial reservoir pressure (30 MPa). This is defined as [33]:
η = ρ 30 MPa ρ pore , p ρ 30 MPa
where ρ 30 MPa is the average CH4 density under 30 MPa (the initial reservoir pressure), and ρ pore , p is the average CH4 density in the pore space under pressure p.

3. Results and Discussion

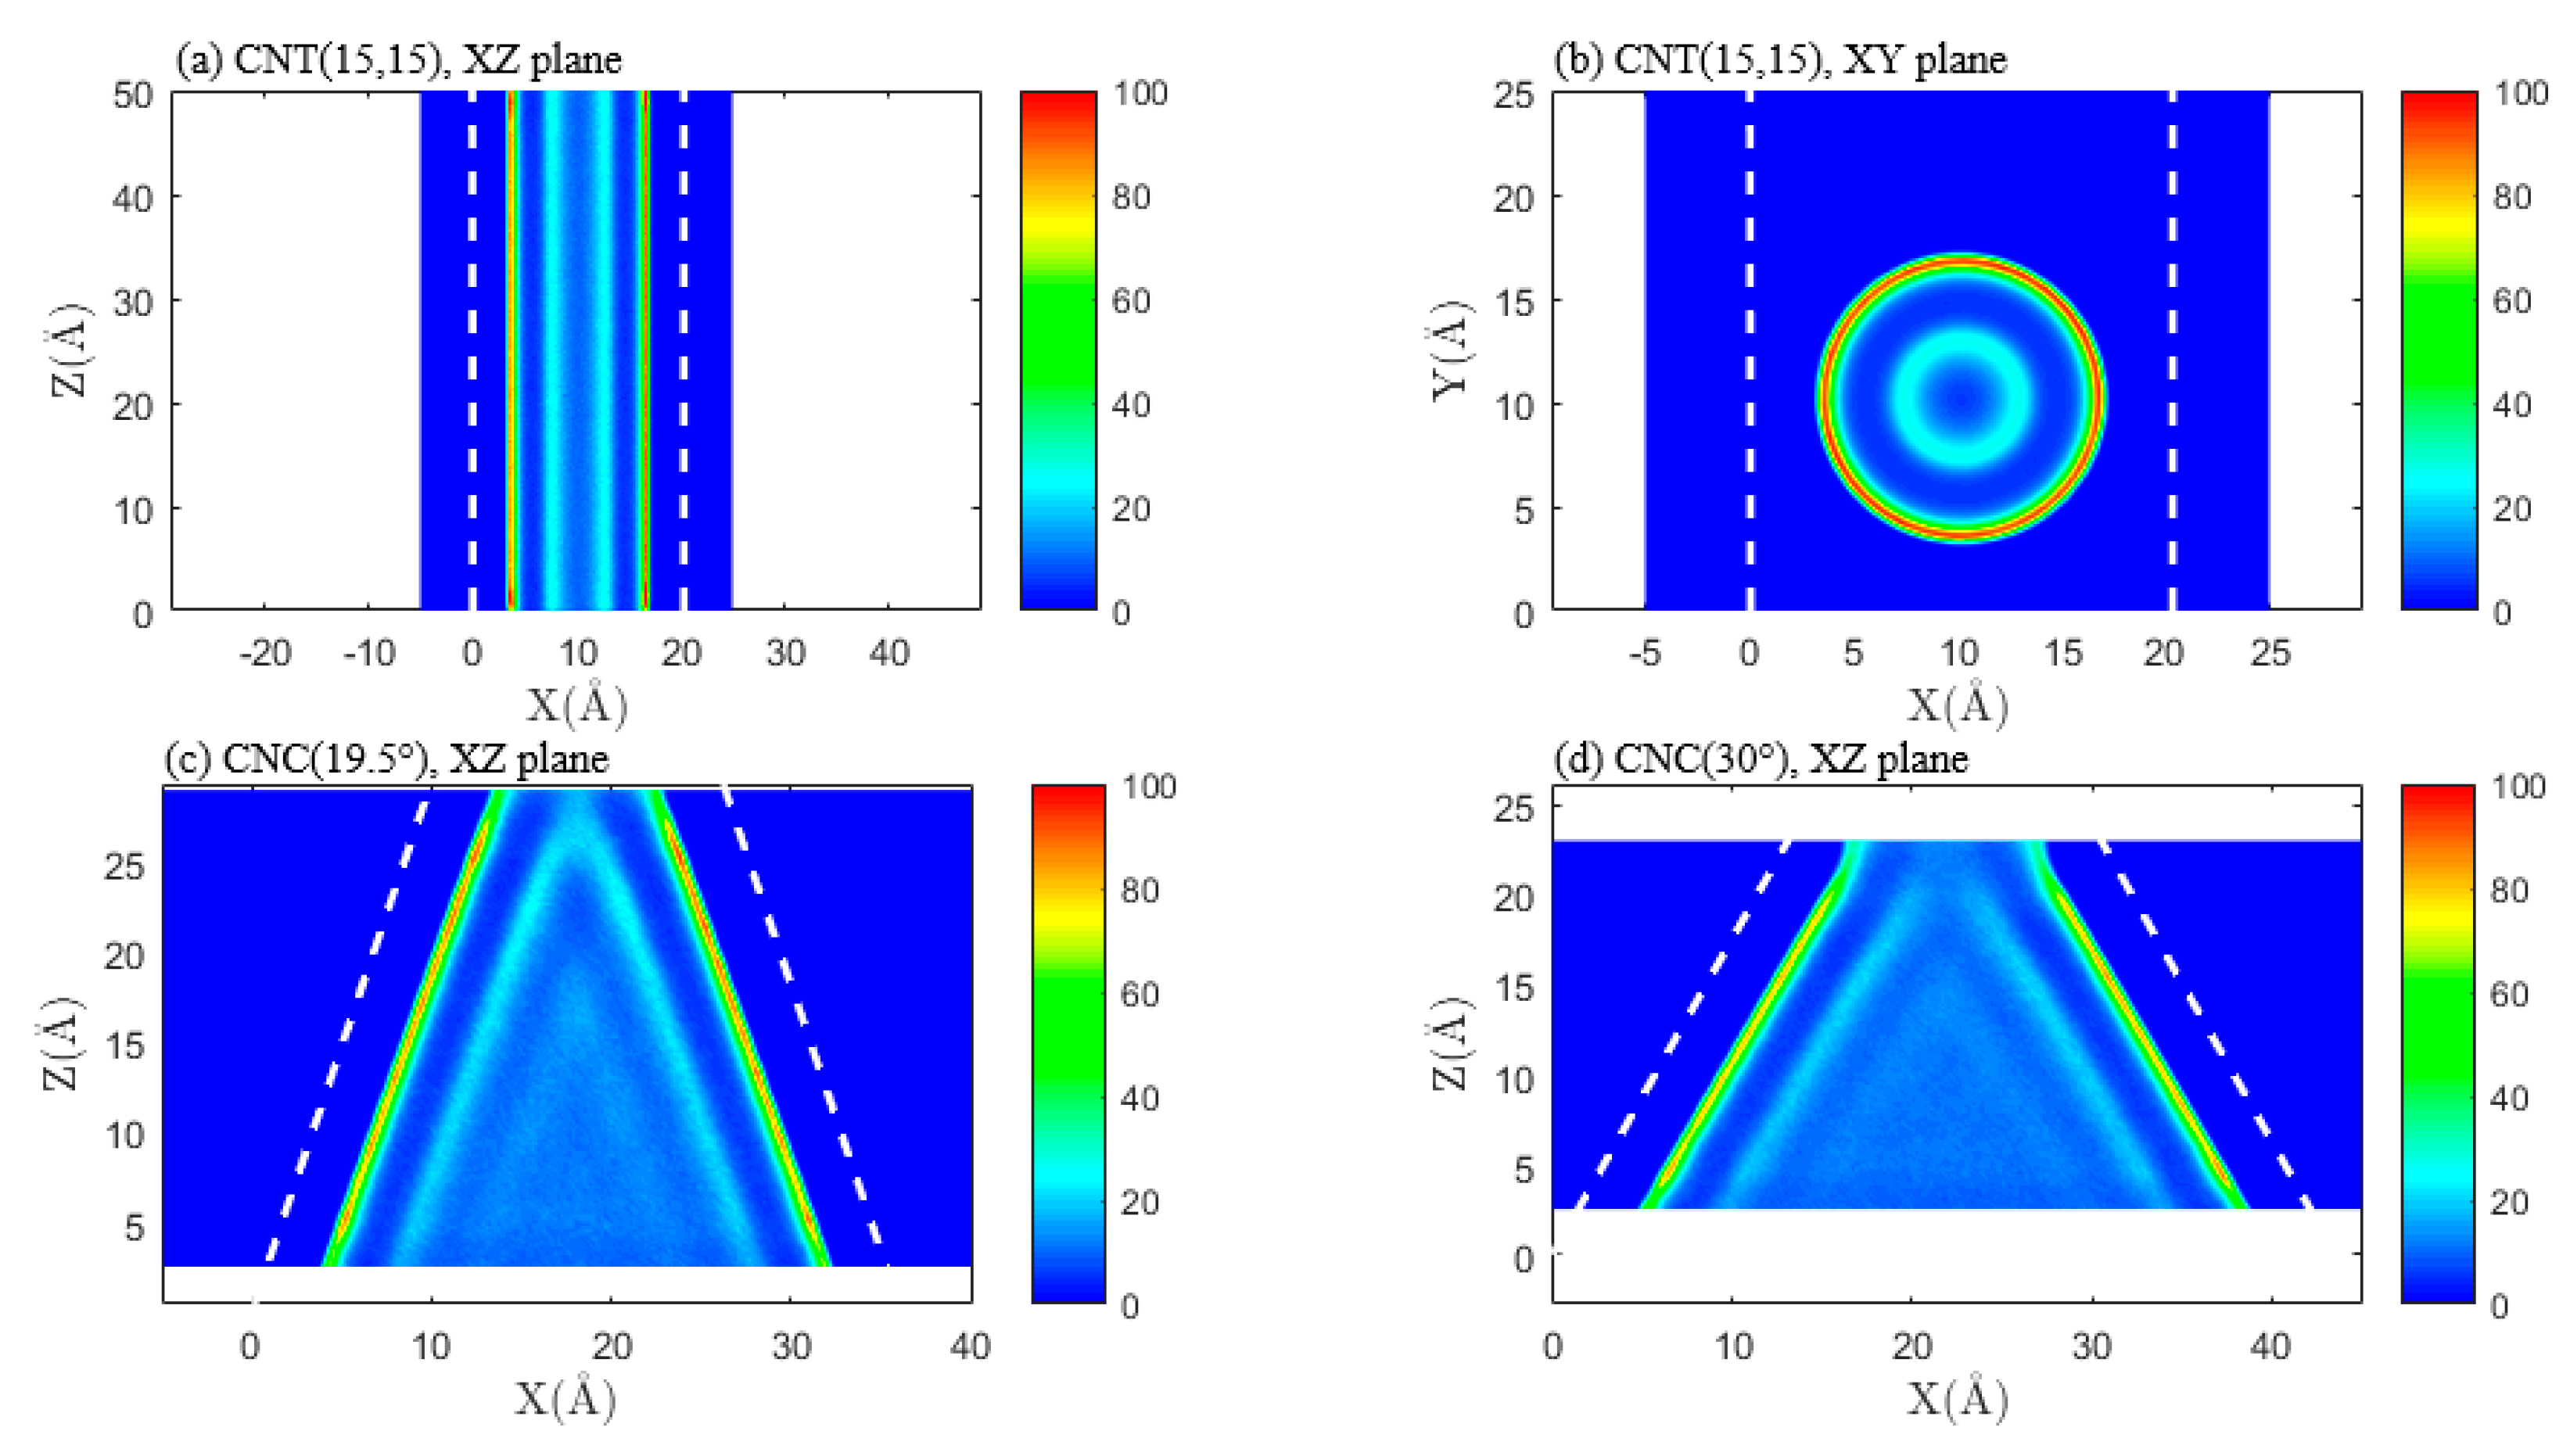
3.1. Effect of Pore Shape on Methane Adsorption Characteristics

To quantitatively characterise the effects of pressure and pore shape on the CH4 adsorption process, the ρ ave , CH 4 in CNTs and CNCs at 338 K for different pressures was calculated. The results are displayed in Figure 3.
The pressure effects showed that the ρ ave , CH 4 within pores increased rapidly with pressure in the low-pressure region, whilst increasing slowly in the comparatively high-pressure region. Since CH4 adsorption in CNCs increased more in the high-pressure region than that in CNTs, saturation at higher pressures can also be predicted from this trend. In terms of the IUPAC classification of adsorption isotherms, the CH4 adsorption isotherms of CNCs and CNTs were categorised as type I isotherms, based on this pattern [34]. Therefore, the Langmuir adsorption model was employed to fit the average CH4 density profile. The Langmuir isotherm model is expressed as [35]:
ρ ave = ρ L p p + p L
where ρ ave denotes the average gas density in the pore, p is the bulk pressure, ρL is the maximum gas density in the pores, and pL is the Langmuir pressure. The subsequent results from fitting the Langmuir isotherm model are presented in Table 3. The adsorption equilibrium data correlated well using this model, with all correlation coefficients exceeding 0.988. It was consistent with previous studies [33,36]. The Langmuir pressure of CNT (15,15) (pL = 5.73 MPa) was markedly lower than that of CNC (19.5°) and CNC (30°) (pL = 11.26 MPa and 13.00 MPa, respectively). The ρL of CNT (15,15), CNC (19.5°), and CNC (30°) was 14.94, 17.42, and 18.46 mmol/cm3, respectively. Overall, the maximum gas density and Langmuir pressure both increased with an increase in cone angle. The trends of the CH4 adsorption isotherms in single-walled CNTs are consistent with those in multi-walled CNTs [18], so the effects of CNT walls are not discussed in this work.
To further explore the impact of pore shape on the CH4 adsorption characteristics, the CH4 density distributions in CNT (15,15), CNC (19.5°), and CNC (30°) were computed. The results at 338 K and 30 MPa are shown in Figure 4, with the pore wall indicated using the white dashed line. The colour code within the pore space illustrates the gas density from low (blue colour) to high (red colour).
Thus, it is evident that a strong first adsorption layer and comparatively weak second adsorption layer were present adjacent to the pore wall, and the density was significantly higher in this region than in the other regions. In the middle of the pore, known as the free layer [37], the CH4 distribution was relatively uniform. Compared to previous studies [16,33], clearer distribution of gas adsorption in the pore space is obtained under strict controls on pore roughness. It is also easier to summarize the effects of pore shape on gas adsorption. It is noteworthy that the CH4 density of the adsorption layers in the CNTs was uniformly distributed in the axial direction, whilst the density of CH4 in the CNCs decreased with an increase in pore diameter. As shown in Figure 3, the average densities of CH4 for the three pores were similar at 30 MPa with the same pore volume. Figure 4 shows that the density of the adsorption layer in CNT (15,15) was significantly higher than that of the adsorption layer in CNC (19.5°) and CNC (30°), while the volume of the free gas zone in CNC (30°) was significantly larger than that of the free gas zone in CNC (19.5°) and CNT (15,15). This phenomenon further explains the effects of the cone angle on the trend of ρ ave , CH 4 with pressure, also shown in Figure 4. At low pressure, the ρ ave , CH 4 in CNT (15,15) is greater than that in CNC (19.5°) and CNC (30°), owing to stronger adsorption on the pore wall of the CNT (15,15). As the pressure increased, the gas density in the adsorption layer of CNT (15,15) preferentially reached saturation, whereas the gas in the free gas zone of CNC (19.5°) and CNC (30°) could occupy an increased volume and, therefore, gas content further increased as the pressure increased. Generally, the adsorption effect dominated the low-pressure region, and the volume of the gas adsorption zone was larger in pores with smaller cone angles. As the pressure increased, the gas density of the adsorption layer was gradually saturated and the total gas content gradually increased. However, the volume occupied by the free gas zone was larger in the pores that had larger cone angles, and ρ ave , CH 4 increased more in the pores with larger cone angles than in the pores with smaller cone angles.

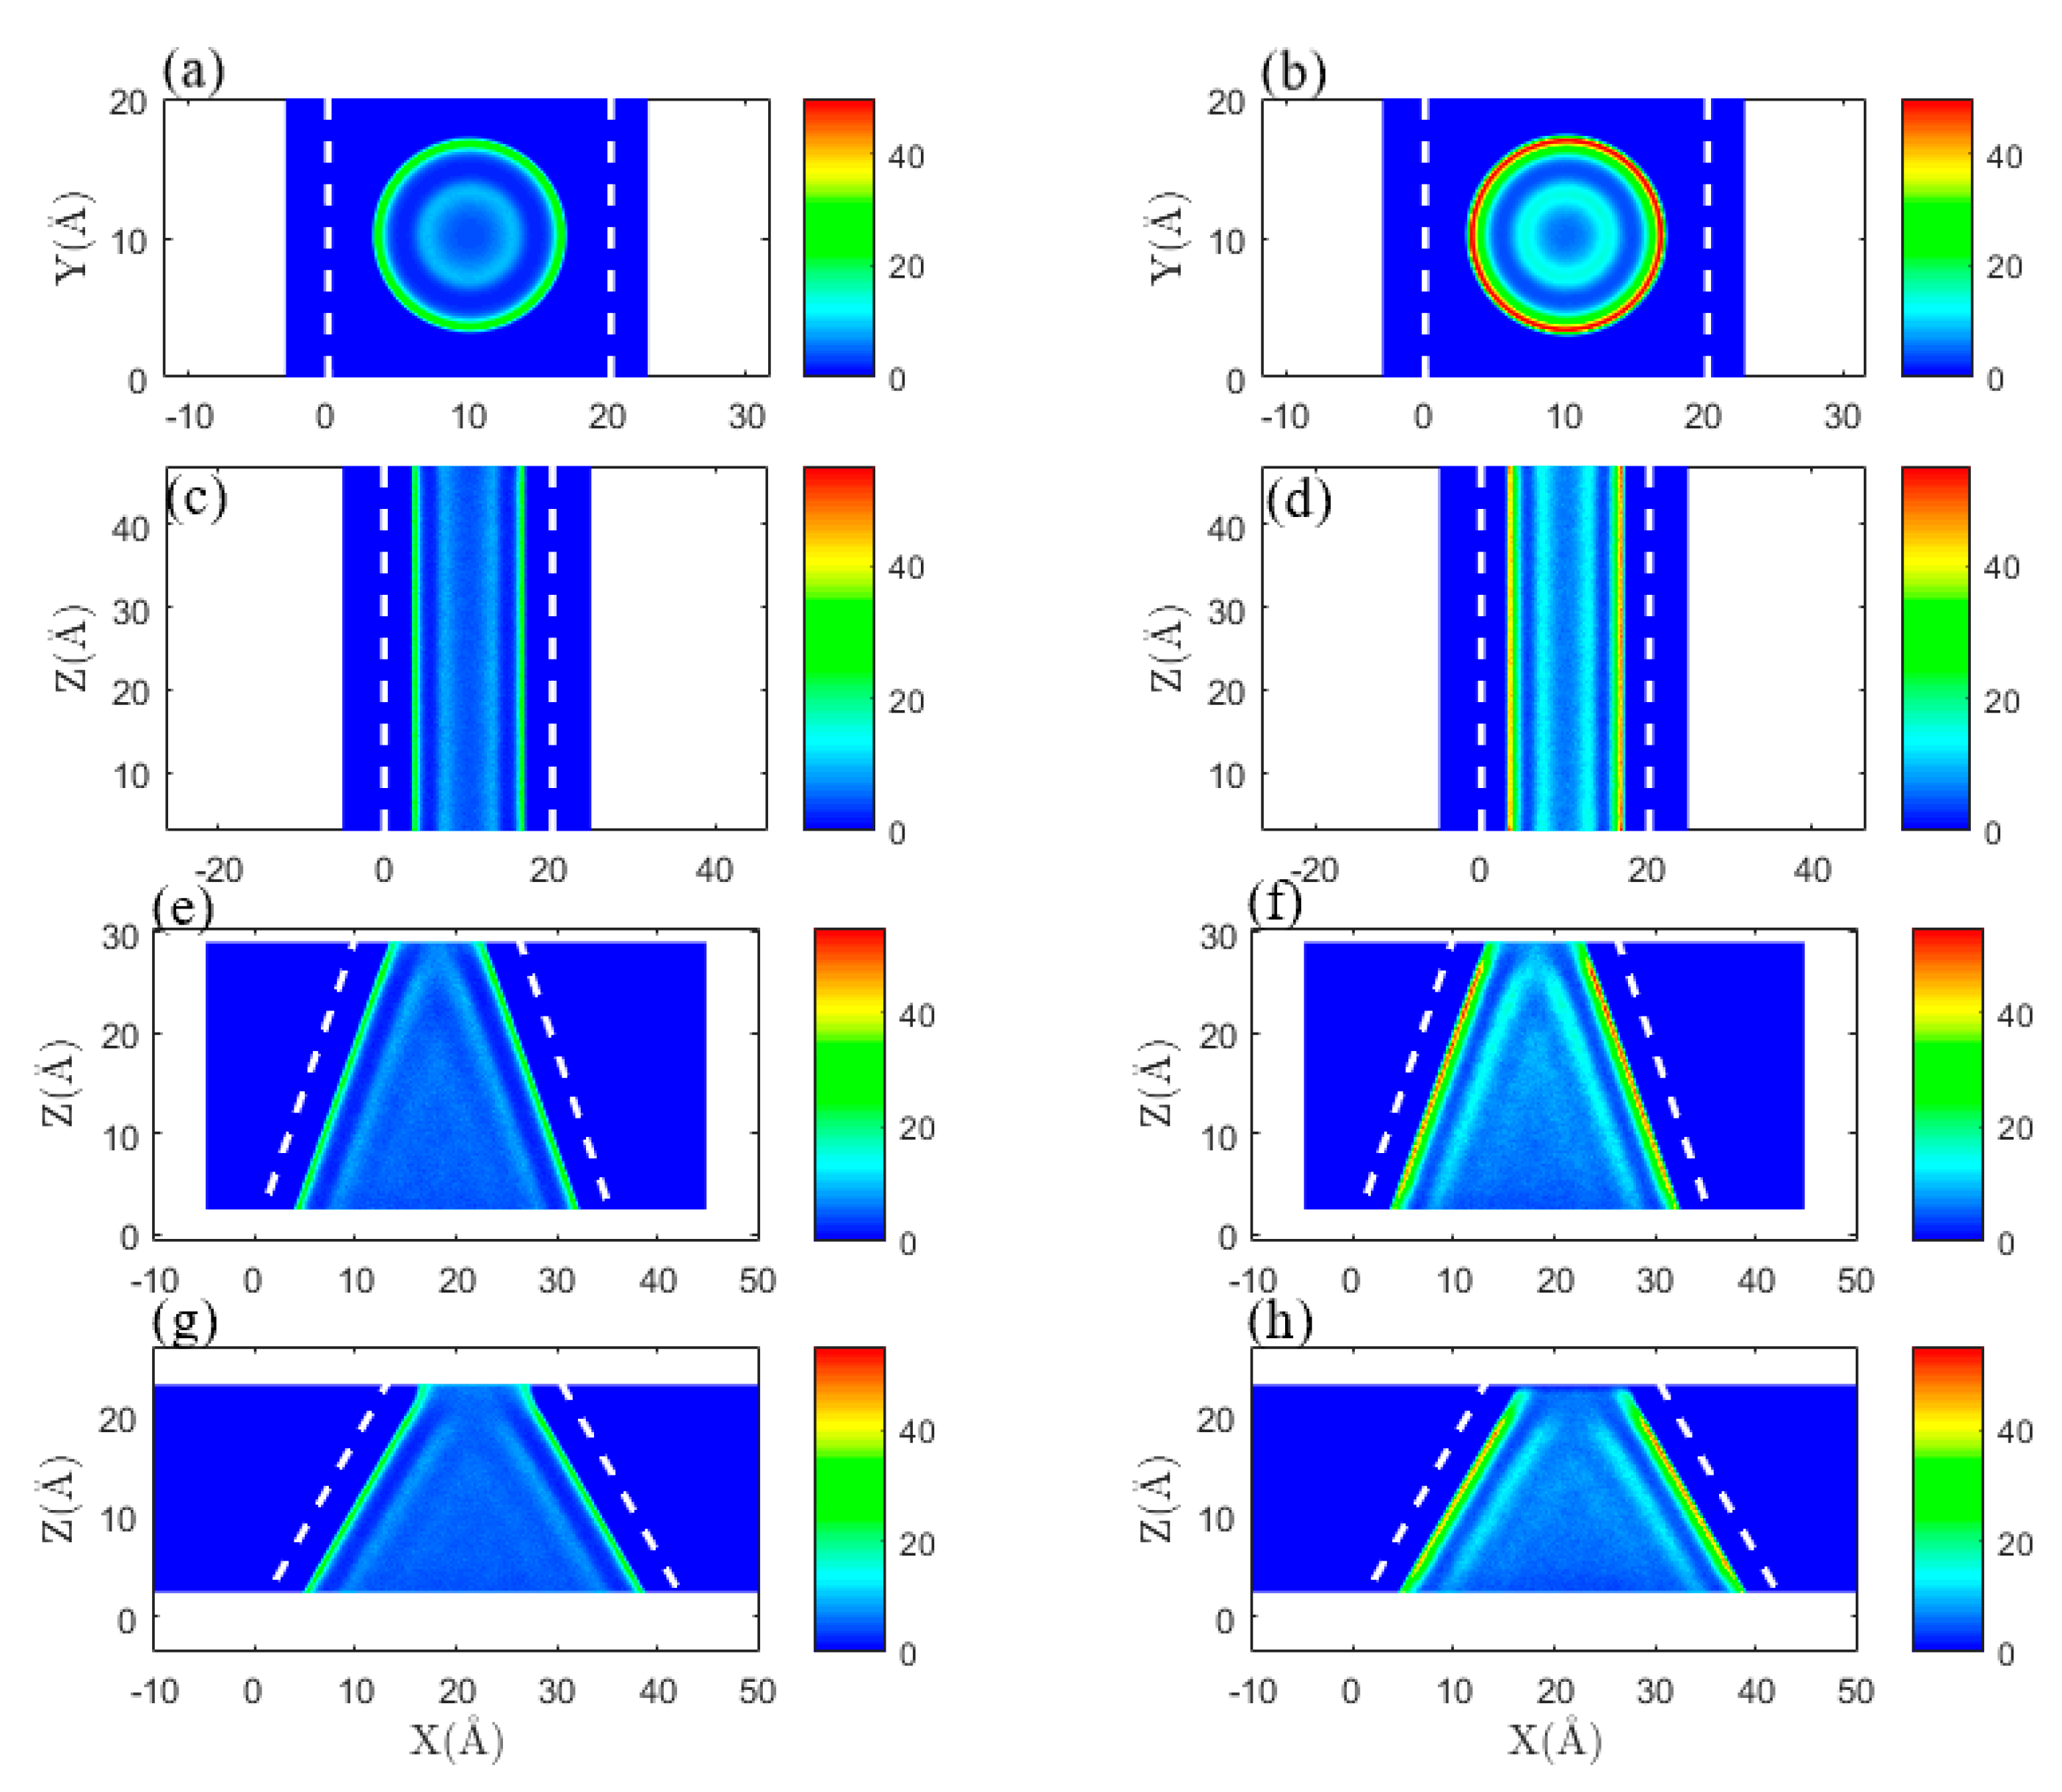
3.2. Effect of Pore Shape on the CO2/CH4 Competitive Absorption

Shale gas recovery using CO2 injection is primarily based on the competitive absorption of CH4/CO2 in the pore space. In this study, the effects of pore shape on CO2/CH4 competitive adsorption characteristics were investigated. Figure 5 shows the equilibrium density distribution of an equimolar CO2/CH4 mixture in CNT (15,15) and CNC (19.5°) at 338 K and 20 MPa, with distinct adsorption and free layers formed in the pores. For all three pore shapes, the CO2 density was significantly higher than CH4 density, suggesting that CO2 had a higher adsorption affinity compared to CH4. The adsorption selectivity of CO2 over CH4 in CNT (15,15), CNC (19.5°), and CNC (30°) was 2.09, 1.73, and 1.55, respectively. The CO2/CH4 adsorption selectivity decreased with the increase in cone angle but it was always greater than 1, indicating an increased CO2 density in competitive adsorption. Regarding single-component gas adsorption, the adsorption layer density in CNT (15,15) was uniformly distributed along the axial direction, whereas in CNC (19.5°) and CNC (30°), gas density gradually declined with the increase in pore diameter, whilst the thickness of the adsorption layer also showed a decreasing trend.

3.3. Effect of Pore Shape on Shale Gas Recovery Process

The effects of pore geometry on the CH4 recovery processes using the CO2 injection and pressure drawdown methods were further investigated. Following the simulation setup shown in Table 2, the initial pore conditions were assumed to be 30 MPa and 338 K, respectively. Two CH4 recovery scenarios were compared:
1.
The conventional pressure drawdown method, in which the system pressure was reduced to 20 MPa;
2.
The CO2 injection method, where the CO2 huff–puff process was simulated with a combination of the CO2 injection process and pressure drawdown process.
To quantitatively compare the recovery efficiencies of the two processes and analyse the influence of pore shape on the process, the same initial pressure (30 MPa) and final pressure (20 MPa) were set for both the cases. The setup of the pressure and bulk gas composition during this recovery process is presented in Table 2.
Average densities of CH4 and CO2 in the pore space were measured before and after each stage and the evolution of the average gas density in the three pore volumes is shown in Figure 6. The dashed arrows represent the pressure drawdown process whilst the solid arrows represent the CO2 injection process. At the pressure drawdown stage, ρ ave , CH 4 gradually decreased, and with the injection of CO2, CH4 in the pore space was further recovered. Simultaneously, the injected CO2 entered the pore space and the CO2 density increased.
In order to quantify the pore-shape effects on CH4 recovery processes using the CO2 injection and pressure drawdown methods, the CH4 recovery efficiency of the two processes for each of the three pores was calculated, using Equation (3). The results are shown in Figure 7. Recovery efficiencies of the pressure drawdown method in CNT (15,15), CNC (19.5°), and CNC (30°) were 7.53%, 13.17%, and 14.12%, respectively. The recovery efficiency was more than doubled as a result of CO2 injection. This further verified that CO2 injection can significantly enhance the recovery efficiency of shale gas. Additionally, the recovery efficiency of the pressure drawdown method increased with an increase in cone angle, whereas the recovery efficiency of the CO2 injection method decreased with an increase in cone angle. As discussed in Section 3.1, the gas density of the adsorption layer in CNT (15,15) was higher than that of the adsorption layer in CNC (19.5°) and CNC (30°), whilst the volume occupied by the free layer gas was smaller than that of CNC (19.5°) and CNC (30°). The pressure drawdown process mainly affected the gas in the free layer; thus, it is more effective in the case of CNC (30°), in which the volume of the free gas zone is larger than that of the free gas zone in the other pores. However, during CO2 injection, the CO2 generally replaced CH4 in the adsorption layer via competitive adsorption. The adsorption of the CNT (15,15) pore wall was stronger than the CNCs; therefore, the CO2 injection method could attain a high recovery efficiency. This suggested that for cylindrical pores, particularly those with a small pore diameter, the CO2 injection method led to a substantial improvement in recovery efficiency.

4. Conclusions

Adsorption properties of pure gases and binary mixtures of CH4 and CO2 in CNTs and CNCs with different cone angles were investigated, using GCMC simulation methods. The recovery processes of CH4 in two cases, that of the conventional pressure drawdown method and the promising CO2 injection method, were further compared. Effects of pore shape on shale gas adsorption and desorption characteristics were then analysed in detail.
The gas density of the adsorption layer in the CNTs is uniformly distributed along the axial direction, while the density of the adsorption layer in the CNCs decreases with the increase in pore diameter. The gas–wall interaction is stronger in smaller pores than in larger pores, whilst the density of the adsorption layer is higher than that of the adsorption layer in larger pores. Larger pores have a higher ratio of free gas to zone volume. In the low-pressure region, the adsorption effect is dominant, and the average density of gas in pores with a smaller cone angle is higher. As the pressure increases, the gas in the adsorption layer gradually becomes saturated, while in the pores with a larger cone angle, the free gas volume is larger and, therefore, the average density can continue to rise.
For CO2/CH4 competitive adsorption, the density of the adsorption layer in the CNC decreases with increasing pore diameter, and the CO2/CH4 adsorption selectivity is constantly above 1. For different pore shapes, the CH4 recovery efficiency using the CO2 injection method is noticeably higher than that of the CH4 using the pressure drawdown method. The recovery efficiency of the pressure drawdown method increases with increasing cone angle, whereas that of the CO2 injection method decreases.
This study focused on the effects of pore shape on shale gas adsorption. The pore surface roughness and element composition are also important factors, which may be considered in further research.

Author Contributions

Conceptualisation, J.Z.; methodology, J.Z.; validation, T.J. and Q.M.; writing—original draft preparation, J.Z.; writing—review and editing, L.L. and M.Z.; supervision, S.G.; project administration, B.D. and W.Z.; funding acquisition, X.Z. and Y.S. All authors have read and agreed to the published version of the manuscript.

Funding

This research was funded by the China Huaneng Group science and technology projects (No. HNKJ22-H10, HNKJ21-HF136, and HNKJ21-H67), the National Nature Science Foundation of China (grant number 41972123), China Huaneng Group High-level Talents Programme (Research on Spatial Distribution and Control Technology of Methane in Yunnan Diandong Mining Area), and National Key Research and Development Programme (Project No. 2019YFE0100100).

Data Availability Statement

Not applicable.

Acknowledgments

We would like to thank the editors and reviewers for their helpful remarks.

Conflicts of Interest

The authors declare no conflict of interest.

References

  1. Godec, M.; Koperna, G.; Petrusak, R.; Oudinot, A. Enhanced Gas Recovery and CO2 Storage in Gas Shales: A Summary Review of Its Status and Potential. Energy Procedia 2014, 63, 5849–5857. [Google Scholar] [CrossRef]
  2. Zhang, Y.; Liu, S.Y.; Song, Y.C.; Jian, W.W.; Li, D.; Hu, C.; Zhan, Y.C. Research Progress of CO2 Sequestration with Enhanced Gas Recovery. Adv. Mater. Res. 2013, 807–809, 1075–1079. [Google Scholar] [CrossRef]
  3. Li, X.; Wei, N.; Liu, Y.; Fang, Z.; Dahowski, R.T.; Davidson, C.L. CO2 Point Emission and Geological Storage Capacity in China. Energy Procedia 2009, 1, 2793–2800. [Google Scholar] [CrossRef]
  4. Van Der Meer, L.G.H.; Kreft, E.; Geel, C.; Hartman, J. K12-B a Test Site for CO2 Storage and Enhanced Gas Recovery. In Proceedings of the 67th EAGE Conference & Exhibition, Madrid, Spain, 13–16 June 2005; pp. 27–35. [Google Scholar] [CrossRef]
  5. Oldenburg, C.M.; Pruess, K.; Benson, S.M. Process Modeling of CO2 Injection into Natural Gas Reservoirs for Carbon Sequestration and Enhanced Gas Recovery. Energy Fuels 2001, 15, 293–298. [Google Scholar] [CrossRef]
  6. Ougier-Simonin, A.; Renard, F.; Boehm, C.; Vidal-Gilbert, S. Microfracturing and Microporosity in Shales. Earth-Sci. Rev. 2016, 162, 198–226. [Google Scholar] [CrossRef]
  7. Curtis, J.B. Fractured Shale-Gas Systems. Am. Assoc. Pet. Geol. Bull. 2002, 86, 1921–1938. [Google Scholar] [CrossRef]
  8. Ross, D.J.K.; Bustin, R.M. The Importance of Shale Composition and Pore Structure upon Gas Storage Potential of Shale Gas Reservoirs. Mar. Pet. Geol. 2009, 26, 916–927. [Google Scholar] [CrossRef]
  9. Ross, D.J.K.; Bustin, R.M. Shale Gas Potential of the Lower Jurassic Gordondale Member, Northeastern British Columbia, Canada. Bull. Can. Pet. Geol. 2007, 55, 51–75. [Google Scholar] [CrossRef]
  10. Xu, H.; Zhou, W.; Hu, Q.; Xia, X.; Zhang, C.; Zhang, H. Fluid Distribution and Gas Adsorption Behaviors in Over-Mature Shales in Southern China. Mar. Pet. Geol. 2019, 109, 223–232. [Google Scholar] [CrossRef]
  11. Zhang, T.; Ellis, G.S.; Ruppel, S.C.; Milliken, K.; Yang, R. Effect of Organic-Matter Type and Thermal Maturity on Methane Adsorption in Shale-Gas Systems. Org. Geochem. 2012, 47, 120–131. [Google Scholar] [CrossRef]
  12. Mastalerz, M.; He, L.; Melnichenko, Y.B.; Rupp, J.A. Porosity of Coal and Shale: Insights from Gas Adsorption and SANS/USANS Techniques. Energy Fuels 2012, 26, 5109–5120. [Google Scholar] [CrossRef]
  13. Yang, F.; Ning, Z.; Liu, H. Fractal Characteristics of Shales from a Shale Gas Reservoir in the Sichuan Basin, China. Fuel 2014, 115, 378–384. [Google Scholar] [CrossRef]
  14. Kurniawan, Y.; Bhatia, S.K.; Rudolph, V. Simulation of Binary Mixture Adsorption of Methane and CO2 at Supercritical Conditions in Carbons. AIChE J. 2006, 52, 957–967. [Google Scholar] [CrossRef]
  15. Sun, Z.; Li, X.; Liu, W.; Zhang, T.; He, M.; Nasrabadi, H. Molecular Dynamics of Methane Flow Behavior through Realistic Organic Nanopores under Geologic Shale Condition: Pore Size and Kerogen Types. Chem. Eng. J. 2020, 398, 124341. [Google Scholar] [CrossRef]
  16. Zeng, K.; Jiang, P.; Lun, Z.; Xu, R. Molecular Simulation of Carbon Dioxide and Methane Adsorption in Shale Organic Nanopores. Energy Fuels 2019, 33, 1785–1796. [Google Scholar] [CrossRef]
  17. Jessen, K.; Tang, G.Q.; Kovscek, A.R. Laboratory and Simulation Investigation of Enhanced Coalbed Methane Recovery by Gas Injection. Transp. Porous Media 2008, 73, 141–159. [Google Scholar] [CrossRef]
  18. Zhu, X.; Zhao, Y.P. Atomic Mechanisms and Equation of State of Methane Adsorption in Carbon Nanopores. J. Phys. Chem. C 2014, 118, 17737–17744. [Google Scholar] [CrossRef]
  19. Yuan, Q.; Zhu, X.; Lin, K.; Zhao, Y.-P. Molecular Dynamics Simulations of the Enhanced Recovery of Confined Methane with Carbon Dioxide. Phys. Chem. Chem. Phys. 2015, 17, 31887–31893. [Google Scholar] [CrossRef]
  20. Zhang, B.; Shan, B.; Zhao, Y.; Zhang, L. Review of Formation and Gas Characteristics in Shale Gas Reservoirs. Energies 2020, 13, 5427. [Google Scholar] [CrossRef]
  21. Wang, R.; Sang, S.; Zhu, D.; Liu, S.; Yu, K. Pore Characteristics and Controlling Factors of the Lower Cambrian Hetang Formation Shale in Northeast Jiangxi, China. Energy Explor. Exploit. 2018, 36, 43–65. [Google Scholar] [CrossRef]
  22. Khangar, R.G.; Mendhe, V.A.; Kamble, A.D.; Ranjan Das, P.; Shukla, P.; Bannerjee, M.; Varma, A.K. Variation in Pore Structure and Associated Fractal Dimensions of Barakar and Barren Measures Carbon-Rich Gas Shales of Jharia Basin, India. ACS Omega 2021, 6, 28678–28698. [Google Scholar] [CrossRef]
  23. Yang, Y.; Zhang, J.; Xu, L.; Li, P.; Liu, Y.; Dang, W. Pore Structure and Fractal Characteristics of Deep Shale: A Case Study from Permian Shanxi Formation Shale, from the Ordos Basin. ACS Omega 2022, 7, 9229–9243. [Google Scholar] [CrossRef] [PubMed]
  24. Liu, J.; Li, P.; Sun, Z.; Lu, Z.; Du, Z.; Liang, H.; Lu, D. A New Method for Analysis of Dual Pore Size Distributions in Shale Using Nitrogen Adsorption Measurements. Fuel 2017, 210, 446–454. [Google Scholar] [CrossRef]
  25. Potoff, J.J.; Siepmann, J.I. Vapor-Liquid Equilibria of Mixtures Containing Alkanes, Carbon Dioxide, and Nitrogen. AIChE J. 2001, 47, 1676–1682. [Google Scholar] [CrossRef]
  26. Martin, M.G.; Siepmann, J.I. Transferable Potentials for Phase Equilibria. 1. United-Atom Description of n-Alkanes. J. Phys.Chem. B 1998, 102, 2569–2577. [Google Scholar] [CrossRef]
  27. Dauber-Osguthorpe, P.; Roberts, V.A.; Osguthorpe, D.J.; Wolff, J.; Genest, M.; Hagler, A.T. Structure and Energetics of Ligand Binding to Proteins: Escherichia coli Dihydrofolate Reductase-Trimethoprim, a Drug-Receptor System. Proteins Struct. Funct. Bioinform. 1988, 4, 31–47. [Google Scholar] [CrossRef]
  28. Lorentz, H.A. Ueber Die Anwendung Des Satzes Vom Virial in Der Kinetischen Theorie Der Gase. Ann. Phys. 1881, 248, 127–136. [Google Scholar] [CrossRef]
  29. Peng, D.-Y.; Robinson, D.B. A New Equation of State. Ind. Eng. Chem. Fundam. 1976, 15, 59–64. [Google Scholar] [CrossRef]
  30. Widom, B. Potential-Distribution Theory and the Statistical Mechanics of Fluids. J. Phys. Chem. 1982, 86, 869–872. [Google Scholar] [CrossRef]
  31. Wldom, B. Some Topics in the Theory of Fluids. J. Chem. Phys. 1963, 39, 2808–2812. [Google Scholar] [CrossRef]
  32. Martin, M.G. MCCCS Towhee: A Tool for Monte Carlo Molecular Simulation. Mol. Simul. 2013, 39, 1212–1222. [Google Scholar] [CrossRef]
  33. Zhou, J.; Jin, Z.; Luo, K.H. Effects of Moisture Contents on Shale Gas Recovery and CO2 Sequestration. Langmuir 2019, 35, 8716–8725. [Google Scholar] [CrossRef]
  34. Donohue, M.D.; Aranovich, G.L. Classification of Gibbs Adsorption Isotherms. Adv. Colloid Interface Sci. 1998, 76–77, 137–152. [Google Scholar] [CrossRef]
  35. Irving Lanowix, B. Adsorption of Gases on Glass, Mica and Platinum. the Adsorption of Gases on Plane Surfaces of Glass, Mica and Platinum. J. Am. Chem. Soc. 1918, 40, 1361–1403. [Google Scholar]
  36. Michalec, L.; Lísal, M. Molecular Simulation of Shale Gas Adsorption onto Overmature Type II Model Kerogen with Control Microporosity. Mol. Phys. 2017, 115, 1086–1103. [Google Scholar] [CrossRef]
  37. Pang, W.; He, Y.; Yan, C.; Jin, Z. Tackling the Challenges in the Estimation of Methane Absolute Adsorption in Kerogen Nanoporous Media from Molecular and Analytical Approaches. Fuel 2019, 242, 687–698. [Google Scholar] [CrossRef]
Figure 1. CNC configurations for different cone angles.
Energies 16 01529 g001
Figure 2. Force field verification of (a) CO2, (b) CH4, and (c) equimolar CH4/CO2 mixture. T = 338 K.
Energies 16 01529 g002
Figure 3. CH4 average density in CNT/CNC versus pressure. T = 338 K. Dots represent simulated CH4 average density, whilst lines represent the fitted Langmuir adsorption isotherm.
Energies 16 01529 g003
Figure 4. CH4 density distribution in CNT/CNC: (a) CNT (15,15), XZ plane; (b) CNT (15,15), XY plane; (c) CNC (19.5°), XZ plane; (d) CNC (30°), XZ plane. T = 338 K, P = 30 MPa.
Energies 16 01529 g004
Figure 5. Density distribution of CH4 (left) and CO2 (right) in CNT/CNC. Top to bottom: CNT (15,15), XY plane; CNT (15,15), XZ plane; CNC (19.5°), XZ plane; CNC (30°), XZ plane. Mole fraction yCH4 = yCO2 = 0.5. T = 338 K, P = 20 MPa. (a) distribution of CH4, CNT (15,15), XY plane, (b) distribution of CO2, CNT (15,15), XY plane, (c) distribution of CH4, CNT (15,15), XZ plane, (d) distribution of CO2, CNT (15,15), XZ plane, (e) distribution of CH4, CNC (19.5°), XZ plane, (f) distri-bution of CO2, CNC (19.5°), XZ plane, (g) distribution of CH4, CNC (30°), XZ plane, (h) distribution of CO2, CNC (30°), XZ plane.
Energies 16 01529 g005
Figure 6. Density evolution of CH4 (left) and CO2 (right) in CNT/CNC. Top to bottom: CNT (15,15), CNC (19.5°), and CNC (30°). T = 338 K.
Energies 16 01529 g006
Figure 7. Relationship between pore shape and CH4 recovery efficiency of the two different methods. T = 338 K.
Energies 16 01529 g007
Table 1. Force field parameters for CH4, CO2, and C in CNTs or CNCs.
Atom Typeε/kB 1 (K)σ (nm)q(e)
CH41480.3730
C-CO2270.2800.70
O-CO2790.305−0.35
C-CNT/CNC28.180.3400
1 kB is the Boltzman constant.
Table 2. Parameters for the setup of pressure and bulk gas composition during the pressure drawdown and CO2 injection processes.
StageP (MPa)Bulk Gas Composition
Pressure drawdownInitial pressure30Pure CH4
Pressure drawdown20Pure CH4
CO2 injectionInitial pressure30Pure CH4
First pressure drawdown20Pure CH4
CO2 injection26.10.75CH4, 0.25CO2
Second pressure drawdown200.75CH4, 0.25CO2
Table 3. Langmuir isotherm parameters of methane obtained using nonlinear fitting for CNT/CNC, T= 338 K.
Pore ShapepL (MPa)ρL (mmol/cm3)R2
CNT (15,15)5.7314.940.991
CNC (19.5°)11.2617.420.994
CNC (30°)13.0018.460.988
Disclaimer/Publisher’s Note: The statements, opinions and data contained in all publications are solely those of the individual author(s) and contributor(s) and not of MDPI and/or the editor(s). MDPI and/or the editor(s) disclaim responsibility for any injury to people or property resulting from any ideas, methods, instructions or products referred to in the content.

