1. A Brief History of Electricity: How Did We Get Here?
As anything in life, power systems are undergoing constant change and adaptation. Since their first inception in late 1800s, power systems have expanded massively and increased exponentially in components and complexity [
1]. The earlier designs were limited in generated power, served customers and geography, most of which would be classified as microgrids in contemporary terminology. As Thomas Edison’s first DC power station on Pearl Street gave way to Westinghouse’s AC hydroelectric power plant at Niagara Falls, the capabilities of power systems constantly increased [
2]. The generators had the ability to generate more power, transformers could ramp up the voltage to higher levels and, thus, made it possible to transmit the generated power over longer distances.
With the consolidation of several small-scale electric power companies into larger ones, it became possible to fund larger projects. This paved the way to traditional power systems in which generation, transmission and distribution/consumption are at different locations [
3]. Generation is located where the resource is present, e.g., water source for a hydroelectric power plant or a coal-mine for a thermal power plant. This provides cost-savings as it is more cost-effective to transport energy in the form of electricity rather than fuel. Furthermore, bulk generation at a single location is more efficient and more convenient from business and logistics perspectives. Traditionally, locations of consumption are far away from generation sites. Therefore, long transmission lines are required to link the two. There are inevitable losses as the electricity is sent over transmission lines [
4]. Some of these can be reduced by increasing the operating voltage of these lines, hence the need for high-voltage transformers and cables.
This gigantic system that spans over large swaths of land came to be known as an “interconnected system” where different generators and loads are connected to supply continuous and uninterrupted power. There are two indicators to monitor the health of a power grid: voltage and frequency [
5]. Any disturbance in the system, be it a fault or sudden change in demand or generation, will manifest itself as either one or both of these. Power engineers have devised ingenious methods to keep the power systems healthy at all times, so much so that the overall system that gives prosperity to human civilization is deemed as the greatest engineering achievement of the 20th century.
Then, everything changed…
2. A Colossal System in Trouble: Renewable Energy Revolution
What made power systems change, when they were engineered to work close to perfection? There is not a single factor that can be cited as an answer. It is a combination of several developments such as increased use of renewable energy, decreasing cost of electrical systems which made small-scale systems possible, and emergence of non-traditional power systems for electrifying underserved locations or for improving overall energy security. All these phenomena caused significant paradigm changes in the operation of power systems [
6].
The global warming and its negative impacts on the climate are pushing nations around the world to take action and cut down their carbon emissions. From the EU to Japan, different countries came up with different targets to meet towards decreasing carbon emissions [
7]. One of the biggest consumers of fossil fuels, a big contributor to carbon emissions, is the electricity-generation sector. The alternative that is proposed is wide-spread use of renewable energy resources such as solar and wind energy. Although capturing ubiquitous natural energy at no incremental cost and without any emissions looks like a trivial solution, its practical implementation poses several challenges. Unlike fossil fuels that can be stored in large quantities and used in a controllable fashion, these resources are weather-dependent and intermittent. This means replacing a traditional thermal power plant with solar panels or wind turbines requires more space for the same installed capacity. Furthermore, solar and wind energy cannot be dispatched in the same way as a power plant burning oil or gas. This creates many issues in energy security, system stability and reserve management.
Another distinct nature of these resources is the ability to install them in very small scales. For instance, it is not possible to build a nuclear power plant with an installed capacity of 100 kW, while it is perfectly possible to have a solar system with a similar capacity. The possibility to scale down electrical systems in such a way has only become possible with decreasing cost of photovoltaic (PV) panels and battery storage systems. With this trend, factories, warehouses, offices and even individual households started deploying these systems. This means that distribution systems that are traditionally planned to have only consumers were forced to host generation systems [
8]. Another novel use of batteries and electrical motors created an alternative in transportation, which is another major sector that contributes to carbon emissions. However, even a small fraction of the vehicle fleet migrating to electricity causes issues for distribution systems, as electric vehicle charging is not something envisioned when they were being built. When innovative uses of electric vehicles such as vehicle-to-grid (V2G) are also considered, distribution systems may get overwhelmed with multi-directional power flow and ubiquitous electricity generation.
These developments also open doors for electrifying communities that have been left behind due to prohibitive costs. The traditional way of providing electricity has always been extending transmission and distribution lines to connect new locations with the interconnected grid. When the target community is a large city or industrial area, the high cost of building these lines can be justified and quickly recovered through electricity sales. On the other hand, unelectrified communities have been ignored and left behind if they are small and a quick recovery of initial costs through sales is not guaranteed [
9]. This has been a big issue even at the turn of the 21st century in places such as Sub-Saharan Africa, South America and isolated parts of Asia. The ability to set up small-scale electrical systems with solar panels and storage devices has drastically changed the fate of these communities. Stand-alone power systems that include generation and distribution in close proximity have flourished very quickly.
The common denominator of the above developments is the fact that they change the way traditional power systems operate. In stark contrast to the strict separation between steps of bulk generation, transmission and consumption, these systems have generation and consumption at all levels of operation. Unlike traditional power systems where there is unilateral power flow, from bulk generation site to bulk consumption site via transmissions lines, these novel power systems have multi-lateral power flow between different sites that may house generators and loads simultaneously. Subsequently, unprecedented control and protection issues have emerged that cannot be evaded with small modifications but rather require fundamental ones. As mentioned above, generators based on renewable energy sources are generally much smaller in scale. In addition to this, in contrast with traditional generators that are synchronous generators, generators harvesting renewable resources are based on inverters, i.e., they utilize power electronics to convert DC to AC and lack rotating parts. This difference has an immense impact on the grid operation as the rotating parts of synchronous generators provide system inertia and are utilized to control system frequency. As the level of renewable energy penetration increases, the number of inverter-interfaced generators increases, which, in turn, decreases system stability. This has been one of the two bottlenecks that impedes the mass migration to renewable energy-based generators, while the other one is intermittency of these resources.
3. Enter the New Age Power Systems: Microgrids
With an effort to accommodate more novel technologies in power systems while minimizing their detrimental effects on their operation, power engineers proposed to the idea of microgrids [
10]. These are smaller sub-systems that can be isolated from the larger electrical grid and continue its operation. In addition to providing certain energy security benefits, they also make it possible to split the operational challenges explained above into smaller pieces to address them. As a power system alternative, microgrids can be utilized to provide otherwise-impossible electricity to isolated communities as a stand-alone system or to increase the reliability of energy for critical systems such as hospitals, military installations or university campuses.
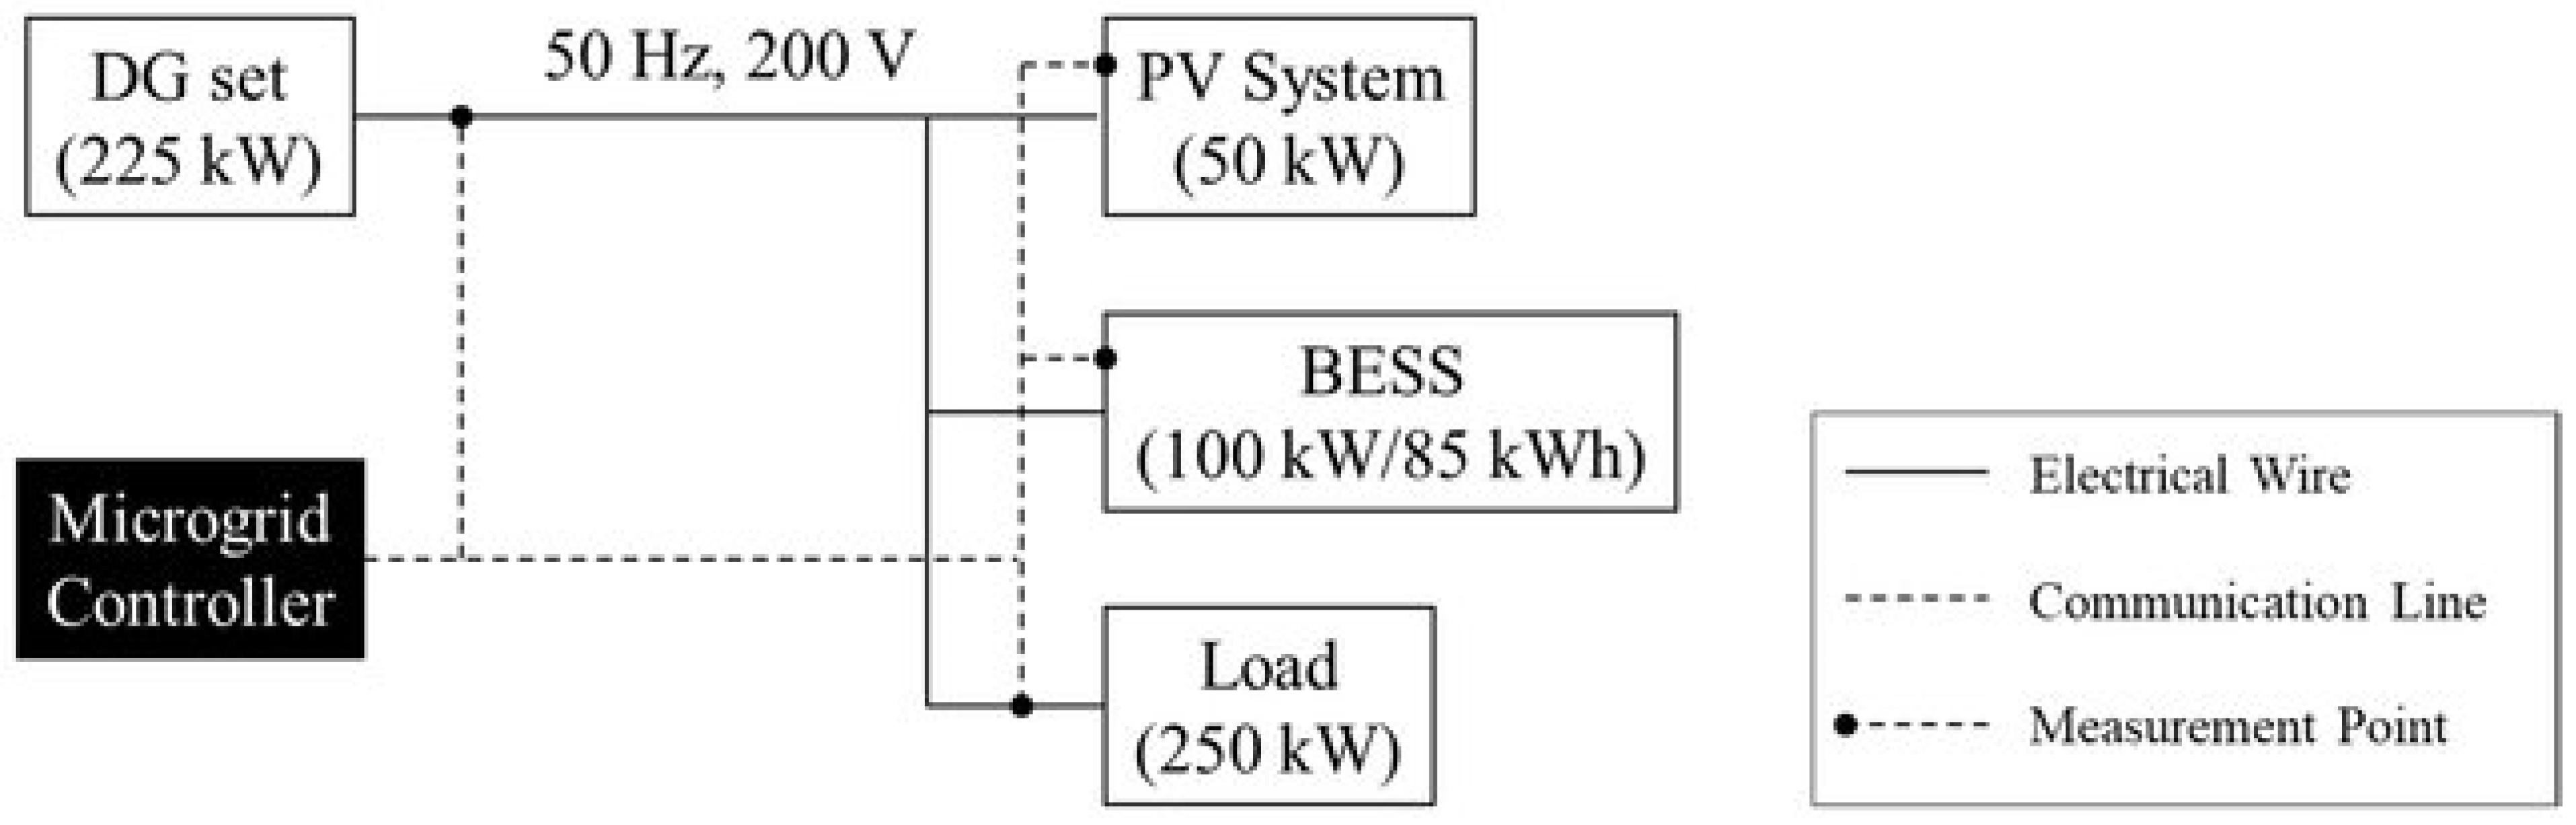
A typical microgrid topology is given in
Figure 1. Unlike traditional utility grids, there is no ample energy supply which ensures the loads are always fed, as required. Instead, there are additional storage systems, e.g., a battery energy storage system (BESS), which will store surplus renewable energy during peak generation hours, i.e., noon. This energy will later be utilized when sun is not available. As can be seen, microgrids are designed to account for intermittency of renewable energy and limited amount of power available in the system at any given time. This requires optimally sizing renewable energy-based generators and storage devices with respect to local load and the profile of renewable energy resources, e.g., solar radiation or wind profile. Following the load-generation imbalance, the microgrid controller may instruct the storage system to charge or discharge and keep the system stable. This requires the presence of a proactive energy management system that monitors the systems and makes decisions.
In its very basic form, such an energy management system tries to supply the local load with energy by making use of simple addition and some error margins. Firstly, the available generation sources are considered and classified as dispatchable or non-dispatchable, i.e., whether their generation output can be controlled or not. As mentioned before, almost all renewable energy-based generators are non-dispatchable. Secondly, in order to account for this uncontrollable nature, the controller either oversizes the dispatchable generators or employs storage devices, which can charge whenever possible, and discharges whenever needed. It is also possible to use a combination of these techniques. However, it is a very interesting optimization problem to decide by what margin to oversize dispatchable units or to decide the capacity of storage devices [
11]. There are many factors at play, such as what percentage of the load is critical, i.e., the load that cannot be shed, what are the renewable energy sources used in the microgrid under question and what are their profiles, e.g., solar profile or wind measurements. Some resources can be more forgiving while others absolutely need replacements, for example, micro hydro stations may still continue providing energy with lower levels of water flow but solar panels may not provide anything at night or on very cloudy days.
Furthermore, such optimization decisions still need to be done during operation of the microgrid, not only during the planning stage as explained above. For instance, what percentage of renewable energy-based generators can be utilized before compromising the frequency or voltage stability of the microgrid? How many units of diesel generator need to be kept online to ensure stability while keeping the fuel costs and environmental impact to a minimum? Power system engineers need to address all these issues and develop a controller design that can ensure stable operation under all circumstances, such as the loss of renewable energy resources and loading changes.
Most trivial solutions for these optimization are not the most cost-effective or efficient ones. Therefore, novel optimization techniques are employed while making such decisions [
12,
13,
14]. Because such techniques are able to take different factors into account and make a decision in multiple steps, i.e., multi-level optimization, they can be quite complex and cumbersome to develop initially and require a lot of practice to utilize with high performance. Thankfully, there is a great source that we can put to use, where different questions are analyzed, optimized and solved by millions, if not billions of non-human users: nature…
4. Biomimetic: Imitating Nature for Reliable Power Supply
The term biomimetics means “copying nature to solve problems”, as nature is one of the best places to look for problem solvers. From structural designs to behavioral patterns of different living things, it can be a great source for getting inspiration. There are many examples of biomimetics being used by engineers. A well-known one relates to the design of shinkansen, the famous bullet train of Japan. During the early days of development, there was a serious sound problem as the bullet trains enter and leave tunnels. The air that builds up in front of the train that is traveling at high speeds gets compressed when the train enters the tunnel. This, in turn, would create a sound wave that travels inside the tunnel and exits with a loud bang much like a gunshot or explosion. This would disturb the wildlife around the railways, passengers as well as residents nearby. In addition to this sonic issue, this air also slowed down the train, similar to what one experiences while walking in water.
The solution was inspired by a small bird called the kingfisher, which is known to plunge itself into water while hunting. The kingfisher does this very efficiently, as it has to do so, while catching fish. Unlike the bullet train, kingfisher does not splash water around and pierces into the water, rather than pushing it forward. After studying the bird’s beak, aerodynamics engineers discovered that the long and thin structure that grows steadily from the tip to the head was the key for this feat. They have redesigned the cockpit of the bullet trains to be similar to kingfisher’s beak. The subsequent tests showed that the new shinkansen design is not only quieter and faster but also more efficient, as air resistance has decreased by 30%. This means the train can achieve high speeds by consuming less energy while traveling very quietly.
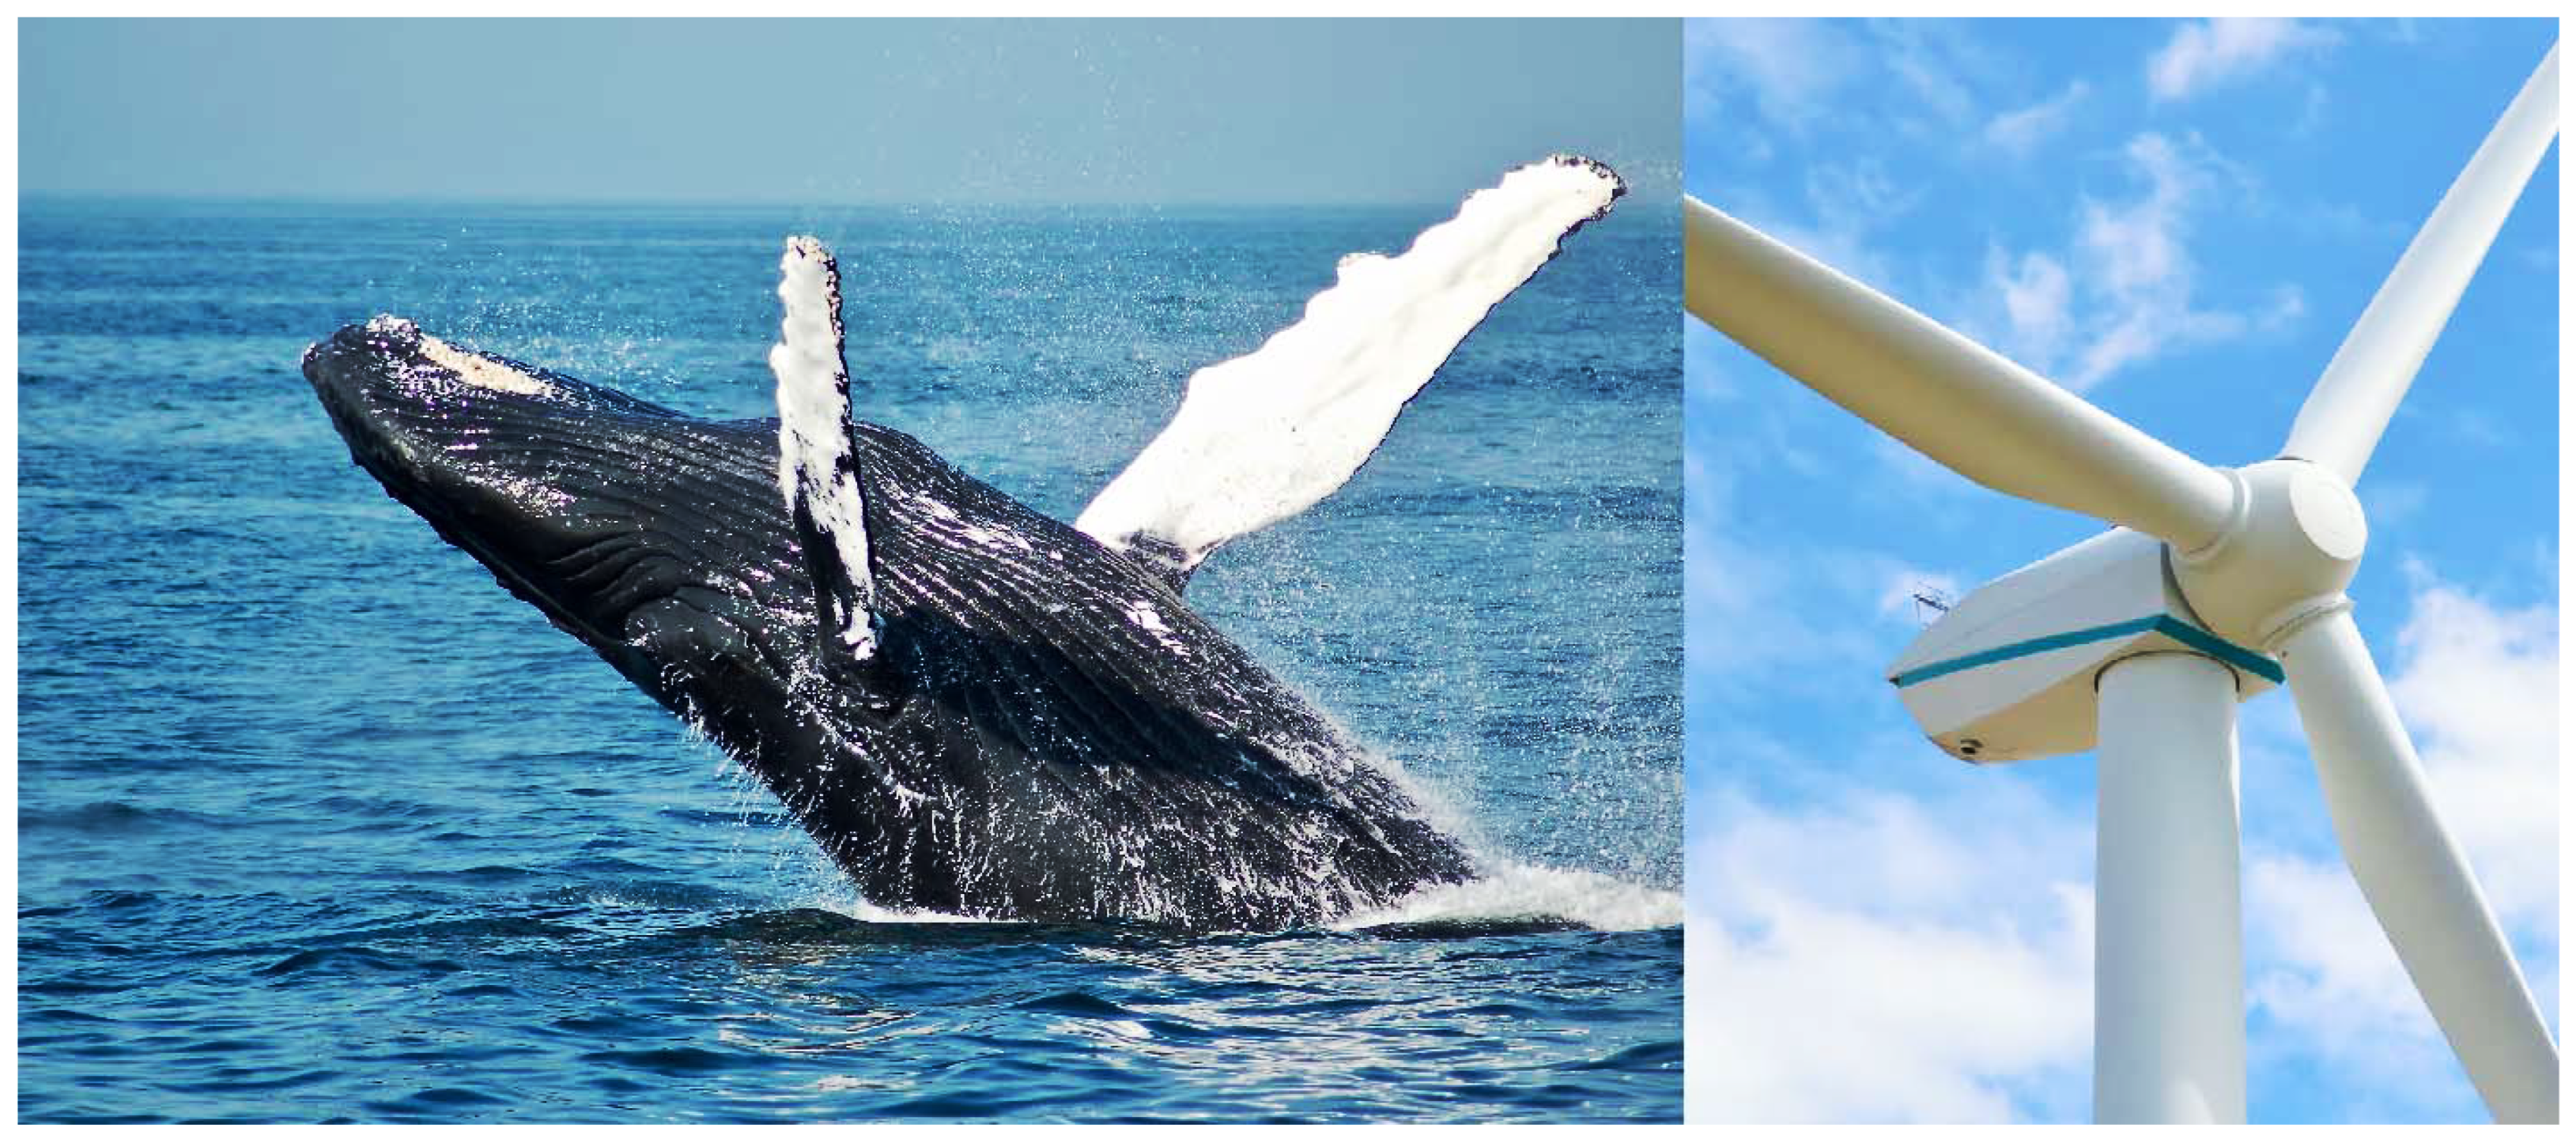
The designs shown in
Figure 2 and
Figure 3 are an example of biomimicry for design purposes by copying the shape. Similar examples include velcro tapes that are inspired by burrs that stick to the skins of animals, lighter but much stronger helmets that are designed after iron-plated snails and self-cleaning surfaces that follow the bumpy structure of a lotus leaf. A relevant example in the energy domain is happening in the design of wind turbines. The flippers of humpback whales have scalloped edges that are also known as tubercles which tremendously decrease turbulence and drag on the whale’s body. This allows this giant animal to traverse through water effortlessly. When such a design was incorporated into airplane wings, engineers found that the drag reduced by 32%. Redesigning wind turbine blades with tubercles will reduce the drag and increase the energy capture. This will not only increase energy efficiency in areas where wind turbines are already installed, but will also enable wind generation in sites that are previously deemed unviable due to low wind speed.
The other way in which biomimetics takes place is copying the behavior observed in the nature. It is a fact that animals travel, hunt, and live in an optimal way; since, otherwise, they will not survive. Therefore, their behavioral patterns can be implemented in engineering processes and optimal solutions can be obtained [
15,
16].
There are countless examples in which this is done. One of which is optimization of the path that ants take while carrying food to their nest [
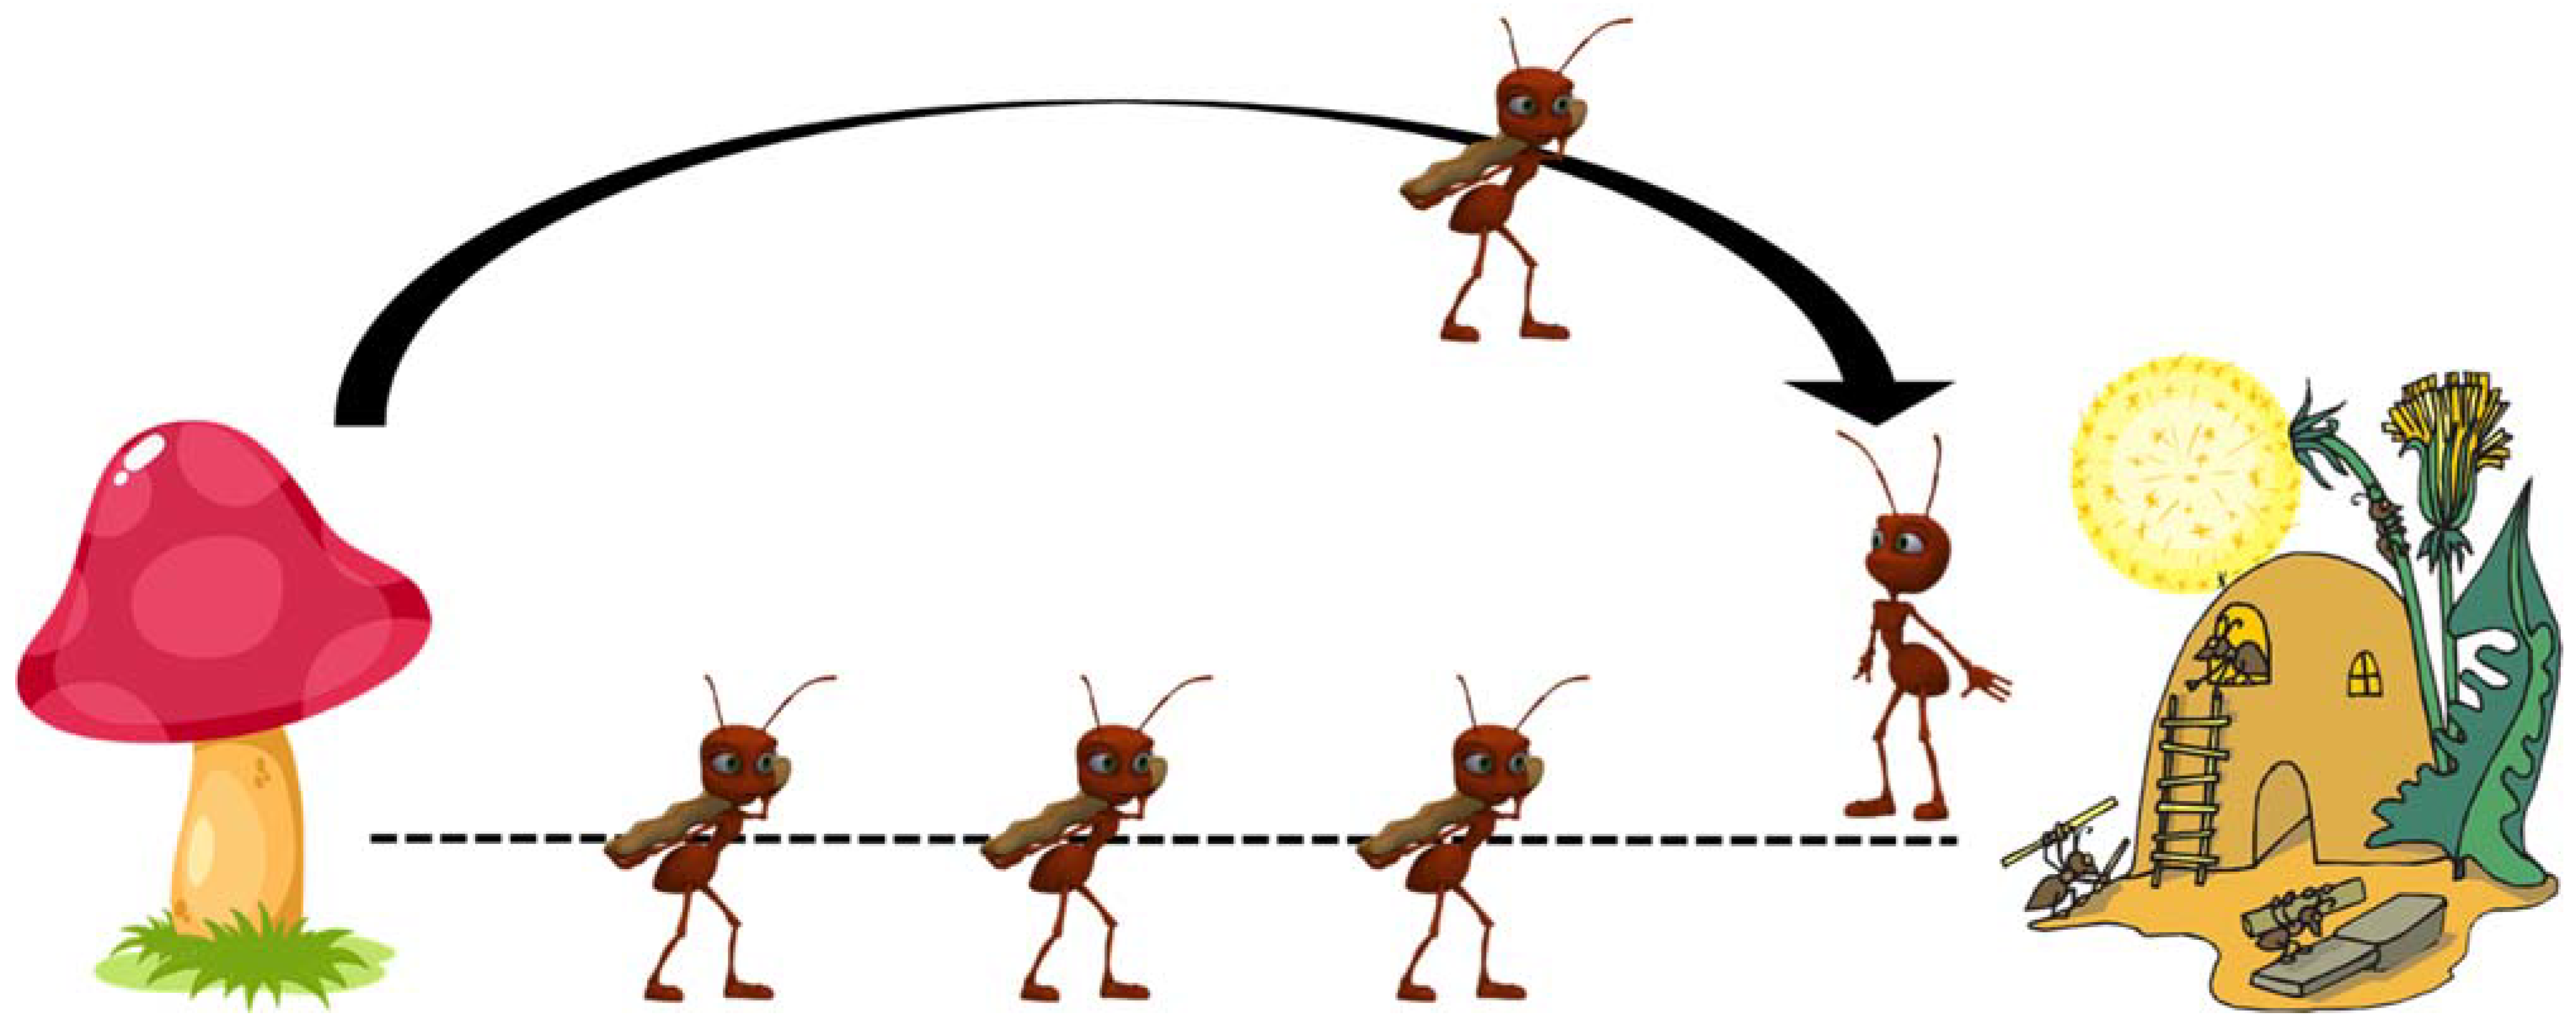
17]. As shown in
Figure 4, ants leave their nest and spread over the land to forage for food. Initially, the location of the food is not known, therefore, there is no established path between the food source and the nest. Every ant, upon reaching the food source, picks up a piece and returns back to the nest. While doing so, they leave pheromones on the track that they take. These pheromones are designed to mark the path and help other ants follow the track and find the food. They also evaporate and dissipate in time. A path stays active, or alive, as long as there is a sufficient number of ants that take the path and replenish the pheromones before they are fully dissipated.
As shown, there may be more than one active path at any given time, more so in the beginning. Since the shortest path between the food source and the nest is the quickest and most efficient, more ants would use this path and leave their pheromones. Accordingly, it will be more likely that new ants leaving the nest choose this path. After several cycles, i.e., iterations in an optimization algorithm, the shortest path would be selected as the global optimum and other paths would cease to exist. Ant colony optimization is a relatively simple algorithm since there is only one factor, i.e., pheromone dissipation, which effects the decision. Additionally, the decision-making mechanism is very simple: new ants leaving the colony choose a path according to the strength of pheromones in their surroundings. This optimization is good for finding solutions for relatively simple problems that have a small set of factors and require single-level decision making.
A more sophisticated approach is seen in the grasshopper optimization algorithm, shown in
Figure 5 [
18]. Firstly, the colony has different members that have different capabilities, unlike an ant colony where all ants are equal. Nymphs grow from hatched eggs and need to go through six distinct stages to reach adulthood. The main difference between each of these stages as well as adulthood is the speed of movement. Nymphs do not have wings and move in a slow pace with small increments. The pace and the increments do increase with each stage, finally reaching adulthood where big jumps are possible thanks to their wings. The movement, and also the eventual location, of a grasshopper is determined by three different factors: the wind, gravitational force and social interaction between the grasshoppers. The wind and gravity effects their movement in accordance with rules of physics. Social interaction, on the other hand, models how grasshoppers behave in a swarm. Despite being a swarm, they do not want to be very close to one another. Should there be a desirable location for all grasshoppers to go, e.g., where food exists, they will be attracted from a distance until what is called the comfort zone. If there is more than one grasshopper in the defined comfort zone, these grasshoppers will be repelled and look for alternative locations. In this fashion, there are several factors affecting the iterations that make the algorithm more robust, in contrast with the ant colony, where the only factor is pheromone strength. As the iterations continue, grasshoppers move through a field, nymphs with small steps on the ground and adults with large jumps in the air looking for food sources, while at the same time following the restrictions of wind, gravity and social proximity.
It goes without saying that there are many more such techniques. For instance, in artificial bee colony optimization, bee’s foraging for nectar and subsequent dancing to guide other bees to the food source is modeled, whereas in particle swarm optimization, the foraging behavior of birds or fish over a large swath of land is utilized to find optimum solutions points for a specific function. There are more novel approaches such as those that are based on unique hunting behavior of humpback whales or the internal dynamics of wolf packs during hunting. Regardless of their origin of inspiration, all of these approaches count on the fact that nature always finds the most optimal way of doing something that is desperately required for survival.
5. Examples of Microgrid Control Applications
There are different examples where nature-inspired optimization approaches are applied to microgrid controllers.
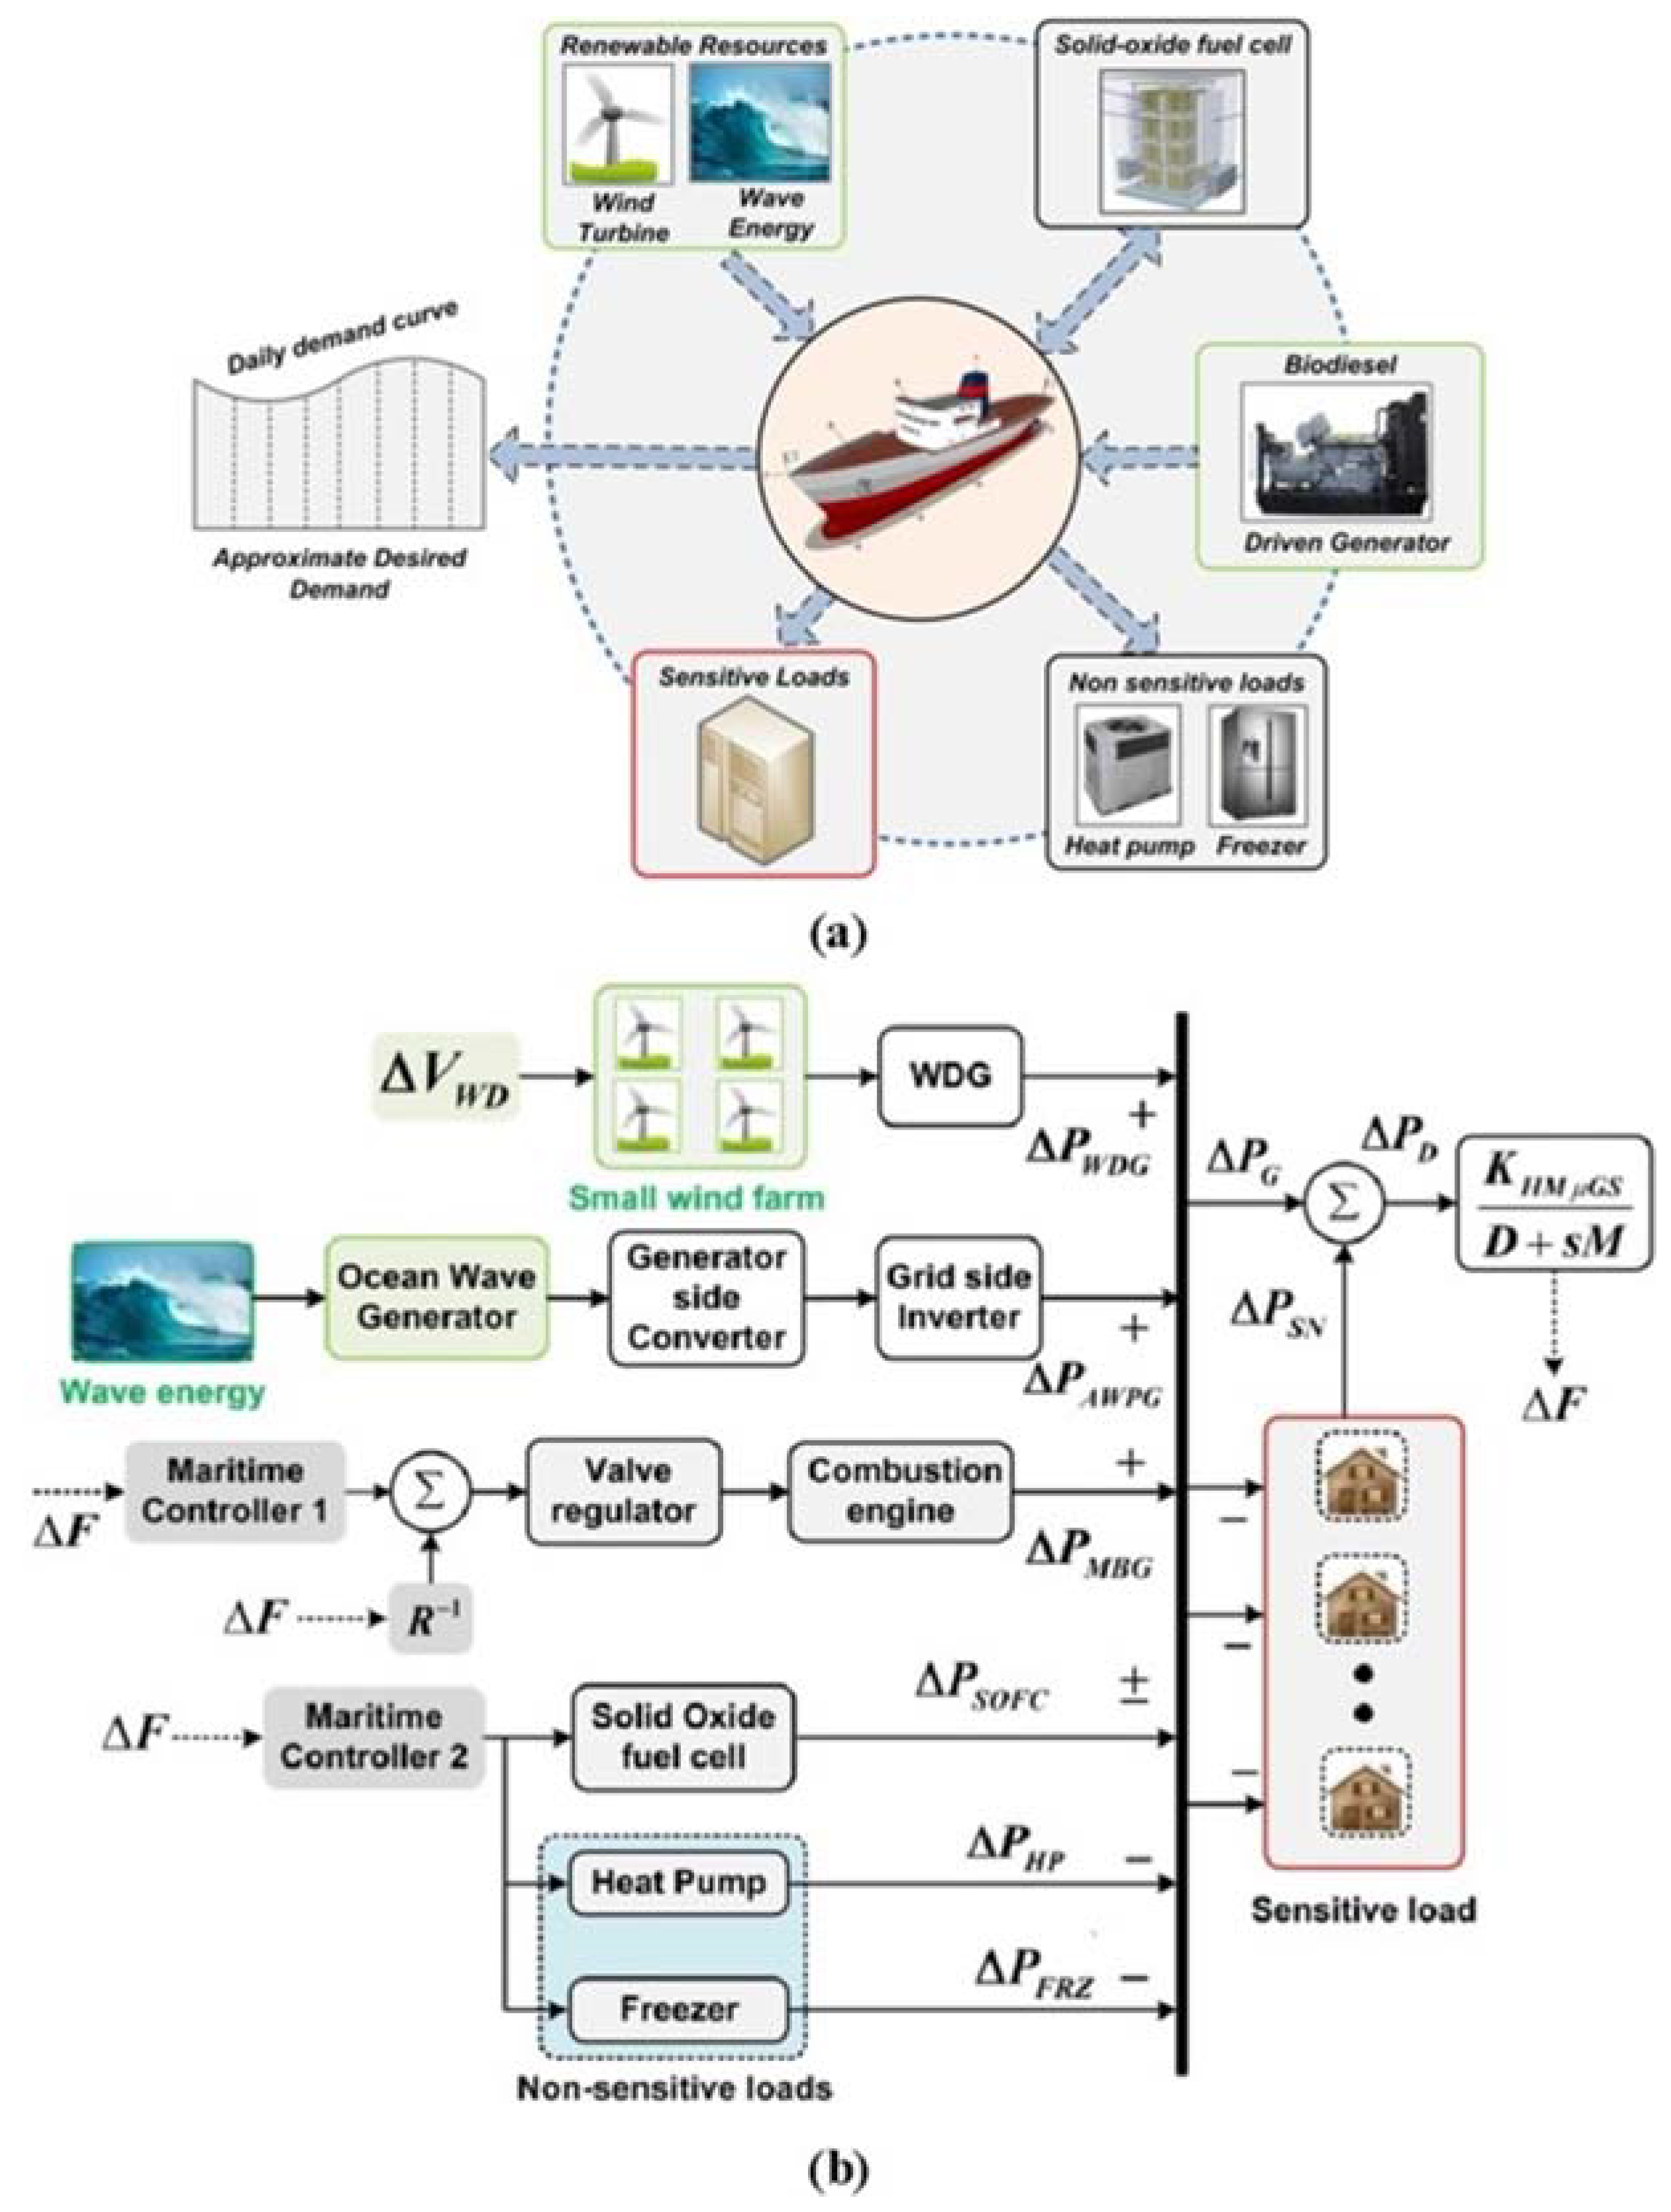
Figure 6 shows a maritime microgrid onboard a ship [
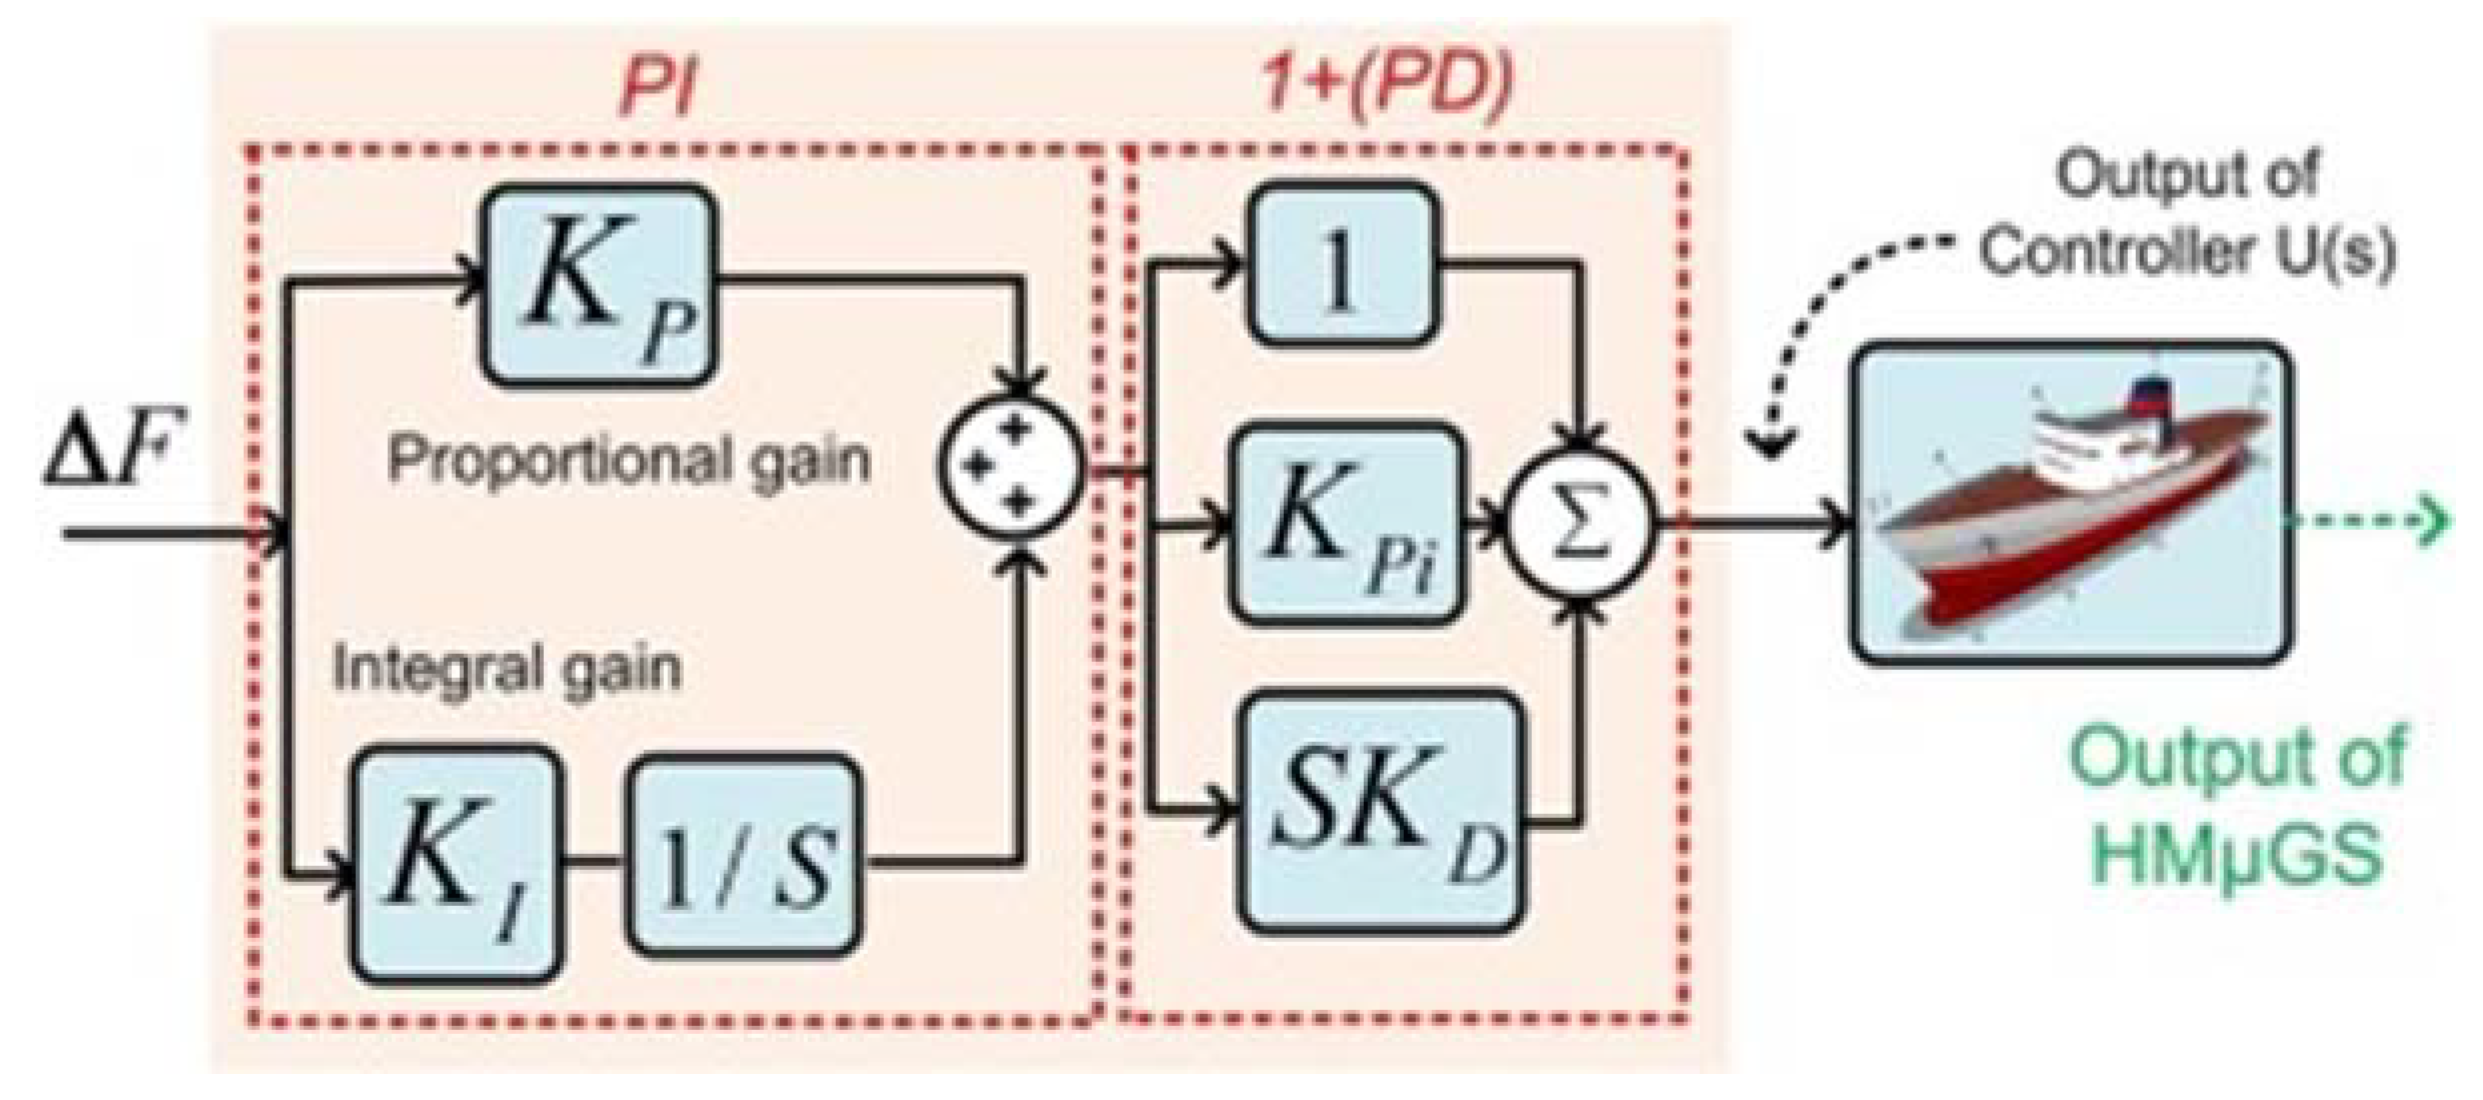
19]. It is specifically designed with renewable energy-based generators, wind and wave generators, as well as a biodiesel generators, a more eco-friendly version of conventional diesel generators. A fuel cell is also included to act as a dispatchable storage unit. The ship has critical and non-critical loads, the latter of which can be capped or shed, if needed. One of the biggest issues in such a stand-alone microgrid that is supposed to operate in the middle of the ocean is the stability of the power system parameters, such as frequency or voltage. In order to achieve stability, two microgrid controllers are designed: the PI-(1 + PD) controller as shown in the
Figure 7. The most important step is the optimization of the parameters within the controller design. That is of utmost importance because this microgrid is vital to the operation of the ship, yet it is supposed to survive on its own. Therefore, margins of error are much smaller, making efficient and effective use of all the available assets all the more crucial.
The optimization is performed with five different nature-inspired algorithms: genetic algorithmic technique (GA), particle swarm technique (PSO), firefly algorithmic technique (FA), cultural algorithmic technique (CA) and grasshopper algorithmic technique (GOA), explained above. The results are benchmarked in
Figure 8. Firstly, the amount of frequency change (∆f) in
Figure 8a shows that all algorithms are able to ensure stable operation of the microgrid. The frequency is stabilized after a disturbance. It is also clear that when GOA optimization is used, the amount of frequency change is almost 90% less and the recovery time is much shorter, about 35% of the time the GA optimization requires.
Figure 8b,c show the amount of energy supplied by the biodiesel generator and fuel cell to achieve this frequency stability, respectively. While there is not much difference in fuel cell output, the biodiesel generator is used much less when GOA optimization is utilized. In other words, GOA optimization is so efficient in finding the desired solution, it can manage to stabilize frequency in a much quicker fashion while demanding much less energy from the biodiesel generator. As
Figure 8b shows, GOA uses 20 to 50% of the energy that the other optimization techniques require, and the duration for which it must be provided is 50 to 70% shorter. The impact of this operation on the non-sensitive loads is shown in
Figure 8d, and GOA optimization shows less impact on their operation.
In short, when optimized with nature-inspired algorithms, the microgrid controllers can ensure stable operation of a stand-alone maritime microgrid in harsh conditions. Moreover, thanks to the power of optimization and high-level of stability, intermittent resources such as wind and wave can also be utilized. This makes the system more environmentally friendly while decreasing greenhouse emissions and operating costs, none of which would be possible without these optimization techniques being used in the design phase of this microgrid and its controllers.
Another example of implementing such optimization techniques in microgrids is using them during operation [
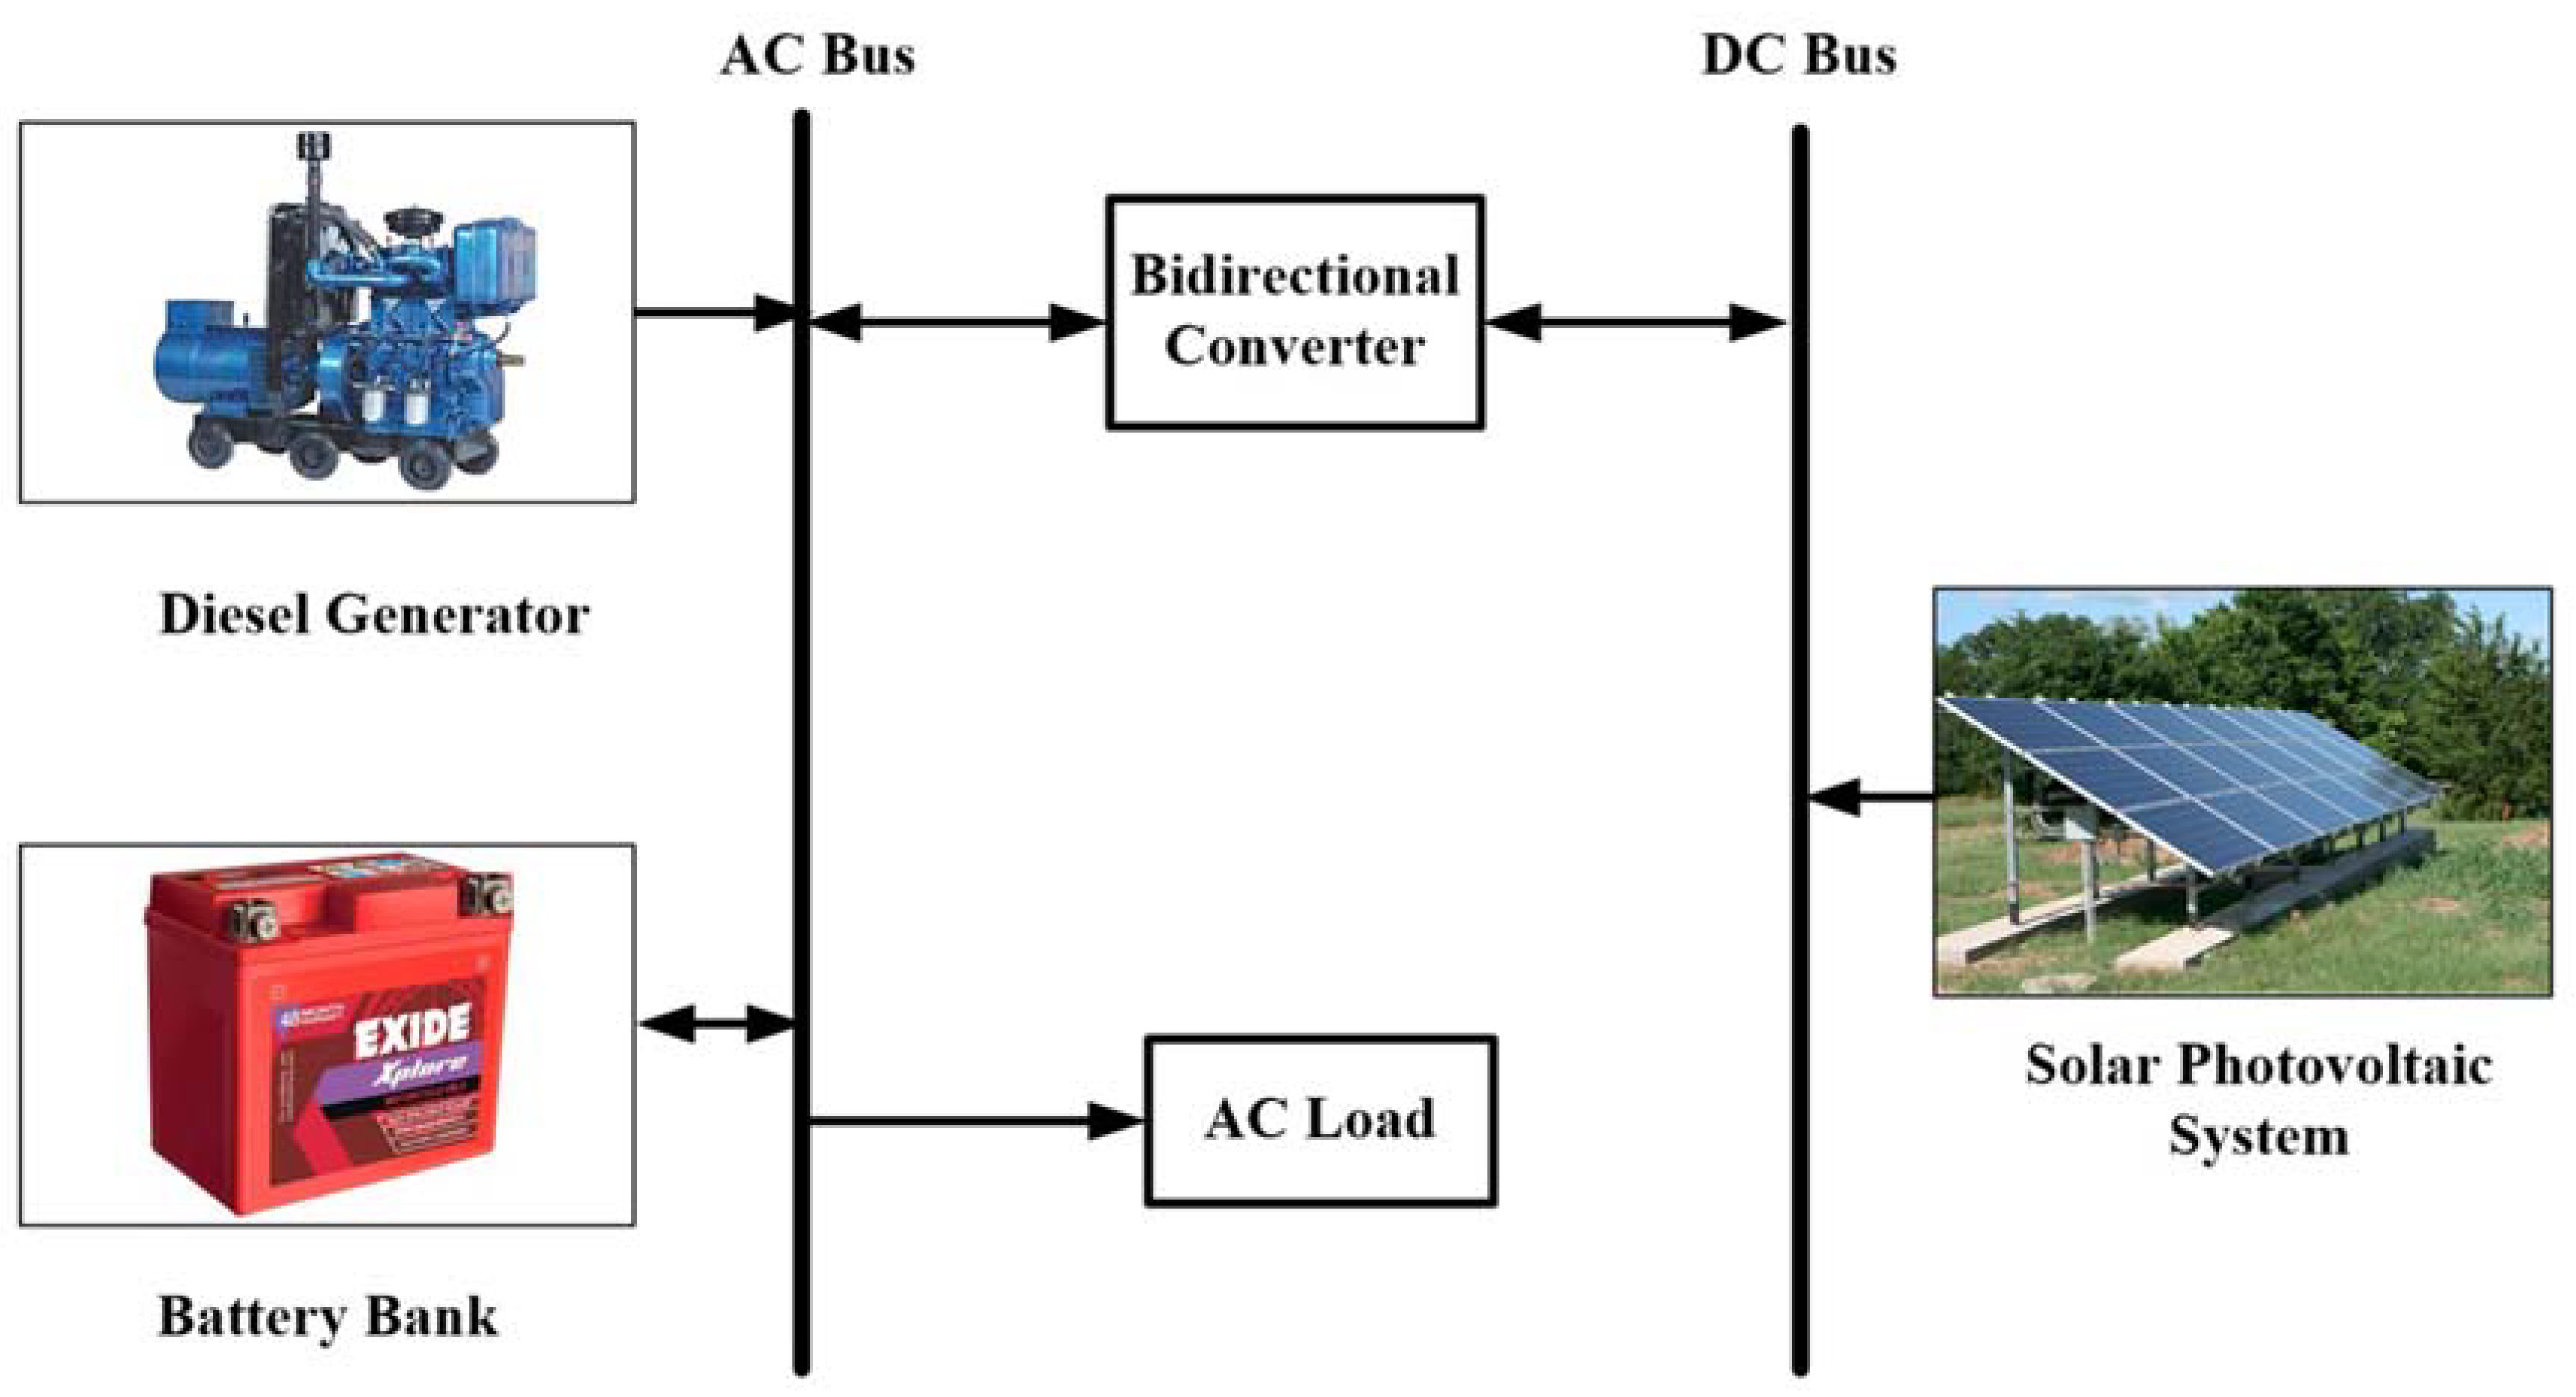
20]. The system given in
Figure 9 is a simple off-grid microgrid that needs to feed a local load. There are two available generators. Diesel generators are reliable and dispatchable but emit greenhouse gases and need fuel purchases. PV panels, on the other hand, are environmentally friendly, generate energy for free while being intermittent during the day and unavailable at night. A battery bank is utilized to find an optimal solution to this generation mix problem. Depending on the solar radiation, load profile and some other factors, the microgrid controller needs to implement a smart cycle-charge strategy.
In this case, a biogeography-based optimization (BBO) technique is implemented to make these decisions. Eighteen different device combinations have been studied where the BBO technique is implemented to monitor the system and instruct the battery pack to charge or discharge for the next hour. Decisions are made hourly while the ultimate goal is to maximize solar radiation capture, minimize diesel generator use and keep the power system stable, despite the intermittent nature of solar energy. As shown in
Table 1, using different combinations of devices and capacities, it is possible to vary the initial investment cost as well as level the cost of energy in the resulting system. As the results show, it is not always trivial to find this optimal mix of generator, PV and battery setup. Using more initial funds for the system setup does not necessarily guarantee that the installed microgrid will be able to capture more renewable energy, thus decreasing the levelized cost of energy as well as environment friendliness index of the system. Combination #13, with the cost of energy highlighted in
bold, has the lowest cost of energy, roughly 20% less, while it also has one of the lowest net present costs, i.e., investment costs needed for the system.
Building on these results,
Table 2 shows how much diesel fuel is utilized to ensure this off-grid microgrid operates in a safe and stable manner, how many CO
2 emissions are released and what is the overall renewable energy fraction of the overall system. When these results are studied, the benefit of the utilized optimization approach becomes more evident. This is because combination #13 does not only have fewer upfront costs and a lower levelized cost of energy, it also has one of the lowest diesel fuel consumption and related CO
2 emissions. It also has the highest renewable energy fraction among all studied combinations. This means, combination #13 is such an optimal solution that it costs less to build and provides cheaper energy to consumers, all the while using less fossil fuels to stabilize the system. Especially for off-grid microgrids utilized in isolated areas, small changes in energy cost or fuel use can make a big difference. Use of these optimization techniques ensures that the same goal is achieved with less investment and less fuel consumption.
As it is obvious from the discussions above, nature-inspired optimization techniques provide significant benefits for power system planning, operation and trading. Thanks to these benefits, nature-inspired optimization is widely studied in the literature and new approaches are constantly introduced. There are different studies that make use of the genetic mutations present in living species [
16], and the internal mechanics of artificial bee colonies [
21] or foraging behaviors of flocks of bird or schools of fish [
22], as well as the Satin bowerbird algorithm [
23]. So much so that, recently, researchers have mapped the spread of novel COVID-19 and the effect of mitigation techniques such as masks and social distancing on to power system optimization domain [
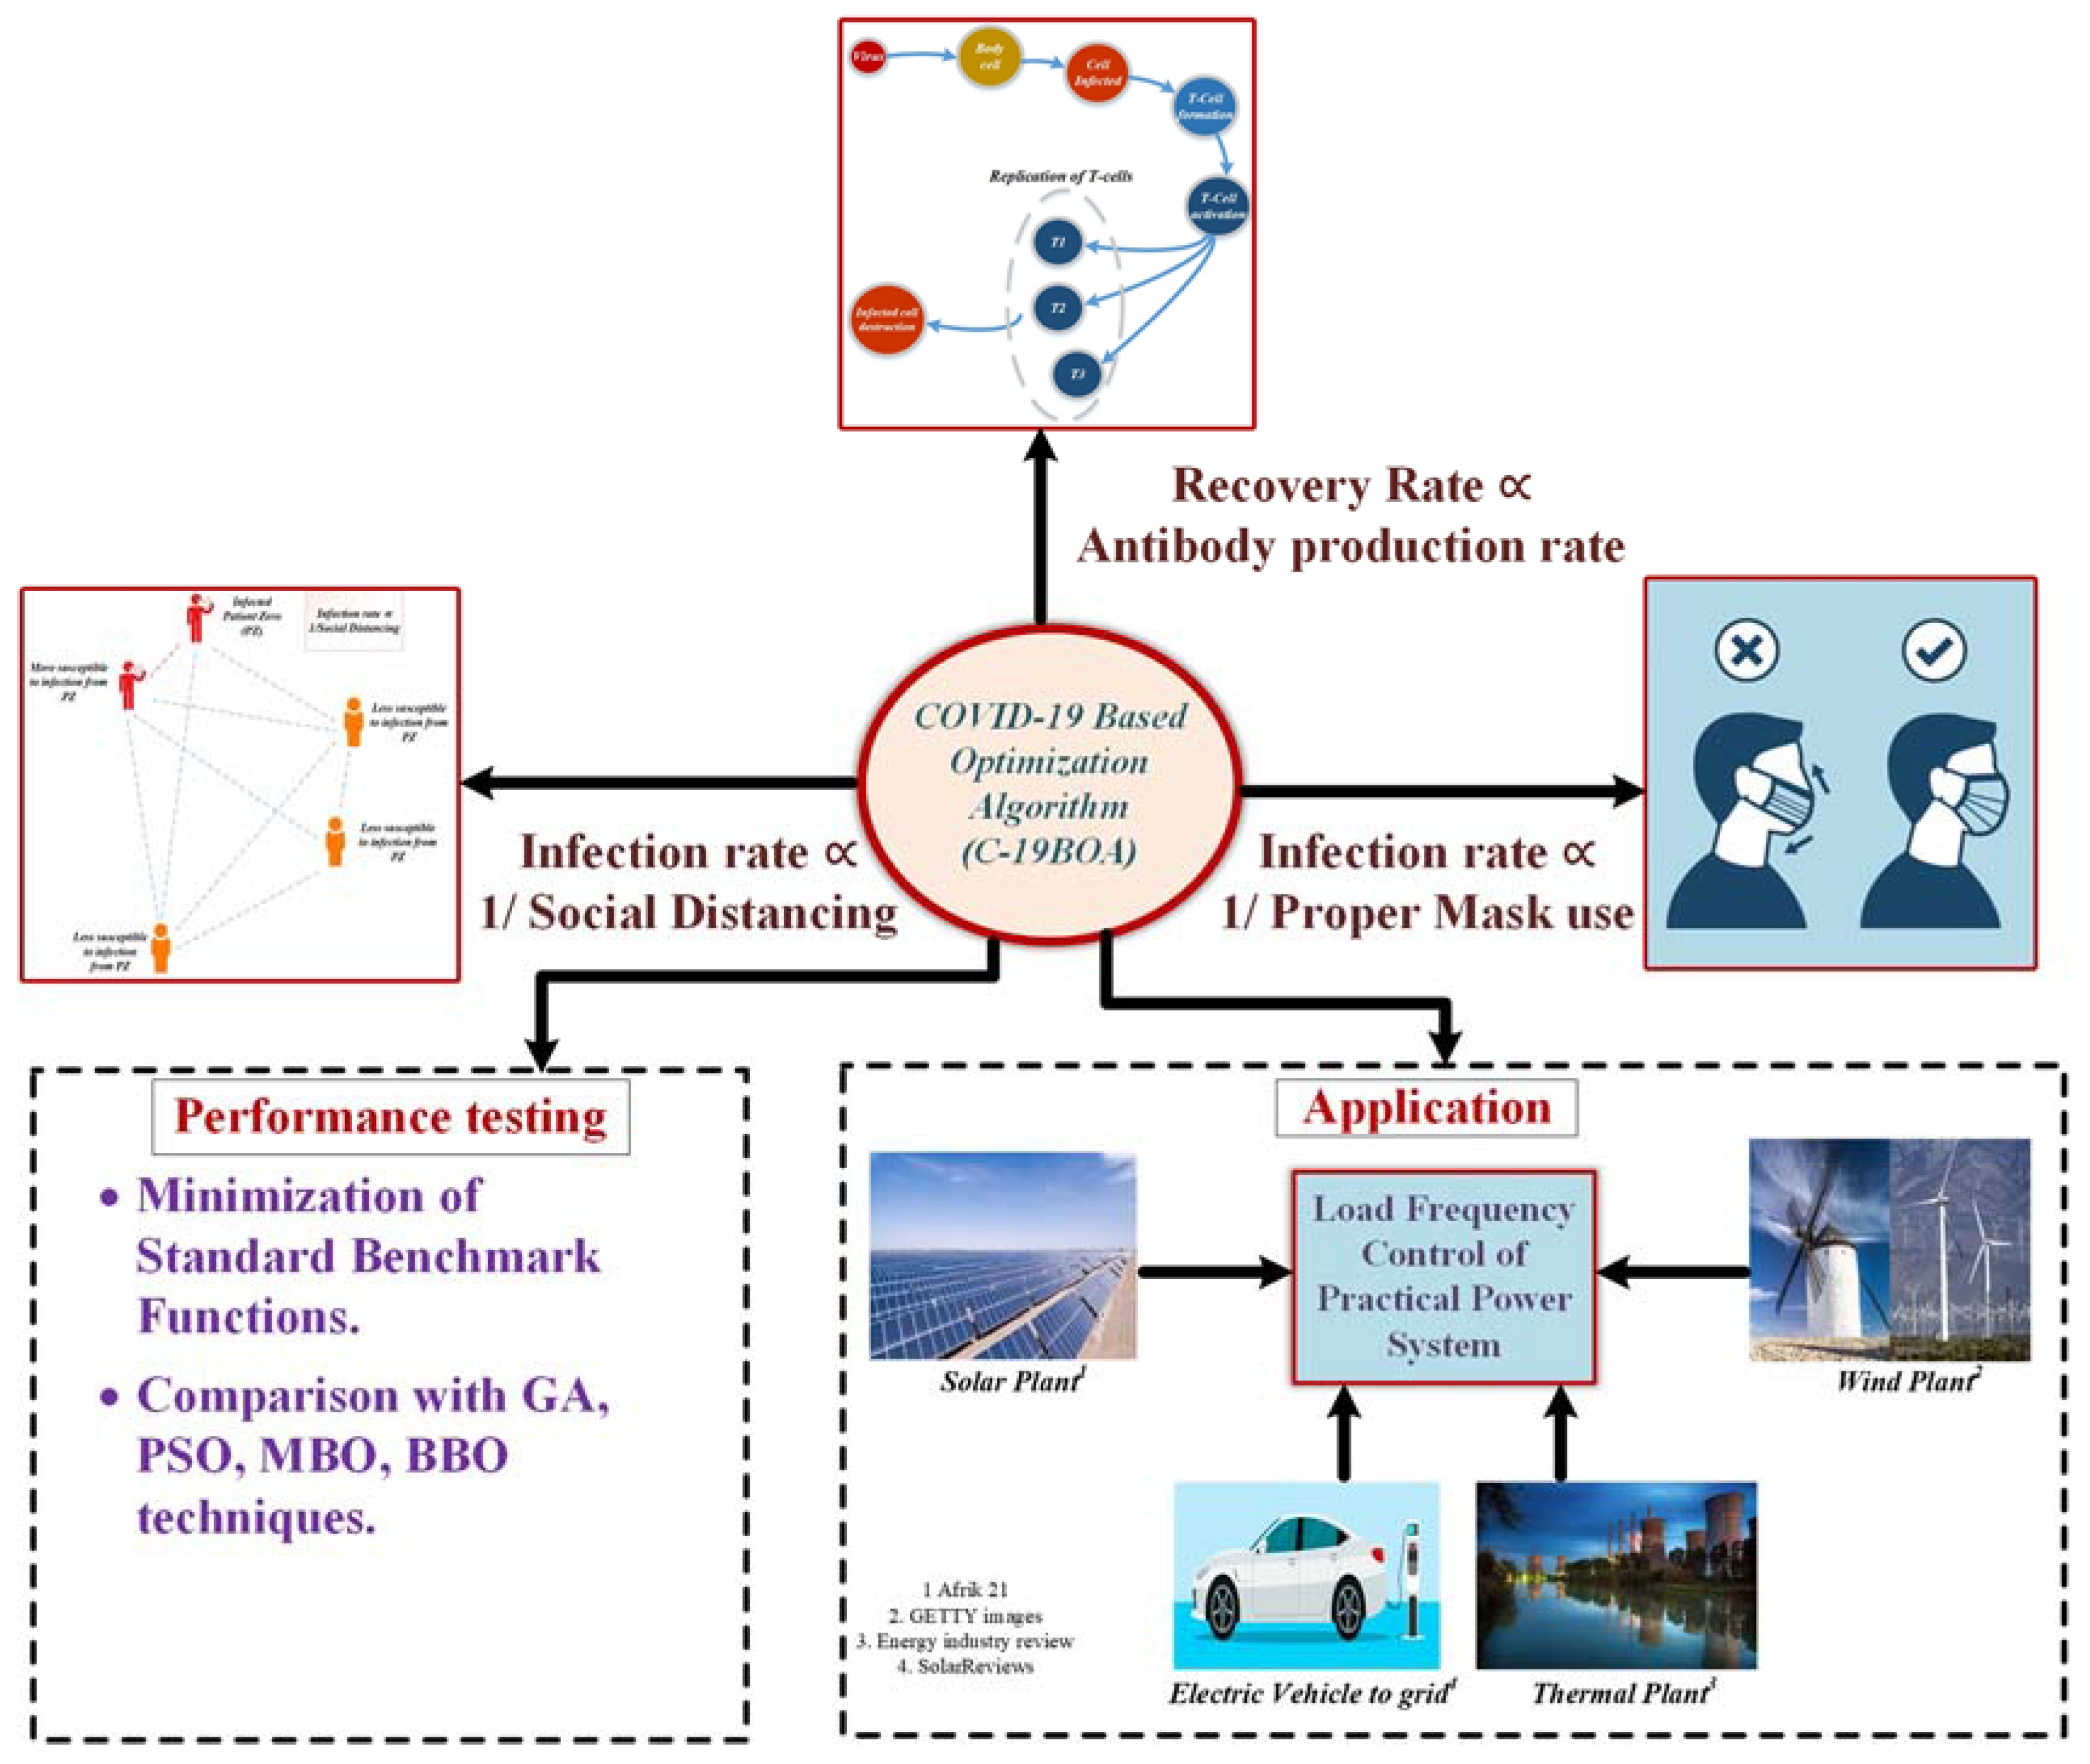
24]. Considering how much COVID-19 changed our lives recently, and how efficient it is in its spread and infection, there is good reason to consider it for power system optimization. As shown in
Figure 10, the modeling is based on use of masks, social distancing and presence of antibodies due to inoculation and being infected with COVID-19.
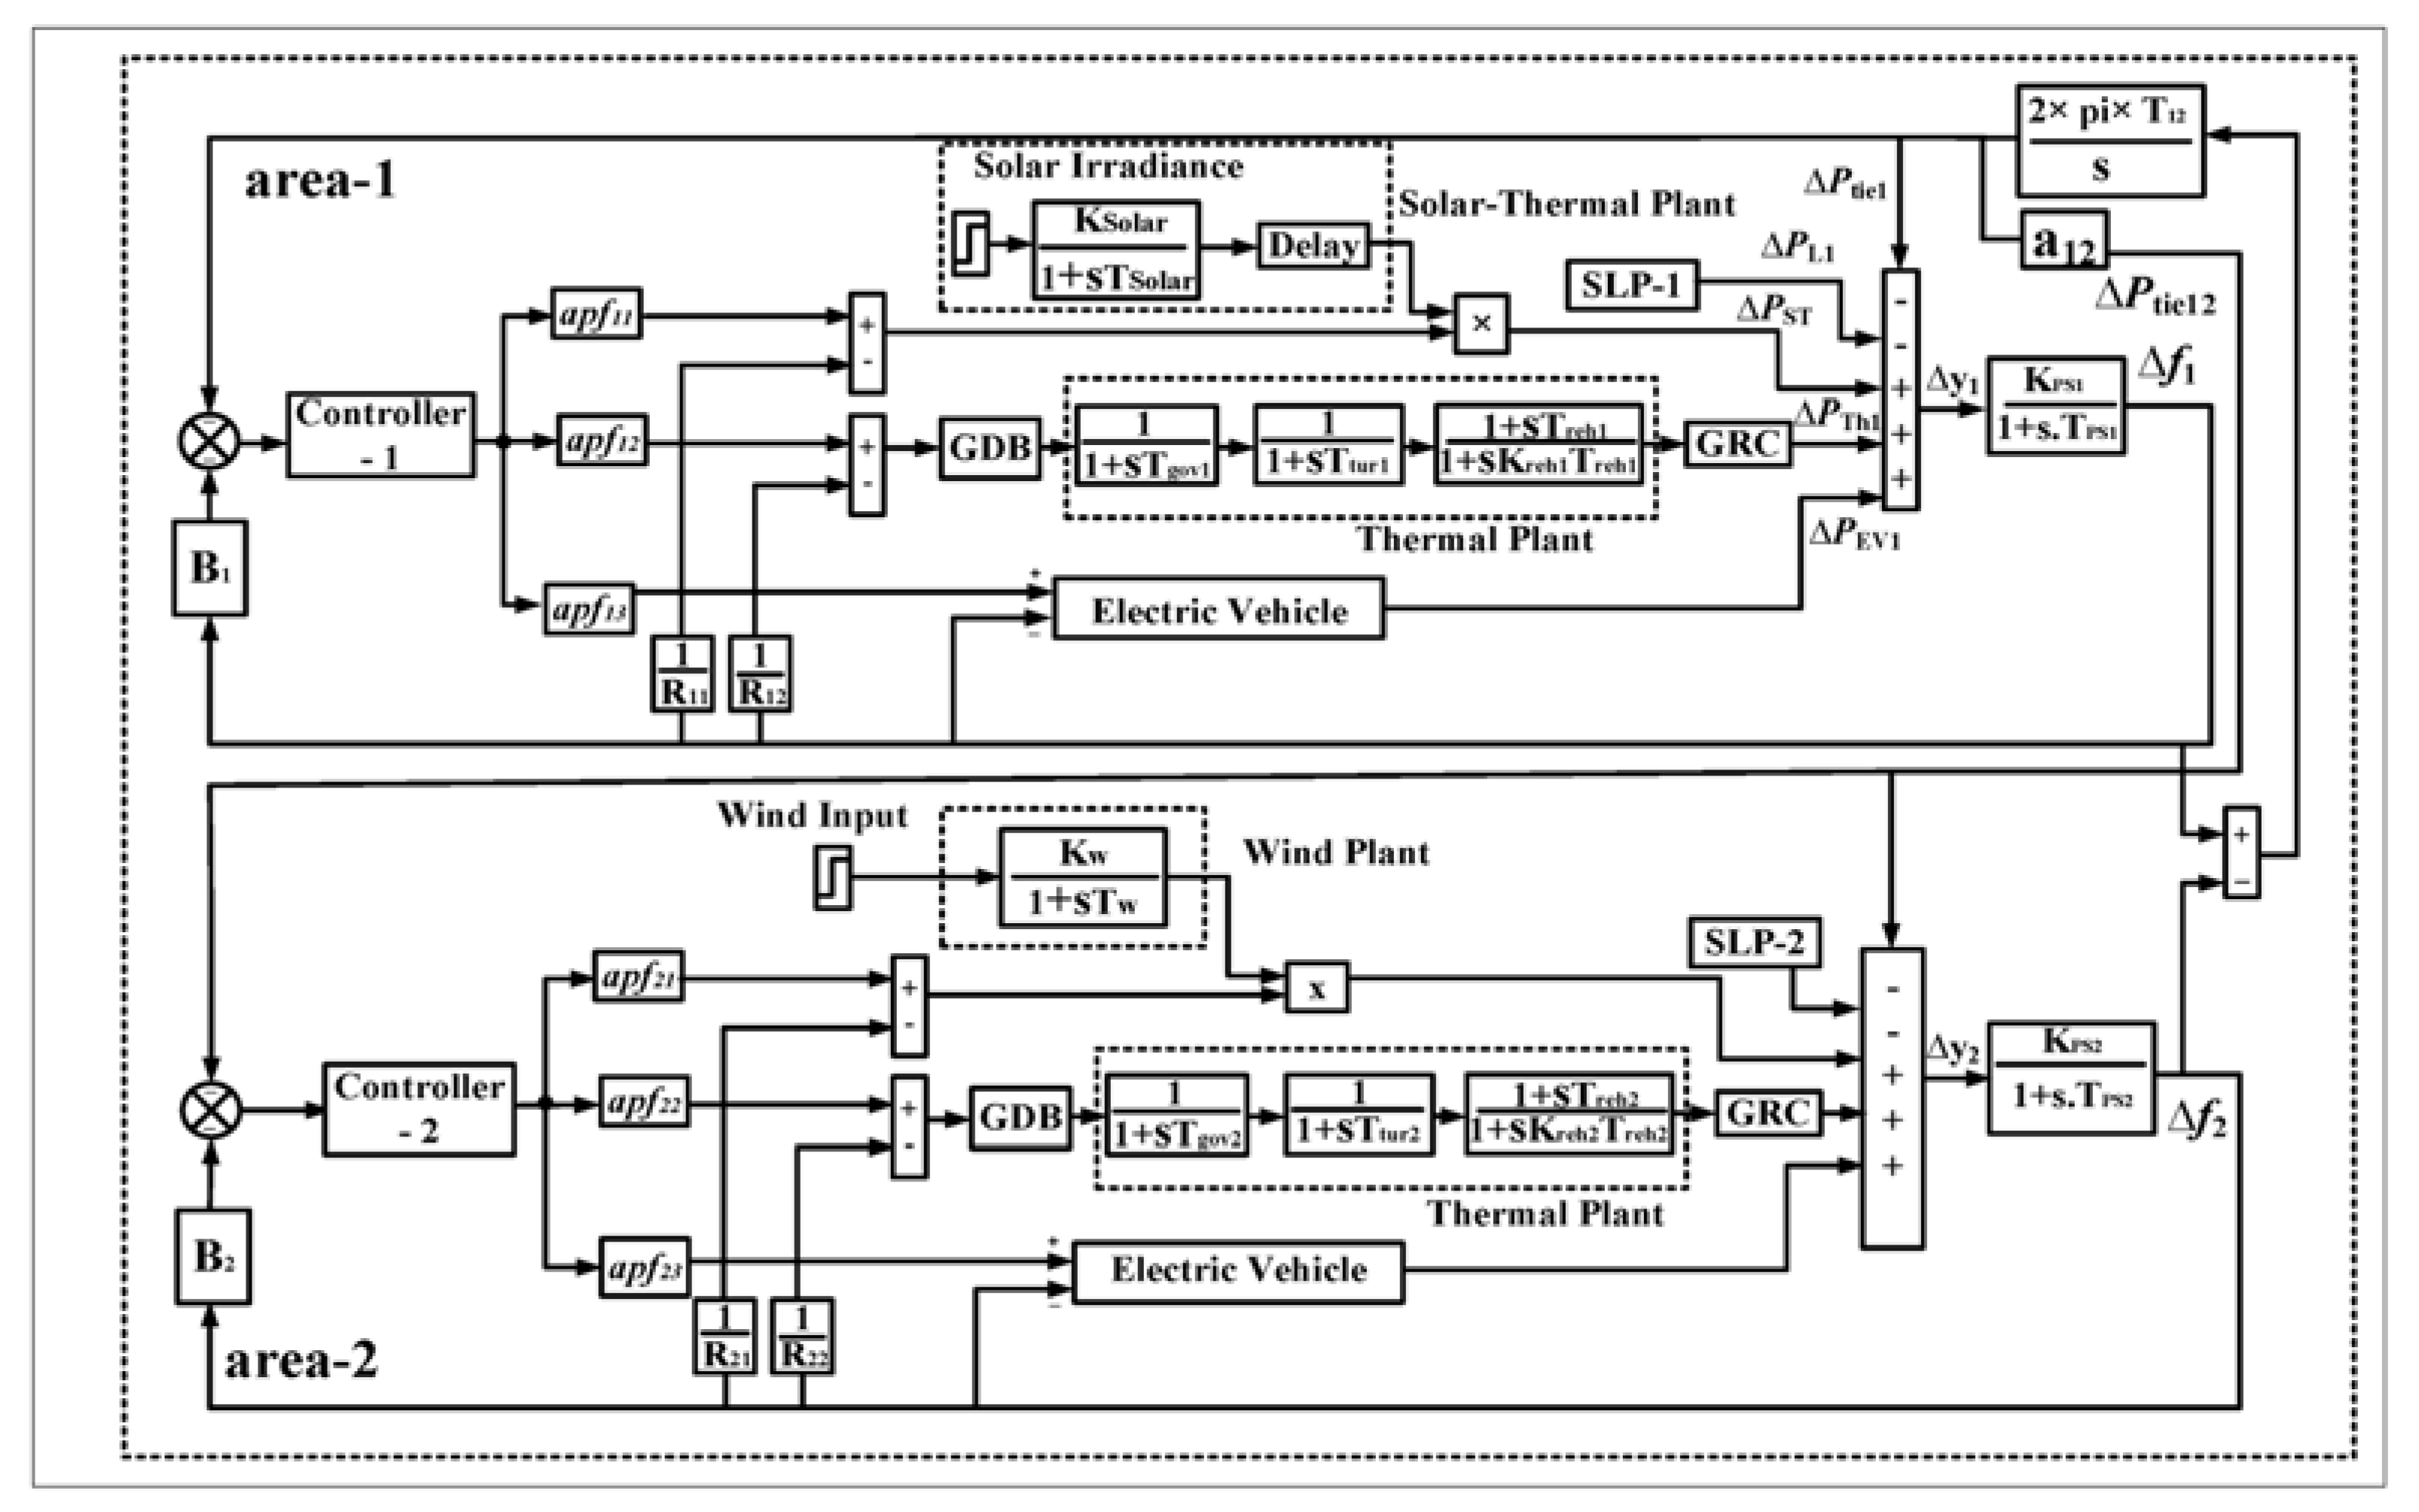
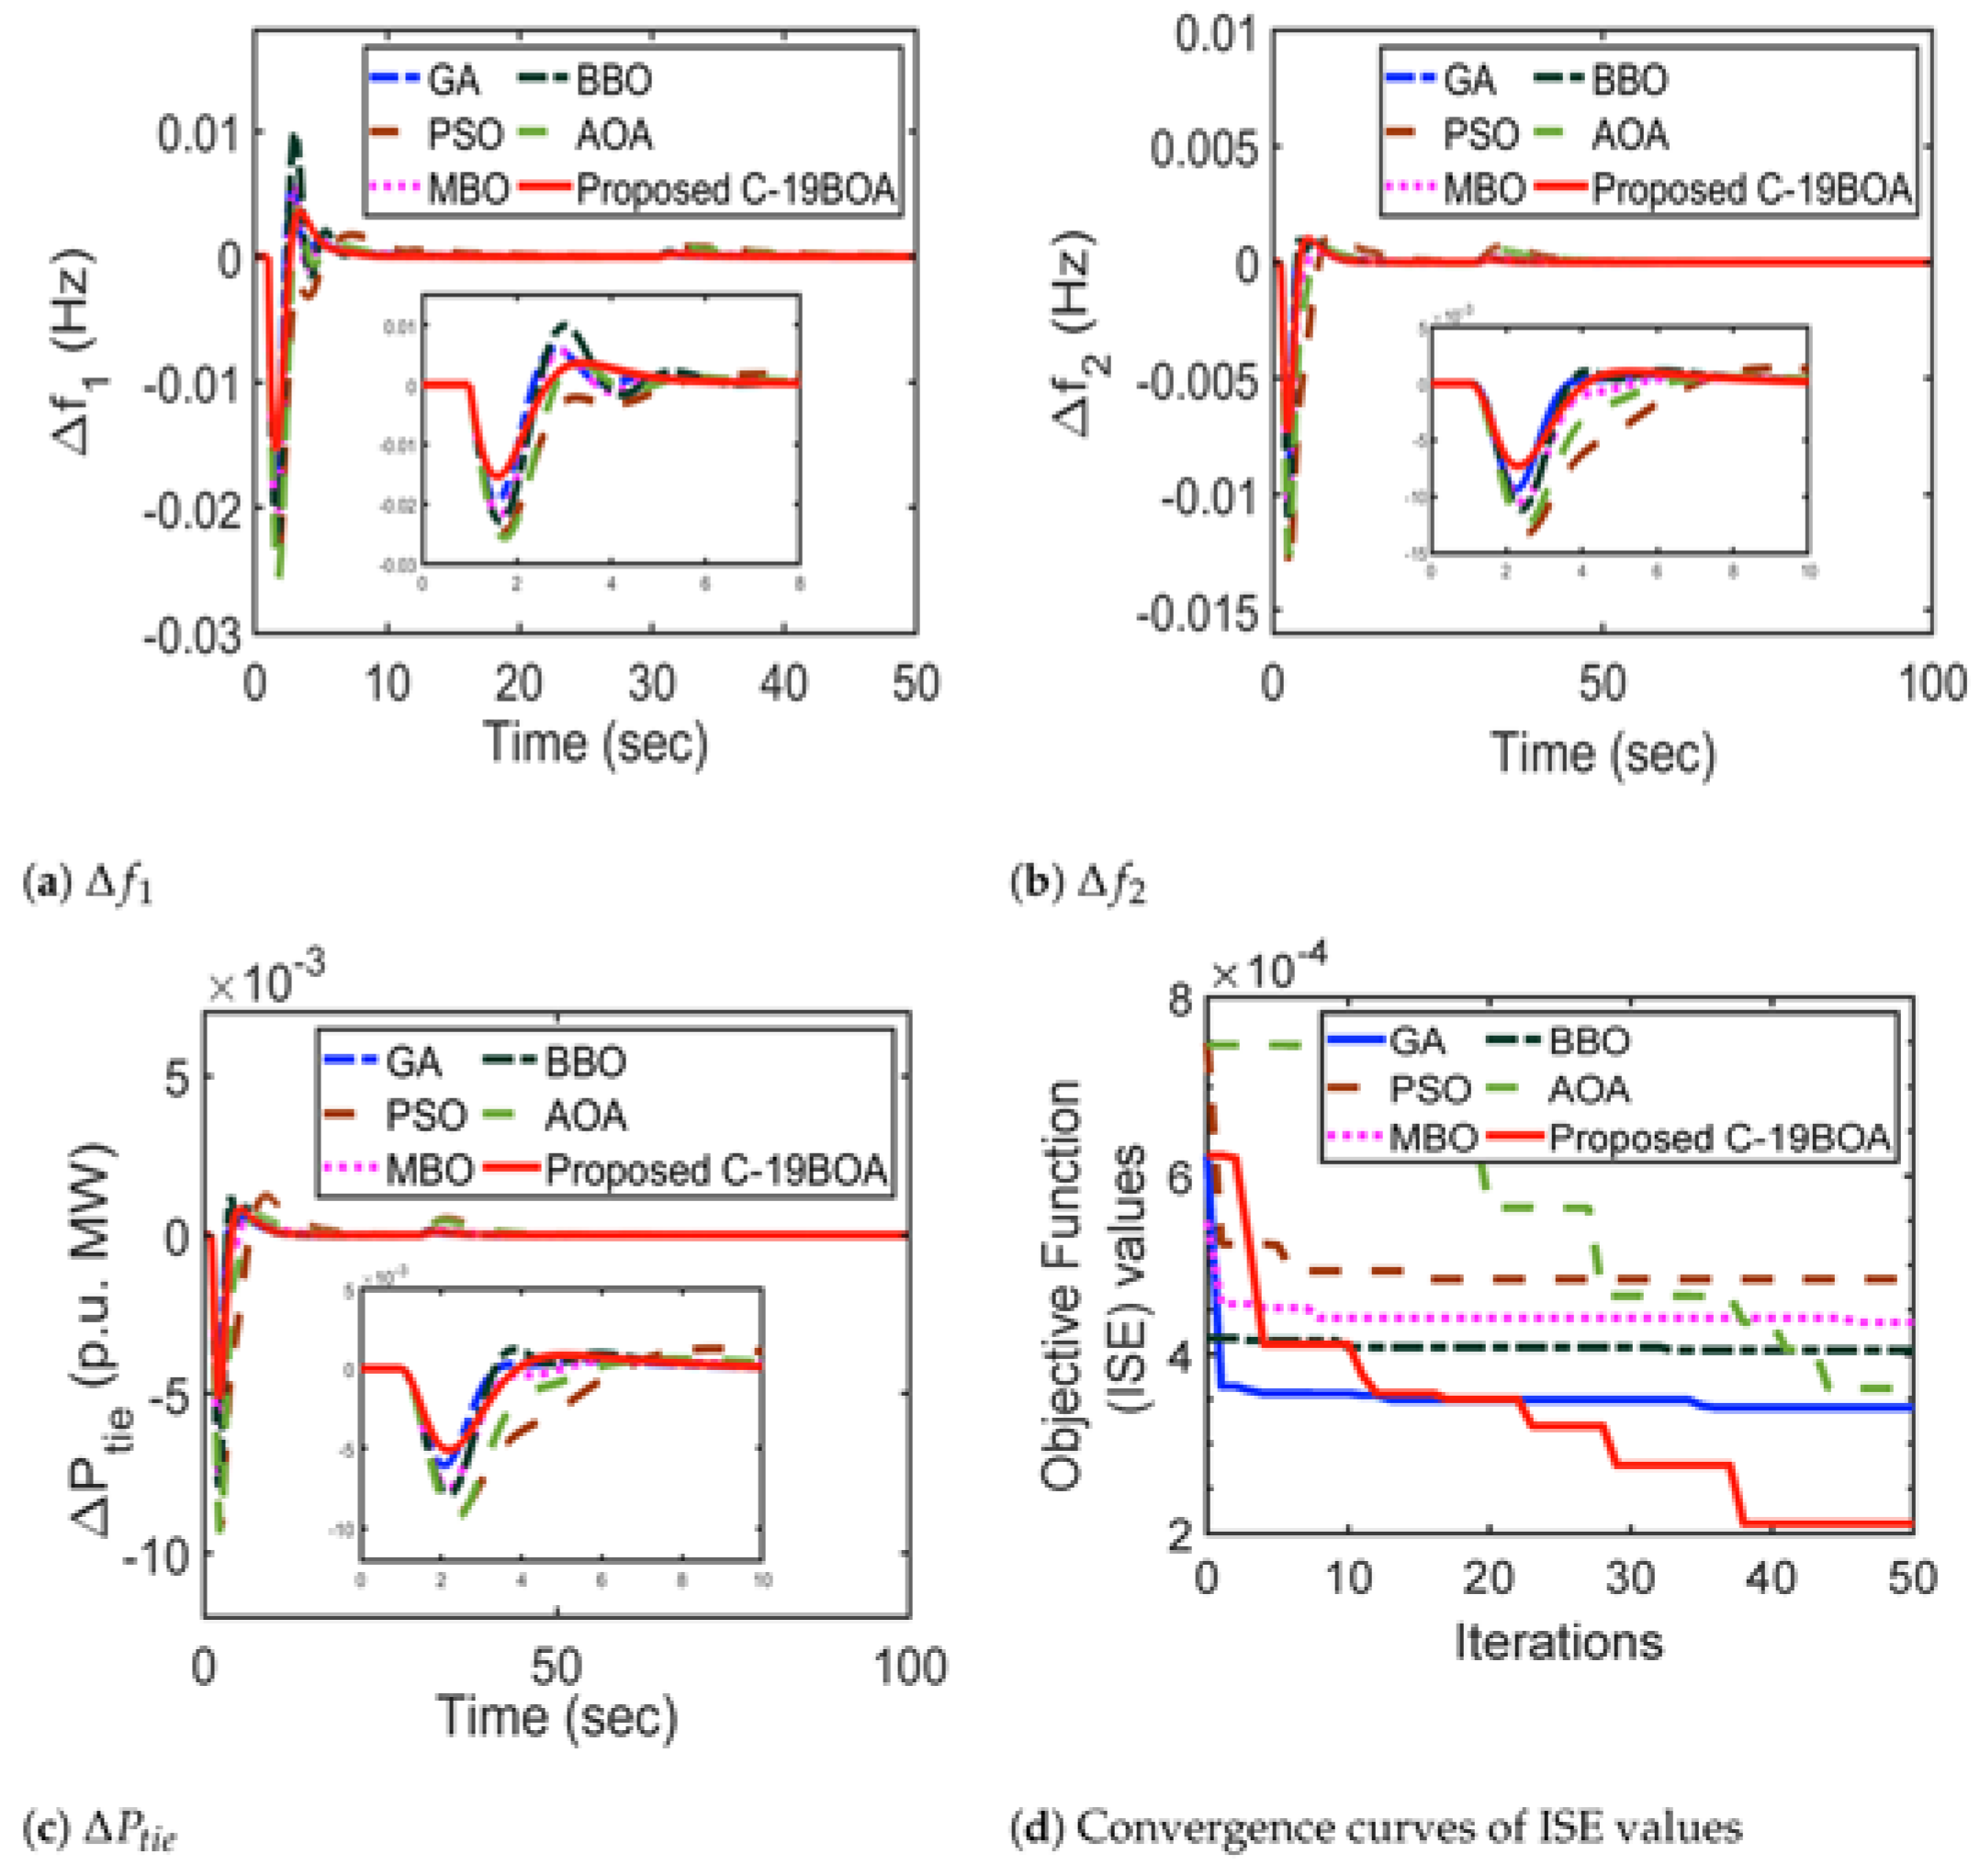
The performance of this novel optimization approach is compared with five other optimization approaches: GA, Biogeography-based optimization (BBO), PSO, Arithmetic Optimization Algorithm (AOA), and Magnetotactic bacteria optimization (MBO). For this benchmark study, a two-area power system with a tie-line is utilized as shown in
Figure 11. The system comprises two areas that include a thermal power plant in each area, solar thermal plant and EVs in area 1, as well as a wind plant and EVs in area 2.
The simulation results are shown in
Figure 12. It is clearly observed in
Figure 12a,b that the COVID-19-based optimization approach ensures that both of the areas are more robust and stable in the face of a frequency event. Frequency waveforms clearly depict that not only the frequency dip, or frequency nadir, is much less as compared to others, but that the overall overshoot in recovery is also less and it takes considerably less amount of time to recover the frequency to nominal value. It is also observed in
Figure 12c that the COVID-19 algorithm can provide this robustness with much less power exchange over the tie-line. This means that the power system components such as backup generators or batteries need to do less work to provide superior frequency stability.


