Abstract
The stable bearing capacity of roadside backfill body (RBB) is the key to control the surrounding rock deformation of gob-side entry retaining (GER) in deep mining. In this paper, slump and uniaxial compressive strength tests were conducted to study the changes of the slump and RBB mechanical properties of RBB fresh mixture under the influence of different percentages of fly ash (FA), river sand, and amounts of steel fiber (SF) admixture. The results show that (1) the slump first increases and then decreases with the increase of the FA proportion, while 20% of FA proportion is the critical point. In addition, SF has little influence on slump. However, when the proportion of FA is 60% and the content of SF is 0.4%, the slump reaches the minimum value of 130 mm. (2) The peak strength and residual strength increase with the increase of the FA proportion, and the strength gain starts to decrease when the FA proportion exceeds 40%. Moreover, SF only has a small effect on the peak strength when the dosage is 0.8%. (3) The post-peak strain difference decreases with the increase of the FA proportion and increases with the increase of the SF content. The addition of SF can make up for the reduced capacity of RBB to post-peak deformation caused by the addition of FA to a certain extent. (4) The addition of fly ash does not change the brittle failure mode of RBB. Furthermore, after the addition of SF, RBB changes from brittle to ductile failure mode. This study can provide experimental and theoretical basis for improving the bearing capacity of RBB and maintaining the stability of GER.
1. Introduction
China is the largest coal consumer in the world, and its coal consumption accounts for more than 56.8% of the primary energy consumption [1]. With the depletion of shallow coal resources in China, coal mining has gradually extended its depth. More precisely, the mining depth of the major coal mines in central, East, and Northeast China reached more than 800 m [2]. In China, there are more than 47 coal mines per 1000 m, and the mining depth is increasing at an annual rate of 10–25 m [3,4]. In the next 20 years, the deep coal mining of China will enter the 1000–2000 m stage, and it will become the new normal [5].
The GER technology reserves the stopping roadway along the edge of the goaf for the mining of the adjacent working face in the process of working face mining. This technology has some advantages, such as high coal extraction rate, small amount of roadway excavation, and good ventilation condition of working face [6]. It has been an important technological development direction of coal mining since it was used in China in the 1950s [7]. The key of the GER technology to control the deformation of roadway surrounding rock is the stable bearing capacity of side backfill (RBB) [8]. However, when the GER technology is applied in deep mining, due to the complex deep geological conditions, high in-situ stress, and severe rock mass fracture [9], RBB is affected by high stress and mining, which causes instability and caving, thus damaging the roadway and threatening the safety of the underground personnel and equipment.
Many studies tackled the stability of RBB. For instance, Meng et al. [10] used the UDEC software to conduct a numerical simulation study on the fracture development law of RBB under static and dynamic combined loads. They deduced that static loading had a greater damage effect on RBB compared with dynamic loading. Zhao et al. [11] built the roof sublevel subsidence structure and RBB mechanical model. They obtained the roof migration and RBB stress laws under different goaf backfilling rates, different RBB widths and strengths using the FLAC3D software. Wu et al. [8] used the UDEC Trigon model to study the development and distribution evolution mechanism of RBB cracks at different distances from the working face. They deduced that the failure of RBB was mainly caused by tension cracks, and a reasonable length–diameter ratio of RBB can increase the yield zone area and reduce the failure degree. Ning et al. [12] took the longwall working face of a coal mine in Xinjiang as the research background, studied the mechanism of macroscopic shear failure of RBB by developing the mechanical model of RBB supporting structure, and used the new roadway backfill truss supporting structure, which significantly improved the shear strength of the roadway side supporting structure. Gong et al. [13] designed RBB with a flexible cushion to provide adaptive ability to the basic roof deformation of roadway, which reduces its stress concentration degree.
Most of these studies on the stability of RBB focus on the analysis of its force, while the problems of brittleness, easy breaking, and crumbling that exist in traditional RBB still exist [14,15,16,17]. Cement, river sand (RS), and fly ash (FA) are commonly used to construct backfill body [18,19,20]. Sometimes crushed mine rocks are added, which not only reduce the storage of waste on the surface and in accordance with the idea of waste recovery, but also reduce the cost of backfilling and increase the strength of backfill body [21,22,23,24,25]. In addition, FA is currently used to replace cement [25,26,27]. When the cement content is constant, there are few studies on the influence of the proportion of FA and fine aggregate river sand on the workability and mechanical properties of backfill. In addition, steel fiber (SF) is often used to improve the brittleness of concrete [28,29,30], and there are few studies on the influence of the SF incorporation on the workability and mechanical properties of backfilling materials.
In this study, the ratio of FA to RS and the dosage of SF were used as variables to assess the influence of FA on the workability and mechanical properties of RBB fresh mixture. The slump test was conducted to discuss the variation pattern of RBB fresh mixture slump under the influence of different percentages of FA, RS, and SF admixture. The influence patterns of different FA to RS occupancy ratios and SF doping on the peak strength, residual strength, post-deformation, and damage modes of RBB were analyzed using uniaxial compressive strength (UCS) tests. The results of this study have important implications for the optimization of the carrying capacity of RBB.
2. Gob-Side Entry Retaining Technology with Roadside Backfill Body
The gob-side entry retaining technology retains the mining roadway of the working face for the next district of the working face by using RBB support and other technical means in the mining process of the working face, as shown in Figure 1. The construction process of RBB is: (1) According to the designed RBB size (the height is generally determined by the mining height and the deformation of roadway roof, and the width is determined by the calculation of field geology and mining conditions) and a certain amount of surplus set aside to determine the size of the filling bag. Based on this, the supporting reinforcement components such as steel mesh are processed and the filling bag is fully expanded at the filling site. Following that, the filling bag is fixed with steel mesh around it. (2) The filling pump station is arranged on the ground or underground mining area. The cementitious materials, fine aggregate, coarse aggregate and water are made into cement slurry in the filling pump station according to design proportion. (3) The prepared cement slurry is transported to the filling site of the tailgate and headgate through the slurry pipeline and is filled from the slurry inlet of the filling bag. When the filling is completed and the backfilling body has a certain strength, RBB is formed.
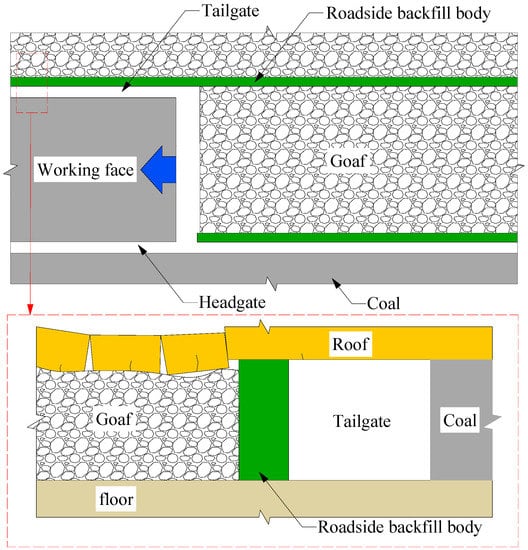
Figure 1.
Technical diagram of roadside backfill body.
3. Materials and Methods
3.1. Raw Materials
3.1.1. Cementitious Materials
The cementitious materials are cement and FA. A 42.5 grade ordinary Portland cement (OPC) from a cement factory in Xuzhou City was considered. X-ray fluorescence spectrometry (XRF, Thermo Scientific ARL Perform’X (Produced by Thermo Fisher Scientific, Waltham, MA, USA)) was used to analyze the chemical composition of the raw materials. The obtained results are presented in Table 1. The main chemical components of OPC are CaO, SiO2, and Al2O3, accounting for 53.91%, 23.49%, and 7.81%, respectively. FA was taken from a coal-fired power plant in western China. The main chemical components of FA are SiO2 and Al2O3, respectively, accounting for 53.08% and 27.70%, as shown in Table 1. The particle size distribution of OPC and FA is shown in Figure 2. The OPC and FA particle sizes are mainly distributed in the ranges of 2.443–53.952 µm and 3.306–84.539 µm, respectively.

Table 1.
Chemical composition of raw materials, in weight %.
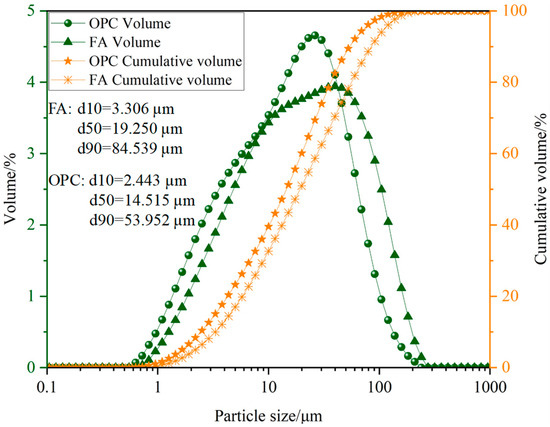
Figure 2.
OPC and FA particle size distribution.
3.1.2. Aggregate
The fine aggregate is composed of continuous graded RS with different contents of particle size less than 4.75 mm, among which the graded RS is shown in Table 2. The main crystalline phases of RS are quartz, feldspar, calcite, and illite [31]. The coarse aggregate is 5–10 mm coal gangue (CG). The main chemical components of CG are SiO2, Al2O3, and CaO, respectively, accounting for 33.51%, 18.83%, and 21.43%, as shown in Table 1.
Table 2.
Grading of RS.
3.1.3. Steel Fibers and Water
SF is corrugated, purchased from an industrial fiber manufacturing company in Jiangsu Province, China, and made by ingot milling process. The length and diameter of the SF are 25 mm and 0.65 mm, respectively. It should be noted here that the selection of SF length and diameter is based on the study of Li et al. [32]. Its uniaxial tensile strength is greater than 600 MPa and its density is 7850 kg/m3.
Mixing water for Xuzhou ordinary tap water.
3.2. Experimental Design
The proportion of FA is a variable factor in the ratio of RBB material. Note that in this study, the ratio of FA to the sum of FA and RS is used. The other variable factor is the dosage of SF. Each variable factor is divided into four levels (Table 3). The concentration and mass fraction of the fixed material is 85% [32].
Table 3.
Proportioning variable factors and level.
Based on the variable factors in Table 3 and the levels of each factor, 16 groups of mix ratios were set. The quality coordination of each group, with OPC quality as base 1, is shown in Table 4.
Table 4.
Experimental scheme design.
3.3. Sample Preparation and Curing Conditions
The stepwise stirring method was used to stir the slurry as evenly as possible. RS and CG were first poured into the blender and dry-stirred for 30 s. Water was then poured into a blender and blended for 30 s. Afterwards, one third of SF was sprinkled into the blender and stirring was performed until it became visible to the naked eye. FA was added to the blender and blending was performed for 30 s. The OPC was then added to the blender and blending was performed for 30 s. Finally, the remaining SF was evenly spread into the mixer for mixing until the slurry became paste-shaped and the fiber aggregation became invisible to the naked eye [32].
The stirred slurry was poured into the mold with a length, width, and height of 100 mm, 100 mm, and 100 mm. After curing at room temperature for 24 h, the mold was removed and then put into a standard curing room with a temperature of 22 °C and relative humidity of 97%. The curing lasted until the standard curing age of 28 days. A total of 48 samples were made in the test. The specific test process is shown in Figure 3.
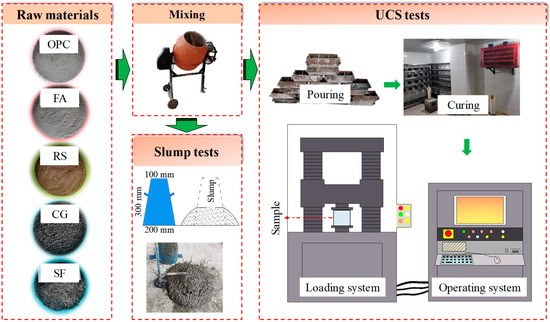
Figure 3.
The experimental procedure.
3.4. Methods
3.4.1. Slump Tests
A slump test was conducted according to the ASTM C 143 [33] guidelines to study the impacts of different contents of FA and SF on the performance of RBB backfilling materials at a constant material concentration of 85% mass fraction. The slump test was performed for 16 combination ratio schemes, and the average value of each scheme was tested 3 times. The test result was accurate to 5 mm.
3.4.2. UCS Tests
The cube samples with a side length of 100 mm were taken out of the standard curing room for UCS test. The number of test samples were 48. The samples were taken out of the standard curing room for the UCS test. The MTS electro-hydraulic servo rock loading instrument was used. The test system used displacement-controlled loading at a loading rate of 0.6 mm/min. The final UCS result is the average UCS of three samples with the same composition.
4. Results and Discussion
4.1. Workability Analysis
Table 5 presents the slump test results of RBB fresh mixture with different FA percentages and SF admixtures, for a fixed material concentration mass fraction of 85%. It can be seen that the distribution of slump values ranges between 130 mm and 270 mm. The impacts of the FA and SF content on the slump are shown in Figure 4. It can be seen from Figure 4a that the FA proportion significantly affects the slump value. In the range of 0–60%, the slump value first increases and then decreases with the increase of the FA proportion. When the FA proportion is 20%, the slump reaches its maximum value, which indicates that an appropriate FA proportion can improve the slump value, while an excessive FA proportion will sharply reduce it. This trend is consistent with the results of Hu et al. [34]. The increase of the FA ratio increases the flow performance of the fresh mixture, due to the fact that the FA particles fill the voids between the RS and reduce the porosity. However, when the proportion of FA is too high, especially when it exceeds 40%, the slurry flow capacity will decrease. This is mainly due to the fact that when the FA increases, a large amount of water is wrapped by flocculated or aggregated FA particles, which fails to lubricate the surface of the particles [35].
Table 5.
Slump value.
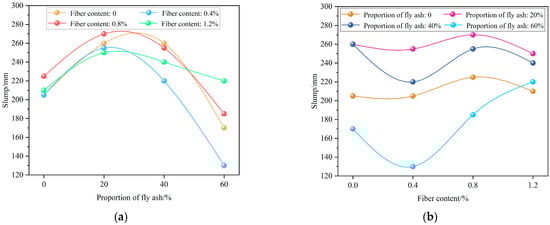
Figure 4.
Influence of the FA (a) and SF (b) contents on the slump.
It can be seen from Figure 4b that the influence of the SF admixture on the slump is small compared with that of FA. In addition, when the FA proportion is 60%, the change of SF admixture has a clear influence on the slump. That is, when the FA proportion is 60%, the slump first decreases and then increases with the increase of the SF admixture, and the minimum slump is 130 mm when the SF admixture is 0.4%. The test results show that when the FA ratio is low, the incorporation of SF has no clear effect on the slump value of the material. On the contrary, it has a clear nonlinear effect on the slump value when the FA ratio is high. This is due to the fact that when the FA ratio is high, the mixture density is large, and the fiber will hinder the movement of the mixture, which further reduces the fluidity of the mixture [36,37]. Note that in this experiment, except for the A3 and A12 groups, the slump values of all the matching groups are greater than 180 mm, showing acceptable transport workability [38]. Through the above analysis, it can be seen that when FA accounts for more than 60%, the content of steel fiber should not be 0–0.4% in mine practice (group A3 and A12 do not meet the workability demand).
4.2. Peak Strength Analysis
The peak strength of 16 test groups is shown in Figure 5. The peak strengths of different groups are significantly different. The highest peak strength of 14.89 MPa is for the A11 group, while the lowest one of 7.49 MPa is for the A14 group. The variable factors that affect the peak strength of the sample are mainly the FA proportion and SF dosage. To determine the influence degree of different variable factors on the peak strength and explore its change rule, the proportion of FA and the dosage of SF are considered as independent variables and the peak strengths are all considered as dependent variables for analysis. The change rule of the peak strength is shown in Figure 6.
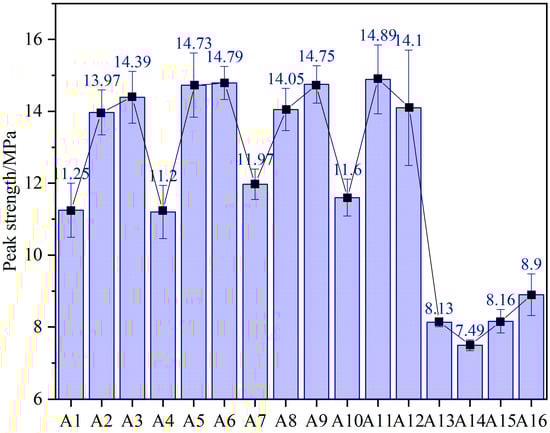
Figure 5.
Peak strength of 16 experimental groups.
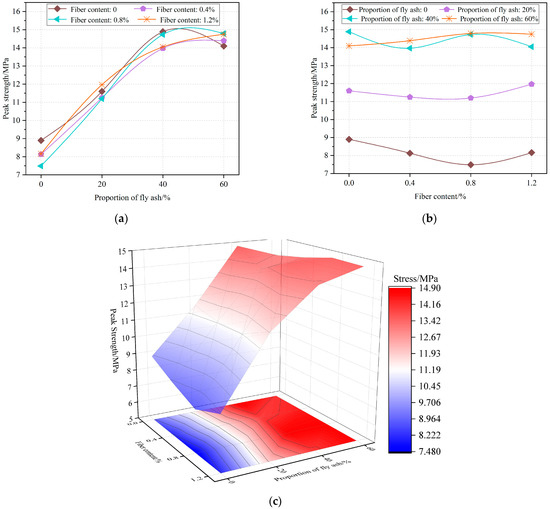
Figure 6.
Impacts of the FA ratio (a) and SF content (b) on the peak strength, and the interactive effect of the FA proportion and SF dosage on the peak strength (c).
It can be seen from Figure 6a that the proportion of FA significantly affects the peak strength of RBB. An appropriate increase of FA proportion has a clear effect on increasing the peak strength of the backfilling body. However, this effect does not continue to increase with the increase of the FA proportion, and the peak strength enhancement effect sharply decreases when the FA proportion reaches 40%.
It can be observed from Figure 6b that the influence of the SF content on the peak strength is small. However, a certain rule can still be obtained. More precisely, (1) when the proportion of FA is 0% and 20%, the peak strength curves first decrease and then increase, and the 0.8% SF content is the turning point. (2) When the proportion of FA is 40%, the curve first decreases, then increases, and finally decreases again. Compared with the variation trend of the curve with proportions of FA of 0% and 20%, it can be deduced that the peak strength increases at 0.8% SF content. (3) When the proportion of FA is 60%, the curve first increases and then decreases. Compared with the changing trend of the curve with proportions of FA of 0% and 20%, it can be deduced that the peak strength increases when the SF content is 0.4% and 0.8%. It can also be seen that the peak strength slightly changes when the SF content is 0.8%.
It can be seen from the interactive effects of the FA ratio and SF content on the peak strength (Figure 6c) that the FA ratio has a greater influence on the peak strength of backfill, compared with the SF content, and thus the latter is the secondary factor affecting the peak strength of backfill.
4.3. Residual Strength Analysis
Due to the overburden fracture and collapse of goaf, RBB will inevitably break. Therefore, it is of great significance to study the backfill with high residual strength for the maintenance of underground safety. The residual strength of 16 test groups is shown in Figure 7. It can be seen that the residual strength of samples with different proportions greatly varies. In addition, the residual strengths of the A5, A6, and A9 groups reach 5.3 MPa, 5.4 MPa, and 5.2 MPa (greater than 5 MPa), respectively.
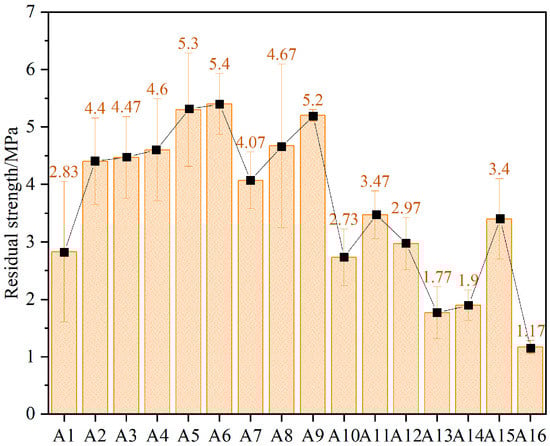
Figure 7.
Residual strength of 16 test groups.
However, the residual strengths of the A13, A14, and A16 groups are 1.77 MPa, 1.9 MPa, and 1.17 MPa (less than 2 MPa), respectively. The variation rule of residual strength was then analyzed while considering the proportion of FA and the dosage of SF as independent variables and the residual strength as a dependent variable, as shown in Figure 8.
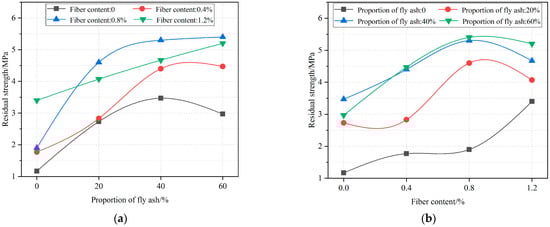
Figure 8.
Influence of the FA ratio (a) and SF content (b) on the residual strength.
It can be seen from Figure 8a that in the range of 0–40% FA, the residual strength of the experimental groups with different SF contents has a monotonously increasing trend with the increase of the FA proportion, which indicates that the incorporation of FA can significantly improve the residual strength of backfill. However, when the proportion of FA exceeds 40% and the content of SF is 0.8%, the increase rate of the residual strength of backfill starts to decline. When the ratio of FA is 60% and the content of SF is 0, the residual strength of backfill has a downward trend. The test results show that there is an optimal FA ratio of 40%.
It can be seen from Figure 8b that the residual strength of backfill increases with the increase of the SF content which is in the range of 0–0.8%. However, when the SF content increases in the range of 0.8–1.2%, the residual strength of backfill in the experimental groups with 20%, 40%, and 60% FA content decreases. This indicates that when the FA content increases, the SF content exceeding 0.8% will have a negative impact on the residual strength of backfill. This may be due to the fact that the addition of a large amount of SF leads to more defects in the backfill. As the applied load gradually increases, cracks in the backfill start from the defects caused by the addition of SF, and they further expand and extend, which results in the eventual fracture of the backfill [39]. The main reason for the reduction of residual strength is the internal defects of the backfilling body caused by SF incorporation.
Considering the residual strength and peak strength, the dominant mix ratio groups are A5, A6, and A9. The peak strengths are 14.73 MPa, 14.79 MPa, and 14.75 MPa, respectively, and the residual strength are 5.3 MPa, 5.4 MPa, and 5.2 MPa, respectively. The research results of Cui et al. [40] show that the width of RBB is 2.5 m, and the height is 4–4.3 m. The UCS is 6 MPa, which has met the strength requirements at the 2505 working face of Hengjian Coal Mine. Wang et al. [41] showed that the RBB width is 1.2 m and the height is 1.9 m. The UCS is 17.88 MPa, which has met the strength demand at 94103 working face of Qishan Coal Mine. Therefore, the dominant mix ratio groups in this study can meet the actual strength requirements of mine site by appropriately adjusting the size of RBB in similar engineering sites.
4.4. Analysis of the Deformation of RBB after Failure
The strain corresponding to the peak strength of RBB is referred to as the peak strain, and the one corresponding to the residual strength of RBB is referred to as the residual strain. The difference between peak strain and residual strain, that is, the post-peak strain difference, is used to characterize the deformation of RBB after failure, as shown in Figure 9. It can be observed from Figure 9a that when the FA proportion increases, the post-peak strain difference of the backfill gradually decreases, which indicates that the post-peak deformation of the backfill gradually decreases, that is, the brittleness of the backfill is higher.
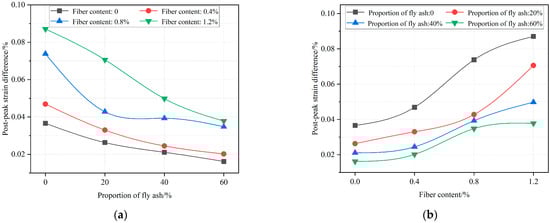
Figure 9.
Influence of the FA ratio (a) and SF content (b) on the post-peak strain difference.
It can be seen from Figure 9b that when the SF content increases, the post-peak strain difference of the backfill also gradually increases. The results show that SF can improve the post-peak ductility of the backfill, and then make up for its increased brittleness caused by FA, so that it can maintain a certain ability to deformation after failure. When the backfill is used to support the overlying rock in the underground, the deformation ability can make it better absorb the concentrated energy of the roof surrounding rock and avoid its sudden instability.
4.5. RBB Failure Modes Analysis
4.5.1. RBB Fracture Evolution Characteristics
The whole loading process of RBB samples was recorded by digital camera, and the pictures with significant fracture changes were cut out for analysis. In order to show the fracture morphology and development characteristics of the samples more clearly, the images were treated with binarization. The impacts of the FA proportion and SF content on the fracture evolution characteristics of RBB samples are shown in Figure 10.
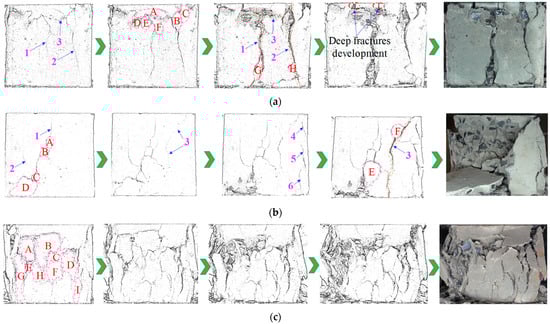
Figure 10.
Fracture evolution characteristics of RBB samples: (a) Samples without FA and SF; (b) Samples containing FA and without SF; (c) Samples without FA and containing SF.
It can be seen from Figure 10a that under vertical load, the samples without FA and SF (Group A16) have several cracks that gradually appear on their surface, among which cracks No. 1, 2, and 3 are clear. While cracks No. 1, 2, and 3 continued to develop and expand, several secondary micro-cracks were derived around them. The two ends of the cracks No. 1, 2, and 3 and the secondary micro-cracks together form a small area, A–F, which is referred to as damage fatigue zone [32]. No other clear cracks appeared while cracks No. 1, 2, and 3 continued to develop and expand. Therefore, cracks No. 1, 2, and 3 are referred to as macro-major cracks. With the continuous loading, the G and H new damage fatigue zones are generated in the lower part of the No. 1 and No. 2 macroscopic main cracks. Deep cracks can then be found in the upper part of the sample, which indicates that the damage degree inside the sample is large, and the bearing property is greatly reduced.
The fracture evolution characteristics of the samples with FA and without SF (group A10) in Figure 10b show that under vertical load, a fracture (denoted by crack No. 1) parallel to the loading direction is first generated on the surface of the sample. With the further development and expansion of crack No. 1, the damage fatigue zone A–D is derived. In addition, a crack (Nb. 2) parallel to the load axis was generated on the left side of crack No. 1. While the fractures continued to develop, a fissure (Nb. 3) gradually emerged on the right side of crack No. 1. With the continuous loading, three new cracks (No. 4, 5, and 6) appeared on the right edge of the sample. With the further development of cracks, the E and F damage fatigue zones were generated. The expansion speed of crack No. 3 is significantly faster than that of other cracks, and the upper and lower ends of the connected sample are developed (denoted by crack No. 3 as the macroscopic main crack), the bearing capacity of the sample is sharply reduced, and instability failure occurs. It can be seen that the destruction process of RBB mixed with FA is similar to that without FA.
The fracture evolution characteristics of the samples with SF and without FA (Group A14) in Figure 10c show that with continuous loading, multiple cracks appear on the surface of the sample. These cracks are quite different from the macroscopic main cracks in Figure 10a,b, featuring variable direction and short length. The cracks developed disorderly and converge with each other, thus forming a number of damage fatigue zones, as shown in the A–I region in Figure 10c. With continuous loading, the left and right sides of the sample are extruded outward to deform. In addition, it can be observed that there is no deep internal crack corresponding to surface crack inside the sample after the skin spalling, which indicates that some cracks only exist on the surface of the sample, and these cracks are clearly different from the macroscopic main cracks that are referred to as surface cracks. After the final loading, the epidermis of more damaged fatigue areas peels off, while it retains a good integrity. In fact, the main reason for the above characteristics of cracks is that the RBB material is mixed with SF, the bonding between the SF and RBB matrix significantly improves the residual strength and deformation of RBB after failure, and SF plays a positive role in inhibiting the development of RBB cracks [14].
4.5.2. Transformation of RBB Brittle-Ductile Failure Mode
Under the action of uniaxial compression load q, the failure modes of backfill can be generally divided into brittle failure and ductile failure, as shown in Figure 11. The brittle failure modes include X-shaped conjugate inclined plane shear failure, single inclined plane failure, and tensile failure, while the ductile failure mode is manifested as transverse plastic deformation, flow deformation, and extrusion deformation [32].
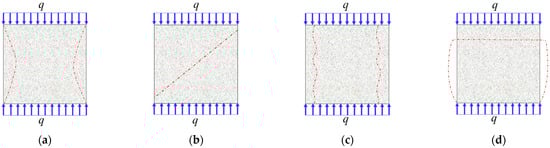
Figure 11.
Brittleness and ductility failure modes of backfill: (a) X-shaped conjugate inclined plane shear failure; (b) Single slope failure; (c) Tensile failure; (d) Ductile failure.
The failure modes of RBB samples after the test are shown in Figure 12. According to the failure characteristics of the backfill samples containing FA and without SF or containing SF and FA, the backfill is stripped around and the failure mode is a typical X-shaped conjugate-inclined plane shear failure. When SF is not mixed, the failure mode of backfilling body does not change with or without FA, and the failure mode is brittle failure.
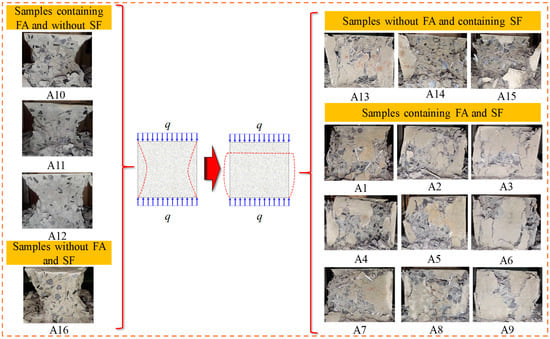
Figure 12.
Brittle-ductility failure mode transformation of RBB samples.
According to the failure characteristics of backfill in the group containing SF and without FA and the group containing SF and FA, the failure characteristics and failure modes of backfill in each group are consistent. The following conclusions can be drawn: (1) The integrity of the backfill after destruction is better, and the stripping amount of the backfill is less than that without SF incorporation; (2) Under the continuous action of axial load q, the backfilling body produces a clear phenomenon of axial compression-transverse expansion, showing typical ductile failure characteristics.
It can be seen from the failure characteristics of the above 16 groups of backfill that the incorporation of FA will not change the brittle failure mode of the backfill. However, after the incorporation of SF, the backfill presents the characteristics of changing from brittle failure to ductile failure, which greatly improves the bearing capacity of the backfill in the post-peak stage and avoids the brittle instability and caving of the backfill. The main reason is that the bonding force generated by the interaction between corrugated SF and backfill matrix prevents the crack propagation of backfill and inhibits its stripping. After the failure of the backfill, SF still connects the larger backfill fragments to its main body, avoiding caving after the backfill instability. This characteristic change of the backfilling body from brittle damage to ductile damage allows for improving the stability of RBB in deep mines.
5. Conclusions
In this paper, the impacts of the FA, RS percentage (0–60%), and SF admixture (0–1.2%) on the slump, RBB mechanical properties, and damage modes of RBB fresh mixture were studied through a series of slump and UCS tests. The main conclusions are as follows:
- (1)
- The slump first increases and then decreases with the increase of the FA proportion, and it reaches its maximum value when the FA proportion is 20%. SF has little influence on the slump. However, when the FA proportion is 60% and the SF content is 0.4%, the slump reaches a minimum value of 130 mm.
- (2)
- The peak strength and residual strength increase with the increase of the FA proportion. However, the strength gain starts to decrease when the FA proportion exceeds 40%. SF only has a small effect on the peak strength when the dosage is 0.8%. When the proportion of FA is 0, the residual strength increases with the increase of the SF content. When the proportion of FA is in the range of 20–60%, the residual strength first increases and then decreases with the increase of the SF content, while the 0.8% SF content is the critical point.
- (3)
- The post-peak strain difference decreases with the increase of the FA proportion and increases with the increase of the SF content. The addition of SF makes up for the problem of reduced post-peak capacity to deformation caused by the addition of FA to some extent.
- (4)
- The RBB samples with and without FA have fewer cracks and they connected the upper and lower ends of the samples, showing the brittle failure mode of X-shaped conjugate inclined plane shear. After SF incorporation, the fracture of the backfill body has variable direction and short length, and the backfill body changes from brittle failure mode to ductile failure mode.
Preliminary studies show that appropriate proportions of FA and SF can significantly improve the strength (both peak and residual strength), deformation capacity, and ductility of RBB, which is undoubtedly beneficial for underground engineering applications to maintain the stability of RBB. It is expected that the research results can provide an experimental and theoretical basis for industrial practice to improve the stability of GER roadway.
Author Contributions
S.Z.: methodology, writing—original draft. C.C.: supervision, funding acquisition. C.Z. and S.D.: investigation. J.L. and Y.L.: formal analysis. S.Y.: conceptualization. All authors have read and agreed to the published version of the manuscript.
Funding
This work was financially supported by the National Natural Science Foundation of China, grant number 52274143 and the National Natural Science Foundation of China, grant number 51874284.
Data Availability Statement
Not applicable.
Acknowledgments
The author gratefully acknowledge all the professors for their guidance and help during testing and writing.
Conflicts of Interest
The authors declare no conflict of interest.
References
- Fu, Q.; Yang, K.; Liu, Q.; Liu, S.; He, X.; Lyu, X. Optimization of Barrier Pillar Design in Longwall Mining with Top Coal Caving in Spontaneous Combustion Coal Seam. Geofluids 2021, 2021, 2749373. [Google Scholar] [CrossRef]
- He, M.C.; Xie, H.P.; Peng, S.P.; Jiang, Y.D. Study on rock mechanics in deep mining engineering. Chin. J. Rock Mech. Eng. 2005, 24, 2803–2813. [Google Scholar] [CrossRef]
- Chen, X.J.; Li, L.Y.; Wang, L.; Qi, L.L. The current situation and prevention and control countermeasures for typical dynamic disasters in kilometer-deep mines in China. Saf. Sci. 2019, 115, 229–236. [Google Scholar] [CrossRef]
- Li, B.Y.; Zhou, N.; Qi, W.Y.; Li, A.L.; Cui, Z.Z. Surface subsidence control during deep backfill coal mining: A case study. Adv. Civ. Eng. 2020, 2020, 6876453. [Google Scholar] [CrossRef]
- Xie, H.P. Research Framework and Anticipated Results of Deep Rock Mechanics and Mining Theory. Adv. Eng. Sci. 2017, 49, 1–16. [Google Scholar] [CrossRef]
- Tang, F.R.; Ma, Z.G.; Yang, D.W.; Qi, F.Z.; Hu, J.; Chen, Y.H. Study on key parameters of filling gob-side roadway in the thick layer soft rock fault top. J. Min. Saf. Eng. 2019, 36, 1128–1136. [Google Scholar] [CrossRef]
- Deng, X.J.; Dong, C.W.; Yuan, Z.X.; Zhou, N.; Yin, W. Deformation behavior of gob-side filling body of gob-side retaining entry in the deep backfilling workface. J. Min. Saf. Eng. 2020, 37, 62–72. [Google Scholar] [CrossRef]
- Wu, B.W.; Wang, X.Y.; Bai, J.B.; Wu, W.D.; Zhu, X.X.; Li, G.D. Study on crack evolution mechanism of roadside backfill body in gob-side entry retaining based on UDEC trigon model. Rock Mech. Rock Eng. 2019, 52, 3385–3399. [Google Scholar] [CrossRef]
- Xie, H.P. Research review of the state key research development program of China: Deep rock mechanics and mining theory. J. China Coal Soc. 2019, 44, 1283–1305. [Google Scholar] [CrossRef]
- Meng, N.K.; Bai, J.B.; Chen, Y.; Wang, X.Y.; Wu, W.D.; Wu, B.W. Stability analysis of roadside backfill body at gob-side entry retaining under combined static and dynamic loading. Eng. Fail. Anal. 2021, 127, 105531. [Google Scholar] [CrossRef]
- Zhao, X.Y.; Li, X.W.; Yang, K.; Wei, Z.; Fu, Q. The segmental subsidence structure with immediate roof of gob side entry retaining in backfill mining. Energy Explor. Exploit. 2021, 39, 1262–1282. [Google Scholar] [CrossRef]
- Ning, J.G.; Wang, J.; Bu, T.T.; Hu, S.C.; Liu, X.S. An innovative support structure for gob-side entry retention in steep coal seam mining. Minerals 2017, 7, 75. [Google Scholar] [CrossRef]
- Gong, P.; Ma, Z.G.; Zhang, R.R.; Ning, X.Y.; Liu, F.; Huang, Z.M. Surrounding rock deformation mechanism and control technology for gob-side entry retaining with fully mechanized gangue backfilling mining: A case study. Shock Vib. 2017, 2017, 6085941. [Google Scholar] [CrossRef]
- Xue, G.L.; Yilmaz, E.; Song, W.D.; Yilmaz, E. Influence of fiber reinforcement on mechanical behavior and microstructural properties of cemented tailings backfill. Constr. Build. Mater. 2019, 213, 275–285. [Google Scholar] [CrossRef]
- Cao, S.; Yilmaz, E.; Song, W.D. Fiber type effect on strength, toughness and microstructure of early age cemented tailings backfill. Constr. Build. Mater. 2019, 223, 44–54. [Google Scholar] [CrossRef]
- Wang, Y.; Wang, H.J.; Zhou, X.L.; Yi, X.F.; Xiao, Y.G.; Wei, X.M. In Situ X-ray CT Investigations of Meso-Damage Evolution of Cemented Waste Rock-Tailings Backfill (CWRTB) during Triaxial Deformation. Minerals 2019, 9, 52. [Google Scholar] [CrossRef]
- Zhang, Z.H.; Li, J.C. Experimental investigation on strength and failure characteristics of cemented tailing backfill. Front. Mater. 2021, 8, 483. [Google Scholar] [CrossRef]
- Ouyang, S.; Huang, Y.L.; Wu, L.W.; Yin, W.; Yang, X.; Wang, J.Q.; Wang, G.Y.; Li, J.M.; Lei, Y.C. Effects of chlorides on setting time, hydration heat and hydration products of fresh slurry of cemented paste backfill. Case Stud. Constr. Mater. 2022, 17, e01462. [Google Scholar] [CrossRef]
- Cavusoglu, I.; Yilmaz, E.; Yilmaz, A.O. Additivity effect on properties of cemented coal fly ash backfill containing water-reducing admixtures. Constr. Build. Mater. 2021, 267, 121021. [Google Scholar] [CrossRef]
- Chang, B.M.; Du, C.F.; Chu, X.F.; Zhang, L. Study on the Optimization of Filling Ratio and Strength Variation Characteristics Containing Fly Ash. Front. Mater. 2021, 8, 424. [Google Scholar] [CrossRef]
- Korzeniowski, W.; Poborska-Młynarska, K.; Skrzypkowski, K. The idea of the recovery of municipal solid waste incineration (MSWI) residues in Kłodawa Salt Mine SA by filling the excavations with self-solidifying mixtures. Arch. Min. Sci. 2018, 63, 553–565. [Google Scholar] [CrossRef]
- Skrzypkowski, K.; Korzeniowski, W.; Poborska-Młynarska, K. Binding capability of ashes and dusts from municipal solid waste incineration with salt brine and geotechnical parameters of the cemented samples. Arch. Min. Sci. 2018, 63, 903–918. [Google Scholar] [CrossRef]
- Wu, J.Y.; Feng, M.M.; Xu, J.M.; Qiu, P.T.; Wang, Y.M.; Han, G.S. Particle size distribution of cemented rockfill effects on strata stability in filling mining. Minerals 2018, 8, 407. [Google Scholar] [CrossRef]
- Petlovanyi, M.; Mamaikin, O. Assessment of an expediency of binder material mechanical activation in cemented rockfill. ARPN J. Eng. Appl. Sci. 2019, 14, 3492–3503. Available online: https://core.ac.uk/download/pdf/288815705.pdf (accessed on 21 January 2023).
- Jiang, H.Q.; Fall, M.; Li, Y.H.; Han, J. An experimental study on compressive behaviour of cemented rockfill. Constr. Build. Mater. 2019, 213, 10–19. [Google Scholar] [CrossRef]
- Sari, M.; Yilmaz, E.; Kasap, T.; Guner, N. Strength and microstructure evolution in cemented mine backfill with low and high pH pyritic tailings: Effect of mineral admixtures. Constr. Build. Mater. 2022, 328, 127109. [Google Scholar] [CrossRef]
- Tuylu, S. Investigation of the Effect of Using Different Fly Ash on the Mechanical Properties in Cemented Paste Backfill. J. Wuhan Univ. Technol.-Mater. Sci. Ed. 2022, 37, 620–627. [Google Scholar] [CrossRef]
- Iqbal, S.; Ali, I.; Room, S.; Khan, S.; Ali, A. Enhanced mechanical properties of fiber reinforced concrete using closed steel fibers. Mater. Struct. 2019, 52, 56. [Google Scholar] [CrossRef]
- Moradi, M.; Bagherieh, A.R.; Esfahani, M.R. Constitutive modeling of steel fiber-reinforced concrete. Int. J. Damage Mech. 2020, 29, 388–412. [Google Scholar] [CrossRef]
- Zhu, H.T.; Li, C.C.; Gao, D.Y.; Yang, L.; Cheng, S.Z. Study on mechanical properties and strength relation between cube and cylinder specimens of steel fiber reinforced concrete. Adv. Mech. Eng. 2019, 11, 1687814019842423. [Google Scholar] [CrossRef]
- Ouyang, S.; Huang, Y.L.; Zhou, N.; Li, J.M.; Gao, H.D.; Guo, Y.C. Experiment on hydration exothermic characteristics and hydration mechanism of sand-based cemented paste backfill materials. Constr. Build. Mater. 2022, 318, 125870. [Google Scholar] [CrossRef]
- Li, J. Research and Application of Bearing Characteristics of Strong-Toughness Cemented Backfilling Materials. Master’s Thesis, China University of Mining and Technology, Xuzhou, China, 2021. [Google Scholar] [CrossRef]
- ASTM C 143; Standard Test Method for Slump of Hydraulic-Cement Concrete. ASTM International: West Conshohocken, PA, USA, 2010.
- Hu, Z.J.; Feng, H.; Wang, X.F. Preparation for retarding and high early strength concrete. J. Wuhan Univ. Technol.-Mater. Sci. Ed. 2015, 30, 787–789. [Google Scholar] [CrossRef]
- Zhao, J.; Lu, X.Y. Assumption and Suggestions for Constructing the New Scientific & Smart System of Concrete Proportioning(2). China Concr. 2019, 11, 48–61. Available online: https://kns.cnki.net/kcms/detail/detail.aspx?dbcode=CJFD&dbname=CJFDLAST2019&filename=JZSJ201911009&uniplatform=NZKPT&v=o8pfhiJGn2W-qv53aTvHje8are2757PsicRXvGMAVDCMpg_SF9H3cFtoFxqUrIvG (accessed on 20 November 2022).
- Figueiredo, A.D.; Ceccato, M.R. Workability analysis of steel fiber reinforced concrete using slump and Ve-Be test. Mater. Res. 2015, 18, 1284–1290. [Google Scholar] [CrossRef]
- Faris, M.A.; Abdullah, M.M.A.B.; Muniandy, R.; Abu Hashim, M.F.; Błoch, K.; Jeż, B.; Garus, S.; Palutkiewicz, P.; Mohd Mortar, N.A.; Ghazali, M.F. Comparison of hook and straight steel fibers addition on malaysian fly ash-based geopolymer concrete on the slump, density, water absorption and mechanical properties. Materials 2021, 14, 1310. [Google Scholar] [CrossRef]
- Belem, T.; Benzaazoua, M. Design and application of underground mine paste backfill technology. Geotech. Geol. Eng. 2008, 26, 147–174. [Google Scholar] [CrossRef]
- Li, Y.; Wang, X.L.; Ding, Q.J. Study on properties of steel fiber reinforced concrete. Concrete 2017, 7, 62–65. [Google Scholar] [CrossRef]
- Cui, J.K.; Feng, Y.L.; Sun, C.D.; Li, M. Test of high-water material width and strength for roadway-side stowing and its application. Coal Min. Technol. 2014, 19, 58–60. [Google Scholar] [CrossRef]
- Wang, D.; Li, H.W.; Zhao, R.S. Experimental research on filling material in deep gob-side entry retaining. Coal Sci. Technol. Mag. 2020, 41, 32–35. [Google Scholar] [CrossRef]
Disclaimer/Publisher’s Note: The statements, opinions and data contained in all publications are solely those of the individual author(s) and contributor(s) and not of MDPI and/or the editor(s). MDPI and/or the editor(s) disclaim responsibility for any injury to people or property resulting from any ideas, methods, instructions or products referred to in the content. |
© 2023 by the authors. Licensee MDPI, Basel, Switzerland. This article is an open access article distributed under the terms and conditions of the Creative Commons Attribution (CC BY) license (https://creativecommons.org/licenses/by/4.0/).