1. Introduction
As the penetration of renewables into the power system has grown over the years, an increase in the levels of curtailment is expected to compensate for the occasional overproduction of energy. In some regions, and especially in Italy, curtailments of renewable electricity have been recorded for more than 10% of the renewable generation [
1]. For this reason, flexible solutions such as energy storage systems are required in order to better utilize the electrical energy produced by renewable energy source (RES) power plants [
2]. Numerous technologies are currently available for energy storage, and many others are under development. Each energy storage technology is characterized by specific features in terms of the maximum deliverable power, storage capacity, round-trip efficiency, lifetime, etc. This means that each one is suitable for certain to cover specific applications, as shown by many review studies on the state of the art in this field [
3,
4,
5].
Among energy storage technologies, compressed air energy storage (CAES) systems are some of the most interesting options, as they are potentially more cost-effective than batteries and have performance comparable to that of pumped hydro systems. CAES systems use the excess electrical energy produced by power generation units during periods of low electricity demand to drive a compressor and store this energy as compressed air, which is later used in a turbine during periods of higher electricity demand. Conventional CAES configurations rely on a combustion chamber, usually fed by fossil fuel, to heat up the air before the expansion phase. However, to improve the overall efficiency and eliminate fossil fuel consumption, the most advanced adiabatic CAES (ACAES) configurations include a thermal energy storage section that cools the hot air at the outlet side of the compressor and later heats the air at the inlet side of the turbine [
6].
An in-depth analysis of the environmental impact is essential for any energy storage technology, in addition to an analysis of the energetic and economic performance, as demonstrated in many recent studies. Kapila et al. [
3] studied the life cycle greenhouse gas (GHG) emissions of both a conventional CAES and an adiabatic CAES storage system, taking into consideration the emissions arising from construction, operation, and decommissioning. Based on the production of 1 kWh of electricity as a functional unit, they determined that the construction and decommissioning phases had a low impact on the overall emissions, which mostly depended on the operational stage. This was because the input energy supplied to both CAES systems in this study was supplied by the grid, meaning that the emissions were highly dependent on the grid energy mix. Moreover, other damage categories were not considered in their analysis. Abdon et al. [
4] demonstrated that medium-sized ACAES storage systems combined with RES plants were characterized by lower GHG emissions than other technologies. Bouman et al. [
5] utilized the life cycle assessment (LCA) method to determine the environmental impact of both conventional CAES and adiabatic CAES systems with a rated power of 200 MW and 150 MW, respectively, coupled with a 400 MW offshore wind farm. They reported that combining the CAES system with a wind farm generally increased the environmental impact of the plant. In particular, for the ACAES system, the overall impact mostly depended on the size of the thermal energy storage section. Stougie et al. [
6] found that the environmental impact of an ACAES plant was higher than that of comparable storage systems, mainly resulting from the large amounts of steel required for the air storage volume. AlShafi et al. [
7] considered an ACAES system with an underwater reservoir with the aim of evaluating its environmental impact in terms of global warming, ozone depletion, acidification, human toxicity, and marine aquatic ecotoxicity potentials, and compared it to vanadium redox flow batteries and molten salt thermal storage. They reported that the CAES system had a significantly lower environmental impact compared to vanadium redox batteries but a higher impact than molten salt systems.
In this context, the aim of this paper is to assess the environmental impact of an ACAES system designed to achieve the best match between the power production of a photovoltaic power plant and the power demand of the end user. In particular, the electrical energy demand of a small town, with a maximum power load of about 10 MW and an annual energy demand of 48.5 GWh, is considered a case study. Different sizes of PV plants, ranging from 20 to 40 MWp, and two different solutions for compressed air storage, an underground cavern, and a gas pipeline, are analyzed. This analysis is carried out by calculating the environmental impact based on the following four categories of damage: human health, ecosystem quality, climate change, and resource consumption of the sole PV system and the integrated PV-ACAES system. The results are compared to a reference scenario in which the end user demand is entirely met by the grid.
2. Materials and Methods
2.1. System Configuration and Assumptions
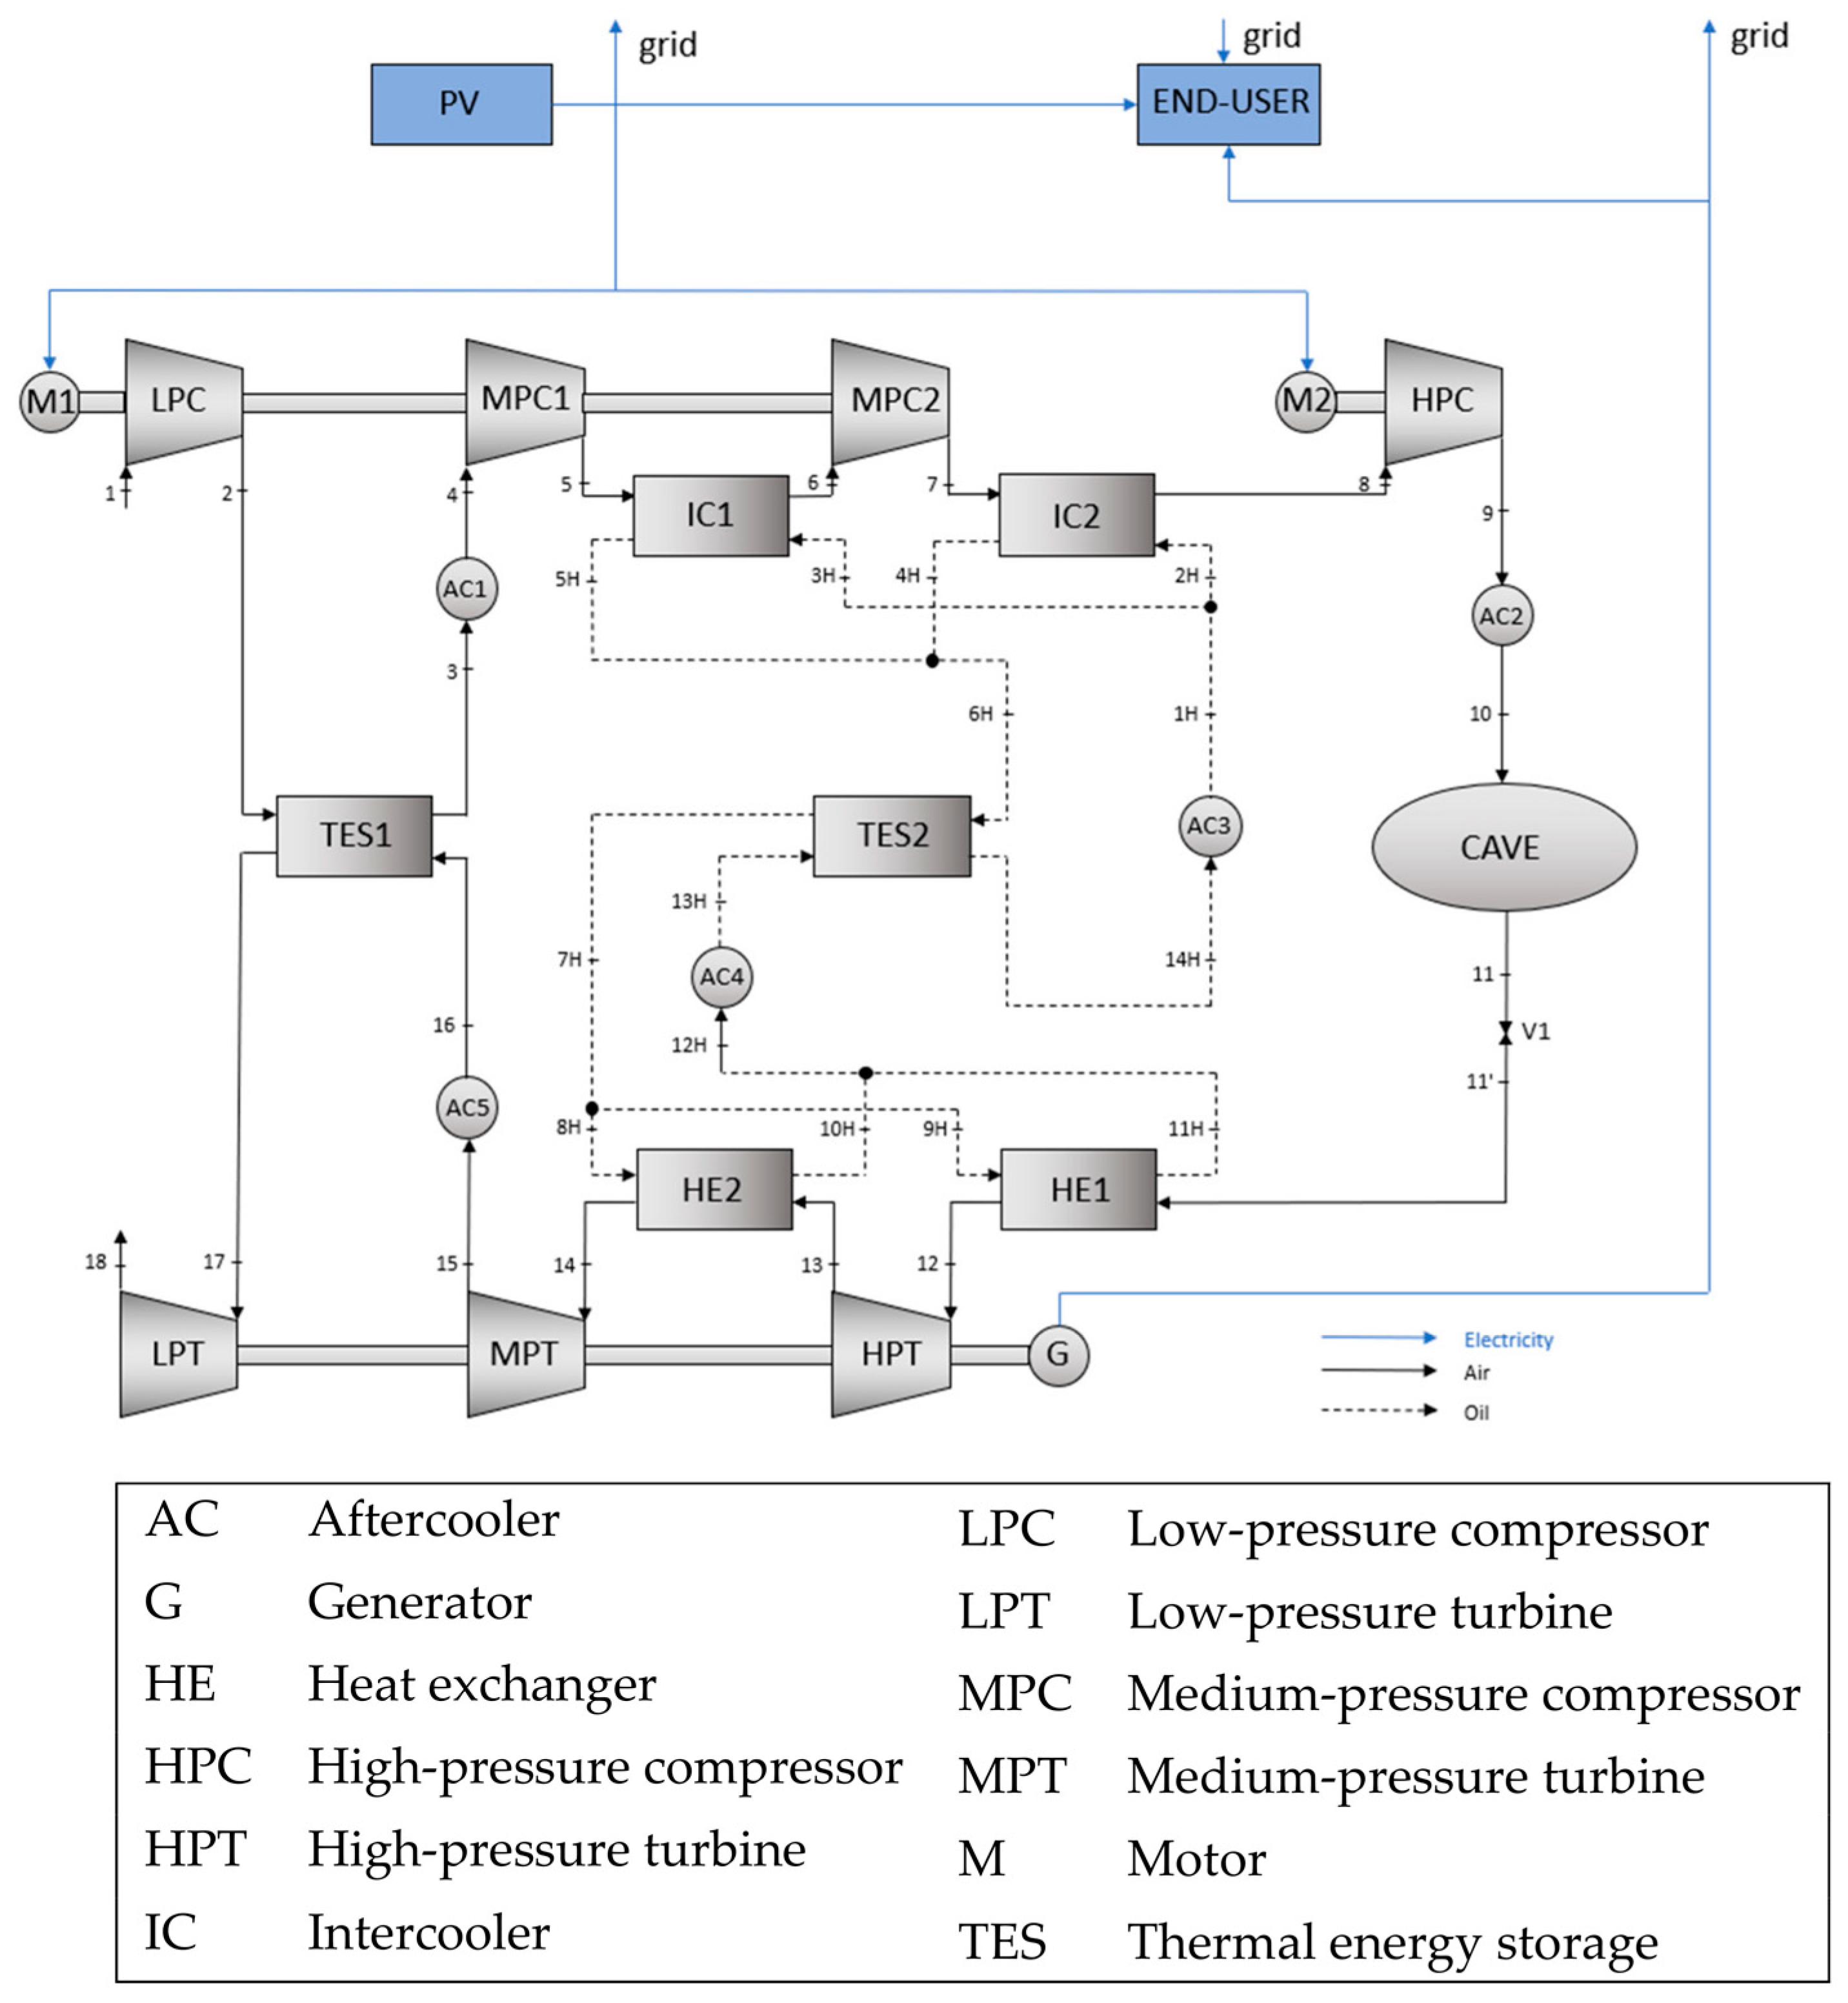
Figure 1 shows a schematic diagram of the integrated PV-ACAES plant. As a case study, the energy demand of a small town with about 6000 inhabitants is considered. As shown in
Figure 1, the energy demand can be directly supplied by the PV power plant, the ACAES system, or the grid. The surplus production of the PV power plant can be stored by the ACAES system or sent to the grid. Obviously, if the energy demand is supplied solely by the PV power plant, the ACAES section is not required.
As shown in
Figure 1, the ACAES section includes an air compression train consisting of a low-pressure compressor (LPC), two medium-pressure compressors (MPC1 and MPC2) driven by the motor M1, and a high-pressure compressor (HPC) driven by the motor M2, in order to compress the air to a maximum pressure of 100 bar. All four compressors are multistage centrifugal machines designed with a maximum output temperature of 200 °C. The design and off-design performance of the four compressors were estimated by employing the well-known Casey and Robinson method [
8]. When the mass flow rate in the compressors is kept constant, the LPC, MPC1, and MPC2 compressors operate at design conditions throughout the charging phase, while the HPC compressor is responsible for the pressure increase inside the storage cavern from 70 to 100 bar, by varying its rotational speed and hence its pressure ratio. The heat recovered by cooling the compressed air is stored in two different packed bed thermal energy storage (TES) systems. Two additional aftercoolers (AC1 and AC2) are located at the outlet side of TES1 and TES2 to regulate the temperature of the air.
Table 1 summarises the characteristics of the two TES systems. Both TES units are filled with gravel, which was chosen due to its low cost and high availability. TES1 exchanges heat directly with the compressed air, while TES2 uses oil (Therminol-66) as a heat transfer fluid, which is heated by two intercoolers (IC1 and IC2). The expansion train includes a high-pressure turbine (HPT), a medium-pressure turbine (MPT), and a low-pressure turbine (LPT) to drive generator G. During the discharging phase, the air leaving the storage section is heated by flowing through the heat exchangers HE1 and HE2, before expanding in the HPT and MPT turbines, respectively. Finally, the air is heated further by flowing through TES1 before expanding to atmospheric pressure in LPT. A throttle valve V1 is used to set the air pressure at the inlet of the expansion train to the design value of 70 bar.
The following two different solutions are considered for the storage of the compressed air: the first is an underground cavern converted from a decommissioned mining tunnel, and the second is a gas pipeline. The characteristics of these two systems are given in
Table 2.
2.2. End User Energy Demand
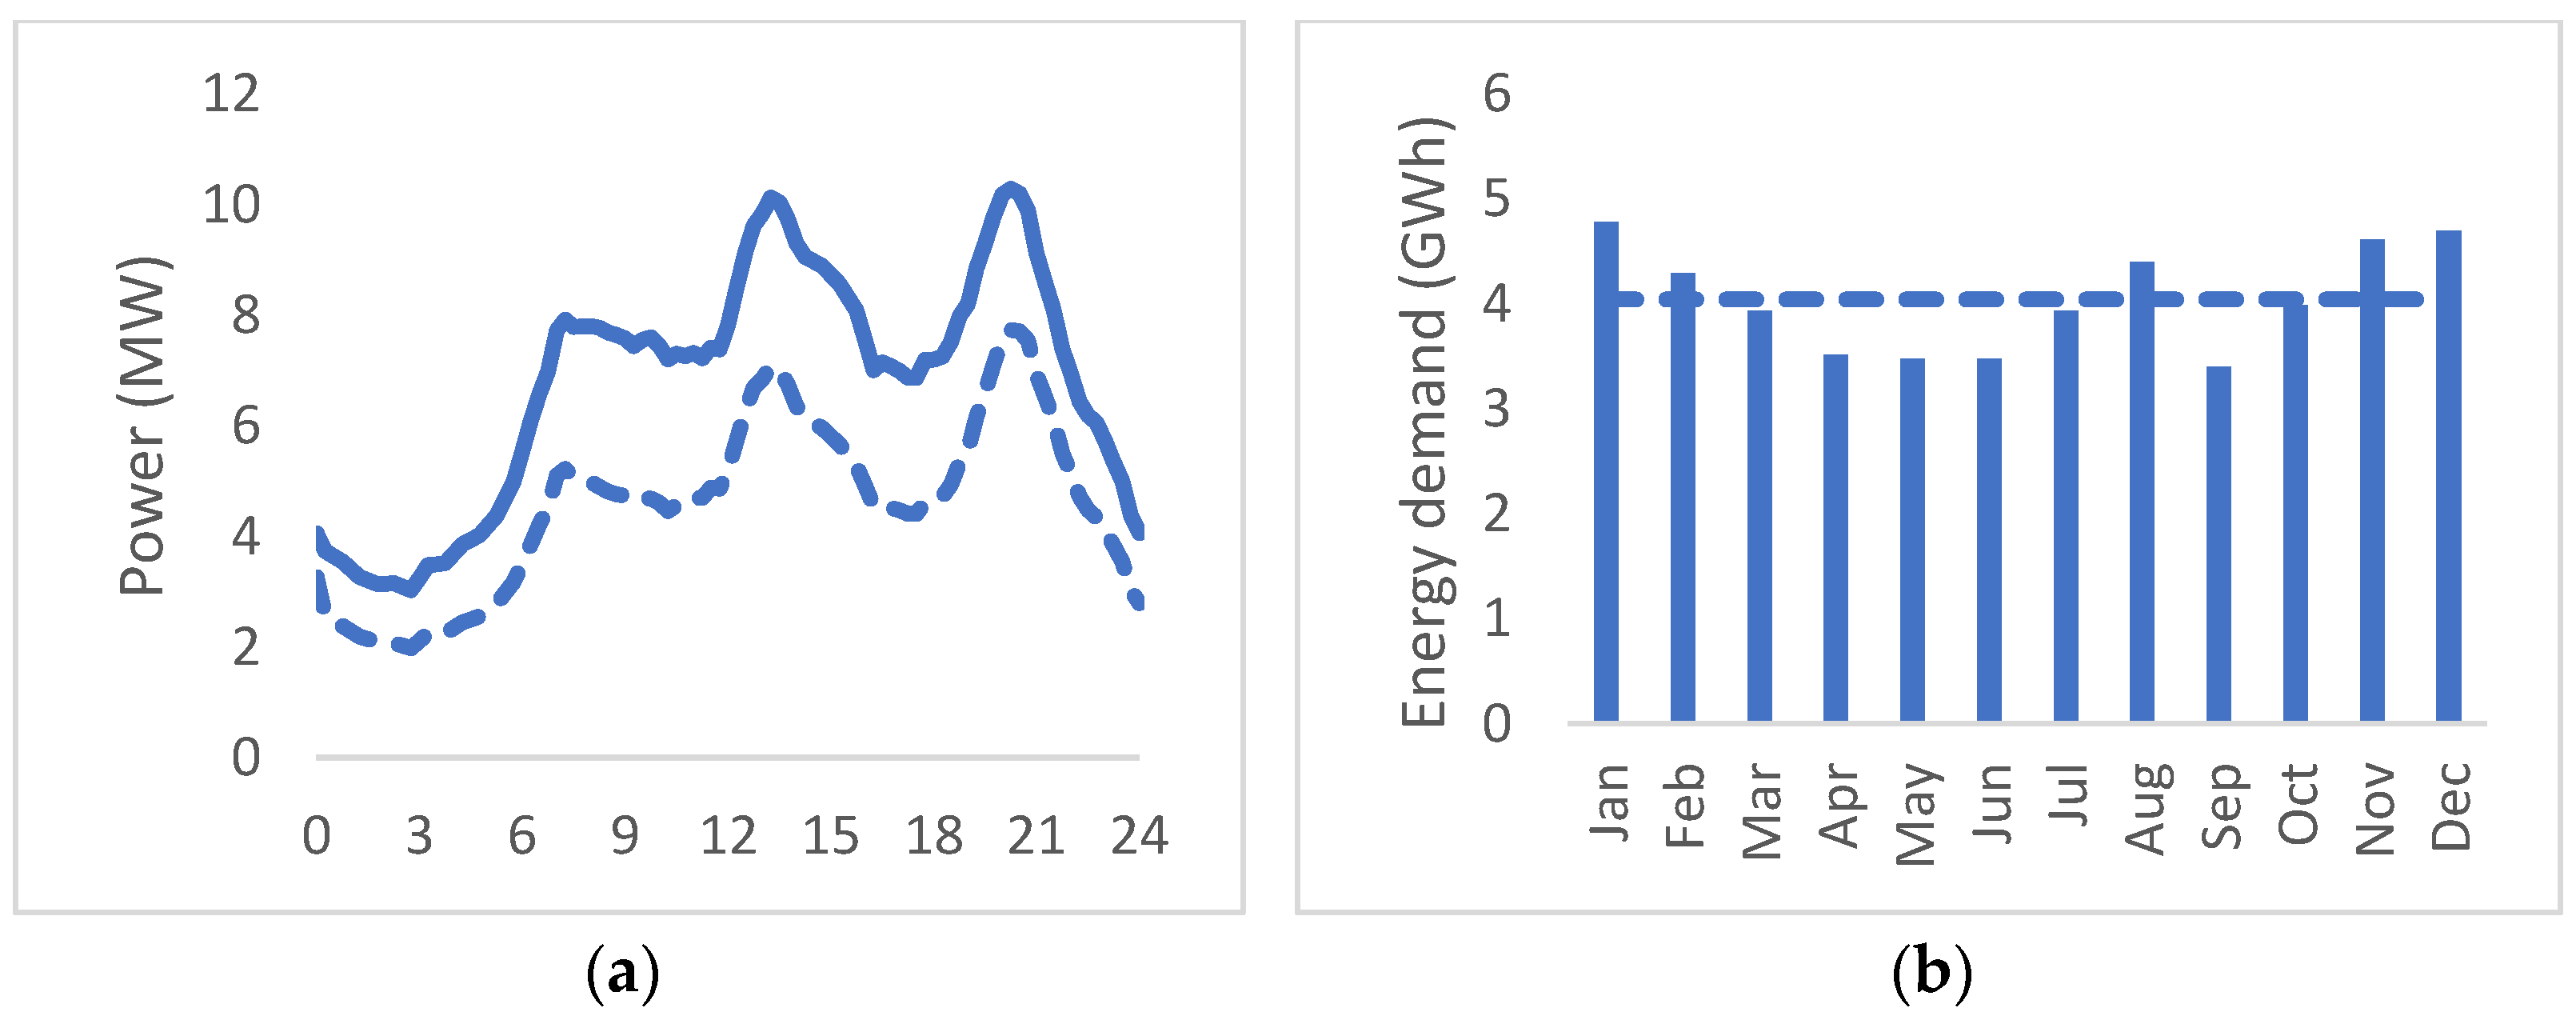
Figure 2a shows the power load profiles for both a typical weekday (continuous line) and a weekend day (dashed line) for the town. The load changes during the day, with three peaks at around 7:00, 13:00, and 21:00.
Figure 2b shows the monthly energy demand, and it can be seen that the minimum energy consumption is around 3.4 GWh in September, while the maximum is about 4.78 GWh in January. Overall, the peak load is 10.3 MW, while the annual energy demand is 48.5 GWh. In the reference scenario, this annual energy demand is entirely supplied by the grid.
2.3. Performance of the PV Power Plant
The PV power plant was designed using 650 W
p single-crystalline Si modules with 20.9% efficiency [
9]. The production profile was determined by applying System Advisor Model (SAM) software to data from Nuraxi Figus (Sardinia, Italy), obtained from the NREL database, for PV modules oriented towards the south and with a tilt of 30°. The site is characterized by a total annual solar irradiance of 1655 kWh/m
2 and an average temperature during the year of about 18.5 °C, with a minimum of 6.7 °C and a maximum of 33.6 °C in January and July, respectively.
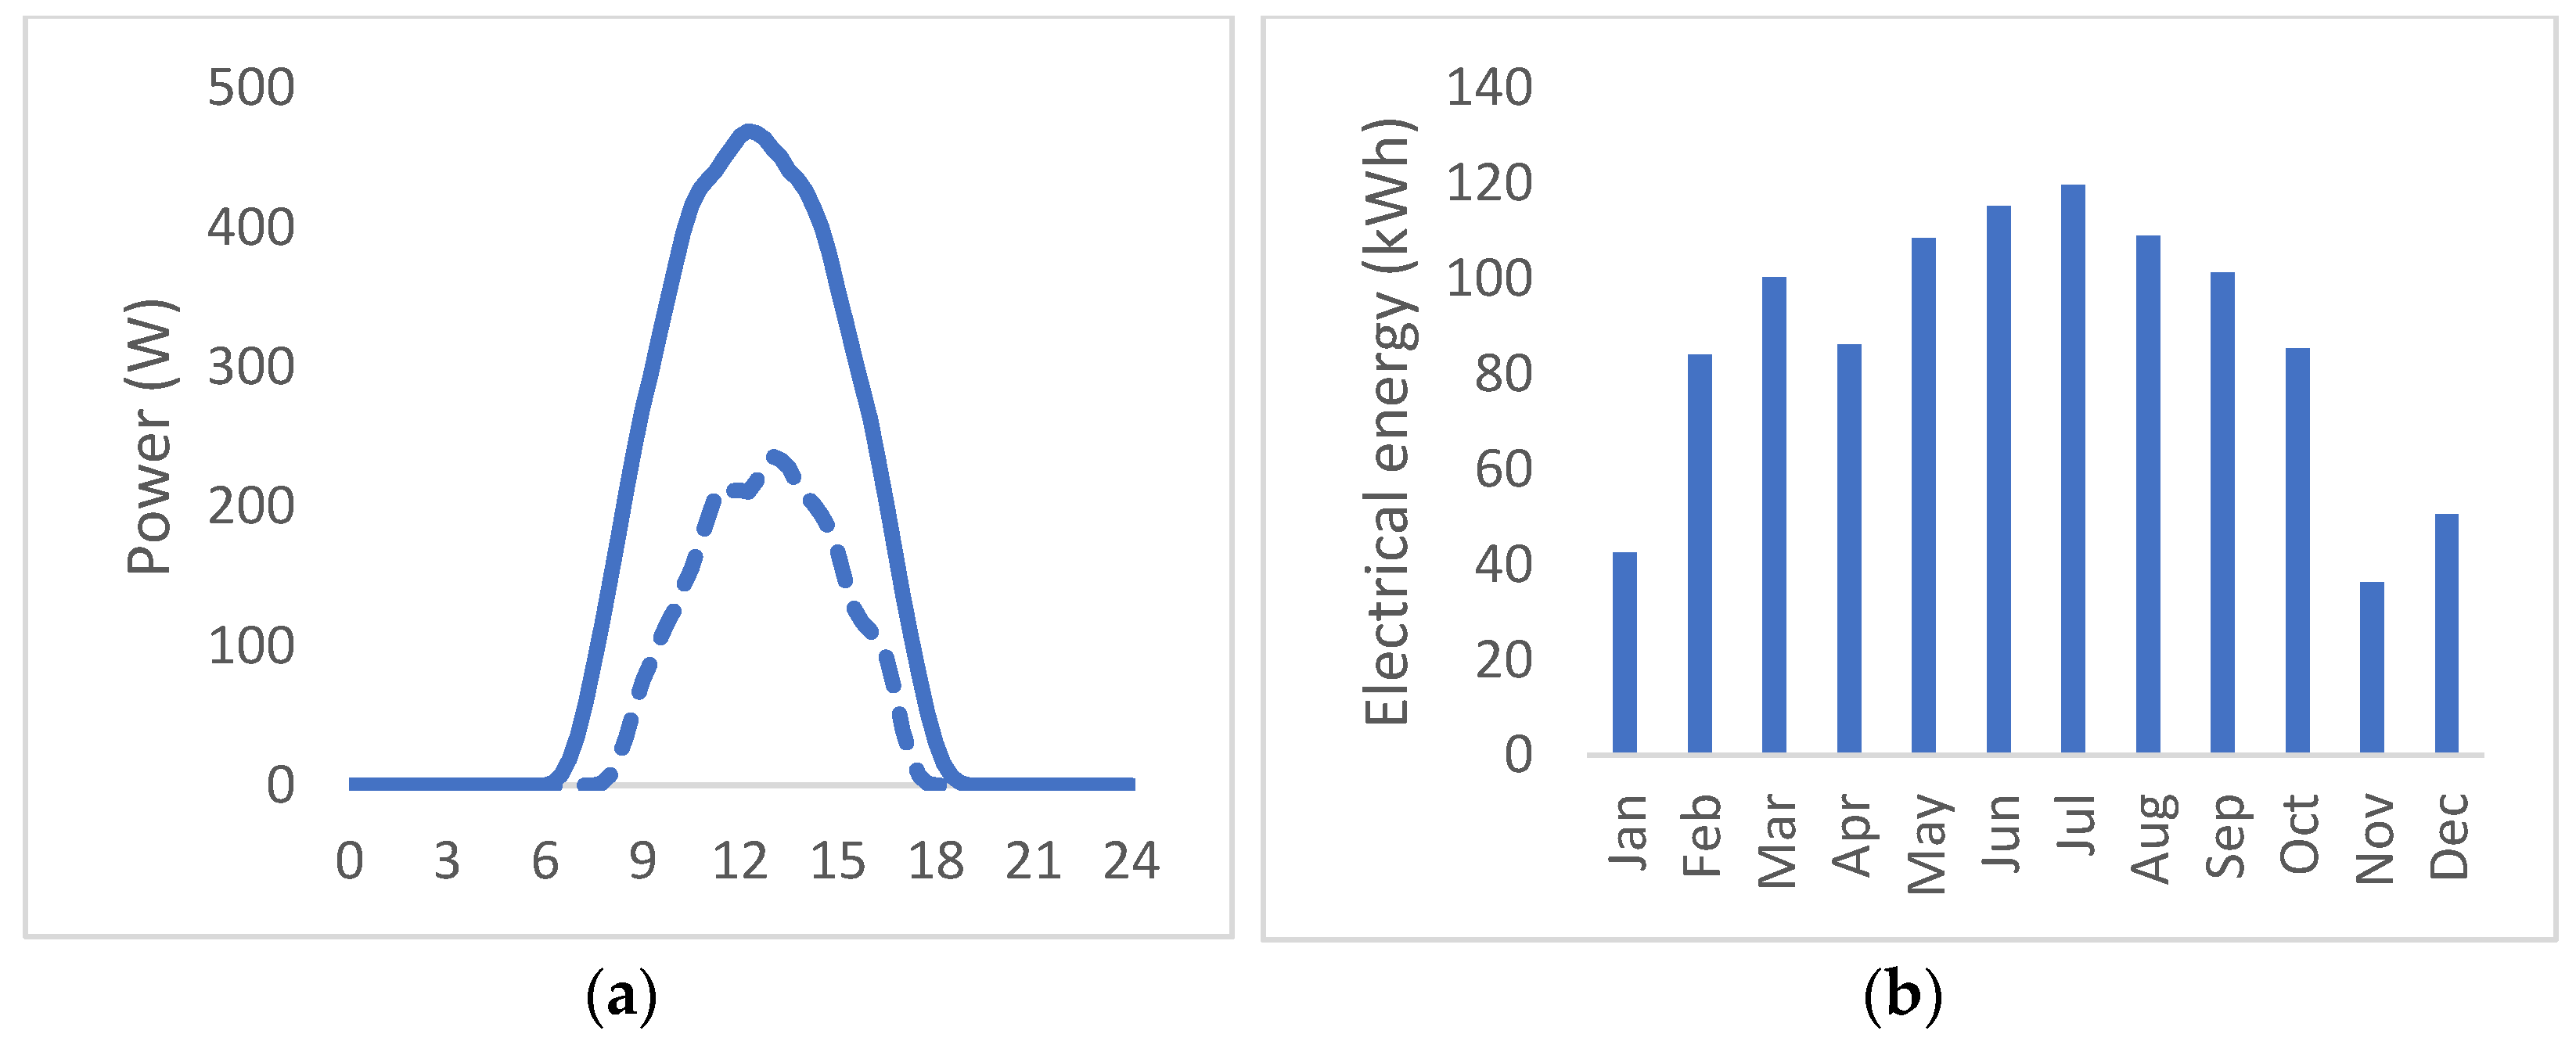
Figure 3a shows the typical daily power production profile of the PV module for the summer months (continuous line) and the winter months (dashed line), while
Figure 3b shows the monthly electrical energy production. Overall, the yearly energy production of a 1 MW
p plant is about 1598 MWh, with a capacity factor of about 18%.
To meet the annual energy demand, different sizes of the PV plant were considered. In particular, five different sizes, ranging from 20 to 40 MW
p, were analyzed. As can be seen from
Table 3, only a fraction of the energy produced every year by the PV power plant can be directly consumed by the end users. This causes a significant surplus in production from the PV power plant, which is particularly noticeable during summer when the energy demand is low and solar energy is very high. Depending on the configuration, the PV plant can directly supply between 38.6% (C1) and 43.5% (C5) of the energy demand. Increasing the size of the PV plant from C1 to C5 also increases the overproduction of PV energy in comparison to the energy demand (41.4% of the PV energy production for configuration C1, and 67% for configuration C5). Some of the overproduced energy can be stored by the ACAES system for use during hours of low solar energy availability.
The ACAES plant was designed by varying the three main design variables (i.e., the mass flow rate of the compressors, the charge time, and the discharge time) in order to maximize the total energy produced and supplied to the end user by the PV-ACAES plant in configuration C3. Solving the optimization problem led to a mass flow rate of 18 kg/s, a charge time of 10 h, and a discharge time of 24 h. All of the simulations were carried out with a time step of 15 min for a full year.
The main energy flows of the five different PV-ACAES solutions considered here are summarized in
Table 4.
As mentioned above, increasing the size of the PV plant from C1 to C5 increases the share of the PV production that cannot be directly supplied to the end user, which is then available to be stored by the ACAES system. This stored energy can be released later to provide power to the end user during times of low solar energy availability. The ACAES system considered here can store about 10.4% of the PV overproduction in configuration C1 and up to 41.2% in configuration C5. Hence, the self-consumption rate of the integrated PV-ACAES plant can be increased by up to 40.4% in configuration C1, and up to 66.7% in configuration C5, with a significant reduction in the amount of energy supplied to the end user by the grid.
Table 4 also shows that even with the integration of the ACAES section, a significant amount of the PV energy produced cannot be stored and must be sold to the grid. However, owing to transmission constraints and/or an excess of power production in comparison to grid demand, a curtailment of this PV generation may be required. As the penetration of renewables increases, it is expected that only a small fraction of this overproduction will actually be able to be sold to the grid.
2.4. LCA Methodology and Assumptions
An environmental impact analysis of the integrated PV-ACAES system was carried out using the LCA methodology. This methodology is based on the ISO 14040 and 14044 guidelines and allows for an assessment of the overall environmental impact (i.e., the use of energy and materials, as well as the polluting emissions) of a product throughout its overall life cycle, from raw material extraction to production, use, and final disposal [
10,
11]. The goal and scope of this study, the system boundaries, and the assumptions made are described below.
2.4.1. Definition of Goal and Scope
The aim of this analysis is to compare the impacts on human health, ecosystem quality, climate change, and resource consumption of an integrated PV-ACAES system, a PV power plant without energy storage, and a reference scenario in which the energy required by the end users is entirely supplied by the grid. In particular, the goal of the study is to evaluate whether and to what extent the implementation of the ACAES system is beneficial from an environmental point of view. The PV system, with or without the ACAES section, is specifically designed to produce the electrical energy needed to meet the demand of the end users. Hence, the functional unit chosen for this LCA study is 1 kWh of electrical energy supplied by the PV or the PV-ACAES system to the end users. The system is analyzed over 25 years of useful life, and the environmental impacts in the reference scenario are evaluated based on the current energy mix in Italy.
An attributional LCA was carried out using data from the literature and the Ecoinvent 3.7 database and was implemented using SimaPro 9 software [
12].
2.4.2. Boundaries of the System
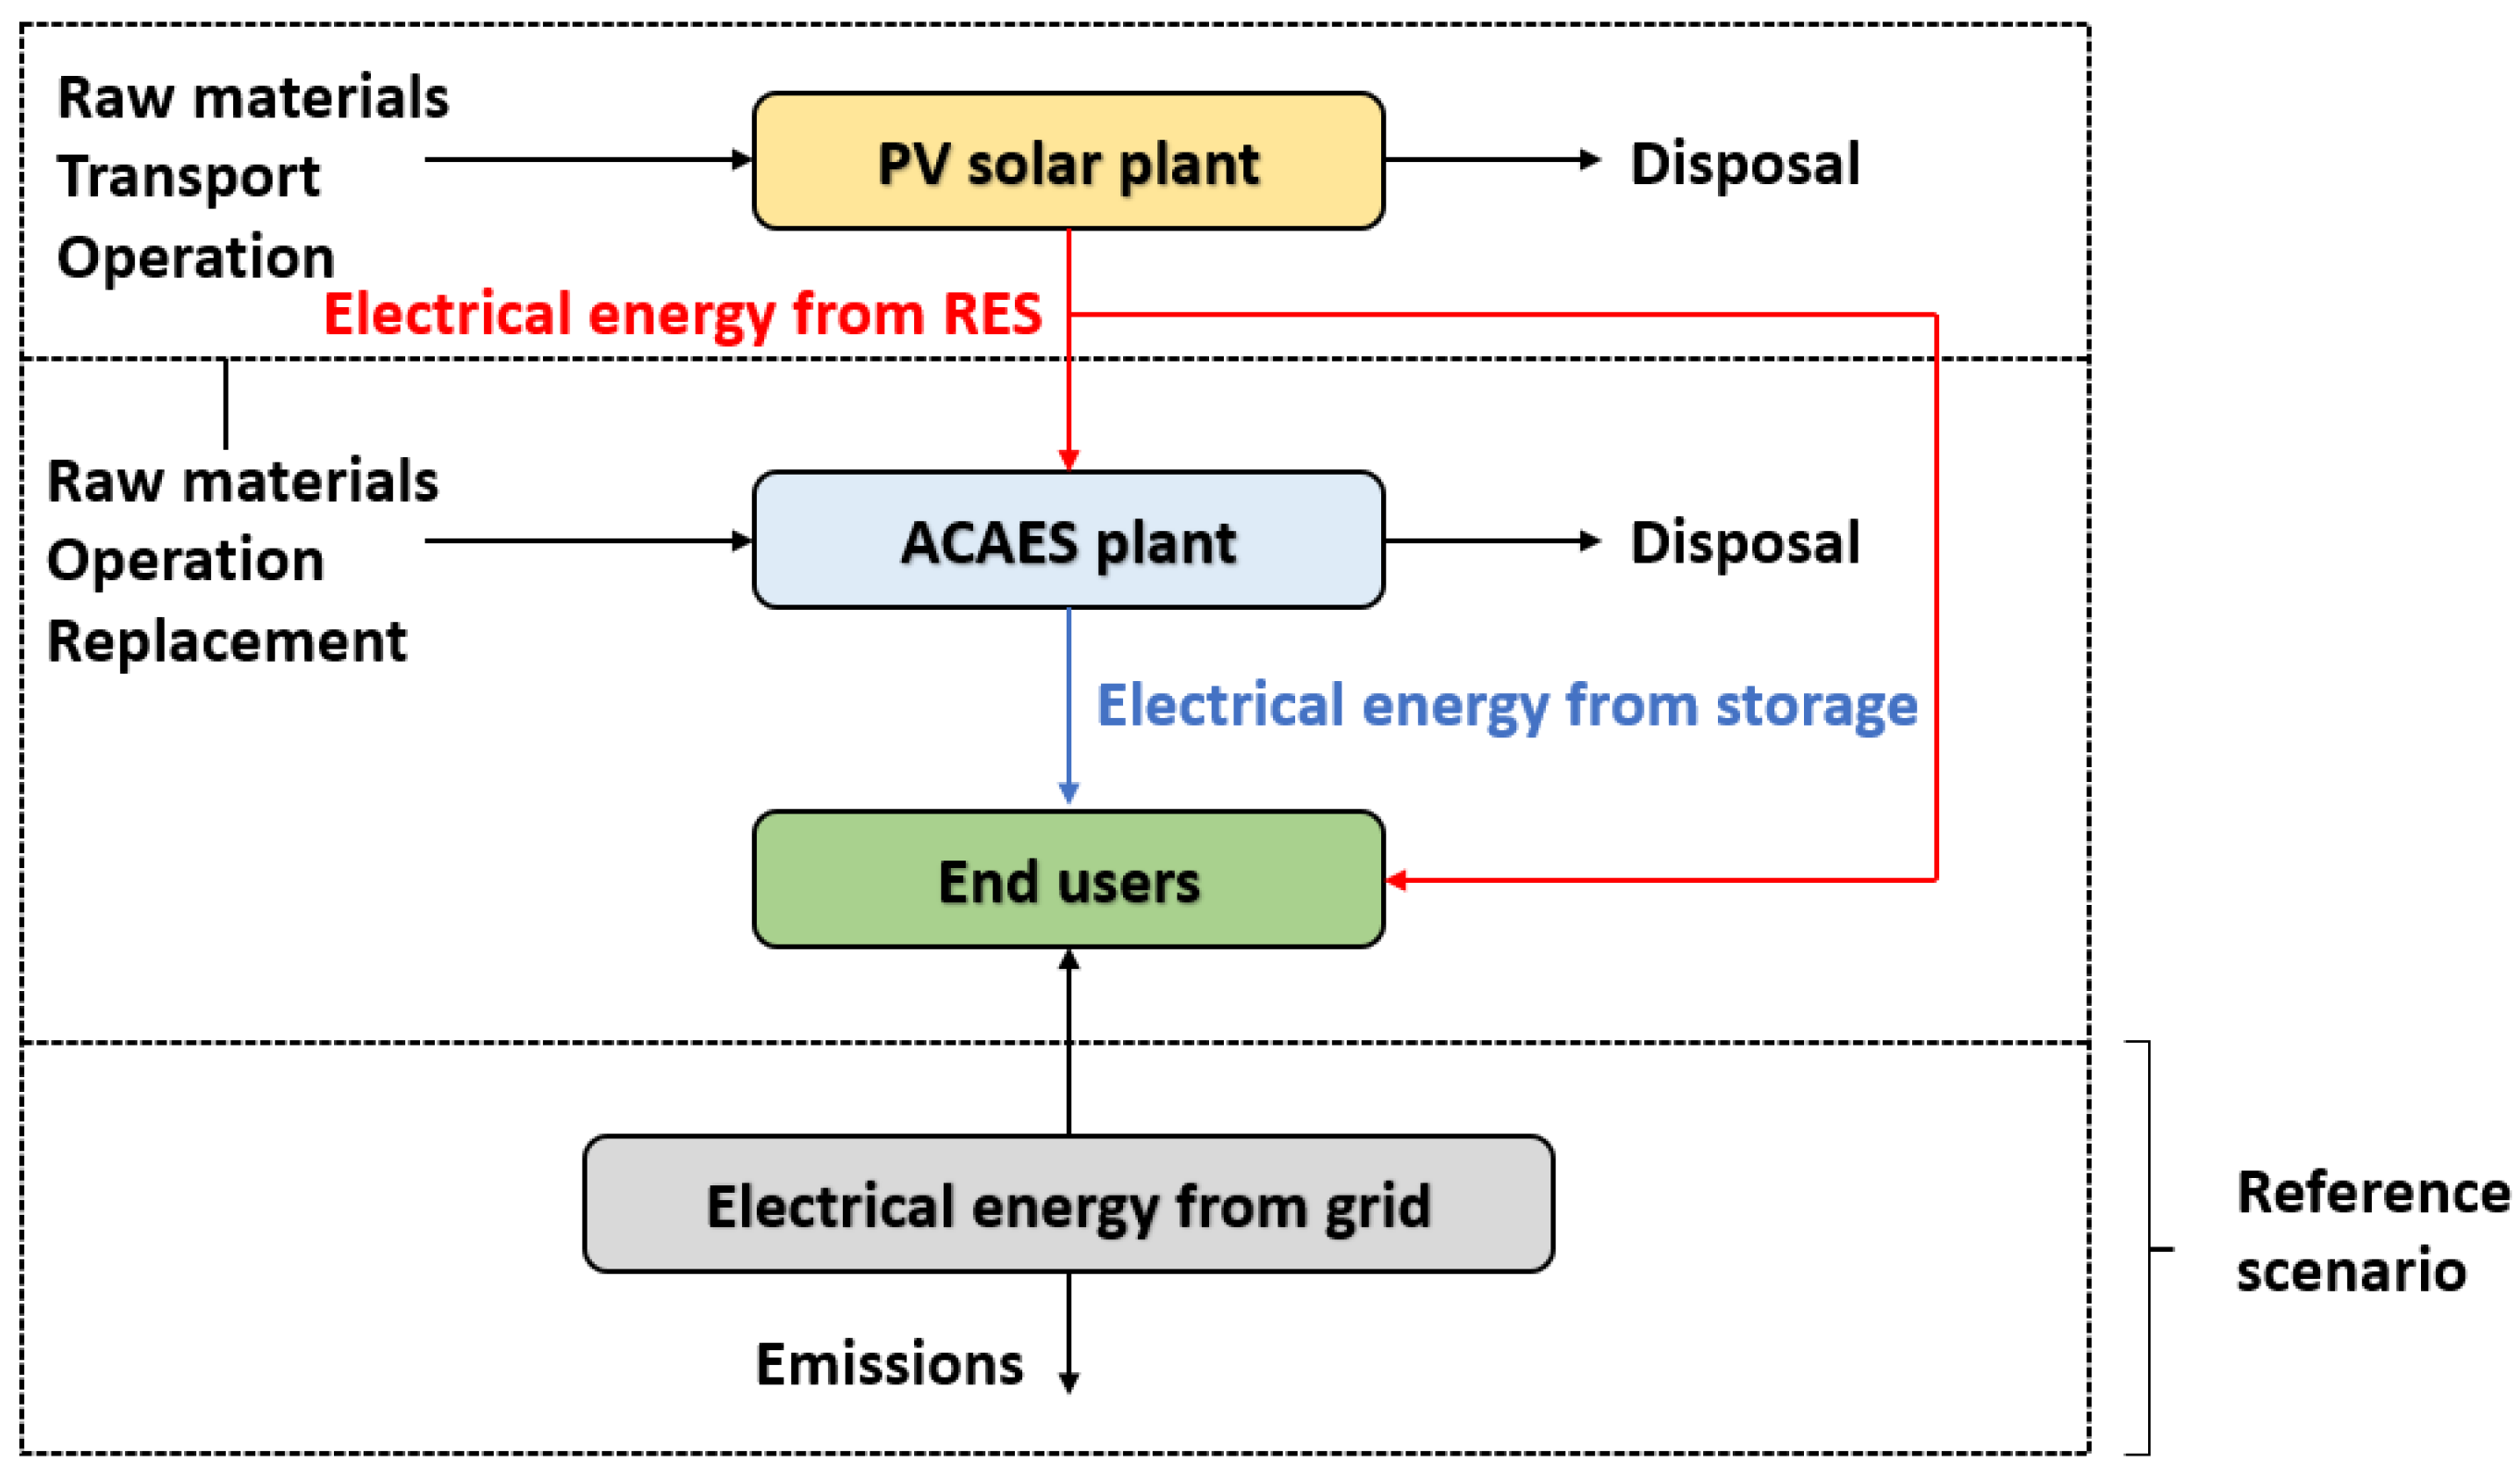
Figure 4 shows the boundaries of the system considered here. As described above, the PV solar plant supplies energy directly to the end users, and to the ACAES system in the case of overproduction. In the reference scenario, the electrical energy is entirely supplied by the grid. The environmental impact associated with electricity not supplied by the grid is assumed to be an avoided impact and is, therefore, negative.
As mentioned previously, with the expected growth of renewables in the coming years, an increase in the levels of curtailment is also expected due to overproduction by PV and wind power plants in comparison to the grid demand. Since the ultimate goal of a PV-ACAES system is to increase the energy self-sufficiency of the end users, the surplus PV production was assumed to be entirely curtailed. Hence, the avoided impact that could be obtained from this PV surplus production was not considered. This is obviously a conservative assumption, and the environmental impact will improve if a portion of the surplus PV production can be sold to the grid.
2.4.3. Life Cycle Inventory (LCI) Analysis
In order to evaluate the environmental impact of the system, the material and energy flow related to the entire lifecycle of all the components were defined. The life cycle starts with the extraction of raw materials and ends with the disposal of the components. Materials recycling was assumed for the most common metals, such as steel, aluminium, and copper. In addition, the impact of the transport phase was taken into account for the PV solar plant and for the air storage system (which are by far the most important components in terms of mass).
The PV plant in this study is based on the 2020 IEA-PVPS Task 12 report [
13], with additions from the same 2011 report [
14], while the construction of the ACAES plant is based on the work of Bouman et al. [
5]. The compressors, turbines, and motor generators are modeled based on the work by Kapila [
3]. The impact of the heat exchangers is considerably lower than that of the other components and is therefore neglected. The thermal storage systems are taken from the work of Nandi et al. [
15]. The underground cavern is based on a decommissioned mining tunnel located about 500 m below ground level, and the entire cavern is assumed to be sealed with a state-of-the-art lining in order to minimize air leakage and to be able to withstand a maximum operating pressure of 100 bar. The lining consists of a 50-cm-thick layer of reinforced concrete, while the inner surface directly exposed to the compressed air is sealed with 2 cm of fiber-resin reinforced plastic and 2 cm of steel. The general structure, except for the steel layer, is taken from work by Jiang et al. [
16]. The gas pipeline is adapted from the paper by Wulf et al. [
17]. The recycling of metallic materials is modeled using the “avoided impact” approach, in which 1 kg of recycled material replaces a defined amount of an equivalent raw material. The recycled steel replaces a similar amount of cast iron, and the aluminium waste is assumed to be melted to produce a similar amount of secondary aluminium. The copper waste is refined (via “fire refining” and “electrolytic refining”) to remove impurities and to produce secondary copper, as described by Chen et al. [
18].
2.4.4. Life Cycle Impact Assessment (LCIA)
An impact evaluation was carried out using the Impact 2002+ method [
19], with an intermediate subdivision (midpoint) into 15 impact categories, which can be summarized in the following four damage indicators: human health (carcinogens, non-carcinogens, respiratory organics, respiratory inorganics, ionizing radiation, ozone layer depletion); ecosystem quality (aquatic ecotoxicity, terrestrial ecotoxicity, terrestrial acidification/eutrophication, aquatic acidification, aquatic eutrophication, land occupation); climate change (global warming); resources (non-renewable energy, mineral extraction).
3. Results and Discussion
In this section, the results of an analysis of the five different configurations of the PV-ACAES system, based on both air storage solutions, are reported and discussed. The results achieved for the integrated PV-ACAES system are compared with those of an energy supply configuration based on a PV power plant with no energy storage section.
3.1. LCA Analysis of the PV System without Energy Storage
The use of RES power generation plants with no energy storage section are the simplest option for improving the energy self-consumption of the end users. For this reason, the initial scenario considered in this study is represented by the five configurations of PV power plants with no energy storage (
Table 3). As previously discussed, only a fraction of the energy produced each year by the PV power plant can be directly consumed by the end users, and the remainder is assumed to be curtailed.
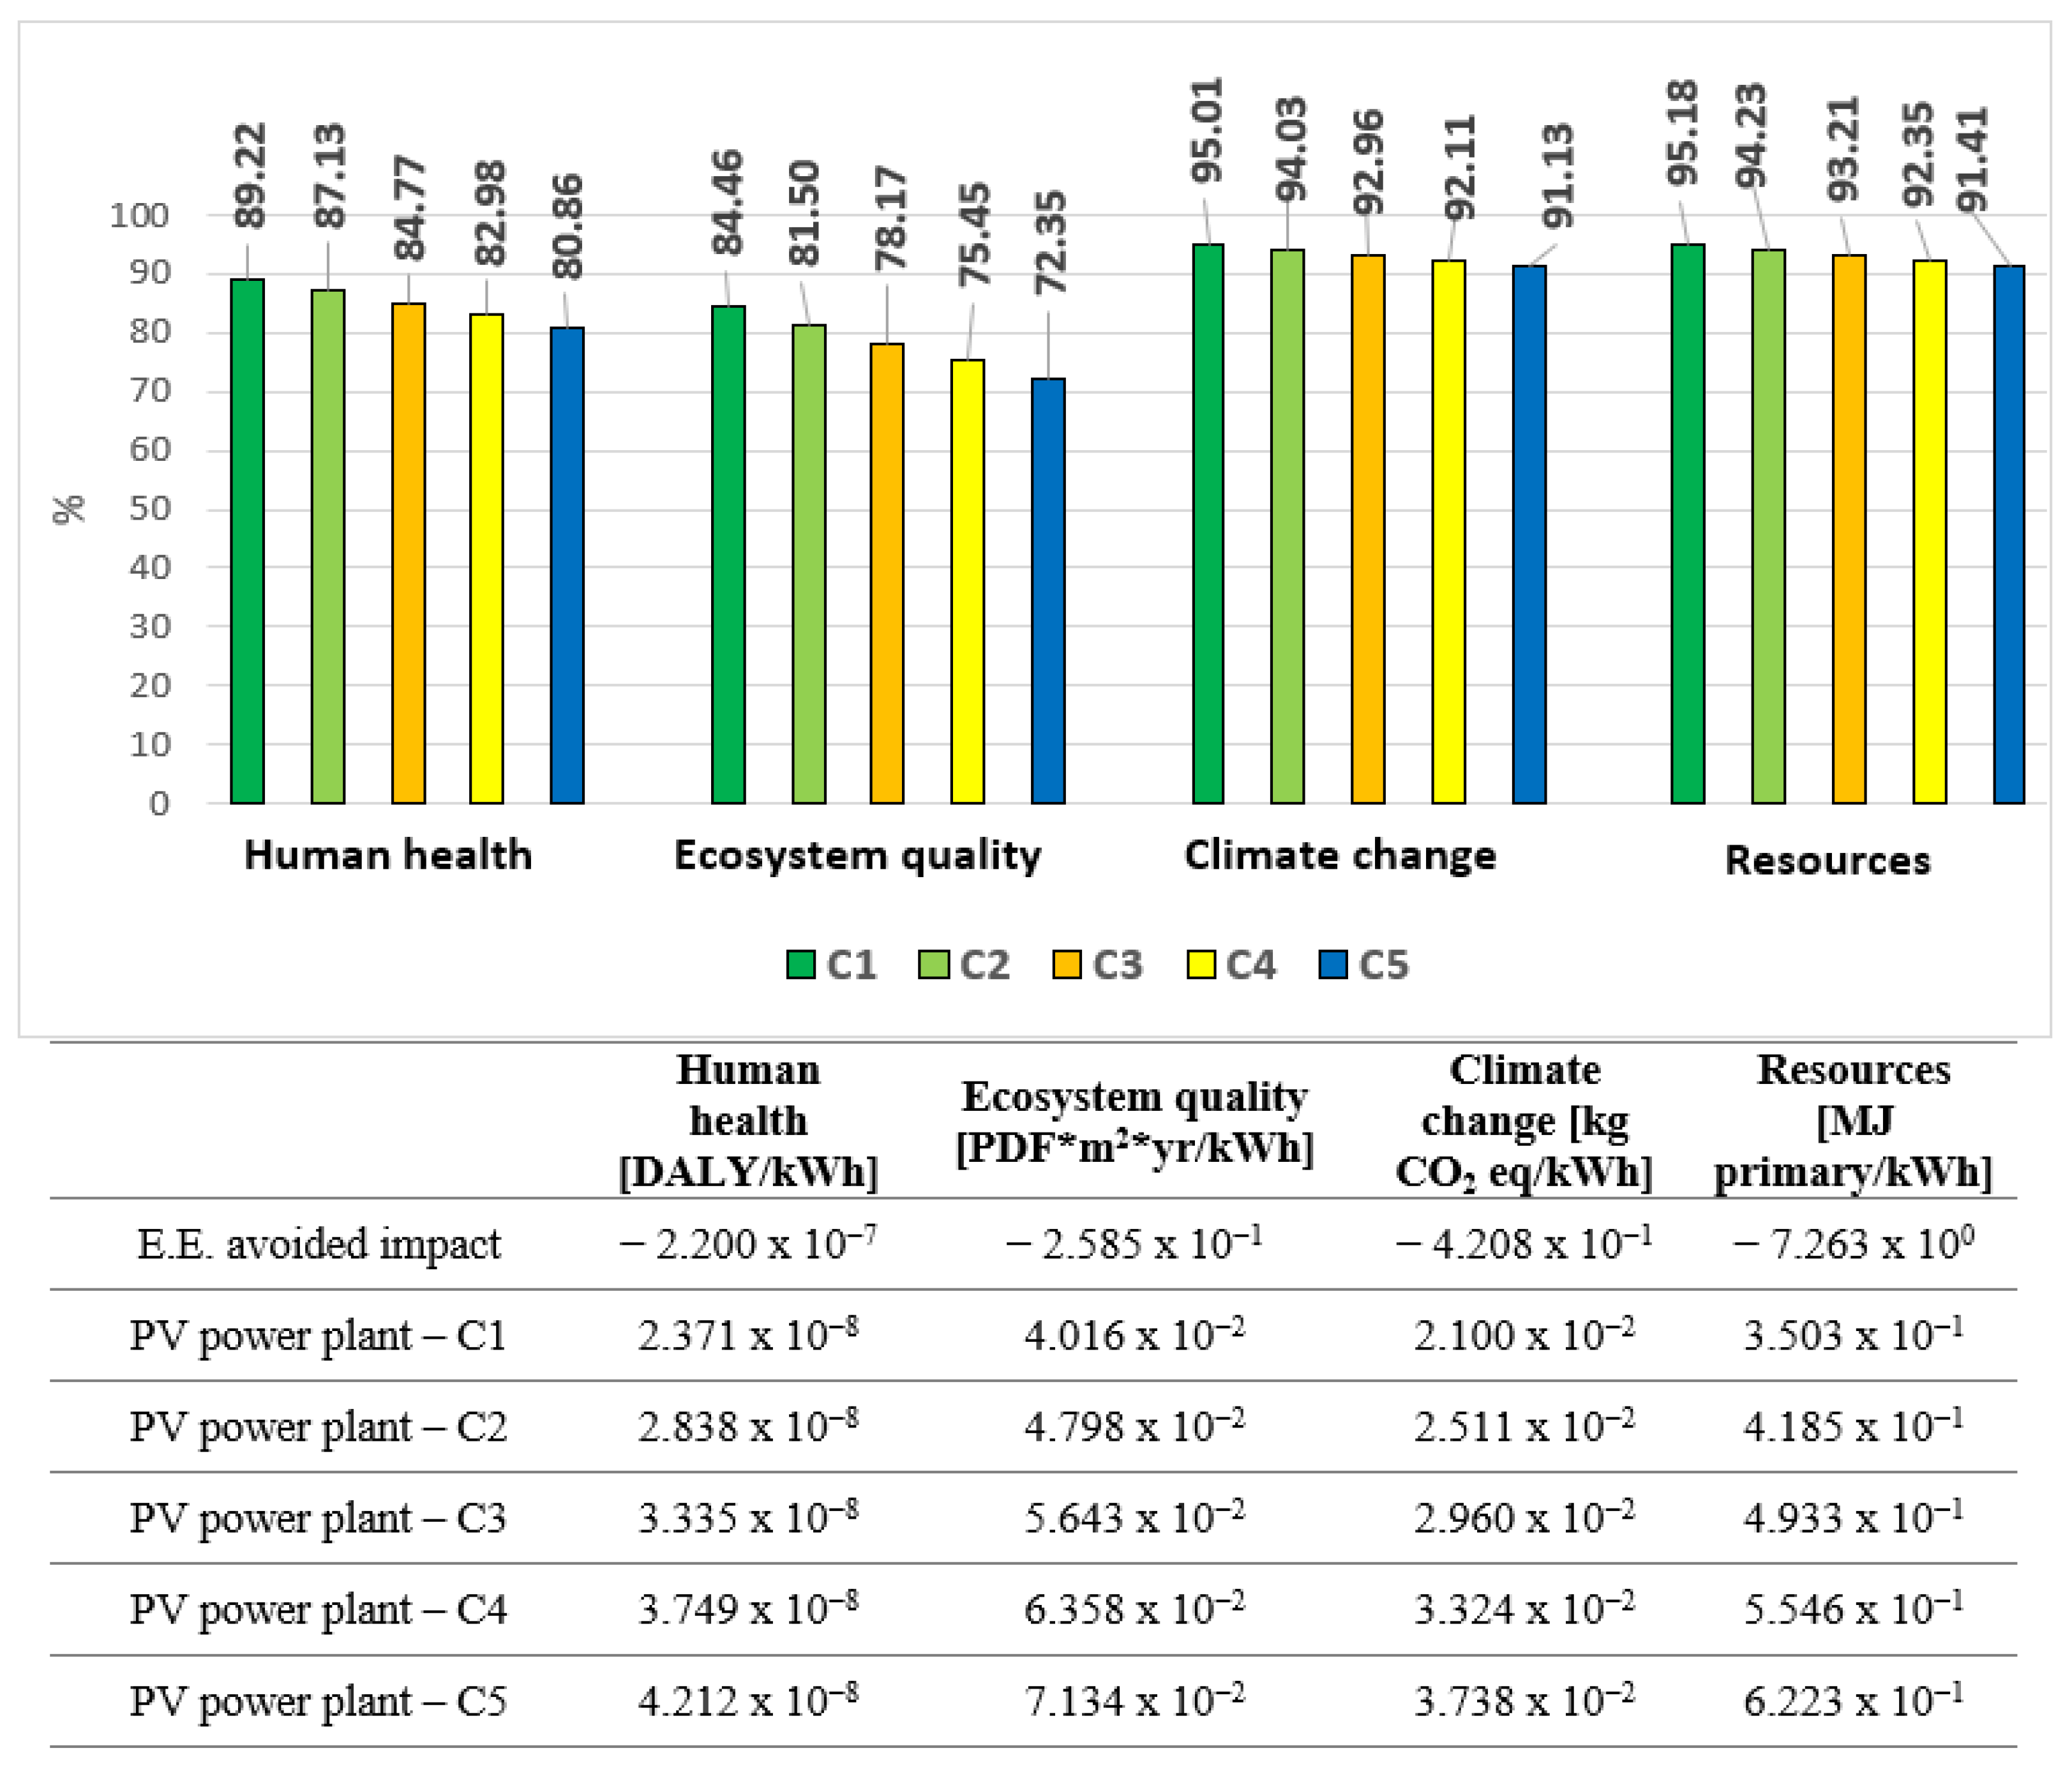
Figure 5 shows the results of the LCA analysis. For each impact category,
Figure 5 gives the values of the impact category indicators and the avoided impact due to the substitution of the electrical energy (E.E.) supplied by the grid. The E.E. avoided impact is the same for all configurations since it is referred to as the functional unit of 1 kWh of electrical energy. The bar graph shows the reduction in the impact of the PV plant in comparison with that of the reference scenario.
In terms of damage indicators, the benefits arising from the avoided impact far outweigh the harmful impact of the PV power plant for all configurations. The impact reduction is around 91–95% for climate change and resource consumption, 81–89% for human health, and 72–84% for ecosystem quality. Overall, the best configuration in terms of avoided impact is C1 (20 MW). Moreover, increasing the size of the plant leads to only a minor improvement in the share of energy directly supplied to the end users while the overproduction greatly increases; in fact, the energy supplied to the end users by the PV plant in configuration C5 (40 MW) is only 2.36 GWh/year higher than that of configuration C1, while the overproduction rises from 13.2 GWh/year to 42.8 GWh/year.
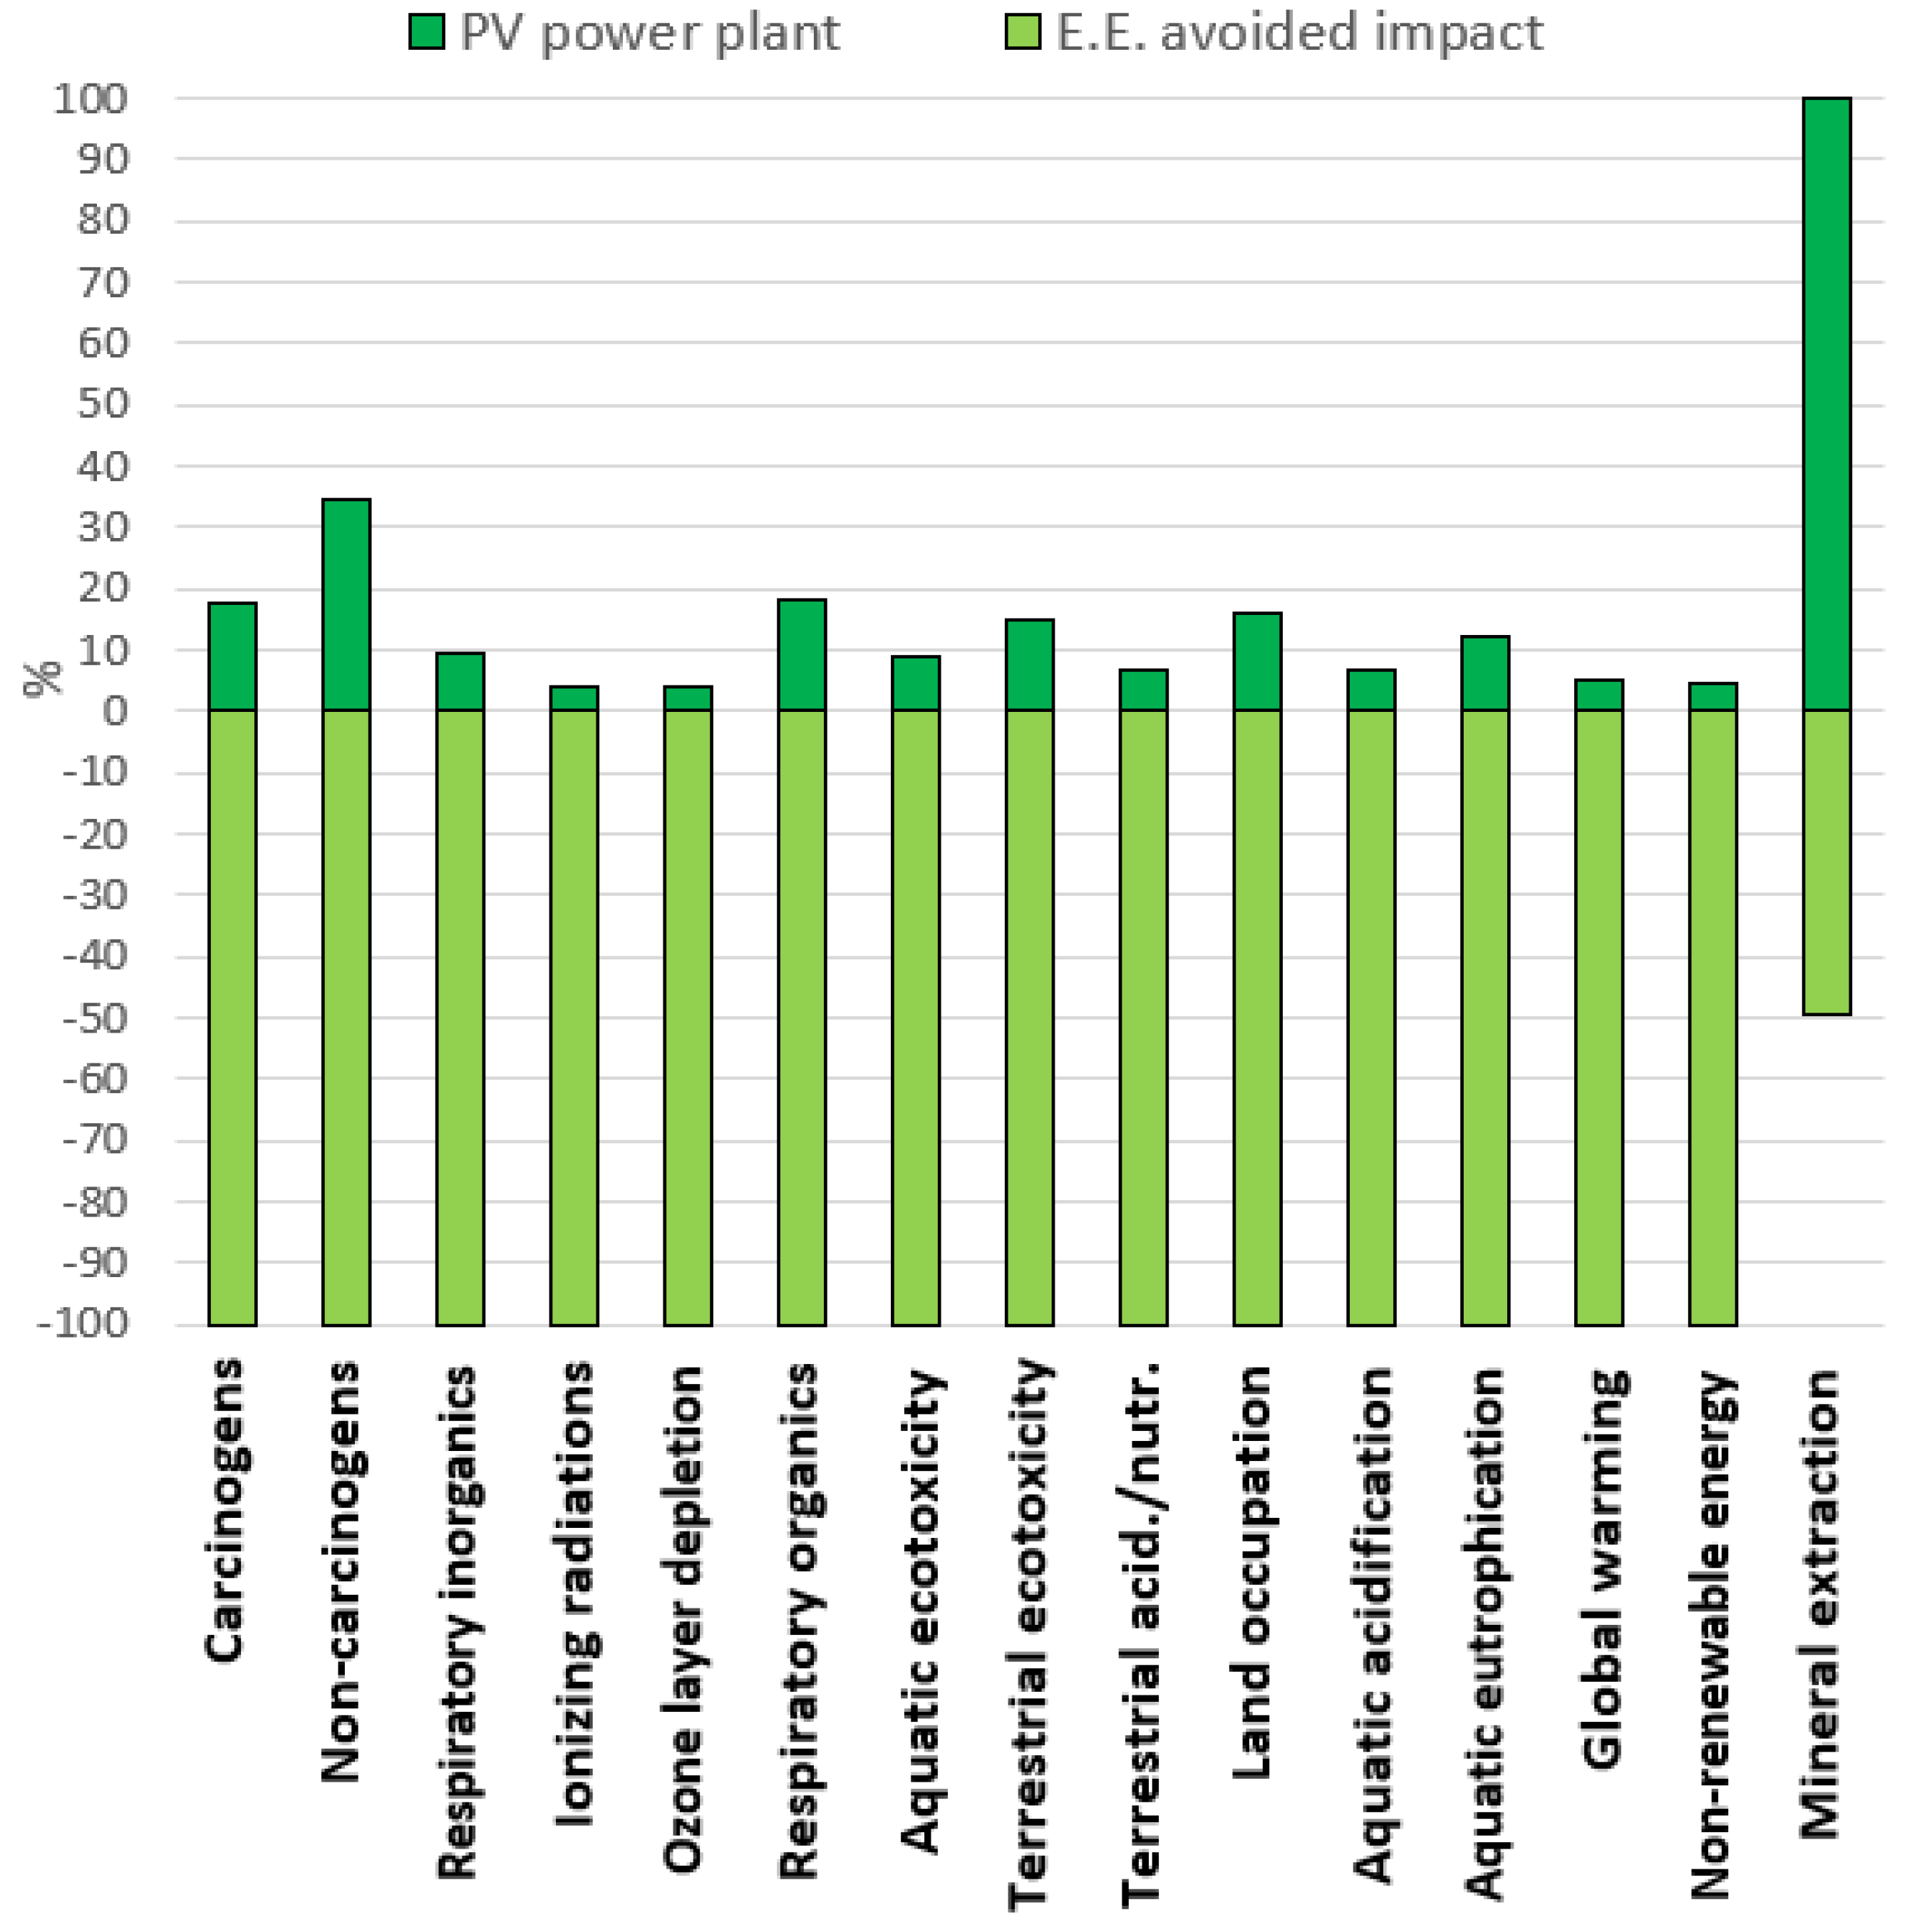
The environmental benefits from the substitution of grid energy are also positive if midpoint indicators are taken into consideration, with the exception of mineral extraction. In this case, the avoided impact does not compensate for the large amounts of metals (steel, copper, aluminium, tin) required for the construction of the PV power plant. Nevertheless, the resources category shows a very favorable result, thanks to its great advantage in terms of non-renewable energy consumption.
Figure 6 shows the midpoint indicators for the PV power plant of configuration C1 and the corresponding avoided impact due to the substitution of the electrical energy (E.E.). The figures for the other four configurations are similar.
3.2. LCA Analysis of the PV-ACAES System with Underground Air Storage
The introduction of an ACAES section allows for a proportion of the PV overproduction to be stored, thereby further improving the RES self-consumption of the end user, even if it worsens the environmental impact due to the construction, operation, dismantling, and final disposal of the plant components.
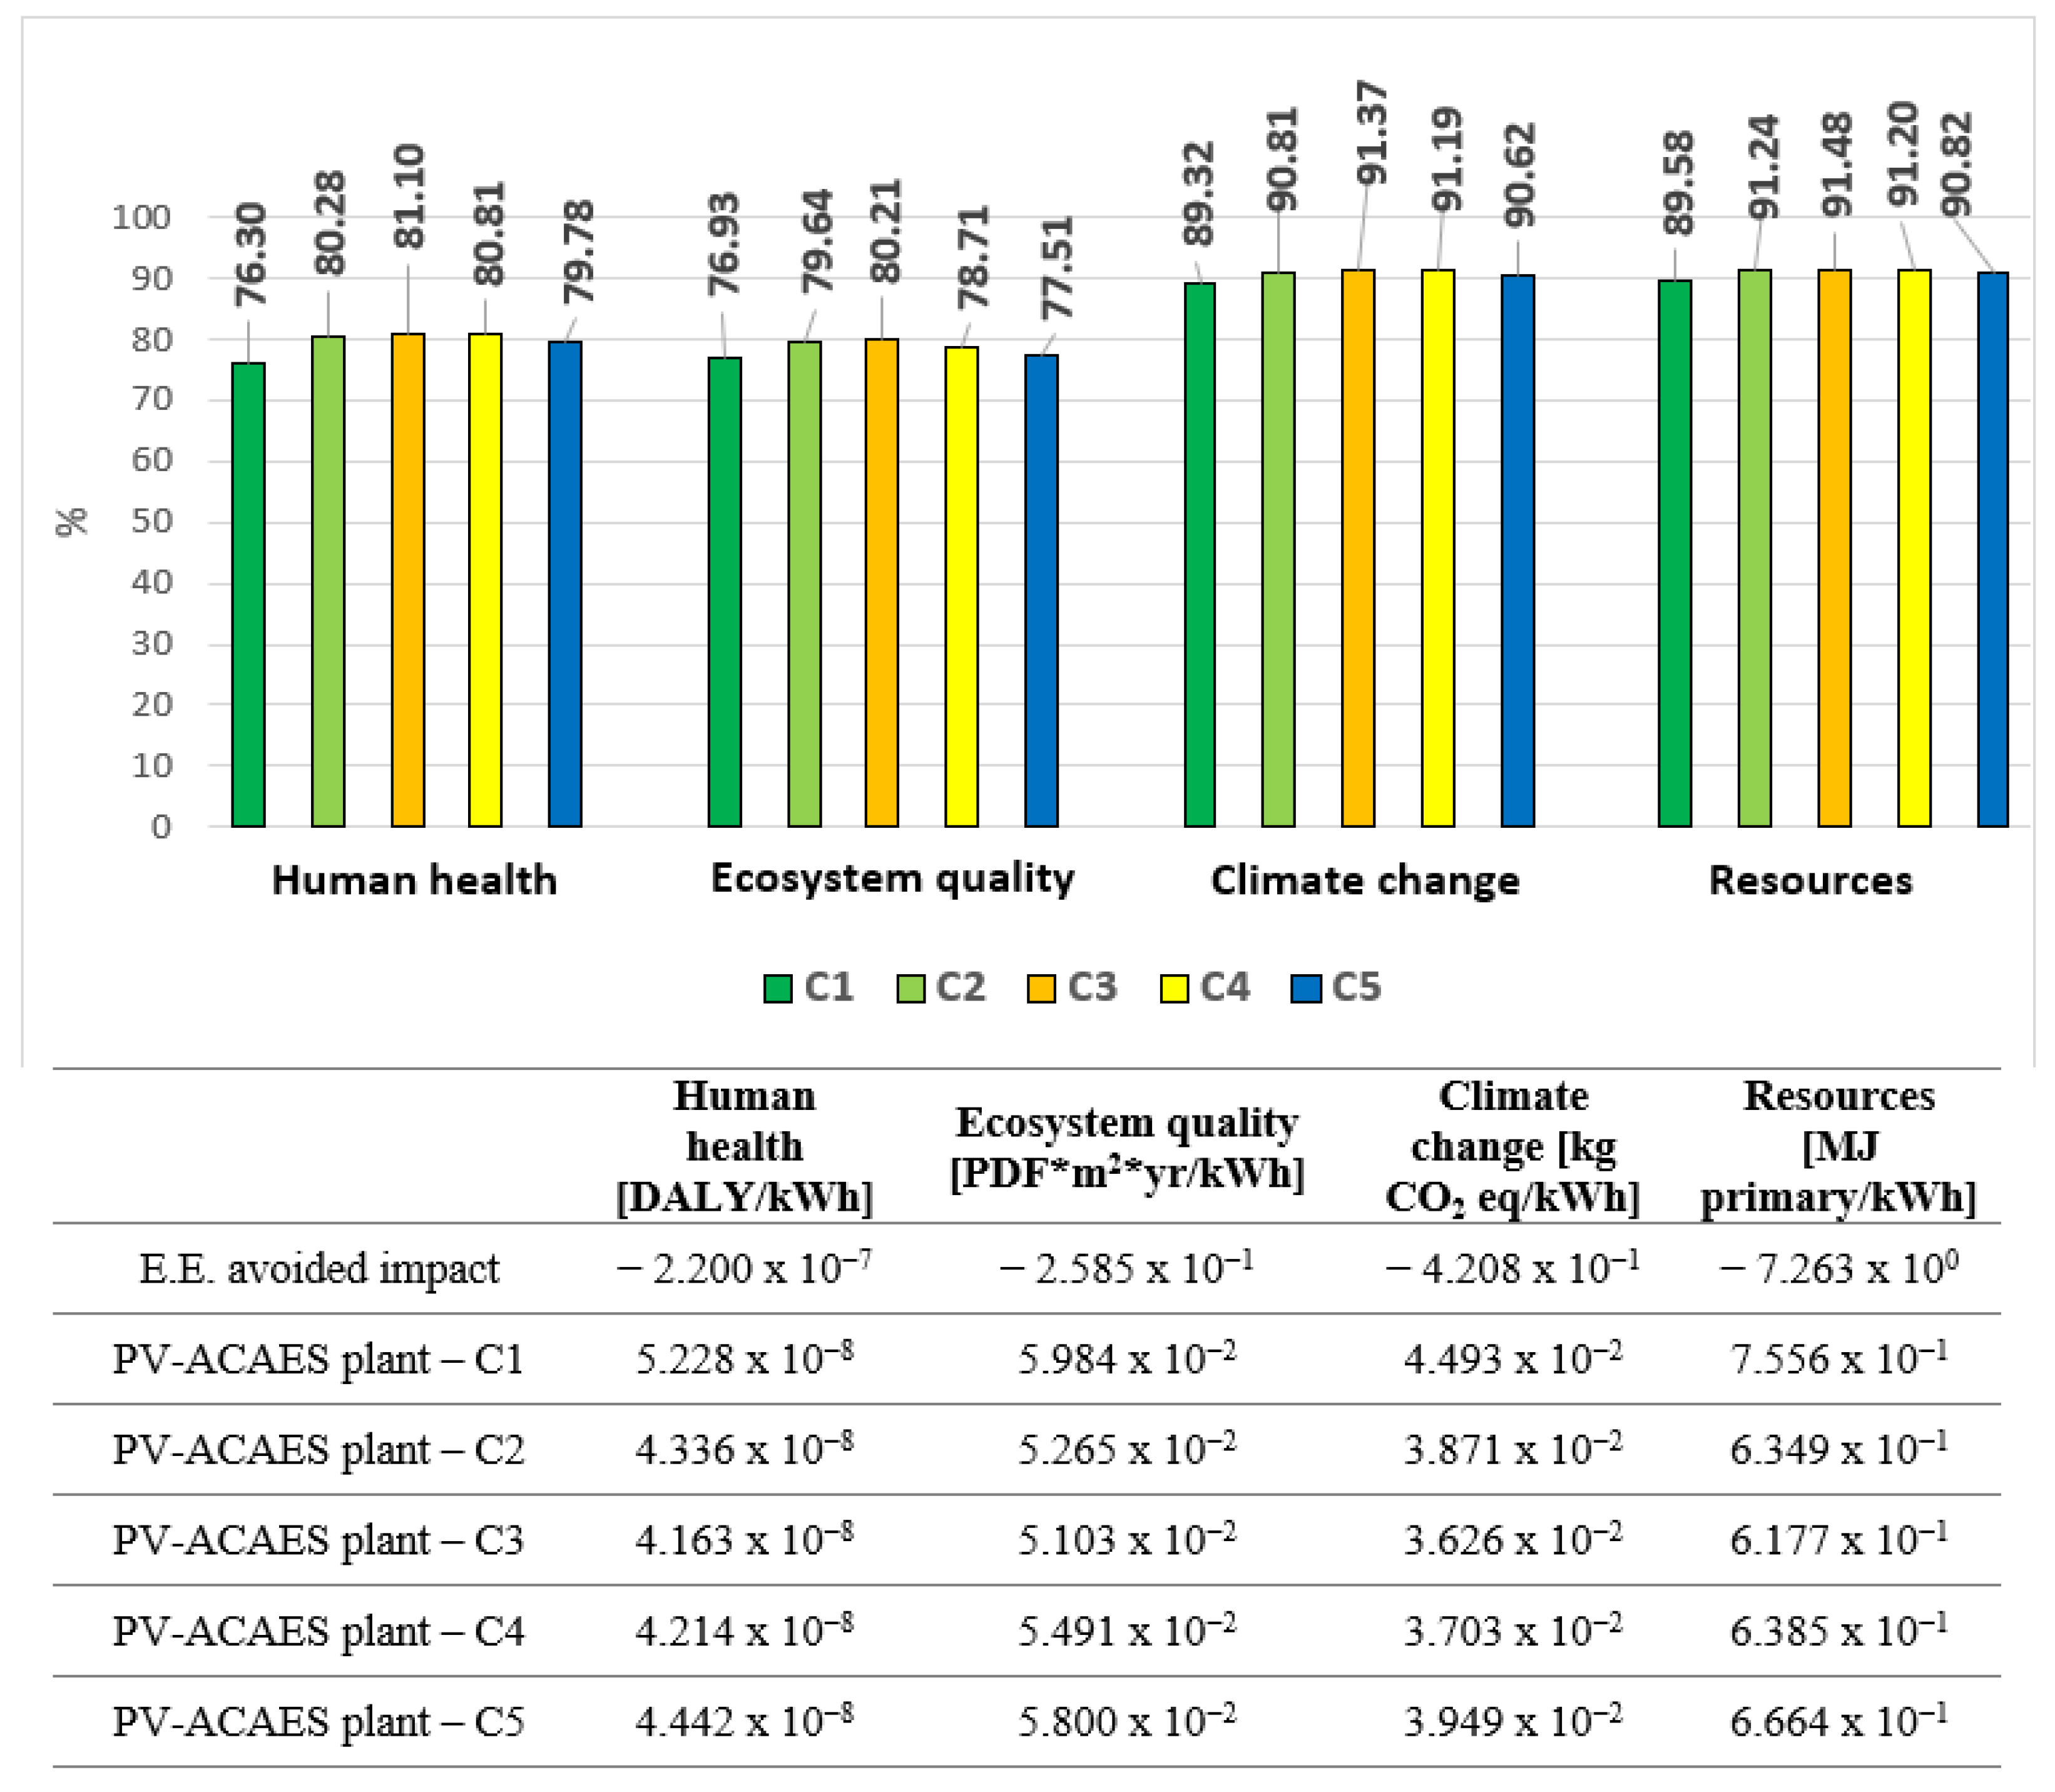
Figure 7 shows the results of an LCA for the five PV-ACAES configurations in which the compressed air is stored in a decommissioned mining tunnel. For all damage categories and for all configurations, the energy supply from the PV-ACAES system allows for a reduction in the environmental impact in comparison to the reference scenario (in which the energy is entirely supplied by the grid). In fact, the overall avoided impact arising from the substitution of the energy grid (E.E. avoided impact) far outweighs the environmental impact of the system components. The impact reductions are around 89–91% for climate change and resource consumption, 76–81% for human health, and 77–80% for ecosystem quality.
Figure 7 also shows that the best option in terms of avoided impact is configuration C3, which is characterized by a medium-sized PV power plant (30 MW). In this configuration, about 52% of the PV overproduction can be used to power the ACAES compressors. In contrast, in configuration C1, only about 10% of the overproduction can be utilized by the ACAES system, thus offering very few benefits in terms of improvements in RES self-consumption. The other configurations (especially C2 and C4) are very close to C3 in terms of their environmental impacts. A comparison between
Figure 5 and
Figure 7 for configuration C3 shows that the impact per kWh for the PV-ACAES system is slightly worse in three out of four damage categories; the sole exception is the ecosystem quality, which is slightly better. Finally, configuration C3 with the ACAES section is worse in every impact category compared with configuration C1 without the ACAES section.
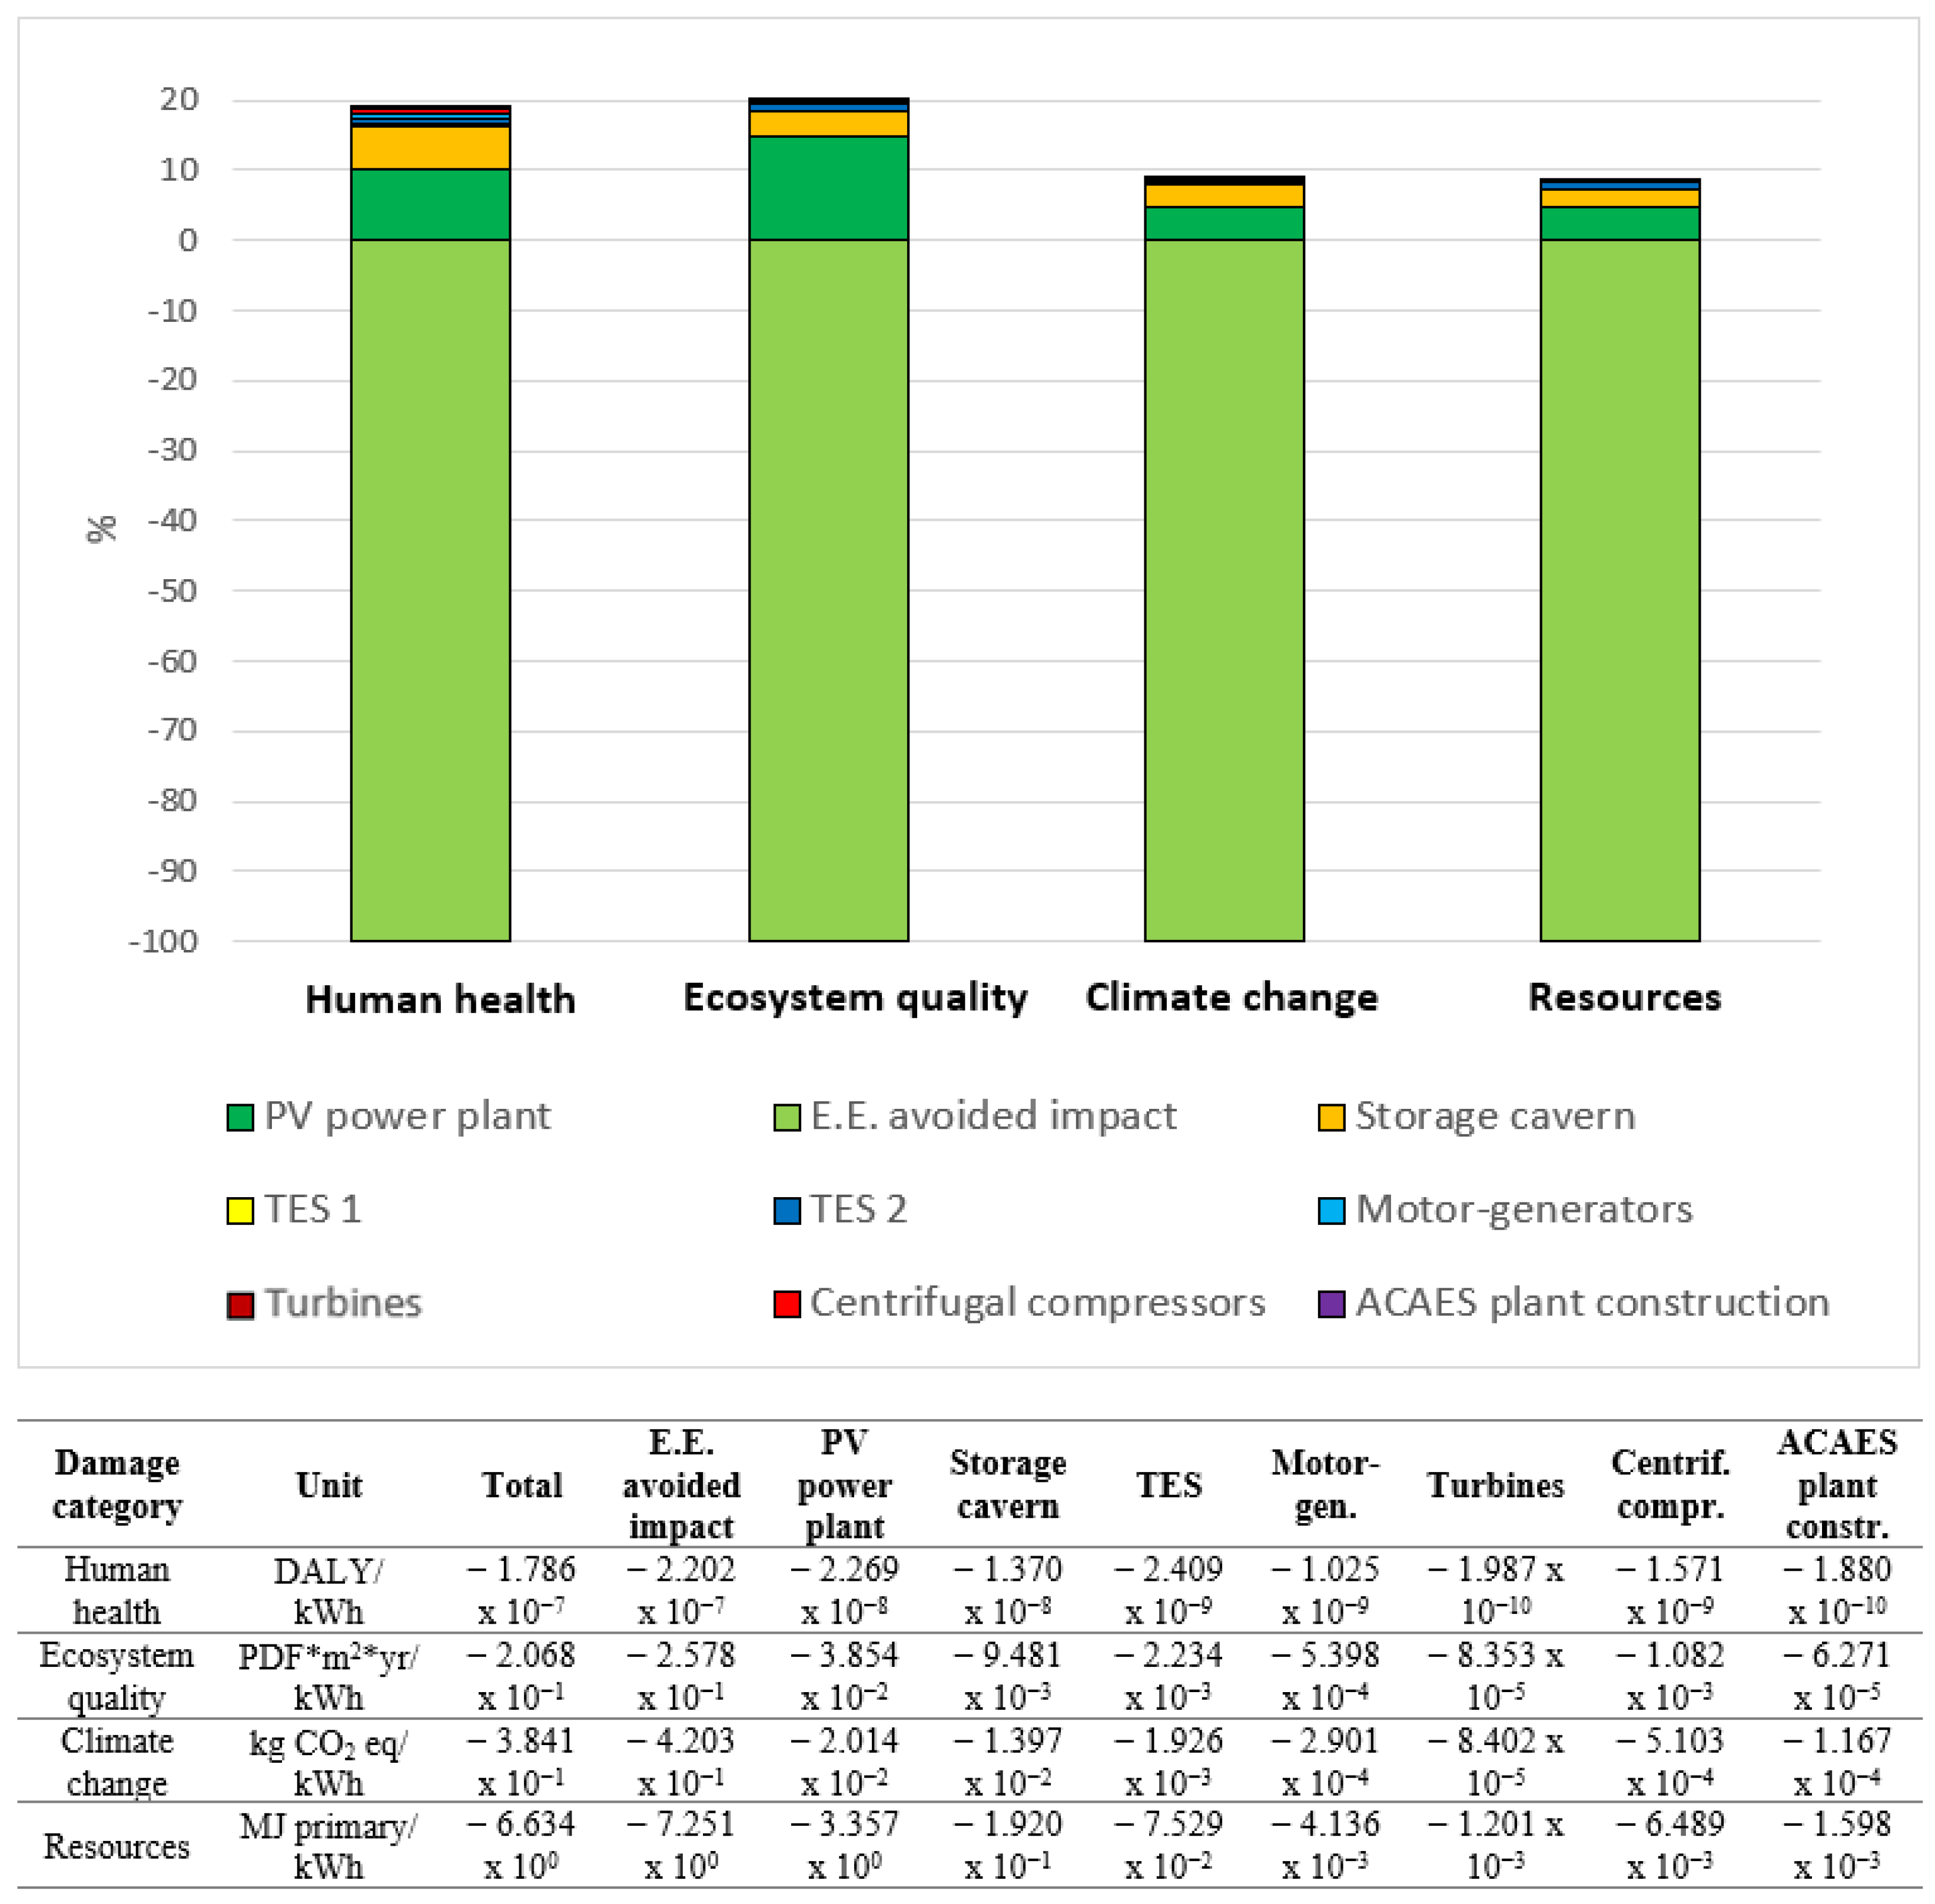
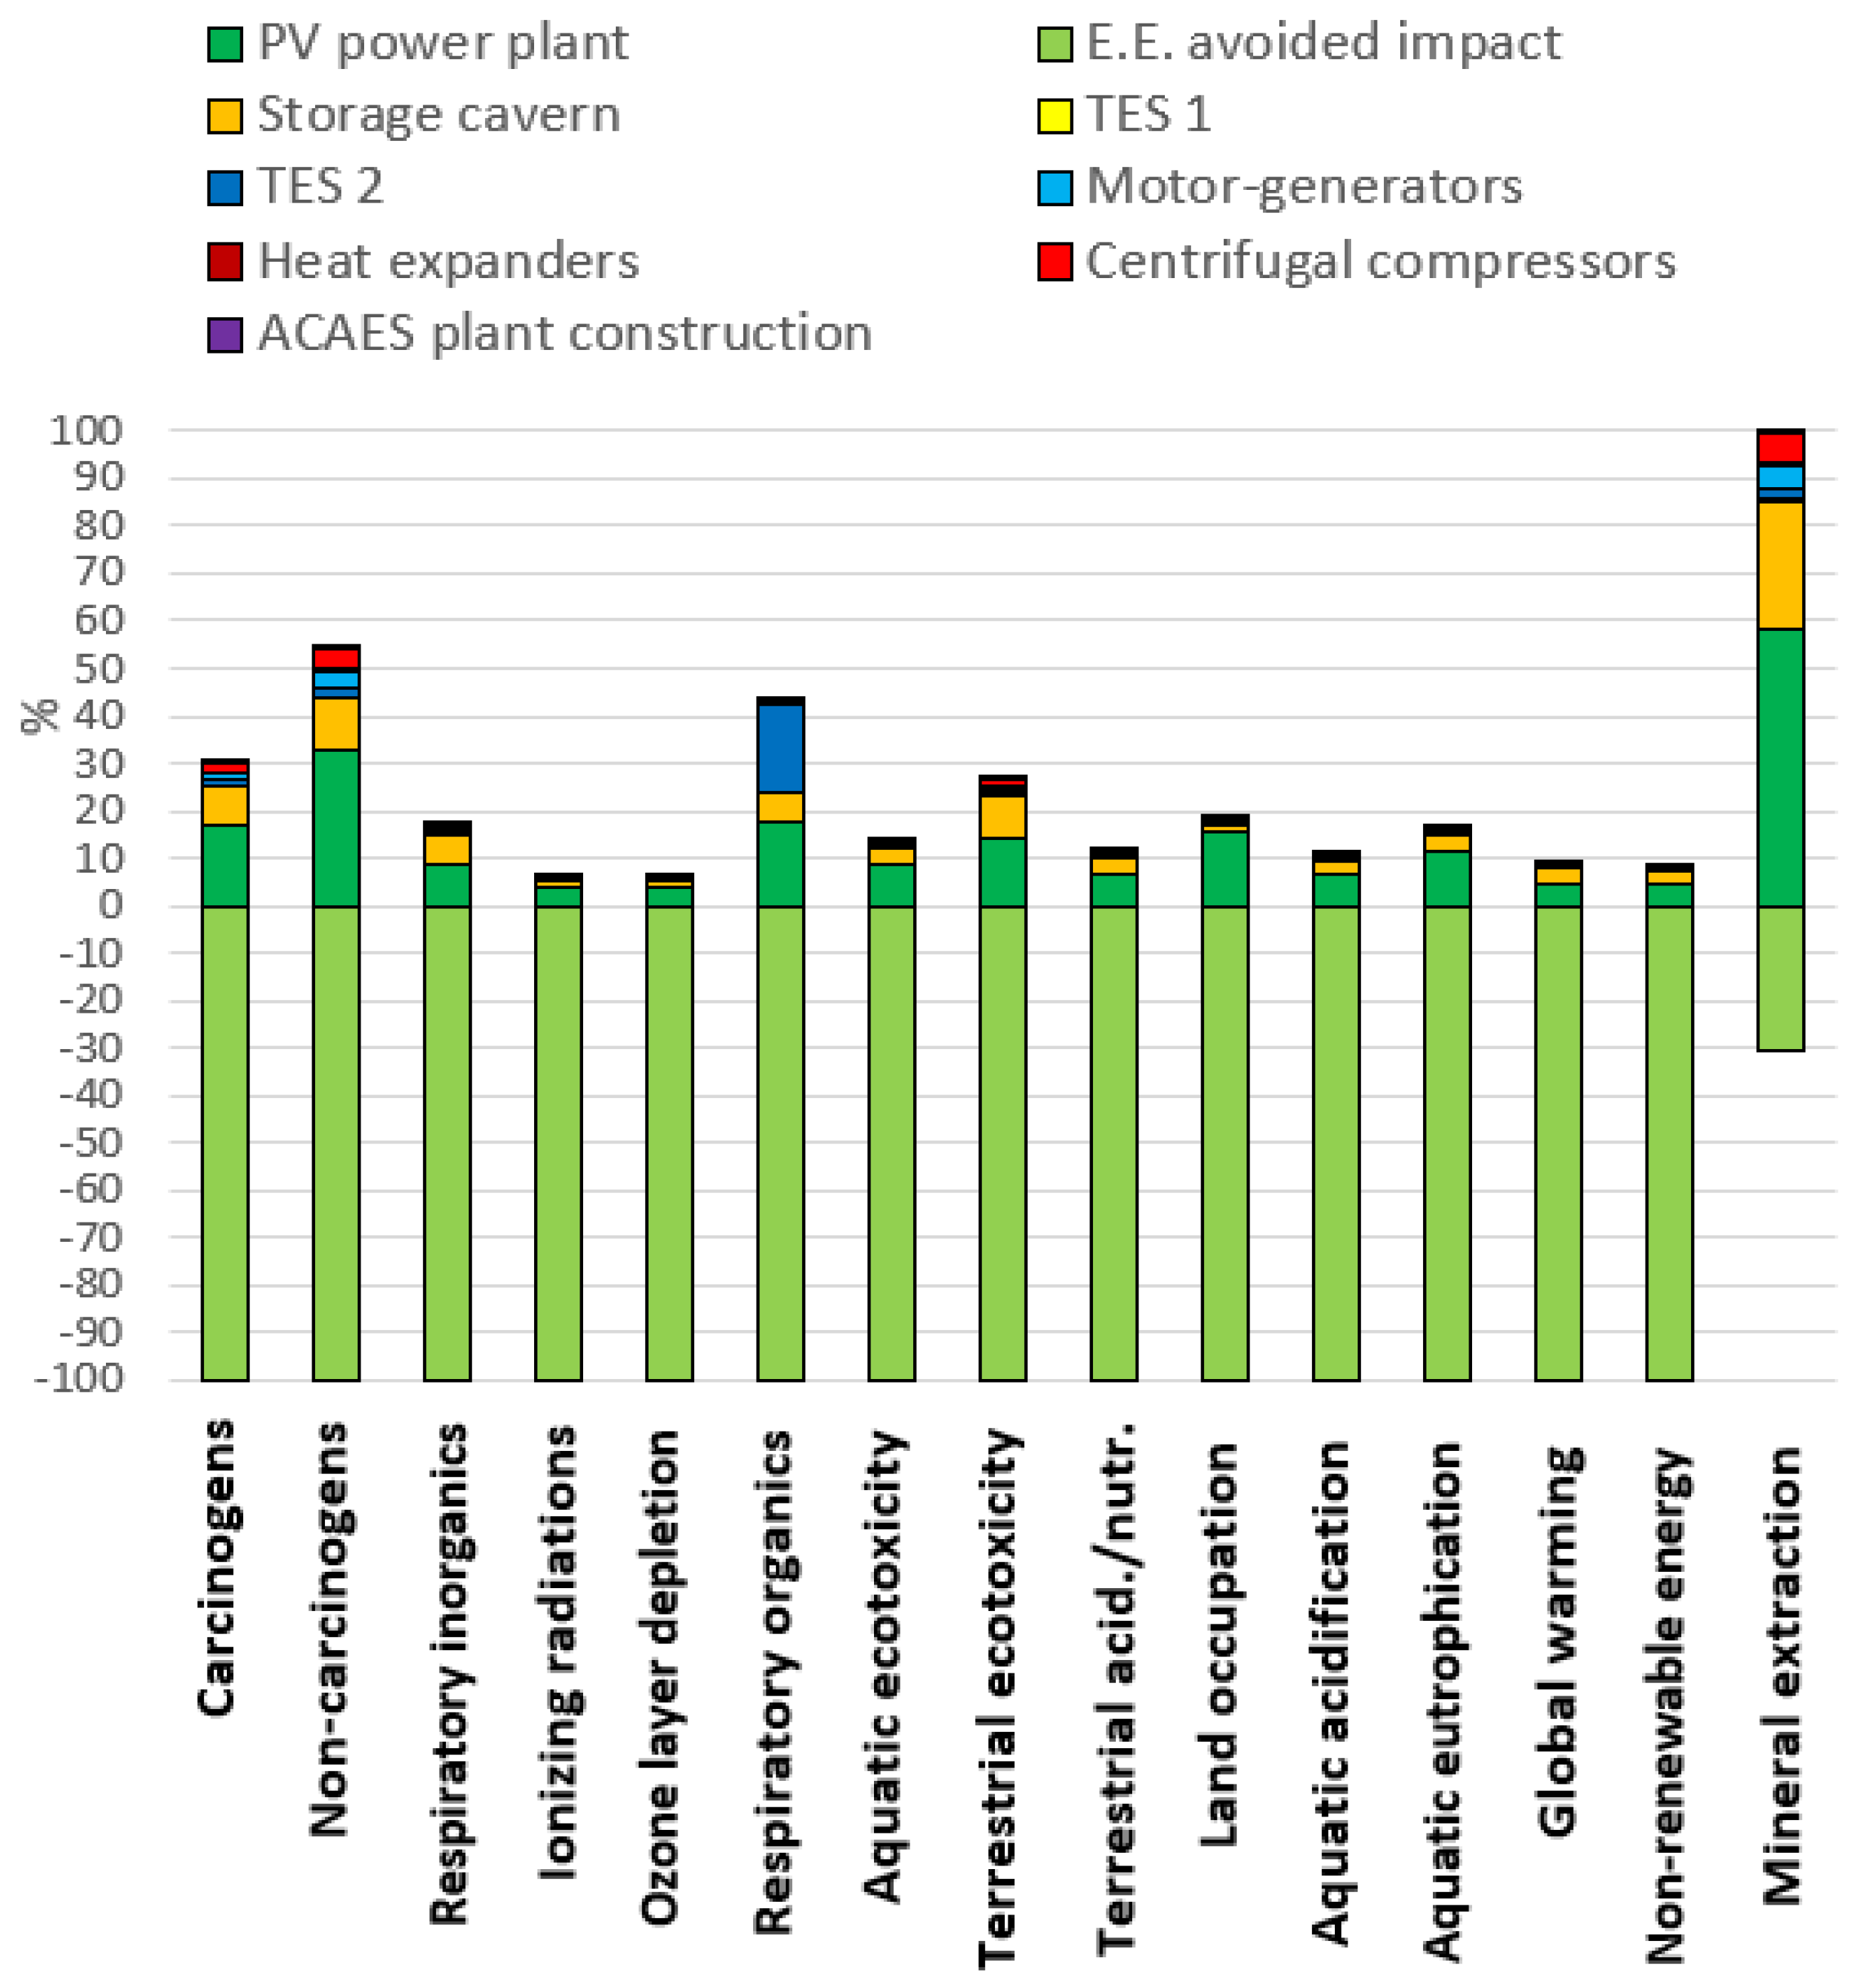
Figure 8 shows the results of the LCA analysis in more detail for the integrated PV-ACAES system in configuration C3. It can be observed that the harmful impact of the PV-ACAES system mainly arises from the PV power plant, especially for the category of ecosystem quality, and is due to the land occupied by the modules. The impact of the ACAES system is mainly caused by the use of the underground storage cavern. In particular, the harmful contribution of the air storage section to the human health, climate change, and resources categories is roughly half that of the PV power plant. This is due to the considerable amounts of steel, reinforced plastic, and reinforced concrete needed for the tunnel lining. In comparison, the impact of the other components is negligible.
Figure 9 shows the midpoint indicators for the same configuration and highlights the impact arising from mineral extraction.
3.3. LCA of the PV-ACAES System with Air Storage in Gas Pipelines
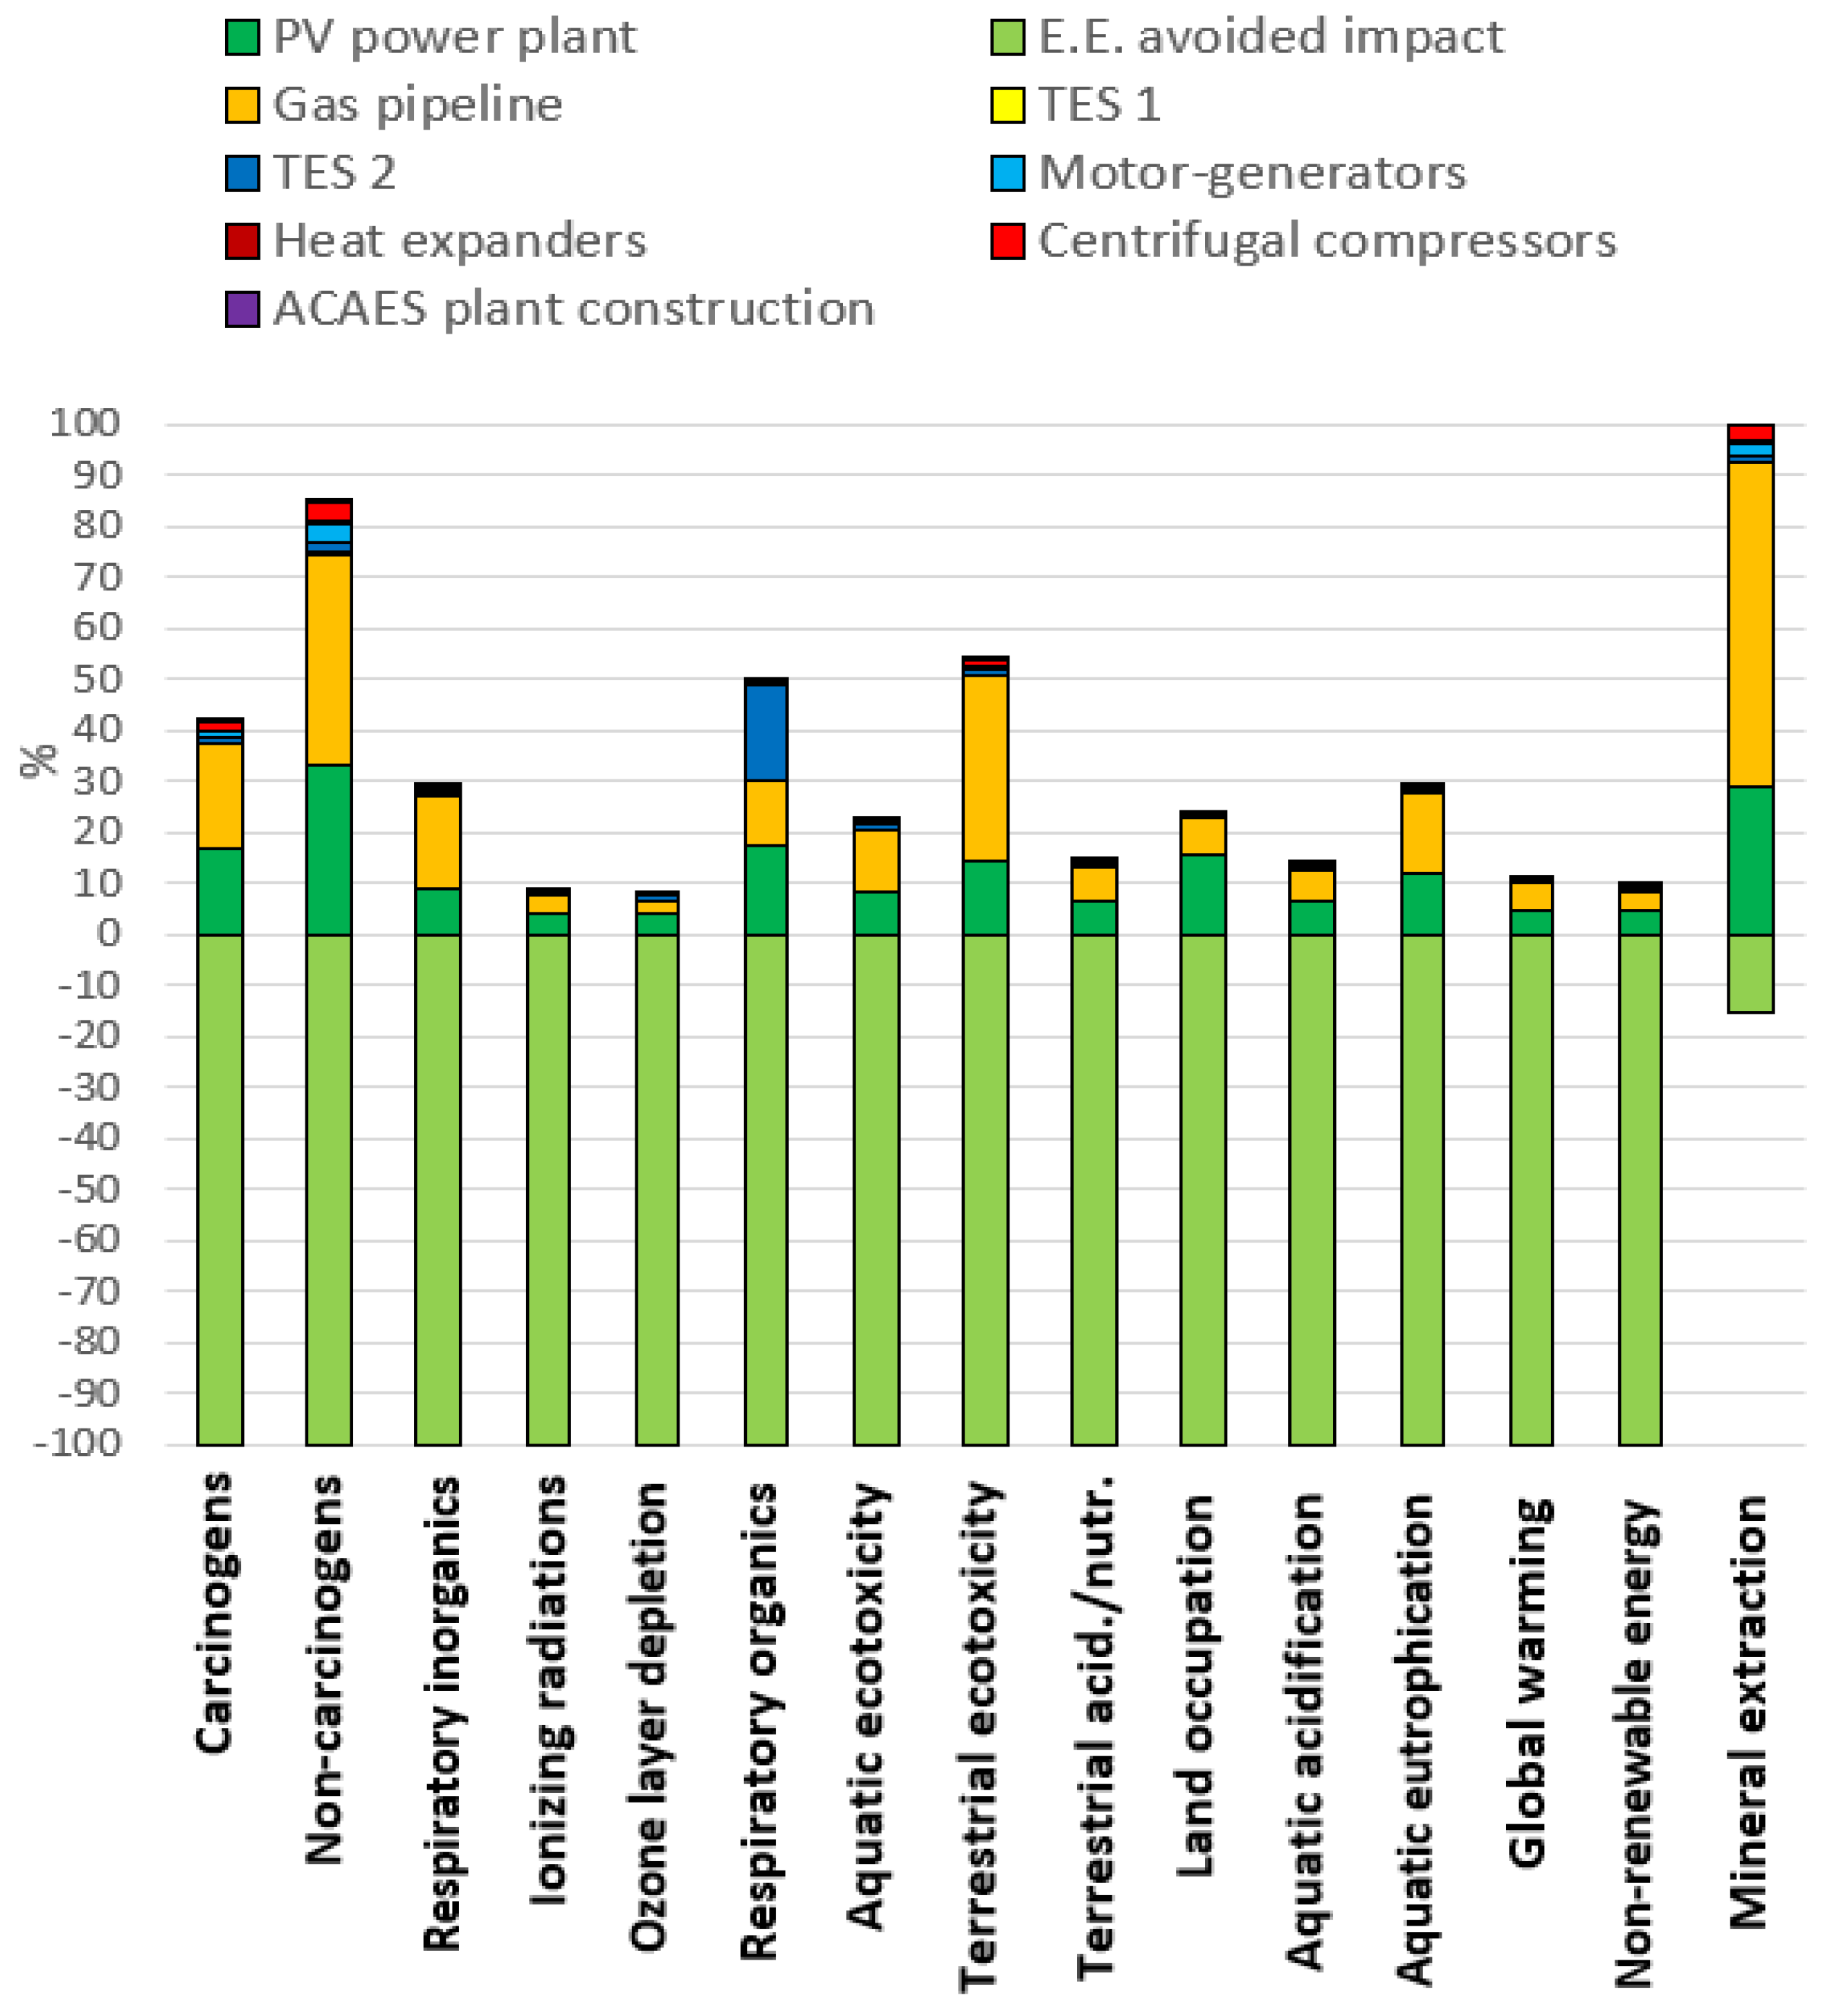
Figure 10 shows the results of the LCA analysis for the integrated PV-ACAES plant with compressed air storage based on a gas pipeline. Once again, for all damage categories and all configurations, the energy produced by the PV-ACAES system allows for a reduction in the environmental impact compared to the reference scenario (E.E. avoided impact). However, in comparison to underground air storage, the use of gas pipelines gives a lower impact reduction, especially for human health and ecosystem quality. It can be seen from
Figure 10 that the impact reductions are around 86–90% for climate change and resource consumption, 56–67% for human health, and 60–67% for ecosystem quality. The best configuration is again C3, except for the human health category, in which configuration C4 has a slight advantage. Configurations C2, C4, and C5 are again very close to C3 in terms of overall environmental impact. In this case, however, the large amounts of steel required for the construction of the gas pipeline give rise to a considerably higher impact than that of the underground cavern.
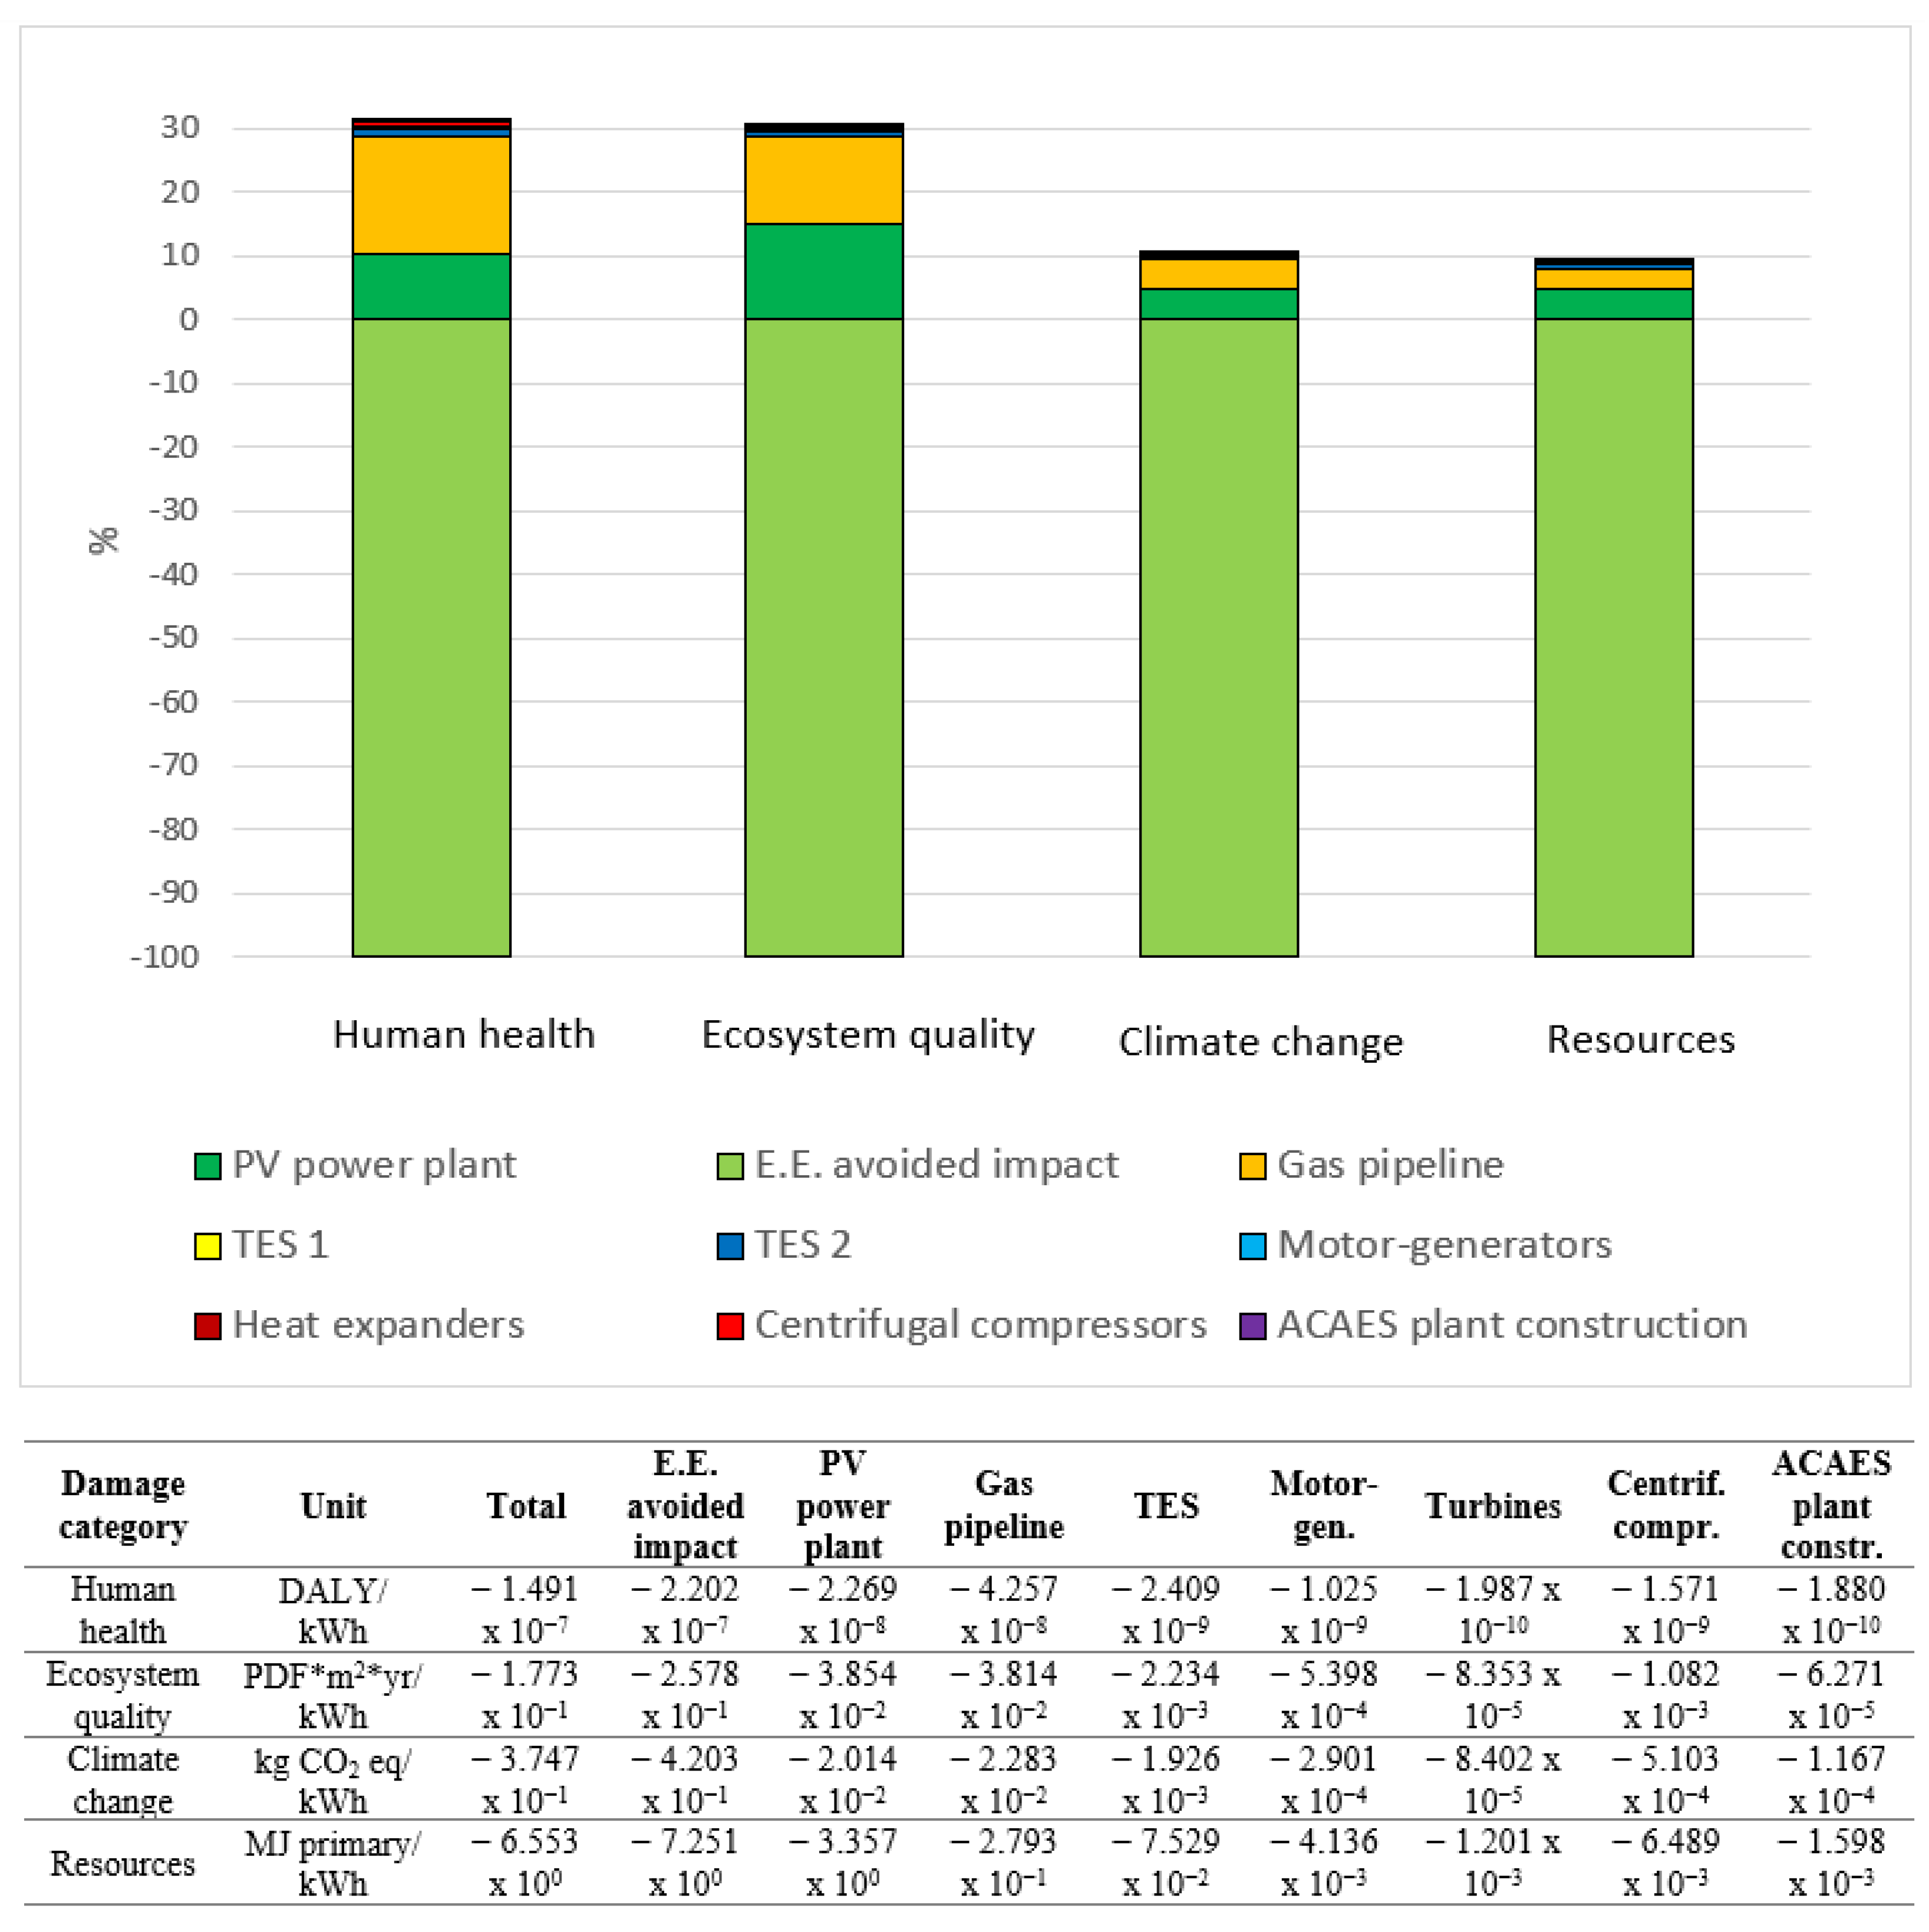
Figure 11 shows the results of the LCA in more detail for configuration C3, in which the compressed air is stored in a gas pipeline, and highlights the impact arising from the large amounts of steel required for the construction of the gas pipeline. The impact of the gas pipeline is considerably higher than that of the PV power plant for the human health category, whereas the impacts are roughly comparable for the remaining categories. The role of the gas pipeline can be seen in
Figure 12, which shows the midpoint indicators for configuration C3.
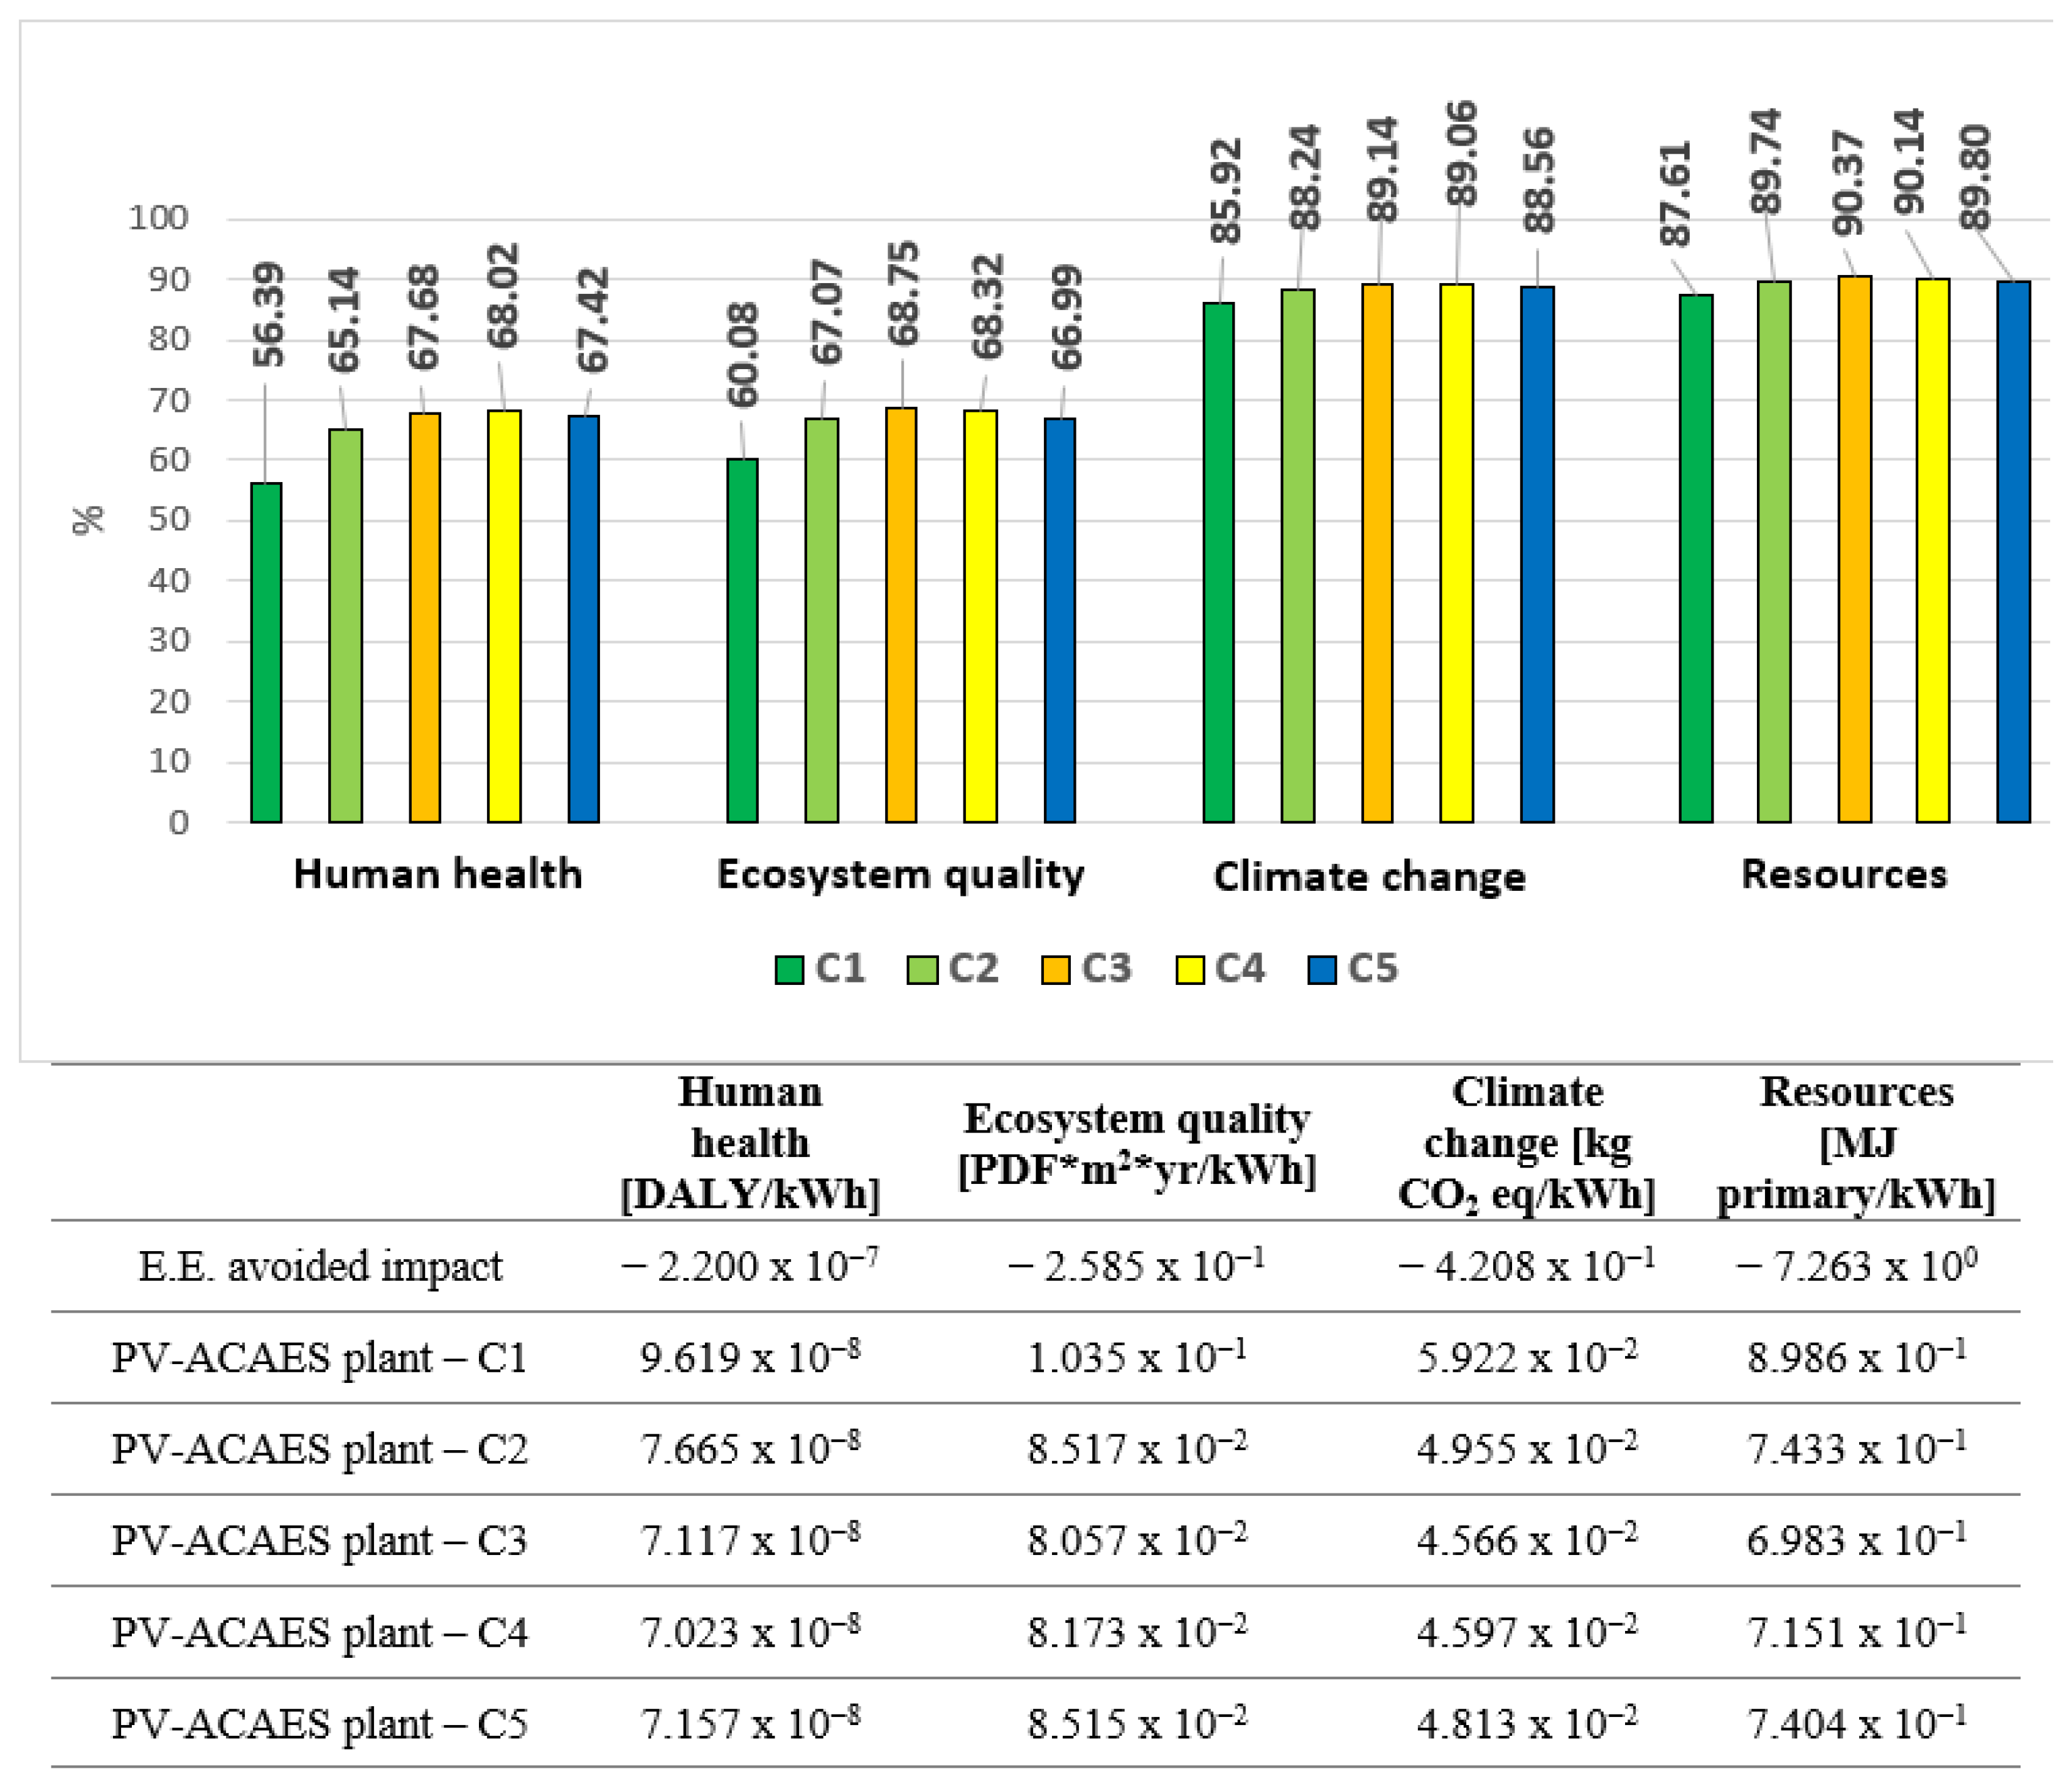
Table 5 compares the overall results for the best configurations, i.e., C1 for the PV power plant without energy storage and C3 for the PV-ACAES system. For all damage indicators,
Table 5 shows the benefits arising from the replacement of grid energy with PV energy. As previously discussed, the integration of the ACAES section allows for an increase in self-consumption from 38.6% to 61.4%. However, the impact arising from the construction, operation, dismantling, and final disposal of the ACAES components worsens the environmental impact for all four damage categories, and this is particularly true if air storage solutions based on gas pipelines are used. The best results in terms of environmental impact reduction are found for the C3 configuration with air storage in a decommissioned mining tunnel. In comparison to the reference scenario, this configuration reduces the environmental impact by about 80–91%, depending on the impact category considered.
A direct comparison with the results of other LCA studies is hampered by the differences in terms of the functional units and RES sources used. Moreover, most LCAs of ACAES systems focus only on GHG emissions and do not consider other impact categories. For example, as shown in
Table 5, the GHG emissions calculated for the two integrated PV-ACAES systems are 36 and 46 g CO
2-eq/kWh, values that are lower than those calculated in other studies. For a 118 MW ACAES system, Kapila et al. [
3] estimated GHG emissions of 232 g CO
2-eq/kWh, while for a 100 MW system, Abdon et al. [
4] estimated GHG emissions of between 161 and 247 g CO
2-eq/kWh. For a 400 MW wind farm integrated with a CAES system, Bouman et al. [
5] calculated GHG emissions of about 118 g CO
2-eq/kWh. However, these LCA studies compare the GHG emissions to the electrical energy produced by a single ACAES section, whereas the GHG emissions calculated here refer to the electrical energy supplied by the overall PV-ACAES system (68% of this energy is directly supplied by the PV plant, while 32% is supplied by the ACAES system).
4. Conclusions
An LCA of a PV-ACAES system designed to meet the energy demand of a small town was carried out in this study. For five different sizes of the PV plant, ranging from 20 to 40 MW, the environmental impact of the power plant was determined based on the following three scenarios: (1) a standalone PV plant that was directly connected to the end user; (2) an integrated PV-ACAES plant where an underground decommissioned mining tunnel was used for compressed air storage; (3) an integrated PV-ACAES plant using a gas pipeline for air storage. The environmental impacts of these three scenarios were compared with that of a reference scenario in which the electrical energy was fully supplied to the end user from the grid.
This study demonstrated that substituting grid energy with PV energy leads to benefits in all four damage categories (human health, ecosystem quality, climate change, and resources) and in 14 out of the 15 midpoint indicators, with the sole exception of mineral extraction. However, although integrating a PV power plant with an ACAES system improves energy self-consumption, it worsens the environmental impact. This is due to the environmental impacts arising from the construction, operation, and final decommissioning of the ACAES section. Apart from the gas pipeline and the underground storage, the impacts of the ACAES components are negligible in comparison to those of the PV power plant.
The best overall results were obtained for a small PV power plant (20 MW, configuration C1) without energy storage. Of the configurations that included the ACAES system, the best was C3 (30 MW) for both of the scenarios analyzed. In particular, greater advantages were obtained when the compressed air was stored in the underground cavern rather than in the gas pipeline. This was due to the harmful contributions arising from the steel production needed for the construction of the 12 km pipeline.
In summary, substituting the energy supplied by the grid with energy produced by a PV power plant always gives a reduction in the environmental impact in comparison to the reference scenario. In the best configuration, the use of a PV power plant without energy storage gives an energy self-consumption of about 38% and an environmental impact reduction of about 85–95%, depending on the impact category considered. The integration of an ACAES system improves energy self-consumption but worsens the environmental impact, especially when air is stored in gas pipelines. In the best PV-ACAES configuration, the energy self-consumption increases by up to 61%, but the environmental impact reduction is about 80–91%, depending on the impact category considered.
As mentioned previously, the surplus PV production was assumed to be entirely curtailed, and hence, the avoided impact that could be obtained from this PV surplus production was not considered. Therefore, the environmental impact will improve if a portion of the surplus PV production can be sold to the grid. Anyhow, additional research efforts are therefore required to increase the efficiency of energy storage systems and to reduce their environmental impact.
Author Contributions
Conceptualisation, D.C.; methodology, D.M. and L.L.; software, D.M. and L.L.; validation, D.C., D.M. and L.L.; formal analysis, D.M. and L.L.; investigation, D.M. and L.L.; writing—original draft preparation, D.C.; writing—review and editing, D.C., D.M. and L.L.; visualisation, D.C.; funding acquisition, D.C. All authors have read and agreed to the published version of the manuscript.
Funding
This research was carried out as part of a project entitled “Advanced Energy Storage Systems for Sustainable Communities”, funded by the University of Cagliari with financial support from Fondazione di Sardegna, Year 2019 (CUP F72F20000340007).
Data Availability Statement
Not applicable.
Conflicts of Interest
The authors declare no conflict of interest.
References
- Bird, L.; Lew, D.; Milligan, M.; Carlini, E.M.; Estanqueiro, A.; Flynn, D.; Gomez-Lazaro, E.; Holttinen, H.; Menemenlis, N.; Orths, A.; et al. Wind and solar energy curtailment: A review of international experience. Renew. Sustain. Energy Rev. 2016, 65, 577–586. [Google Scholar] [CrossRef]
- Liang, G.; Sun, B.; Zeng, Y.; Ge, L.; Li, Y.; Wang, Y. An optimal allocation method of distributed PV and energy storage considering moderate curtailment measure. Energies 2022, 15, 7690. [Google Scholar] [CrossRef]
- Kapila, S.; Oni, A.O.; Gemechu, E.D.; Kumar, A. Development of net energy ratios and life cycle greenhouse gas emissions of large-scale mechanical energy storage systems. Energy 2019, 170, 592–603. [Google Scholar] [CrossRef]
- Abdon, A.; Zhang, X.; Parra, D.; Patel, M.K.; Bauer, C.; Worlitschek, J. Techno-economic and environmental assessment of stationary electricity storage technologies for different time scales. Energy 2017, 139, 1173–1187. [Google Scholar] [CrossRef]
- Bouman, E.A.; Øberg, M.M.; Hertwich, E.G. Environmental impacts of balancing offshore wind power with compressed air energy storage (CAES). Energy 2016, 95, 91–98. [Google Scholar] [CrossRef]
- Stougie, L.; del Santo, G.; Innocenti, G.; Goosen, E.; Vermaas, D.; van der Kooi, H.; Lombardi, L. Multi-dimensional life cycle assessment of decentralised energy storage systems. Energy 2019, 182, 535–543. [Google Scholar] [CrossRef]
- AlShafi, M.; Bicer, Y. Life cycle assessment of compressed air, vanadium redox flow battery, and molten salt systems for renewable energy storage. Energy Rep. 2021, 7, 7090–7105. [Google Scholar] [CrossRef]
- Casey, M.; Robinson, C. A method to estimate the performance map of a centrifugal compressor stage. J. Turbomach. 2012, 135, 021034. [Google Scholar] [CrossRef]
- Vertex DE21. Available online: https://www.trinasolar.com/it/product/VERTEX-DE21 (accessed on 6 October 2022).
- Gestione Ambientale-Valutazione del Ciclo di Vita-Requisiti e Linee Guida-Uni 14044_2021. Available online: https://www.certifico.com/normazione/358-news-normazione/12888-uni-en-iso-14044-2021-valutazione-del-ciclo-di-vita-lca (accessed on 12 October 2022).
- Gestione Ambientale-Valutazione del Ciclo di Vita-Principi e Quadro di Riferimento-Uni 14040-2021. Available online: https://www.certifico.com/normazione/norme-armonizzate/274-consulting/index.php?option=com_content&view=article&id=4439&catid=257&Itemid=763 (accessed on 12 October 2022).
- SimaPro. Available online: https://simapro.com (accessed on 12 October 2022).
- Frischknecht, R.; Stolz, P.; Krebs, L.; de Wild-Scholten, M.; Sinha, P.; Fthenakis, V.; Kim, C.; Raugei, M.; Stucki, M. Life Cycle Inventories and Life Cycle Assessments of Photovoltaic Systems 2020; International Energy Agency: Paris, France, 2020.
- Fthenakis, V.; Kim, H.C.; Frischknecht, R.; Raugei, M.; Sinha, P.; Stucki, M. Life Cycle Inventories and Life Cycle Assessment of Photovoltaic Systems; International Energy Agency: Paris, France, 2011.
- Nandi, B.R.; Bandyopadhyay, S.; Banerjee, R. Analysis of High Temperature Thermal Energy Storage for Solar Power Plant. In Proceedings of the 2012 IEEE Third International Conference on Sustainable Energy Technologies (ICSET), Kathmandu, Nepal, 24–27 September 2012; pp. 438–444. [Google Scholar]
- Jiang, Z.; Li, P.; Tang, D.; Zhao, H.; Li, Y. Experimental and Numerical Investigations of Small-Scale Lined Rock Cavern at Shallow Depth for Compressed Air Energy Storage. Rock Mech. Rock Eng. 2020, 53, 2671–2683. [Google Scholar] [CrossRef]
- Wulf, C.; Reuß, M.; Grube, T.; Zapp, P.; Robinius, M.; Hake, J.F.; Stolten, D. Life cycle assessment of hydrogen transport and distribution options. J. Clean. Prod. 2018, 199, 431–443. [Google Scholar] [CrossRef]
- Chen, J.; Wang, Z.; Wu, Y.; Li, L.; Li, B.; Pan, D.; Zuo, T. Environmental benefits of secondary copper from primary copper based on life cycle assessment in China. Resour. Conserv. Recycl. 2019, 146, 35–44. [Google Scholar] [CrossRef]
- Jolliet, O.; Margni, M.; Charles, R.; Humbert, S.; Payet, J.; Rebitzer, G.; Rosenbaum, R. IMPACT 2002+: A new life cycle impact assessment methodology. Int. J. Life Cycle Assess. 2003, 8, 324–330. [Google Scholar] [CrossRef]
Figure 1.
Schematic diagram of the PV-ACAES system.
Figure 1.
Schematic diagram of the PV-ACAES system.
Figure 2.
(a) Load profiles during week and weekend days; (b) monthly energy demand.
Figure 2.
(a) Load profiles during week and weekend days; (b) monthly energy demand.
Figure 3.
(a) Power production profiles of a PV module during a summer day and a winter day; (b) monthly energy production of the PV module.
Figure 3.
(a) Power production profiles of a PV module during a summer day and a winter day; (b) monthly energy production of the PV module.
Figure 4.
Boundaries of the system.
Figure 4.
Boundaries of the system.
Figure 5.
Impact category indicators for PV power plants without energy storage. The bar graph shows the impact reduction in comparison with the reference scenario.
Figure 5.
Impact category indicators for PV power plants without energy storage. The bar graph shows the impact reduction in comparison with the reference scenario.
Figure 6.
Midpoint indicators for configuration C1 without energy storage.
Figure 6.
Midpoint indicators for configuration C1 without energy storage.
Figure 7.
Impact category indicators for the PV-ACAES plants with underground air storage. The bar graph shows the impact reduction in comparison with the reference scenario.
Figure 7.
Impact category indicators for the PV-ACAES plants with underground air storage. The bar graph shows the impact reduction in comparison with the reference scenario.
Figure 8.
Impact categories for the main components of the PV-ACAES plant with underground air storage, for configuration C3.
Figure 8.
Impact categories for the main components of the PV-ACAES plant with underground air storage, for configuration C3.
Figure 9.
Midpoint indicators for configuration C3 with underground air storage.
Figure 9.
Midpoint indicators for configuration C3 with underground air storage.
Figure 10.
Impact category indicators for the PV-ACAES plants with air storage in a gas pipeline. The bar graph shows the impact reduction in comparison to the reference scenario.
Figure 10.
Impact category indicators for the PV-ACAES plants with air storage in a gas pipeline. The bar graph shows the impact reduction in comparison to the reference scenario.
Figure 11.
Impact categories for the main components of the PV-ACAES plant with air storage in a gas pipeline, for configuration C3.
Figure 11.
Impact categories for the main components of the PV-ACAES plant with air storage in a gas pipeline, for configuration C3.
Figure 12.
Midpoint indicators for configuration C3 with air storage in a gas pipeline.
Figure 12.
Midpoint indicators for configuration C3 with air storage in a gas pipeline.
Table 1.
Main characteristics of the two TES systems.
Table 1.
Main characteristics of the two TES systems.
| | Volume
[m3] | Height
[m] | Diameter
[m] | Gravel Mass [kg] | Oil Mass
[kg] |
|---|
| TES 1 | 673.5 | 17.50 | 7.0 | | - |
| TES 2 | 1206.0 | 21.25 | 8.5 | | |
Table 2.
Main characteristics of the two compressed air storage reservoirs.
Table 2.
Main characteristics of the two compressed air storage reservoirs.
| | Volume
[m3] | Length
[m] | Diameter
[m] | Air Mass
[kg] |
|---|
| Mining tunnel | 19,103 | 973 | 5 | |
| Gas pipeline | 19,103 | 12,409 | 1.4 | |
Table 3.
PV plant characteristics and energy production in the five cases considered.
Table 3.
PV plant characteristics and energy production in the five cases considered.
| | C1 | C2 | C3 | C4 | C5 |
|---|
| Rated power (MW) | 20 | 25 | 30 | 35 | 40 |
| Number of modules | 30,744 | 38,444 | 46,900 | 53,816 | 61,488 |
| Energy production (MWh/year) | 31,931 | 39,961 | 48,740 | 55,903 | 63,907 |
| PV energy to the user (MWh/year) | 18,726 | 19,593 | 20,272 | 20,698 | 21,082 |
| Share of energy directly supplied by the PV plant (%) | 38.61 | 40.4 | 41.8 | 42.7 | 43.47 |
| PV energy to the grid (MWh/year) | 13,205 | 20,368 | 28,468 | 35,205 | 42,825 |
Table 4.
Main performance parameters of the integrated PV-ACAES configurations.
Table 4.
Main performance parameters of the integrated PV-ACAES configurations.
| | C1 | C2 | C3 | C4 | C5 |
|---|
| Compressor train power (MW) | 10.85 | 10.85 | 10.85 | 10.85 | 10.85 |
| Turbine train power (MW) | 3.13 | 3.13 | 3.13 | 3.13 | 3.13 |
| End user energy demand (MWh/year) | 48,500 | 48,500 | 48,500 | 48,500 | 48,500 |
| PV direct energy supply to the end user (MWh/year) | 18,726 | 19,593 | 20,272 | 20,698 | 21,082 |
| PV plant overproduction (MWh/year) | 13,204 | 20,367 | 28,458 | 35,202 | 42,818 |
| Compression energy (MWh/year) | 1375.5 | 9512 | 14,721 | 16,518 | 17,651 |
| ACAES electrical energy production (MWh/year) | 1002.7 | 6883 | 10,491 | 11,683 | 12,426 |
| ACAES energy supplied to the end user (MWh/year) | 860.94 | 6239 | 9515 | 10,626 | 11,333 |
| ACAES energy flow to the grid (MWh/year) | 141.15 | 649 | 975 | 1056 | 1092 |
| ACAES round trip efficiency (%) | 72.9 | 72.4 | 71.3 | 70.7 | 70.4 |
| Energy directly supplied by the PV plant (%) | 38.61 | 40.4 | 41.8 | 42.7 | 43.47 |
| Energy supplied by the ACAES section (%) | 1.78 | 12.9 | 19.6 | 21.9 | 23.37 |
| Energy supplied by the PV-ACAES plant (%) | 40.39 | 53.3 | 61.4 | 64.4 | 66.74 |
Table 5.
Results for the best configurations.
Table 5.
Results for the best configurations.
| Damage Category | Unit | C1 w/o ACAES | C3 w/Underground Storage | C3 w/Pipeline Storage |
|---|
| Human health | DALY/kWh | | | |
| % Reduction | 89.22 | 81.10 | 67.68 |
| Ecosystem quality | PDF *m2 *year/kWh | | | |
| % Reduction | 84.46 | 80.21 | 68.75 |
| Climate change | kg CO2 eq/kWh | | | |
| % Reduction | 95.01 | 91.37 | 89.14 |
| Resources | MJ primary/kWh | | | |
| % Reduction | 95.18 | 91.48 | 90.37 |
| Disclaimer/Publisher’s Note: The statements, opinions and data contained in all publications are solely those of the individual author(s) and contributor(s) and not of MDPI and/or the editor(s). MDPI and/or the editor(s) disclaim responsibility for any injury to people or property resulting from any ideas, methods, instructions or products referred to in the content. |
© 2023 by the authors. Licensee MDPI, Basel, Switzerland. This article is an open access article distributed under the terms and conditions of the Creative Commons Attribution (CC BY) license (https://creativecommons.org/licenses/by/4.0/).


