Abstract
This paper presents the results of material tests, experimental tests and statistical analysis of the thermal performance of three types of heat accumulators containing an organic phase-change material and two materials of a higher thermal conductivity: a copper mesh and porous coke recyclate. The aim of the research was to empirically and statistically compare the increase in the PCM heat distribution through a copper conductor and coke recyclate. The research was conducted in accordance with an incomplete central compositional experimental design and using the Statistica software. The studies of the structure and chemical composition of the coke recyclate used and the empirical testing of the finished heat accumulators confirmed an improvement in the distribution and storage of heat by the accumulator with the phase-change material and coke recyclate compared to the pure phase-change material and copper-conductor accumulators, as the holding time of a temperature of 20 °C was extended by seven minutes and nine minutes, respectively. Moreover, the results of the statistical analysis provided answers as to which of the assumed input quantities—initial temperature, battery geometry, and heating temperature—were statistically significant for each of the three battery types considered. The determined approximating functions were verified in terms of the statistical validity of their use for all three types of heat accumulators tested. The results obtained are important answers to the current problems in the design and modification of phase-change heat accumulators applied in the construction industry to reduce the emissivity of structures and increase their energy efficiency.
1. Introduction
The increasing costs of the thermal performance of buildings, together with the implementation of the Fit for 55 packages [1] designed to reduce CO2 emission levels in EU Member States by at least 55% before the year 2030 and achieve climate neutrality by 2050, necessitate the implementation of new, innovative solutions for the efficient usage and storage of energy generated from renewable sources.
The solution to these challenges are heat accumulators containing phase-change materials that allow for the short- and long-term isothermal storage of thermal energy. The effects of phase-change materials (PCMs) on improving the thermal performance of components and increasing the perceived thermal comfort in indoor spaces are the subject of numerous scientific papers [2,3,4,5,6,7]. The results of previous scientific work on the applications of phase-change materials in construction confirm their capacity for the isothermal storage of heat and present such applications as reasonable.
However, the success of the energy retrofitting of buildings with phase-change heat accumulators depends on the form of the accumulator material (packs, pellets, micro-granules, or bulk/loose material) and the physical and chemical parameters (melting/freezing point, phase change enthalpy), the location and the thermal conditions prevailing on the site (the daily variations of indoor air temperature) of their application (access to indirect or direct solar radiation energy).
The analysis of the functioning of the thermal and energy PV-Trombe wall system was presented in [8], where the validity of PCM application in warm climates closer to the collector was proved, and in colder climates, closer to the inner part of the wall. In addition, the possibilities of using PCM to improve the functioning of the thermal chimney have been demonstrated in [9]. In addition, a very considerable barrier to the scope of applications of phase-change materials for the storage of heat in their structure is their low thermal conductivity in the solid state (within 0.1 to 0.3 W/m K). This results in a significant reduction in the heat distribution through conduction within the PCM itself, both during melting (extending the charging time of the heat accumulator) and the solidification of the PCM (release of the accumulated heat). Therefore, the actual heat storage efficiency is much lower than the theoretical one derived from the product of the PCM’s mass and its phase transformation enthalpy.
The problem of increasing the thermal conductivity in solid PCMs is the subject of many scientific papers and the key to significantly increasing the efficiency of heat storage and distribution.
An intuitive and common way to increase the thermal conductivity of PCM-containing composites is to use metallic materials and alloys in various forms, as described in [10]. An example of this is the paper [11], the authors of which used microcapsules and steel fibers, or dispersed metal nanoparticles, similarly to in [12]. On the other hand, it is worth emphasizing that, taking into consideration the environmental aspects, mass and other possible applications of industrial metals, it is reasonable to look for other ways to increase the thermal conductivity of PCMs.
One method to increase the intensity of heat transfer through a PCM is to use metal components in various forms in the PCM structure, such as a foamed metal alloy, as in [13,14]. The research verified the effect of foamed copper content at 0.43–2.15% on the melting time of PCM. The presented results confirmed that the most thermally efficient composite was the one with a copper content of 0.86%. On the one hand, it enabled the intensification of heat transfer by conduction and, on the other hand, did not have a negative effect consisting in a reduction in the heat transfer of liquid PCM by free convection of heat.
Another interesting way of increasing the intensity of heat transfer is to use the phenomenon of hypergravity. The state of hypergravity refers to a situation where the force of gravity is greater than on the surface of the earth. This state is often achieved by maintaining a sufficiently high angular velocity. In the paper [15], it was shown that with an increase in gravity, from 1g to 9g, the total melting time of the PCM investigated was reduced by 60.24%.
In addition to the mere fact of applying a substance with a good heat conductivity, its orientation is equally important. The paper [16] shows the results of research into the variation of the time required forthe RT27 PCM to melt, depending on the angle of the orientation of the PCM container and the high thermal conductivity rods within it, relative to the vertical. The results proved an increase in the free convection velocity of liquid PCM from 0.0072 m/s to 0.0184 m/s with an increasing radial height, resulting in a reduction in the PCM specimen’s melting time, from 17 min to 6 min.
Another way to improve the heat distribution within a PCM, cited in the works [17,18,19,20,21], is its application within a double pipe system for convective heat transfer. An innovation disclosed in the paper [17] is the use of a nano-liquid (1% aqueous Al2O3 solution) as a heat transfer medium. With this modification and the application of a heating power of 200 W, a Reynolds number of 1700 and a concurrent flow coefficient of 2.38, the heat transfer was improved by 32% in comparison to pure water.
The paper [22] presents a new metallic/wood-based phase-change material, where PCM-coated microcapsules and copper-coated microcapsules were used to increase the heat capacity of porous wood components. The presented test results proved an increase in the thermal conductivity of the composite by 362% compared to pure wood, and the composite achieved a latent heat level of 92 J/g.
When assessing the cost-effectiveness of the use of PCMs and their composites for the energy retrofitting of buildings, an important aspect is the impact of the materials on the thermal comfort parameters of the occupants and the sustainability and energy-efficiency analysis of such buildings. This aspect is discussed in the works [21,22,23,24,25,26], hinting at the need to include a multi-faceted assessment of the feasibility of building energy retrofit projects. It is therefore reasonable to use materials derived from carbon—being a light and non-chemically inert material—as a replacement for metals to improve the thermal conductivity of PCMs.
In [27], the researchers presented an analysis of the energy performance savings and CO2 emission levels of a two-story residential building operated in a hot, dry climate, where five different configurations of organic and inorganic PCMs were used. The PCM was used in the building as a component of clay bricks, as a direct measure to improve the heat storage capacity.
The researchers in [23] presented the results of their work on a composite of PCM and carbon foam derived from a thermal insulation foam of polyisocyanurate (PIR). The heat storage capacity of the composite was 105.2 J/g.
A method for increasing the efficiency of heat sinks containing a PCM is discussed in [24]. The heat sinks tested featured multi-walled carbon nanotubes and polyethyleneimine for improved heat distribution management. The results revealed a 10% improvement in the heat distribution of the composite compared to the pure PCM.
In [25], the authors presented the results from a study on the improvement of the thermal conductivity in selected PCMs through the application of carbon nanotubes. The fabricated composite with 1% PCM by weight provided a 50% improvement in conductivity compared to the pure PCM.
A similar application of carbon nanotubes to improve heat distribution within a PCM was shown in the papers [26,27,28,29,30,31,32]. Another similar application of a different carbon allotrope, graphite, to improve the heat distribution in a PCM is discussed in [4]. Among other forms of carbon materials used to improve the thermophysical performance of PCMs or components interfaced with PCMs include an artificial carbon-laden aggregate [2]. Another important application example of carbon-based materials with PCMs is a composite of ionic liquids, carbon fibers and stearic acid coated with polydimethylsiloxane (PDMS) films, as is described in [3]. In addition to thermal stability, of up to a limit of 200 °C, the composite featured high axial compressive strength, with a yield strength of 19 MPa.
An important summary of the research into the applications of various high thermal conductivity materials derived from carbon, such as graphene, carbon nanotubes, graphene nano wafers integrated with a durable composite containing a PCM in the form of hydrophobic expanded perlite, is presented in [5]. The authors demonstrated a significant improvement in the thermal conductivity of individual composites doped with carbon at 45%, 30%, and 49%, while suggesting the need to provide small particles of carbon material that are small enough to improve the heat transfer of the PCM contained in the perlite pores.
An interesting method for the improvement of PCM thermal conductivity is the use of quantum dots containing high concentrations of graphene and derived from acetone and divinylbenzene, as presented in [6]. In the paper, the PCM applied was propylene glycol PEG (Polyethylene Glycol) in the form of a polymer. The results of the thermal conductivity improvement revealed 236% over pure PEG.
In addition to the aspects of PCM’s physical and chemical properties, the shape and geometry of PCMs are no less important for the thermal function of the entire heat-accumulating composite. This problem is discussed in paper [33], which presents the results of a numerical analysis on the shape and geometry of heat accumulators containing PCMs to improve their heat distribution. Not the least of the topics pertaining to the application of free PMCs in interaction with other PCMs is the selection of the application form by which the PCM is held at the application site, even when molten. In [34], the researchers presented the feasibility of using gypsum in several configurations to obtain a thermally stable composite combined with a PCM. The results shown in the paper prove that the application of the researched composite in construction engineering is reasonable.
When assessing the cost-effectiveness of the use of PCMs and their composites for the energy retrofitting of buildings, an important aspect is the impact of the materials on the thermal comfort parameters of the occupants and the sustainability and energy-efficiency analysis of such buildings. This aspect is discussed in the works [35,36,37,38,39], hinting at the need to include a multi-faceted assessment of the feasibility of building energy retrofit projects. It is therefore reasonable to use materials derived from carbon—being a light and non-chemically inert material—as a replacement for metals to improve the thermal conductivity of PCMs. In [40], the researchers presented an analysis of the energy performance savings and CO2 emission levels of a two-story residential building operated in a hot, dry climate, where five different configurations of organic and inorganic PCMs were used. The PCM was used in the building as a component of clay bricks as a direct measure to improve the heat storage capacity.
To conclude this review of the knowledge of the generation, functioning, and application of heat-accumulating PCMs, it is reasonable to conduct empirical research and statistical analysis on three types of heat accumulators, one holding a free PCM, one featuring a composite of the PCM with a metal framework, and one featuring a composite of the PCM with a coke recyclate framework. The studies carried out and described thusfar on improving the heat exchange efficiency of phase-change heat accumulators mainly concern conventional applications, materials available for purchase and often constitute a case study. In this work, the empirical and statistical validity of using coke recyclate to improve the heat distribution within the heat accumulator with PCM was checked empirically and statistically. An additional aim of the research was a comparative analysis of three types of heat accumulators with PCM. An important part of the research was the use of one experimental design for all three types of heat accumulators, which proved the statistical significance of individual input variables on the value of the output variable. A novelty in the context of the research carried out so far is the verification of the possibility of using the obtained functions in three types of heat accumulators: with pure organic PCM based on paraffin; PCM with recyclate consisting mainly of carbon; and PCM with intensively heat-conducting copper. Multi-faceted research and analysis that considers the geometry of the heat accumulators, the ways to improve thermal conductivity, and the varying conditions and intensities of the accumulator’s heating and cooling, will help justify the application of PCMs with recycled coke and metal matrices, along with providing predictive analysis of the effects of individual input variables on the heat distribution efficiency of the heat accumulators.
On the basis of the conducted review on the state of the art and our own prior research, the input and output values, which are significant for the efficiency of heat exchange, were determined. Then, the incomplete, compositional plan of the experiment determines the necessary empirical experiments. The recorded results made it possible to obtain cognitive information on the functioning of the new types of phase-change heat accumulators and to obtain an approximating function in the form of response planes.
2. Materials and Method

Table 1.
Materials.

Table 2.
Apparatures.
2.1. SEM Methodology
The surface morphology and the imaging of the waste structure were processed using a Tescan MIRA3 SEM. The test preparation involved sputtering a layer of gold, approximately 30 to 45 nm thick, onto the specimens. This process was carried out in a vacuum sputtering machine. The imaging of the specimens was conducted at four magnifications powers of 2k, 5k, 20k and 50k times. The electron accelerating voltage selected was in the range of 10 kV and 20 kV.
2.2. Experimental Design; Preparation of Test Specimens
The subject of this research was a multi-faceted analysis of the thermal performance of three types of heat accumulators containing the RT21 PCM. Each of the heat accumulators contained, respectively:
- A composite of polymer matrix and pure RT21 PCM
- A composite of polymer matrix, coke recyclate, and the RT21 PCM
- A composite of polymer matrix, copper, RT21 PCM, and a copper conductor
One aspect of the analysis was to compare the results of the polynomial approximations of each of the composites tested according to an identical incomplete experimental design. Such an assumption facilitated an important and interesting substantive analysis of the impact of the individual input quantities of the experimental design, such as the geometric factor of the heat accumulator, the heat accumulator’s initial temperature and the heat accumulator’s heating temperature in the three application configurations of the same PCM material. This allowed to indicate the level of relevance and the range of applicability of the composites and pure RT21 PCM under consideration, with an identification of the strengths and weaknesses of using the same PCM in different configurations. This paper is a continuation of the research work on the new isothermal heat accumulators containing PCM and recycled carbon materials, presented by the authors in [41]. Paper [41] is a case study of the research on increasing the heat distribution within the packages with organic PCM using carbon recyclateand the obtained results proved the legitimacy of using the tested recyclate. The present work focuses on the comparative analysis of three heat accumulator plates with PCM, with a new coke recyclate, a composite with a copper conductor and pure PCM. The selected two PCM composites correspond to the literature review, where one can notice the frequent use of two groups of materials to improve the dynamics of the PCM phase change: conductive metal, e.g., copper or aluminum, and carbon materials, e.g., graphene, graphite, nanotubes.
The empirical research was planned and completed according to an incomplete compositional orthogonal experiment design, assuming threeinput quantities and one output quantity. The use of an incomplete experiment design reduced the number of experiments required, from 125 to 17, which significantly shortened the experimental testing duration. The experimental design and its subsequent statistical analysis were performed using Statistica, version15.
The results presented in papers [4,7,23,24,25,26,41,42,43,44] allowed for the selection of three input quantities, which contributed to the heat distribution efficiency in the PCMs and composites: the geometric factor (-); the PCM specimen’s initial temperature (°C); and the PCM specimen’s heating temperature (°C). In turn, ’Heat distribution efficiency’ was assumed as the output quantity for the experimental design. The geometric coefficient of these tests was defined as the ratio of the lateral area of the sample to its volume. The choice of the input quantities is the result of preliminary research and a review of the state of the art. The geometry of the PCM heat accumulator and the temperature range prevailing in the place of its application will affect the effectiveness of its phase change. A graphical diagram of the experimental design is shown in Figure 1.
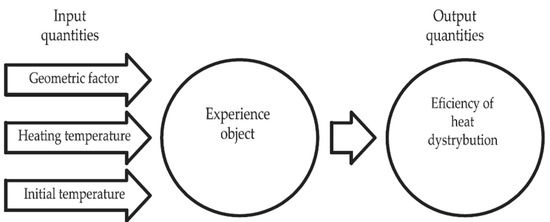
Figure 1.
Graphical diagram of the experimental design.
Each of these quantities was independent of each other, and measurable and determinable in a reproducible manner, which met the criteria of feasibility, informativeness and efficiency, according to the work [45]. Table 3 is a summary of the variation intervals of the input quantities considered in this work.

Table 3.
Input quantities of the experimental design and their variation intervals.
The solution to the correlation between the input variables and the output variable determined from the empirical experimental results logged during the 17 tests required by the incomplete compositional experimental design was a response function. Repetition of one of the experiments is a requirement of the incomplete experimental design to determine the error rate and coefficient of determination and is imposed by the Statistica program. The authors of the manuscript, wanting to increase the credibility of the conducted experiments, decided to repeat the selected experiment and include its result in the overall analysis. The response function was in the form of an approximating polynomial and was determined by determining the values of the variable factors. The relevant calculations were run in Statistica 15, according to Equation (1).
The initial step in the execution of the experimental design was to make all of the input quantities independent of their physical interpretations. This was achieved by a process of normalizing all of the input values to an interval <−α, α>. The value of α, representing the length of the stellar arm for the incomplete central compositional 3/1/16 design, was α = 1.215, according to [45]. The stellar arm length was determined with Equation (2).
The input quantities were normalized with Equation (3).
where: —normal variable; xk—real variable; —minimum value of the variable; —maximum value of the variable; —the length of the interstellar ray.
The step following the completion of the required experimental tests was a reverse action, the aim of which was to return to the actual physical values of the input variables. This step was conducted with Equation (4).
where: —denormalized variable; —minimum value of the variable; —normal variable; —maximum value of the variable; —the length of the interstellar ray.
The layout of the experimental design was a set of tested input variables, for which the output y values were calculated according to Equation (5).
The next step of the analysis was to verify the adequacy of the generated model. This was conducted for substantive verification: the assumption of the correct form of the approximating equation; the possible omission of a quantity relevant to the object function; and the correctness of the adopted range of input variables. The summary of the experiments required by the incomplete experimental design is shown in Table 4, and are similar to those in [41]. In turn, a correlation analysis of the reciprocal effects of the input variables against each other was performed for nine cases.

Table 4.
List of the required experiments per the experimental design shown in [41] from Statistica software.
2.2.1. Test Step
The required experiments were performed using the Espec climate chamber with controlled temperature and humidity. The research was carried out according to the requirements of the input parameters of the experimental design. The experiments defined in the preset experimental design were performed in parallel for the three types of heat accumulators considered, which varied in geometry: the specimens of pure PCM; the specimens of PCM with coke recyclate; and the specimens with PCM and a copper conductor. All of the experiments performed were preceded by a process to stabilize the temperature of the test specimens and the air temperature and humidity inside the climate test chamber. This was followed by heating the test specimens for 1.5 h, with subsequent cooling for 12 h at the temperatures predefined in the experimental design. The temperature and heat flux density were logged throughout the experiments. A diagram of the layout of the test specimens and photographs of the test setup used are shown in Figure 2.
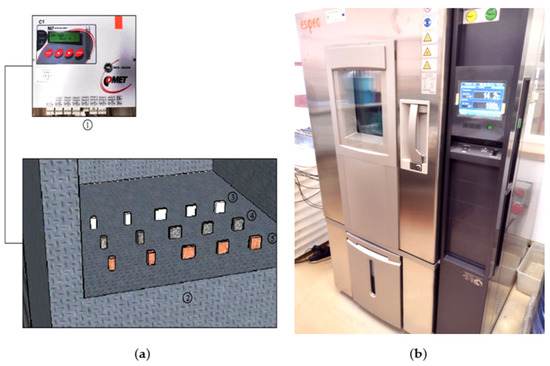
Figure 2.
(a) Layout of the test specimens and data logger during testing; 1—data logger; 2—test chamber interior; 3—specimens of pure PCM; 4—specimens of PCM with coke recyclate; 5—specimens with PCM and a copper/polymer matrix; (b) Espec climate test chamber.
2.2.2. Preparation of Test Specimens
Each of the three types of heat accumulators tested was made with dimensions that conformed to the geometric factors assumed. To ensure that the heat accumulators remain airtight, even after the PCM has melted, they were sealed with a polymer coating of chain acrylates and vinyl acetate. The coating was made of a 40% aqueous polymer dispersion, under the trade name Osakryl OB, and manufactured by Synthos. The choice of this dispersion to constructa sealed polymer matrix was driven by the lower glass transition temperature of the PCM used, which was around 11 °C.
The PCM was applied to the reference specimens in its liquid state after the polymer matrix was produced. In contrast, the preparation of the test specimens with copper began with the fabrication of a copper mesh framework with a mesh diameter of 2 mm, coating it with a polymer film, followed by the application of liquid PCM. The last group of composites contained the coke recyclate and was cut from a recycled lump to produce the test specimens. An important property of the recyclate was its porosity; itdetermined the potential amount of PCM in the composite. The porosity value of the obtained recyclate was determined by comparing the density before and after grinding several randomly selected samples. The pore size was determined organoleptically and by SEM. The tests confirmed the porosity of the recyclate to be in the range of 66–70%. A photograph of the dissected lump of coke recyclate is shown in Figure 3.
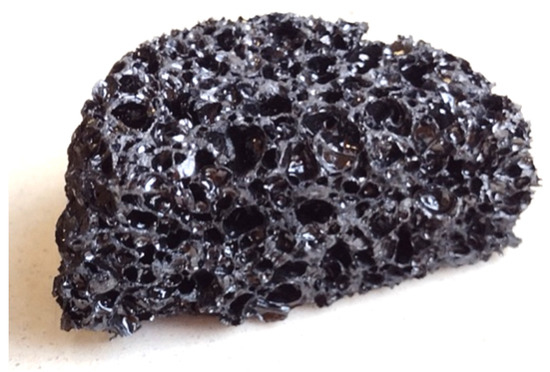
Figure 3.
Coke recyclate used for the test specimens.
After the required shapes of the coke recyclate were cut out, the cuts were exposed to injection soaking with the liquid PCM at 60 °C for 12 h. After soaking with the PCM, following by cooling to 17–18 °C, the test specimens were coated with a polymer film, identically to the previous two specimen types. The finished test specimens were heated several times to test them for leaks before the actual experimental testing began. Figure 4 shows the photographs of the test specimens during their fabrication and in the finished state.
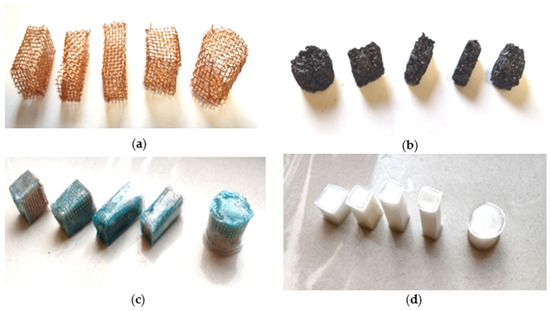
Figure 4.
(a) Copper frameworks of the test specimens; (b) Cut shapes of the coke recyclate; (c) Finished test specimens with copper, PCM and the polymer matrix; (d) Finished test specimens with PCM and the polymer matrix.
The output variable, which expressed the efficiency of the heat storage and distribution within the phase-variable heat accumulators investigated, was the ’heat distribution efficiency’ used in scientific papers [7,41,42,44]. The heat distribution efficiency was a comparison between the actual quantity of heat required to fully charge a heat accumulator (by melting all of the PCM contained in the composite) to the quantity of heat estimated by calculation. The heat distribution efficiency, according to [7,41,42,44], was determined using Equation (6).
with: D—heat distribution efficiency; QA.E—empirically tested absorbed heat quantity; QA.T—theoretical absorbed heat quantity.
This quantity was important to the thermal performance of the composites containing organic PCMs, which allowed for the assessment of the extent of incomplete PCM melting in the heat accumulators. Incomplete PCM melting is one of the primary limitations to the large-scale use of phase-change heat accumulators and the values of 0.1–0.3 W/m K for the thermal conductivity factors of organic PCMs. A graphical representation of incomplete PCM melting is shown in Figure 5.
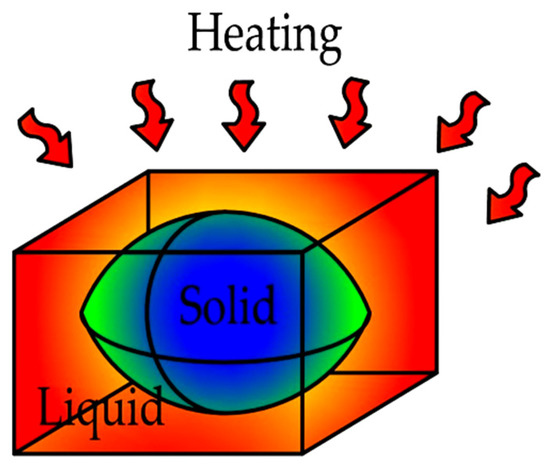
Figure 5.
Graphical diagram of heating homogeneous heat accumulators containing organic PCMs.
The actual and predicted quantities of absorbed heat for the test specimens themselves were determined using the splines described in papers [41,42]. They allowed the PCM to be considered separately before, during, and after the phase transition temperature crossing. The theoretical values and empirically tested absorbed heat quantities were determined with Equations (7) and (8).
with: Tl—phase transition temperature; Tp—test specimen temperature; AO—PCM test specimen external surface area; qr—heat flux density penetrating the PCM test specimen; mL—mass of the molten PCM; ΔHE.r—melting/solidification heat of the PCM.
with: Tl—phase transition temperature; Tp—test specimen temperature; ms—mass of the solid PCM; Cw.S—specific heat of the solid PCM; Cw.L—specific heat of the liquid PCM; ΔTT—theoretical temperature rise of the PCM test specimens; mL—mass of the molten PCM; ΔHT—melting/solidification heat of the PCM.
The absorbed heat values based on the empirical results and the splines, described with Equations (7) and (8), and predicted within the phase change range, were calculated using the least trapezoid method.
2.3. Properties of the Recyclate Used
The recyclate used in this work was solid, grey-black in color and with a porous texture, as shown in Figure 3. It was a product from the processing of cokes. The nature of the material used depended on the quality parameters of the coke. The main parameters included moisture content, volatile content, sulphur, M10, M40, CSR (Coke Strength after Reaction), and CRI (Coke Reactivity Index). The chlorine and phosphorus levels were also determined. The average values of the physical and chemical specifications of cokes are listed in Table 5.

Table 5.
Average values of the physical and chemical specifications of cokes [46,47,50].
Humidity was a parameter that influenced the productivity process of a blast furnace. It was assumed that the humidity should be in the range of 3% and 4%. It is very low level in coke increases the dusting during certain processing operations, such as coke sorting, handing and unloading, forcing expensive dust removal [46,47,48]. An undesirable component of coke is ash, as it increases the quantity of slag produced. It also reduces the calorific value of coke and increases its reactivity. The European market requires the ash content of coke to be within 9–11% [46,47,48,49]. Sulphur is a harmful ingredient of coke, which reduces the quality and has an environmental impact. It also causes processing plant equipment to corrode more quickly and contaminates catalytic converters. The total sulphur content of cokes made from Polish coals is typically 0.7–1.1%. In addition, coke contains 0.9–1.1% of volatiles and up to 0.06% of phosphorus [47]. The CRI of coke, an indicator of the reactivity of the coke relative to carbon dioxide (CO2), is important because of the corresponding gas permeability of the material. The CRI should not be higher than 31% (for the European market) or 28% (the U.S. market). The CSR should be above 60%. The M10 abrasion index should be within 5–7% and the M40 strength index should be between 65% and 87%, according to the European customers’ standards [47,48]. Structural and textural analyzes and chemical composition are important in terms of basic research. They confirm its carbonate character and are important from the point of view of the content of elements that may be harmful to the environment.
3. Results
3.1. Analysis of the Coke Recyclate Composition
The research completely [41] demonstrated that the material applied in the work was a highly carbonated recyclate stock. In addition to a high carbon content of 99.2% (w/w), the chemical composition revealed 0.7% (w/w) of sulphur and 0.1% (w/w) of copper. The results were compared to the tests conducted on coke products in Polish coking plants. The carbon and sulphur content determined was shown to be higher than in the research conducted [50]. The carbon content ranged between 86.85% and 91.4% (w/w), while the sulphur content was between 0.36% and 0.66% (w/w).
The levels of trace elements found in the coal coking products were analyzed on selected materials from Polish coking plants [51,52,53]. The elements (determined in g/t of coke) were found at these levels: 0.01 for Hg, As, and Cd; 0.1 for Ni and Cu; 0.25 for Pb; and up to 0.4 for Zn [51,52]. The emission factors for the elements determined in g/t of coke were: 0.01 to 0.03 for Hg; 0.08 to 0.2 for As; 0.02 to 0.04 for Cd; 0.2 to 0.3 for Ni; and 0.6 to 1.7 for Pb [51,54,55]. The range of analysis was expanded further with the results for the selected trace elements, as shown in Table 6. The lowest values, ranging between several and over 100 ppb, were determined for Cd and Hg. The highest values, above 100 ppm and 200 ppm, were for the Mn and Sr levels, respectively. Ni, V and Zn were present in concentrations of the order of tens of ppm. Be, Se and Tl were present at concentrations ranging between a fraction of a ppm and more than 1 ppm, while Co was determined at a few ppm [51]. The chemical composition of the coke depended on the nature of the coal from which it was made.

Table 6.
Levels of selected trace elements in coke [51].
The manufacturing process of coke affects its structural and textural character. Using SEM techniques, the surface topography of the investigated material was obtained, the nature of the microstructural surface was identified, and the three-dimensional distribution of the individual components was observed. The microstructural surfaces of the coke recyclate was analyzed in three areas (Figure 6). Images of the resulting microphotographs, recorded at magnification of 100, 50, 10 and 5 µm (Figure 7), revealed a massive microstructured nature of the surface. The topography of the recyclate surface showed a burr-like, uneven character of the fracture, locally corresponding to conchoidal fracture (Figure 7c,d). Previous observations of the test material revealed a local presence of oval-shaped porous voids, up to 100 µm in diameter, which were empty.
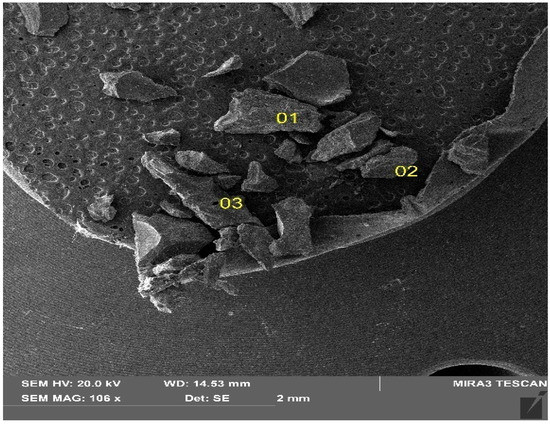
Figure 6.
Fragments of the coal recyclate under analysis SEM image.
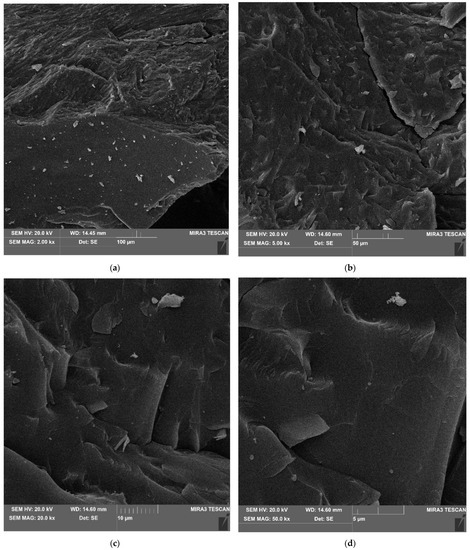
Figure 7.
Massive nature of the microstructural surface. SEM imaging at magnification of (a) 100 µm; (b) 50 µm; (c) 10 µm; (d) 5 µm.
3.2. Empirical Test Results
The logged temperature values of the three heat accumulators exposed to the test conditions in parallel provided qualitative information on their heating and cooling intensities during the tests. An example of a chart for the temperature distributions from the test specimens in one of the experiments is shown in Figure 8.
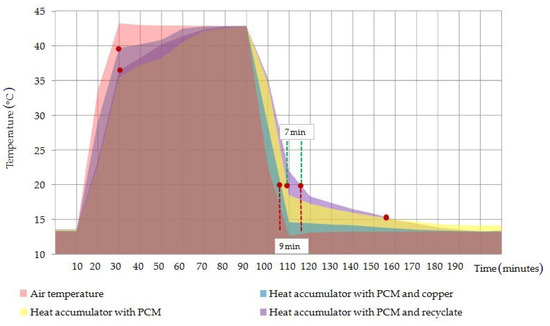
Figure 8.
Temperature distribution chart of the heat accumulator test specimens operating in parallel in the climate test chamber.
The temperature distribution of the test specimens of the phase-change heat accumulators, as shown in Figure 8, presented a similar temperature distribution for the pure PCM heat accumulator and the PCM/coke recyclate heat accumulator. In contrast, the temperature distribution of the copper conductor heat accumulator was closer to the air temperature values logged inside the climate test chamber during the test runs.
The results demonstrated a more efficient distribution of absorbed heat by the PCM/coke recyclate composite than the PCM/copper conductor composite, where the heating and cooling of the outer surface of the heat battery was found to occur with a delay, with the peak PCM temperatures of the heating step reaching 36 °C and 44 °C, respectively. A similar trend of improving the PCM heat transfer in the considered and higher temperature ranges was observed in [40], where attention was also paid to the thermal reliability of the phase transition and chemical inertness to many PCM groups, even at temperatures of the order of 800 K. The results obtained in the work also confirm the results of works [24,25], where PCM composites modified with polymer conductors and nanotubes were characterized by an increase in the heat exchange intensity, by 10% and 50%, respectively. The qualitative results of the temperature distribution imaged with the FLIR camera, and shown in Figure 9, confirmed the phenomena.

Figure 9.
(a) Photographs of the test specimens of the three types of heat accumulators; (b) FLIR image with the heating of the three types of heat accumulators tested; (c) FLIR image with the cooling of the three types of heat accumulators tested.
The FLIR camera images shown in Figure 9 confirmed the faster heating and cooling of the PCM/copper conductor heat accumulator (the test specimen in the middle), compared to both the pure PCM heat accumulator and the PCM/coke recyclate heat accumulator. This could partially be due to a very non-uniform distribution of absorbed heat in the test specimen of the PCM/copper conductor heat accumulator. This could result in the overheating of the liquid PCM, well above its melting point, at the outer edges of the heat accumulator, while the heat distribution towards the center of the heat accumulator, still holding the unmolten PCM, would be too slow. Furthermore, during the production of the polymer coating for the PCM/copper conductor heat accumulator, copper passivation was evident when the glass transition of the aqueous polymer dispersion took more than three hours.
3.3. Results of the Statistical Analysis
The empirical test results obtained allowed us to generate a database of results required for the statistical analysis. The heat distribution factor value for the experiments required by the experimental design was calculated according to the work [41] and Equations (6)–(8) (see above). A summary of the heat distribution factor values determined for all three heat accumulators tested is shown in Table 7.

Table 7.
Summary of input and output quantities for three different types of phase-change heat accumulators, according to the experimental design.
The foregoing values of the heat distribution factors were assigned to successive experimental designs for the three heat accumulator types in order to determine the impact of the individual input quantities on the output quantity value in the form of the response planes of the assumed approximation function.
3.3.1. Pure PCM Heat Accumulator
The results of the statistical analysis for the reference heat accumulators with pure PCM proved, as shown in Figure 10a, that only three input quantities were statistically significant. Once the statistically insignificant input variables were included and correlated, as shown in the Pareto chart in Figure 10b, the ultimately significant input quantities were the heating temperature, the geometrical factor, and the geometrical factor correlation. For the separate, statistically significant input components, the results of the analysis are shown in Figure 11, with the response planes in Figure 12.
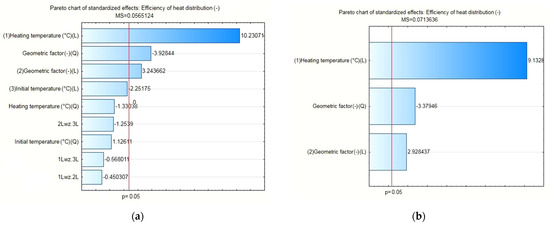
Figure 10.
(a) Pareto chart for all input quantities of interest and their correlation to the output quantity value; (b) Pareto chart for the statistically significant input quantities, applicable to the pure PCM heat accumulator.

Figure 11.
Results of the analysis of the effect of statistically significant input quantities on the response function value, applicable to the pure PCM heat accumulator.
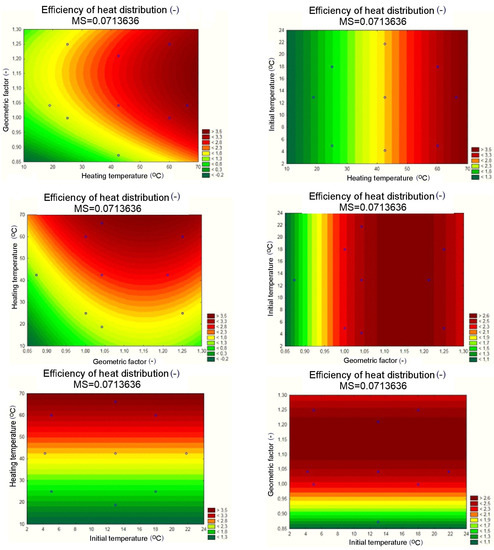
Figure 12.
Response planes of the assumed polynomial approximation, presenting the impact of input quantities on the output quantity, applicable to the pure PCM heat accumulator.
3.3.2. PCM/coke Recyclate Heat Accumulator
The results of the statistical analysis for the PCM/coke recyclate heat accumulators proved, as shown in Figure 13a, that the statistically significant input quantities were the heating temperature, the geometrical factor, the geometrical factor correlation, and the initial temperature of the test specimens. Then, as with the other heat accumulators, statistically insignificant input variables and their correlations were included in the error component. For the separated, statistically significant input components, the results are presented as follows: the Pareto chart in Figure 13b; the analysis in Figure 14; and the response plane in Figure 15.
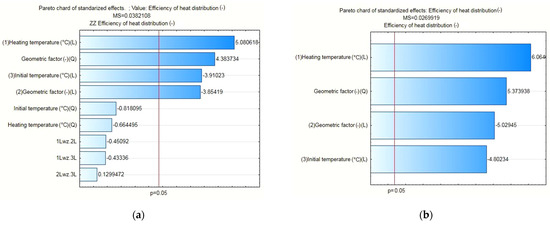
Figure 13.
(a) Pareto chart for all input quantities of interest and their correlation to the output quantity value; (b) Pareto chart for the statistically significant input quantities, applicable to the PCM/coke recyclate heat accumulator.

Figure 14.
Results of the analysis of the effect of statistically significant input quantities on the response function value, applicable to the PCM/coke recyclate heat accumulator.
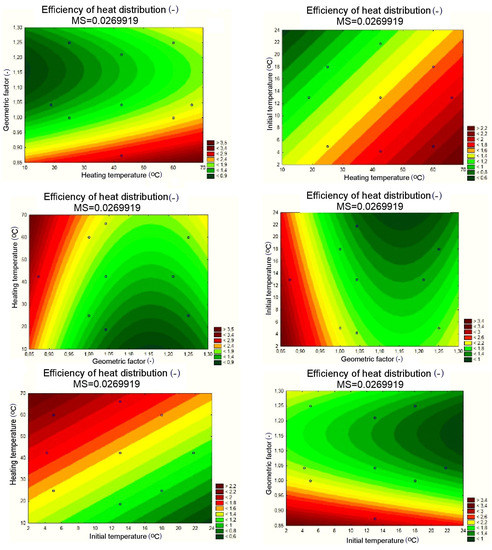
Figure 15.
Response planes of the assumed polynomial approximation, presenting the impact of input quantities on the output quantity, applicable to the PCM/coke recyclate heat accumulator.
3.3.3. PCM/Copper Conductor Heat Accumulator
The results of the statistical analysis for the PCM/copper conductor heat accumulators proved, as shown in Figure 16a, that the statistically significant input quantities were the heating temperature, the heating temperature correlation, and the initial temperature of the test specimens. In the next step, the statistically insignificant input variables and their correlations were included in the error component. For the separated, statistically significant input components, the results are presented as follows: the Pareto chart in Figure 16b; the analysis in Figure 17; and the response plane in Figure 18.
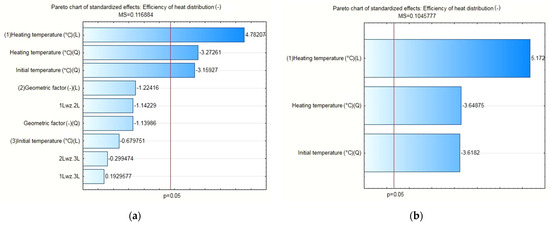
Figure 16.
(a) Pareto chart for all input quantities of interest and their correlation to the output quantity value; (b) Pareto chart for the statistically significant input quantities, applicable to the PCM/copper conductor heat accumulator.
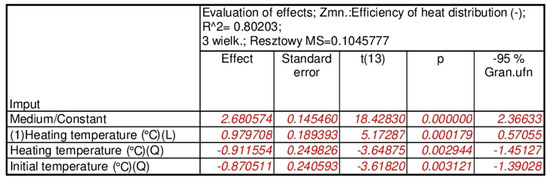
Figure 17.
Results of the analysis of the effect of statistically significant input quantities on the response function value, applicable to the PCM/copper conductor heat accumulator.
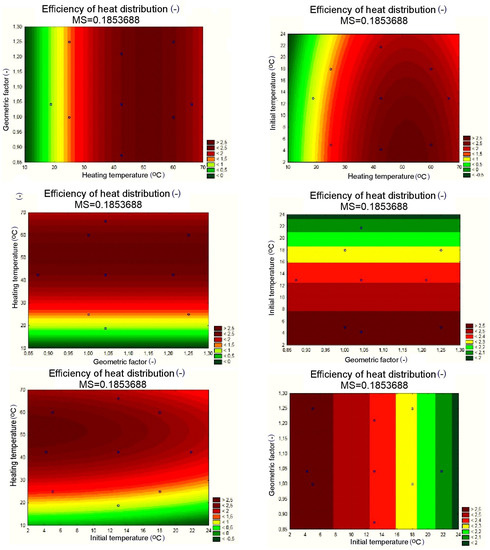
Figure 18.
Response planes of the assumed polynomial approximation, presenting the impact of input quantities on the output quantity, applicable to the PCM/copper conductor heat accumulator.
One of the statistical analysis deliverables was the derivation of the formulas of polynomial functions approximating the individual statistically significant input quantities to the heat distribution factor values. They represented one of the utilitarian objectives of this work and allowed us to predict the thermal performance of the other heat accumulators, the input quantities of which would fall within the adopted input quantity domain of the approximation function. A summary of the approximation function formulas determined in Statistica for the individual heat accumulators is shown in Table 8.

Table 8.
List of the obtained approximating functions of the heat batteries examined.
4. Conclusions
The empirical and statistical results presented in this paper proved the validity of using coke recyclate as the conductive framework in phase-change heat accumulators. The empirical results showed that the heat accumulator with PCM and coke recyclate extended the heat storage time and maintained the external surface temperature at 20 °C by 7 min longer compared to an identically shaped battery with pure PCM, and by 9 min compared to an identically shaped battery with PCM and the copper conductor. In addition, it was noted that 65 min after the start of cooling the test specimens, the temperature of the PCM/coke recyclate heat accumulator reached lower values than that of the pure PCM heat accumulator; the reason for this was that the latter heat accumulator became unable to release the heat stored within.
These conclusions were further confirmed by a qualitative analysis of the performance of the heat accumulator specimens produced with the thermal imaging (FLIR F7i) camera, where it was made apparent that the application of a copper mesh as the conductive reinforcement of a PCM heat accumulator resulted in rapid melting and subsequent superheating of the liquid phase of the PCM, which limited the effective penetration of heat into the solid phase of the PCM.
The recyclate used in this work is a material with great application potential to increase the heat transfer intensity. The chemical composition analyses indicated that its highly carbonate nature was favorable to heat distribution. The observations of the structure of the recyclate used indicated a microstructural nature of its surface. This feature was also a favorable aspect of the material analyzed. The recyclate is also beneficial from an ecological and cost efficiency perspective.
The results of the statistical analysis proved—with an assumed significance level of p=0.05 and satisfactory values for the error and determination coefficients of each heat accumulator tested—that the variability of the input quantities was statistically significant for the value of the calculated heat distribution coefficient. Accordingly, the following were statistically significant: (i) for the pure PCM heat accumulators—heating temperature, shape factor and shape factor correlation; (ii) for the PCM/coke recyclate heat accumulators—heating temperature, geometric factor, geometric factor correlation and initial temperature of the specimens; and (iii) for the PCM/copper conductor heat accumulators—heating temperature, heating temperature correlation and the initial temperature of the specimens.
The results of this research and analyses provide important information on the thermal function and design of phase-change heat accumulators, as well as an analysis of the effective improvement of heat distribution within the structure of such accumulators. The authors see the need for further research on improving the heat distribution within PCM heat accumulators. Improving heat distribution using conductive materials may not be sufficient in some cases. This problem is intended to be solved by convective heat transfer using nanoliquids of organic and inorganic PCM mixtures in the form of salt hydrates. The content presented here fits in with the problems of energy-efficient, low-emission building engineering and the recycling of materials in the construction industry.
Author Contributions
Conceptualization, M.M.; methodology, M.M., L.L. and A.P.; validation, M.M.; formal analysis, M.M.; investigation, MM., L.L. and A.P.; resources, M.M., L.L. and A.P.; writing—original draft preparation, M.M., AP.; writing—review and editing, M.M., L.L. and A.P.; visualization, M.M.; supervision, M.M., L.L. and A.P. All authors have read and agreed to the published version of the manuscript.
Funding
This research received no external funding.
Data Availability Statement
Not applicable.
Acknowledgments
Not applicable.
Conflicts of Interest
The authors declare no conflict of interest.
List of Designations
| Symbol | Name | Unit |
| α | The length of the interstellar ray | (-) |
| ϕD | Efficiency of heat distribution | (-) |
| AO | external surface of the PCM sample | (m2) |
| b* | Coefficient informing about the contribution | (-) |
| of a given variable to the prediction | ||
| Cw.L | specific heat of the liquid PCM | (J/g K) |
| Cw.S | specific heat of the solid PCM | (J/g K) |
| df | Degrees of freedom | (-) |
| F | Statistic value | (-) |
| f1, f2 | Degrees of freedom | (-) |
| Gf | Geometric factor | (-) |
| HT | melting/solidification heat of the PCM. | (J/g) |
| MS | Pure mistake | (-) |
| p | Significance level | (-) |
| R2 | Coefficient of determination | (-) |
| qr | heat flux density passing through the PCM sample | (W/m2) |
| SS | Variance | (-) |
| THeat | Heating temperature | (°C) |
| TInitial | Initial temperature | (°C) |
| PCM | Phase change materials | (-) |
| SEM | Scanning electron microscopy | (-) |
| EDS | due X energy dispersion microscope | (-) |
| CSR | Coke Strength after Reaction | (-) |
| CRI | Coke Reactivity Index | (-) |
References
- EuropenGreen Deal. Available online: https://www.consilium.europa.eu/pl/policies/green-deal/fit-for-55-the-eu-plan-for-a-green-transition/ (accessed on 15 November 2022).
- Kim, Y.U.; Park, J.H.; Yun, B.Y.; Yang, S.; Wi, S.; Kim, S. Mechanical and thermal properties of artificial stone finishing materials mixed with PCM impregnated lightweight aggregate and carbon material. Constr. Build. Mater. 2021, 272, 121882. [Google Scholar] [CrossRef]
- Zhang, X.; Li, Y.; Luo, C.; Pan, C. Fabrication and properties of novel tubular carbon fiber-ionic liquids/stearic acid composite PCMs. Renew. Energy 2021, 177, 411–421. [Google Scholar] [CrossRef]
- Sun, X.; Liu, L.; Mo, Y.; Li, J.; Li, C. Enhanced thermal energy storage of a paraffin-based phase change material (PCM) using nano carbons. Appl. Therm. Eng. 2020, 181, 115992. [Google Scholar] [CrossRef]
- Ramakrishnan, S.; Wang, X.; Sanjayan, J. Effects of various carbon additives on the thermal storage performance of form-stable PCM integrated cementations composites. Appl. Therm. Eng. 2019, 148, 491–501. [Google Scholar] [CrossRef]
- Chen, X.; Gao, H.; Yang, M.; Dong, W.; Huang, X.; Li, A.; Dong, C.; Wang, G. Highly graphitized 3D network carbon for shape-stabilized composite PCMs with superior thermal energy harvesting. Nano Energy 2018, 49, 86–94. [Google Scholar] [CrossRef]
- Lichołai, L.; Musiał, M. Experimental analysis of the functioning of a window with a phase change heat accumulator. Materials 2020, 13, 3647. [Google Scholar] [CrossRef]
- Ke, W.; Ji, J.; Zhang, C.; Xie, H.; Tang, Y.; Wang, C. Effects of the PCM layer position on the comprehensive performance of a built-middle PV-Trombe wall system for building application in the heating season. Energy 2023, 267, 126562. [Google Scholar] [CrossRef]
- Nguyen, T.Q.; Nguyen, V.T. Characterizing the induced flow through the cavity of a wall solar chimney under the effects of the opening heights. J. Build. Phys. 2022, 17442591221140465. [Google Scholar] [CrossRef]
- Xu, C.; Zhang, H.; Fang, G. Review on thermal conductivity improvement of phase change materials with enhanced additives for thermal energy storage. J. Energy Storage 2022, 51, 104568. [Google Scholar] [CrossRef]
- Cui, H.; Zou, J.; Gong, Z.; Zheng, D.; Bao, X.; Chen, X. Study on the thermal and mechanical properties of steel fibre reinforced PCM-HSB concrete for high performance in energy piles. Constr. Build. Mater. 2022, 350, 128822. [Google Scholar] [CrossRef]
- Liu, Y.; Zheng, R.; Li, J. High latent heat phase change materials (PCMs) with low melting temperature for thermal management and storage of electronic devices and power batteries: Critical review. Renew. Sustain. Energy Rev. 2022, 168, 112783. [Google Scholar] [CrossRef]
- Zhu, M.; Wang, Z.; Zhang, H.; Sun, X.; Dou, B.; Wu, W.; Zhang, G.; Jiang, L. Experimental investigation of the comprehensive heat transfer performance of PCMs filled with CMF in a heat storage device. Int. J. Heat Mass Transf. 2022, 188, 122582. [Google Scholar] [CrossRef]
- Wang, L.; Kan, A.; Yu, W. Melting behavior and heat transfer performance in a modified PCM-filled enclosure with fins under hypergravity conditions. Int. Commun. Heat Mass Transf. 2022, 138, 106415. [Google Scholar] [CrossRef]
- Zhang, S.; Pu, L.; Mancin, S.; Ma, Z.; Xu, L. Experimental study on heat transfer characteristics of metal foam/paraffin composite PCMs in large cavities: Effects of material types and heating configurations. Appl. Energy 2022, 325, 119790. [Google Scholar] [CrossRef]
- Liu, D.; Xie, K.; Zhang, H.; Qiang, Y.; Yang, D.; Wang, Z.; Zhu, L.; Akkurt, N.; Du, Y.; Shen, M.; et al. Numerical evaluation of convective heat transfer properties of two-dimensional rotating PCM melt in the unilaterally heated rectangular container. Renew Energy 2022, 193, 920–940. [Google Scholar] [CrossRef]
- Ho, C.J.; Huang, S.H.; Lai, C.M. Enhancing laminar forced convection heat transfer by using Al2O3/PCM nanofluids in a concentric double-tube duct. Case Stud. Therm. Eng. 2022, 35, 102147. [Google Scholar] [CrossRef]
- Mozafari, M.; Lee, A.; Cheng, S. A novel dual-PCM configuration to improve simultaneous energy storage and recovery in triplex-tube heat exchanger. Int. J. Heat Mass Transf. 2022, 186, 122420. [Google Scholar] [CrossRef]
- Ho, C.J.; Jang, C.; Lai, C.M. Natural convection heat transfer in PCM suspensions in a square enclosure with bottom heating and top cooling. Therm. Sci. Eng. Prog. 2021, 25, 101037. [Google Scholar] [CrossRef]
- Kouravand, A.; Kasaeian, A.; Pourfayaz, F.; Amin, M. Rad, V. Evaluation of a nanofluid-based concentrating photovoltaic thermal system integrated with finned PCM heatsink: An experimental study. Renew. Energy 2022, 201, 1010–1025. [Google Scholar] [CrossRef]
- Abdelrazik, A.S.; Saidur, R.; Al-Sulaiman, F.A.; Al-Ahmed, A.; Ben-Mansour, R. Multiwalled CNT and graphene nanoplatelets based nano-enhanced PCMs: Evaluation for the thermal performance and its implications on the performance of hybrid PV/thermal systems. Mater. Today 2022, 31, 103618. [Google Scholar] [CrossRef]
- Shaik, S.; Arumugam, C.; Shaik, S.C.; Arıcı, M.; Afzal, A.; Ma, Z. Strategic design of PCM integrated burnt clay bricks: Potential for cost-cutting measures for air conditioning and carbon dioxide extenuation. J. Clean. Prod. 2022, 375, 134077. [Google Scholar] [CrossRef]
- Liu, X.; Yang, F.; Li, M.; Sun, C.; Wu, Y. Development of cost-effective PCM-carbon foam composites for thermal energy storage. Energy Rep. 2022, 8, 1696–1703. [Google Scholar] [CrossRef]
- Kim, J.; Lee, J.; Song, C.; Yun, J.; Choi, W. Enhanced thermal performances of PCM heat sinks enabled by layer-by-layer-assembled carbon nanotube-polyethylenimine functional interfaces. Energy Convers. Manag. 2022, 266, 115853. [Google Scholar] [CrossRef]
- Fikri, M.A.; Pandey, A.K.; Samykano, M.; Kadirgama, K.; George, M.; Saidur, R.; Selvaraj, J.; Rahim, N.A.; Sharma, K.; Tyagi, V.V. Thermal conductivity, reliability, and stability assessment of phase change material (PCM) doped with functionalized multi-wall carbon nanotubes (FMWCNTs). J. Energy Storage 2022, 50, 104676. [Google Scholar] [CrossRef]
- Du, Y.; Zhou, T.; Zhao, C.; Ding, Y. Molecular dynamics simulation on thermal enhancement for carbon nanotubes (CNTs) based phase change materials (PCMs). Int. J. Heat Mass Transf. 2022, 182, 122017. [Google Scholar] [CrossRef]
- Naghdbishi, A.; Yazdi, M.E.; Akbari, G. Experimental investigation of the effect of multi-wall carbon nanotube–Water/glycol based nanofluids on a PVT system integrated with PCM-covered collector. Appl. Therm. Eng. 2020, 178, 115556. [Google Scholar] [CrossRef]
- Lin, X.; Chen, X.Y.; Weng, L.; Hu, D.; Qiu, C.; Liu, P.; Zhang, Y.; Fan, M.; Sun, W.; Guo, X. In-situ copper ion reduction and micro encapsulation of wood-based composite PCM with effective anisotropic thermal conductivity and energy storage. Sol. Energy Mater. Sol. Cells 2022, 242, 111762. [Google Scholar] [CrossRef]
- Basińska, M.; Kaczorek, D.; Koczyk, H. Economic and Energy Analysis of Building Retrofitting Using Internal Insulations. Energies 2021, 14, 2446. [Google Scholar] [CrossRef]
- Stepien, A.; Piotrowski, J.Z. Thermal insulation of autoclaved materials. J. Phys. Conf. Ser. 2021, 2069, 012037. [Google Scholar] [CrossRef]
- Berardi, U.; Kisilewic, T.; Kim, S.; Lechowska, A.; Paulos, J.; Schnotale, J. Experimental and numerical investigation of the thermal transmittance of PVC window frames with silica aeroge. J. Build. Eng. 2020, 32, 101665. [Google Scholar] [CrossRef]
- Kabošová, L.; Chronis, A.; Galanos, T.; Kmeť, S.; Katunský, D. Shape optimization during design for improving outdoor wind comfort and solar radiation in cities. Build. Environ. 2022, 226, 109668. [Google Scholar] [CrossRef]
- Tokarski, D.; Ickiewicz, I.; Zukiewicz-Sobczak, W.; Woliński, P. The Impact of Biochar Used in Repairs to Historical Buildings on Public Health. Int. J. Environ. Res. Public Health 2022, 19, 12996. [Google Scholar] [CrossRef]
- Jędrzejuk, H.; Chwieduk, D. Possibilities of Upgrading Warsaw Existing Residential Area to Status of Positive Energy Districts. Energies 2021, 14, 5984. [Google Scholar] [CrossRef]
- Fan, L.W.; Zhu, Z.Q.; Zeng, Y.; Xiao, Y.Q.; Liu, X.L.; Wu, Y.Y.; Ding, Q.; Yu, Z.T.; Cen, K.F. Transient performance of a PCM-based heat sink with high aspect-ratio carbon nanofillers. Appl. Therm. Eng. 2015, 75, 532–540. [Google Scholar] [CrossRef]
- Atinafu, D.G.; Yun, B.Y.; Wi, S.; Kang, Y.; Kim, S. A comparative analysis of biochar, activated carbon, expanded graphite, and multi-walled carbon nanotubes with respect to PCM loading and energy-storage capacities. Environ. Res. 2021, 195, 110853. [Google Scholar] [CrossRef] [PubMed]
- Darzi, M.E.; Golestaneh, S.I.; Kamali, M.; Karimi, G. Thermal and electrical performance analysis of co-electrospun-electrosprayed PCM nanofiber composites in the presence of graphene and carbon fiber powder. Renew. Energy 2019, 135, 719–728. [Google Scholar] [CrossRef]
- Pássaro, J.; Rebola, A.; Coelho L Conde, J.; Evangelakis, G.A.; Prouskas, C.; Papageorgiou, D.G.; Zisopoulou, A.; Lagaris, I.E. Effect of fins and nanoparticles in the discharge performance of PCM thermal storage system with a multi pass finned tube heat exchange. Appl. Therm. Eng. 2022, 212, 118569. [Google Scholar] [CrossRef]
- Kurnia, J.C.; Sasmito, A.P.; Jangam, S.V.; Mujumdar, A.S. Improved design for heat transfer performance of a novel phase change material (PCM) thermal energy storage (TES). Appl. Therm. Eng. 2013, 50, 896–907. [Google Scholar] [CrossRef]
- Powała, K.; Obraniak, A.; Heim, D.; Mrowiec, A. Macroencapsulation of Paraffin in a Polymer–Gypsum Composite Using Granulation Technique. Materials 2022, 15, 3783. [Google Scholar] [CrossRef]
- Musiał, M.; Pękala, A. Functioning of Heat Accumulating Composites of Carbon Recyclate and Phase Change Material. Materials 2022, 15, 2331. [Google Scholar] [CrossRef]
- Musiał, M. Untersuchung des Einflusses der Geometrie auf ihre Pakete PCM Wärmespeichereffizienz. Bauphysik 2019, 6, 324–330. [Google Scholar] [CrossRef]
- Musiał, M. Experimental and Numerical Analysis of the Energy Efficiency of Transparent Partitions with a Thermal Storage Unit. J. Ecol. Eng. 2020, 21, 201–211. [Google Scholar] [CrossRef]
- Musiał, M.; Lichołai, L. The Impact of a Mobile Shading System and a Phase-Change Heat Store on the Thermal Functioning of a Transparent Building Partition. Materials 2021, 14, 2512. [Google Scholar] [CrossRef] [PubMed]
- Polański, Z. Experimental Planning in Technology; National Scientific Publishing House: Warsaw, Poland, 1984. (In Polish) [Google Scholar]
- Großpietsch, K.H.; Lungen, H.B. Coke Quality Requirements by European Blast Furnance Operators. Stahl und Eisen 2000, 120, 35–42. [Google Scholar]
- Ozga-Blaschke, U. Coking Coal Economy; Publishing house; IGSMiE PAN: Kraków, Poland, 2010. [Google Scholar]
- Jelonek, I.; Jelonek, Z. Influence of Petrographic Parameters of Hard Coals on the Quality of Metallurgical Coke; Publishing house, Science notebooks; Institute of Mineral Resources and Energy Management, Polish Academy of Sciences: Warsaw, Poland, 2017. [Google Scholar]
- Warzecha, A.; Jarno, M.; Hereźniak, W. Analysis of the International Coke Market; Mining Publishing House Karbo: Zabrze, Poland, 2011; pp. 238–249. [Google Scholar]
- Michalik, A.; Bronny, M. Quality Parameters of Coke Meeting the Requirements of the Blast Furnace Process, and the Properties of the Available Carbon Base; Mining Publishing House Karbo: Zabrze, Poland, 2011; Volume 46, p. 53. [Google Scholar]
- Konieczynski, J.; Zajusz-Zubek, E.; Jabłonska, M. The Release of Trace Elements in the Process of Coal Coking. Sci. World J. 2012, 2012, 294927. [Google Scholar] [CrossRef]
- Pacyna, J.M.; Pacyna, E.G. Combustion and Industry Expert Panel Workshop. Eur. Jt. 2003. Available online: https://www.google.com/url?sa=t&rct=j&q=&esrc=s&source=web&cd=&ved=2ahUKEwj83brC6OX8AhVhiYsKHUZGDd4QFnoECBgQAQ&url=https%3A%2F%2Fwww.eea.europa.eu%2Fpublications%2FEMEPCORINAIR5%2FB336vs2.2.pdf&usg=AOvVaw2XjNbRwoWVFKbWTlHXwJuz (accessed on 24 January 2023).
- EMEP/EEA. Emission Inventory Guidebook; The EEA: Copenhagen, Denmark, 2009; Available online: https://www.eea.europa.eu/publications/emep-eea-emission-inventory-guidebook-2009 (accessed on 6 December 2022).
- Theloke, U.; Kummer, S.; Nitter, T.; Geftler, T.; Friedrich, R. Ueber arbeitung der Schwermetallkapitel im Corinair Guidebook zur Verbesserung der Emission in ventare und der Berichterstattung im Rahmem der Genfer Luftreinhalte konvention; Report for Umweltbundesamt: Sachsen-Anhalt, Germany, 2008. [Google Scholar]
- Pacyna, J.M.; Pacyna, E.G. Anassessment of global and regional emissions of trace metals to the atmosphere from anthropogenic sources worldwide. Environ. Rev. 2001, 9, 269–298. [Google Scholar] [CrossRef]
Disclaimer/Publisher’s Note: The statements, opinions and data contained in all publications are solely those of the individual author(s) and contributor(s) and not of MDPI and/or the editor(s). MDPI and/or the editor(s) disclaim responsibility for any injury to people or property resulting from any ideas, methods, instructions or products referred to in the content. |
© 2023 by the authors. Licensee MDPI, Basel, Switzerland. This article is an open access article distributed under the terms and conditions of the Creative Commons Attribution (CC BY) license (https://creativecommons.org/licenses/by/4.0/).