Abstract
An air-powered vehicle is a low-cost method to achieve low-pollution transportation, and compressed air engines (CAE) have become a research hotspot for their compact structure, low consumption, and wide working conditions. In this study, a pneumatic motor (PM) test bench is built and tested under different inlet pressures, operation modes, and three driving cycles. On the basis of the data obtained by sensors, power output, compressed air consumption rate, and efficiency are calculated to evaluate the pneumatic motor performances. The results show that with an increase in rotation speed, the output power and efficiency first increase and then decrease, and the compression air consumption rate decreases. With an increase in torque, the rotation speed decreases, and the power output and efficiency first increase and then decrease. With an increase in mass flow rate, the torque increases, the power output and efficiency first increase and then decrease. The pneumatic motor achieves the best performance under a rotation speed of 800–1200 rpm, where power output, efficiency, and compressed air consumption rates are 1498 W, 13.6%, and 10 J/g, respectively. The pneumatic motor achieves the best power output and efficiency under the UDDS driving cycle.
1. Introduction
The consumption of fossil fuels and environmental pollution prompt people to find alternative energy sources [1]. Therefore, various types of alternative energy, such as batteries, hydrogen, flywheel, and compressed air, are introduced to achieve low-pollution energy [2]. Among all kinds of energies, compressed air energy storage is a promising energy storage technology with zero emissions, high durability, and low cost [3]. A compressed air engine (CAE) can convert the internal energy of compressed air into mechanical work. From the aspect of mechanical operation, CAEs have the advantages of wide working conditions, smooth speed shifts, and being almost frictionless [4].
CAEs have been widely researched in recent years. Zhang et al. [5] analyzed and compared the energy and exergy of three-step and four-step CAEs. The result showed that the overall efficiencies of the CAEs are comparable to those of conventional diesel engines and fuel cell vehicles. Rzasa et al. [6] presented a new low-speed CAE; the structure was optimized and the number of kinematic nodes was decreased. From the results, it can be seen that the power and mass relation are improved by up to 25% compared to similar engines. Vishnuvardhan et al. [7] studied the performance of a compressed air engine improved by a conventional four-stroke engine. The results showed that the torque and output power are significantly higher than gasoline engines under the same pressure, and the exhaust temperature is lower than the environmental temperature. Liu et al. [8] modified the intake and exhaust system for piston-type CAEs, and the output power and fluid properties at various intake pressures and rotational speeds were examined. The results showed that the modified CAE is operable under a pressure of 13 bar and yields an output power of 2.15 kW and a torque of 15.97 N·m. Yu et al. [9] analyzed the working process of a CAE, established and validated the mathematical model, then transformed the model into a dimensionless expression to evaluate the performance of CAEs. The results showed that the efficiency of CAE is mainly influenced by dimensionless exhaust pressure, intake duration angle, and dimensionless cylinder clearance. Huang et al. [10] made an experimental investigation of compressed air-driven two-stroke piston engine performance under different pressure from 5 to 9 bar, which found that the output power is lower than internal combustion engines, but the torque is higher, and the exhaust is reusable. Zeng et al. [11] studied four-stroke CAE performance with variable rotation speed, and the results showed that CAE possesses higher torque, and the pressure and temperature of the exhaust rise proportionally with the rotation speed. Shen et al. [12] built and tested a motorcycle powered by compressed air, and the results showed that the efficiency of the motorcycle reached 70% when the speed was up to 20 km/h. Yan et al. [13] improved the air motor performance with parallel mode. Though the overall maximum power is less than the sum of the maximum power of the two pneumatic motors, the efficiency of each motor improved by 1.07% and 2.12%, respectively. Dou et al. [14] proposed a double-tank hybrid pneumatic engine system, which consisted of a high-pressure tank and low-pressure tank, to achieve the optimal compression cycle in variable working conditions. The results showed that the improvement of recoverable air mass reaches nearly 40%, and the mean effective brake pressure is elevated by less than 0.2 MPa. Dimitrova et al. [15] combined a conventional engine with a pneumatic motor to enhance the overall power efficiency and tested it under urban and NEDC working conditions. With different compression cycles, the efficiency improvement was from 20% to 50%. Fang et al. [16] constructed a pneumatic engine that uses an external heat source to elevate the cylinder temperature when the engine is operating. Compared with a non-heat source scenario, with 70 and 90 ℃ heat source temperatures and 1 MPa inlet pressure, the modified engine output power increased by 14% and 22%, respectively. Ibrahim et al. [17] proposed a hybrid engine system with wind–diesel and CAE to explore the potential of CAE for fuel consumption reduction and efficiency improvement. The results showed that the reduction in fuel consumption reached 50% under a given physical condition. Xu et al. [18] established an energy storage system based on a pneumatic motor and analyzed its performance. The result demonstrated that the exhaust has the potential for refrigeration, and under certain conditions, the efficiency of the system can reach 75.1%. Yi et al. [19] proposed a coupled layout of a hydro-pneumatic energy storage system; compared with isolated compressed air energy storage, the weight and volume are decreased by 15.4% and 24.8%, respectively. Xu et al. [20] investigated the transportation application of a pneumatic motor. The results showed that the performance and economy of the pneumatic motor as an auxiliary system of the vehicle are feasible.
From the studies mentioned above, it can be seen that many experimental studies on CAE efficiency and other performance parameters have been carried out by world scholars. However few experimental studies concentrated on the influence of different operation modes on the performance of medium pneumatic motors. In this paper, a medium pneumatic motor test bench is built, and the main performance parameters, for instance, torque, power output, rotation speed, inlet–outlet pressure, flow rate, and compression air consumption rate, are discussed through the experimental results, and the relationship between the parameters is analyzed. Finally, the comprehensive performance of the pneumatic motor is investigated.
2. Experiment Setup and Procedure
The following section mainly introduces the test bench of the compressed air engine, the experimental setup, and the process.
2.1. Working Principle and Calculation Method
The pneumatic motor (PM) test bench in this paper is described in detail in our previous study [18]. The schematic diagram of the test bench and the pneumatic motor are shown in Figure 1. The test bench contained an air compressor, desiccator, regulator valve, solenoid valve, flow meter, pneumatic motor, pressure sensor, temperature sensor, torque sensor, magnetic power brake, and data acquisition system. The compressor was used to produce and store compressed air (CA), and the maximum pressure was up to 15 bar. A refrigerator dryer was used to heat compressed air. The regulator valve was used to adjust and monitor the intake pressure. Moreover, the solenoid valve was used to change the direction of the intake and exhaust, which can realize the conversion of forward rotation and reverse rotation of the PM. The magnetic power brake was used to control the rotation speed and brake the PM. The flowmeter was used to measure the intake flow. The pressure and temperature sensors were used to collect the inlet and outlet pressure and temperature data. The torque sensor and rotation speed sensor were banded rigidly with the PM output shaft to measure the torque and rotation speed. The main parameters of the sensors are shown in Table 1. The power mechanism of the pneumatic motor was five cylinders; compressed air enters the cylinders, expands, and pushes the piston to do work, then the air is discharged out of the cylinders. The specific principle of the pneumatic motor in this paper is similar to a radial engine.
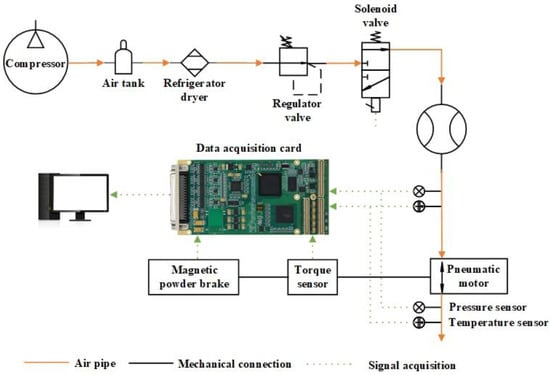
Figure 1.
Schematic diagram of the pneumatic test bench.

Table 1.
Parameters of the sensors.
However, some of the performance parameters need to be calculated. Assuming that the air of the PM is an ideal gas, with the torque and rotation speed, the output power can be described by the following expression:
where stands for the output power in the unit of W. stands for the rotation speed of the PM in the unit of rpm. stands for the measured value of the PM torque in the unit of N·m.
To measure the mass flow rate of the CA, the ideal gas law is introduced, and the gas at the outlet of the PM is closer in parameter to the ideal gas, assuming that there is no mass loss between the inlet and outlet of the PM. The CA mass flow rate can be replaced by the gas mass flow rate at the outlet, and the ideal gas law can be written as:
where denotes the pressure in the unit of Pa, and the outlet pressure is selected in advance during the experiment. denotes the volume in the unit of m3. stands for the universal gas constant, which is valued at 8.31 J/(mol·K). denotes the temperature of outlet gas in K, and denotes the amount of substance with the unit of mol.
After that, the gas substance amount flow rate can be obtained by dividing both sides of the equation by unit time, which can be expressed as:
where denotes the substance amount flow rate with the unit of mol/s. denotes the gas volume flow rate obtained by the flowmeter and with the unit of m3/s.
The mass flow rate can be calculated with the substance amount flow rate, and the expression can be written as:
where denotes the relative molecular mass of air, which utilizes the empirical value of 28.96 g/mol, and denotes the mass flow rate value.
The evaluation of the economy of the engine is necessary, considering that the PM outputs kinetic energy by consuming CA, and the compressed air consumption rate (CACR) is used to measure the relationship between the power output and gas consumption rate. The CACR can be calculated with the following expression:
where is the calculated CACR in the unit of g/J.
To calculate the efficiency of thermal power conversion of the PM, the expression can be described as follows:
where denotes the efficiency of thermal power conversion of the PM, and and stand for the enthalpy of air at the inlet and outlet of the PM, respectively, in the unit of J/g.
With the thermal power conversion efficiency, the efficiency of the total system can be calculated with the following expression:
where stands for the isentropic efficiency, and the isentropic efficiency indicates the ability of an expander to convert stored energy into actual available energy.
2.2. Experiment Setup
In this paper, the PM output characteristics were measured under a pressure range of 6.5–9.5 MPa. The intake pressure was controlled by a regulator valve, and the value increased by 1 MPa each time. After that, the pressure was fixed at 7.5 MPa, and the performance of the CAE was tested under variable standard working conditions, which include Extra-Urban Driving Cycle (EUDC), Federal Test Procedure 75 (FTP75), and Urban Dynamometer Driving Schedule (UDDS). Moreover, the PM was also tested under both forward rotation conditions and reverse rotation conditions based on the test conditions above.
The influence of the key setup parameters on the PM performance was investigated and summarized; the experiment was based on the control variable method, and with each group, only one factor was changeable, and the others remained fixed, and after that, the effect of the changeable factor was analyzed.
3. Results and Discussion
To evaluate the performance of the PM, the torque, rotation speed, and working conditions were chosen to describe the performance. The following section mainly describes the results and conclusions of the experimental data.
3.1. PM Performance under Variable Rotation Speed
Figure 2 shows the influence of rotation speed on the power output of the PM, and Figure 2a,b represent the forward rotation and reverse rotation, respectively. With different inlet pressures, the maximum rotation speeds that the PM can achieve are different. It can be seen from the figures that with the increase in rotation speed, the power output first rises and drops after reaching the peak value, and the variation trends of different operation modes are similar. Under the same rotation speed, with the increase in the inlet pressure, the power output increases. The power outputs under minimum rotation speed are basically at the same level. The peak values in power outputs appear at the rotation speed of 800–1200 rpm, and the peak values in four power outputs are 1517 W, 1341 W, 1198 W, and 1010 W. It can also be seen in the figure that higher inlet pressure enables a wider rotation speed range for maximum power output. After the rotation speed reaches 900 rpm, the power outputs decrease. This is because when the rotation speed is too high, despite the increased gas flow, the gas expansion process time is too short, the enthalpy consumption of intake air increases, and mechanical friction becomes greater. Therefore, the output power at 900 rpm can be considered as the highest power output. The power output of the forward rotation group is about 100 W higher than the reverse rotation group under the same inlet pressure, which is determined by the output characteristics of the PM. Because the intake port and exhaust port swap, the intake port flow rate becomes slower, while the exhaust port flow rate becomes faster, resulting in high-pressure gas in the cylinders that cannot be fully expanded and discharged, thus, reducing the power of the reverse rotation mode. To optimize the power output characteristics of the reverse rotation mode, the intake and exhaust valves should be improved.
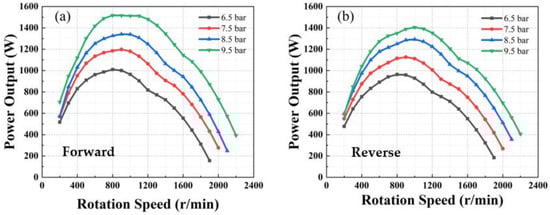
Figure 2.
Influence of rotation speed on the power output of PM.
Figure 3 shows the influence of rotation speed on the CACR of the PM, and Figure 3a,b represent the forward rotation and reverse rotation, respectively. CACR is one of the important parameters to evaluate the economy of a compressed air engine. The results show that the CACR under variable pressure and different operation modes are basically in the same trend. Under the rotation speed range of low to medium, CACR presents a slight fluctuation with the increase in rotation speed. After the rotation speed approaches the maximum value, the CACR presents a rapid rise with the increase in rotation speed, and this may be because too much air is used to resist mechanical friction at a high rotation speed range. It also can be found that the four CACR–rotation speed curves intersect at one point, where the rotation speed is about 1250 rpm. Before reaching the point, the CACR slightly increases with the increase in inlet pressure, and after the point, the CACR decreases with the increase in inlet pressure. This is because under low and high rotation speeds, the power outputs are low, but the mass flow is greater, so the CACR of the PM is high. At the low rotation speed ranges, the power outputs under different inlet pressures are similar, but when the rotation speed increases, the higher the inlet pressure, the higher the output power, so under the middle to high rotation speed range, the higher inlet pressure makes CACR lower. These trends demonstrate that lower inlet pressure with lower rotation speed and higher inlet pressure with higher rotation speed possess better economies, which can be used as a reference for the economic optimization of the PM. Moreover, to maintain the best operating economy, the PM rotation speed should be controlled in the range of 500–1000 rpm.
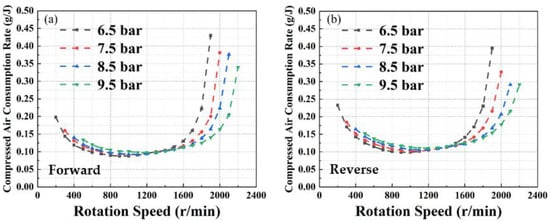
Figure 3.
Influence of rotation speed on the compressed air consumption rate of PM.
Figure 4 presents the influence of rotation speed on mass flow rate, and the solid line and dotted line represent the different operation modes. From the figure, it can be found that with the increase in rotation speed, the mass flow rate linearly decreases. Under the same rotation speed, with the increase in inlet pressure, the mass flow rate increases, and the mass flow rate under the reverse rotation mode is higher than the forward rotation mode. This is because when the inlet port and outlet port swap, the airflow of the outlet gets higher and the expansion of the gas gets lower, which leads to a higher mass flow rate and lower power output. The mass flow rate difference of 8.5 bar is higher than other groups, and the air intake of the forward rotation mode is lower than the regular value.
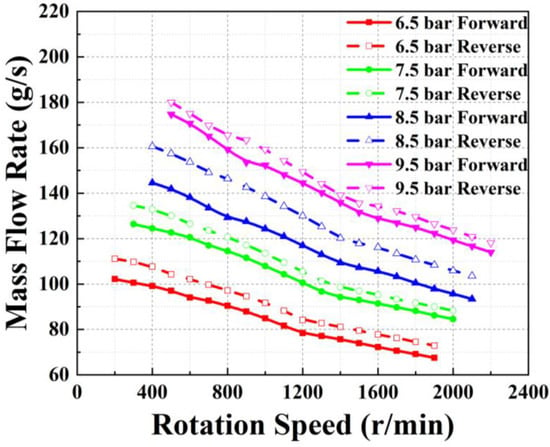
Figure 4.
Influence of rotation speed on the mass flow rate of PM.
3.2. PM Performance under Variable Torque
Figure 5 shows the influence of torque on rotation speed under variable inlet pressures, and Figure 5a,b represent the forward rotation and reverse rotation, respectively. It can be seen from the figure that the rotation speeds of the PM present a linear decrease with the increase in torque, and the variation trends of forward and reverse rotation modes are the same. Under the same torque value, with the increase in inlet pressure, which indicates that more air is charged into the PM, the rotation speed increases. Under the same pressure, the initial rotation speeds are almost at the same level, and with the increase in torque, the rotation speed values in reverse rotation drop faster than the forward ones, which is because, under the low rotation speed range, the reverse rotation mode makes the time of expansion process get shorter, and the gas is not fully expanded to discharge, so the torque becomes lower.
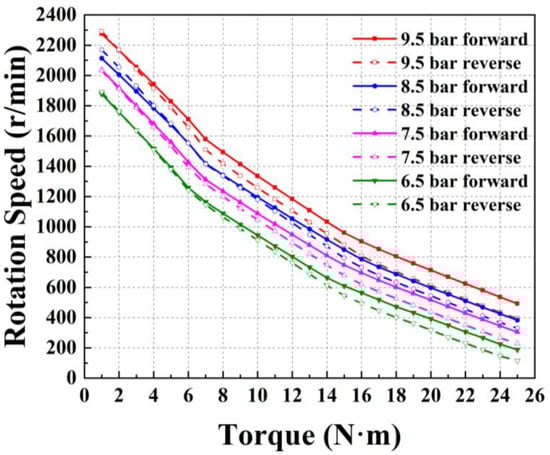
Figure 5.
Influence of torque on the rotation speed of PM.
The variable torque influence on PM power output with different operation modes is presented in Figure 5, and Figure 6a,b represent the forward rotation and reverse rotation, respectively. The results show that with the increase in torque, the power output of the PM increases first and decreases after reaching the peak value, and the variation trends of different operation modes are the same. Under the same torque, the power output rises with the increase in inlet pressure. Under the low torque range, the power outputs are basically at the same level, the difference in power outputs increases with the increase in torque value. The power outputs reach peak value under the torque range of 12–14 N·m. It can also be seen in Figure 6a that higher inlet pressure has a wider torque range for maximum power output under the forward rotation mode, but there is no such phenomenon in the reverse rotation mode. When torques reach a high value, the power output decreases with the increase in torques.
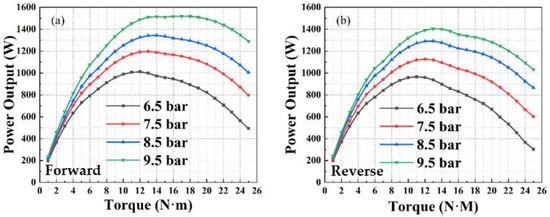
Figure 6.
Influence of torque on the power output of PM.
3.3. PM Performance under Variable Mass Flow Rate
Airflow rate is an important parameter to measure the compressed air mass consumption of the PM. Under different inlet pressures, the corresponding mass flow rate ranges under effective working conditions are different, and the effective working conditions of inlet pressures of 6.5 bar, 7.5 bar, 8.5 bar, and 9.5 bar are defined by rotation speed ranges of 200–1900 rpm, 300–2000 rpm, 400–2100 rpm, and 500–2200 rpm, respectively.
The compressed air mass flow rates that influence the PM power output are presented in Figure 7, and Figure 7a,b represent the forward rotation mode and reverse rotation mode, respectively. The results show that power outputs rise rapidly and drop after reaching the peak value within the respective mass flow rate range, and the corresponding mass flow rate has different critical values under different inlet pressures. With the increase in inlet pressure, the mass flow rate range corresponding to effective working conditions increases. The mass flow rate has a close relationship with the rotation speed, and a higher mass flow rate can make pistons do more work, but too high of the mass flow rate leads to higher friction and higher outlet pressure, which reduces the power output. It also can be found that the adjacent curves intersect at one point, which indicates that a higher mass flow rate will produce a lower power output, and this can be used as a reference for matching intake pressure to operating conditions.
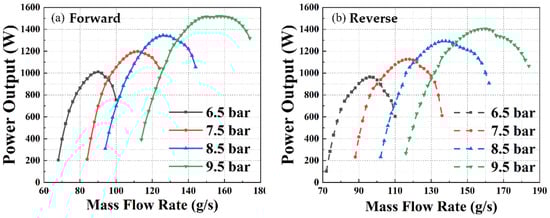
Figure 7.
Influence of mass flow rate on the power output of PM.
The variable compressed air mass flow rate influence on torque is presented in Figure 8, and Figure 8a,b represent the forward rotation and reverse rotation, respectively. From the figure, it can be found that with the increase in mass flow rate, the torque increases linearly. Meanwhile, under the same mass flow rate, the torque of the forward rotation mode is higher than the reverse rotation mode, and to achieve the same torque, the mass flow rate of reverse rotation is about 10 g/s higher than the forward rotation mode, which is because the incomplete expansion of the reverse rotation mode leads to high air consumption.
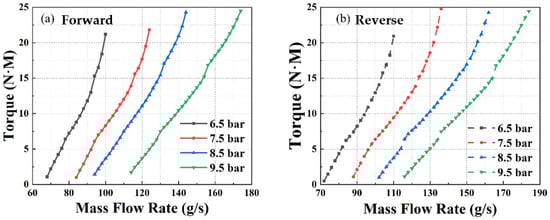
Figure 8.
Influence of mass flow rate on the torque value of PM.
3.4. Analysis of PM Efficiency Performance and Universal Characteristic
The variable rotation speed influence on the efficiency of the PM is presented in Figure 9, and Figure 9a,b represent the forward rotation and reverse rotation, respectively. From the figures, it can be found that with the increase in rotation speed, the efficiency of the PM first increases and then decreases after reaching the peak value, and the variation trends of forward rotation and reverse rotation modes are the same. After efficiency reaches the peak value, the four curves intersect at one point, where the rotation speed is about 1700 rpm. Before the rotation speed reaches this point, with the increase in inlet pressure, the efficiency decreases, then after rotation reaches the point, the efficiency increases with the increase in rotation speed, which indicates that higher inlet pressure possesses better efficiency with high rotation speed, this trend was also found in the reverse rotation mode. Meanwhile, with the increase in inlet pressure, the rotation speed corresponding to the efficiency peak value also increases. Under the same inlet pressure and rotation speed, the efficiency of the reverse rotation mode is about 2% lower than the forward rotation mode.
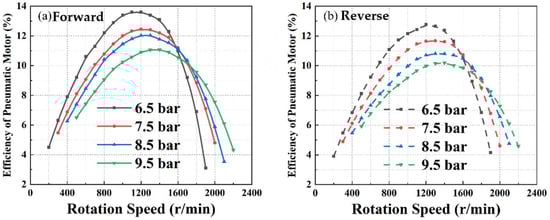
Figure 9.
Influence of rotation speed on the power efficiency of PM.
The variable torque influence on the efficiency of the PM is presented in Figure 10, and Figure 10a,b represent the forward rotation and reverse rotation, respectively. From the figures, it can be found that with the increase in torque, the efficiency first increases and then decreases after reaching the peak value, and the variation trends of forward rotation and reverse rotation modes are the same. The torque to efficiency curves also intersect at one point, where the torque value is about 16 N·m. Under the same inlet pressure, before reaching this point, with the increase in inlet pressure, the efficiency of the PM decreases, and after reaching this point, with the increase in inlet pressure, the efficiency of the PM increases, which indicates that a higher inlet pressure possesses better efficiency with higher torque, and this trend can also be found in the reverse rotation mode. Meanwhile, with the increase in inlet pressure, the torque corresponding to the efficiency peak value also increases. Under the same inlet pressure and torque, the efficiency of reverse rotation mode is about 2% lower than forward rotation mode.
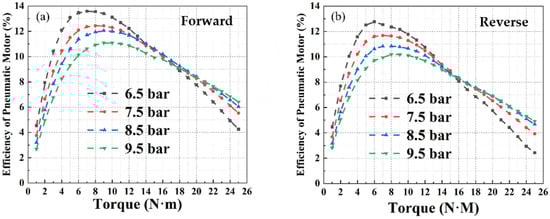
Figure 10.
Influence of torque on the power efficiency of PM.
The variable mass flow rate influence on the efficiency of the PM is presented in Figure 11, and Figure 11a,b represent the forward rotation and reverse rotation, respectively. From the figures, it can be seen that the mass flow rate range of different inlet pressures is different, according to the proposed effective working condition. Among all inlet pressures, with the increase in mass flow rate, the efficiency increases and then decreases after reaching the peak value, and the variation trends of forward rotation and reverse rotation modes are similar. It can also be found that to achieve the same efficiency, the higher inlet pressure needs a higher mass flow rate. Adjacent curves intersect at one point, which indicates that with the increase in mass flow rate, the higher inlet pressure possesses better efficiency.
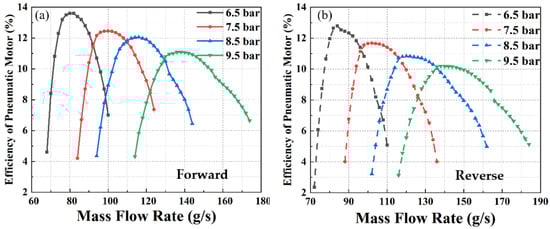
Figure 11.
Influence of mass flow rate on the power efficiency of PM.
The universal characteristic map is presented in Figure 12, and Figure 12a,b represent the forward rotation and reverse rotation, respectively. The red areas denote the maximum power output area of the PM, and it can be found from the figure that the rotation speed ranges corresponding to maximum power outputs of different operation modes are almost the same, and the corresponding torque of forward rotation is higher than the reverse rotation mode. The maximum power area of the forward rotation mode is wider; meanwhile, the maximum power output value is higher than the reverse rotation mode.
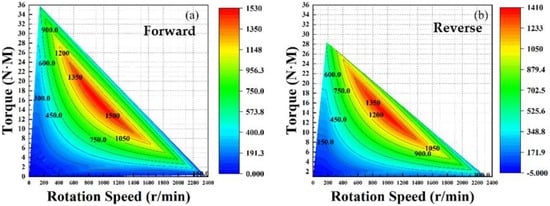
Figure 12.
Universal characteristic diagram of PM.
3.5. Analysis of PM Performance Difference under Different Operation Modes
The differences in the main performance parameters of the PM measured by rotation speed are presented in Figure 13, and Figure 13a–d represent differences in power output, efficiency, mass flow rate, and CACR, respectively. The differences are the values of the forward rotation mode minus the reverse rotation mode. Figure 13a presents the difference in power output, it can be found that with the increase in rotation speed, the difference in power output decreases in general, which indicates that under the low to medium rotation speed range, the power output of forward rotation is higher, but under high rotation speed, the power outputs under different operation modes are the same. Figure 13b presents the difference in efficiency, it can be found that with the increase in rotation speed, the efficiency of the PM first increases and then decreases, which indicates that under the low to medium rotation speed range, the difference in the efficiency of the forward rotation mode is higher, and under a high rotation range, the efficiencies under different operation modes are the same, and after reaching the critical value, the efficiency of reverse rotation is higher. Figure 13c presents the difference in mass flow rate, it can be found that with the increase in rotation speed, the difference in the mass flow rate decreases in general, and among the four different inlet pressures, the difference in mass flow rates under 8.5 is distinct from others, which may be caused by the experimental condition error. From Figure 13d presents the difference in compressed air consumption rate, it can be seen that with the increasing rotation speed, the difference in CACR first fluctuates slightly and decreases rapidly after the rotation speed reaches the critical value, which indicates that under a high rotation speed range, with the increasing rotation speed, the increase in CACR of the reverse rotation mode is slower than the forward rotation mode, and the reverse operation mode possesses better economy under high rotation speed.
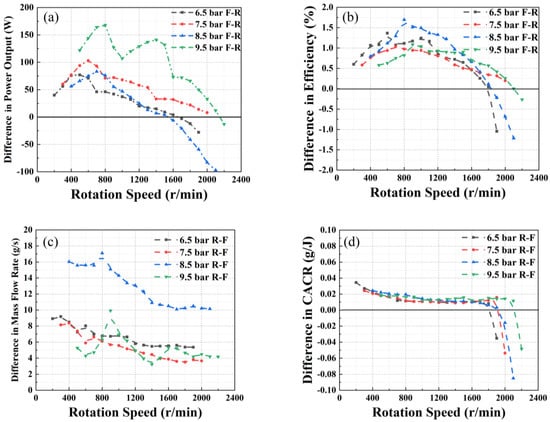
Figure 13.
Difference in main performance parameters of PM.
3.6. Analysis of CAE Vehicle Performance under Different Driving Cycles
Air-powered vehicles use compressed air as a power resource and are driven by a compressed air engine. This study uses a pneumatic motor as a compressed air engine, and it is tested under different working conditions.
Figure 14 presents the power output and efficiency of EUDC, FTP75, and UDDS. Figure 14a,b present the power output and efficiency of EUDC driving cycle, the maximum power output and efficiency are 589W and 10.9%, respectively. Figure 14c,d present the power output and efficiency of FTP75 driving cycle, the maximum power output and efficiency are 372W and 6.7%, respectively. Figure 14e,f present the power output and efficiency of UDDS driving cycle, the maximum power output and efficiency are 1164W and 13.7%, respectively. It can be found from the figure that the performance of the PM under FTP75 working conditions presents poor power and efficiency, and under UDDS working condition, the PM achieves the best power output and efficiency. The performance of the PM under different driving cycles is UDDS > EUDC > FTP75.
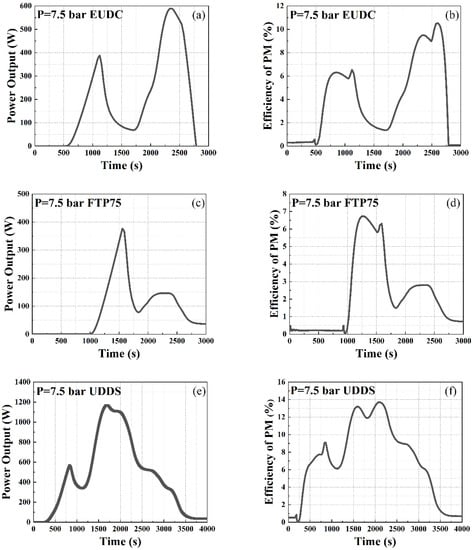
Figure 14.
Difference in main performance parameters of PM.
3.7. Error and Uncertainty Analysis
In this study, the error and uncertainty were analyzed based on the experimental data. The experiment was repeated three times under each condition. Figure 15a–d represent the uncertainty of power output, efficiency, mass flow rate, and CACR, respectively. The inlet pressure is set to 7.5 bar, which better represents the experimental conditions. The uncertainties are measured by standard deviations, which can be described as follow:
where denotes the error of the parameter, denotes the experimental data, denotes the average value of multiple experimental data, and denotes the repeat times of the experiment.
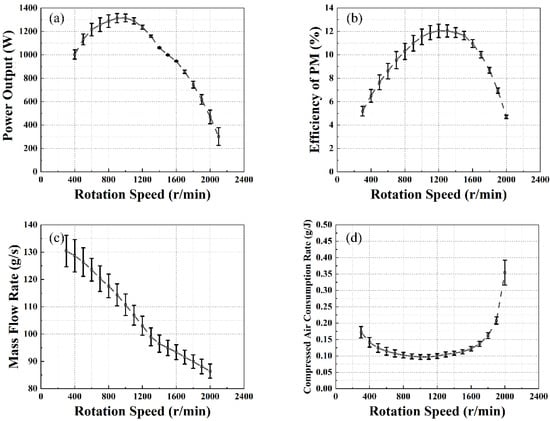
Figure 15.
Error bar analysis of main performance parameters of PM.
From Figure 15a, it can be found that with the increase in rotation speed, the error of power output first decreases and then increases, the medium to high rotation speed range has higher accuracy, and the variation trends of power output error of other inlet pressures are the same. From Figure 15b, it can be found that with the increase in rotation speed, the efficiency of the PM first increases then decreases, and efficiency under a high rotation speed range possesses higher accuracy. From Figure 15c, it can be found that with the increase in rotation speed, the mass flow rate gradually decreases, but the overall accuracy is low, which may be caused by the superposition of errors in data calculation. From Figure 15d, it can be seen that the overall error is low, and the CACR error of the maximum rotation speed range is higher, and the same trend can be found in other inlet pressure experiments, which may be caused by the rapid increase in CACR under the maximum rotation speed.
4. Results and Discussion
In this study, the PM test bench was built and tested under different inlet pressures, operation modes, and variable working conditions. The performance parameters of the pneumatic motor were calculated with experimental data, and the performance of the PM was evaluated based on the above parameters. The main conclusions of the study can be drawn as follows:
- (1)
- The influence of inlet pressure, rotation speed, torque, and mass flow rate on the performance of the PM was investigated, and under a rotation speed of 800–1200 rpm, the PM can achieve maximum power output and efficiencies of 1498 W and 13.6 %, respectively; meanwhile, the CACR of the PM is also lowest. The efficiency and power output of the forward rotation mode are higher than the reverse rotation mode under the low to medium rotation speed range, and when the rotation speed exceeds the corresponding critical value, the efficiency and power output of the reverse rotation mode are higher.
- (2)
- The rotation speed decreases with the increase in torque, and power output first increases and then decreases with the increase in torque. The PM achieves maximum power output and efficiency under a torque of 12–14 N·m.
- (3)
- Effective mass flow rate ranges are different under different intake pressures. Each inlet pressure has a corresponding mass flow rate threshold, and the power output and efficiency first increase and then decrease after reaching the threshold.
- (4)
- The comparison works of EUDC, FTP75, and UDDS driving cycles indicate that during the UDDS working condition, the PM can achieve the best performance, and the maximum power output and efficiency are 1164 W and 13.7%, respectively, and under EUDC, the performance of the PM is the worst, and the maximum power output and efficiency are 372 W and 6.7%, respectively.
In future work, the influence of intake and exhaust on performance will be analyzed, the intake and exhaust will be modified, more driving cycles will be tested under longer testing times, and efficiency optimization methods will be taken into consideration.
Author Contributions
Experiment, J.L. and Y.X.; methodology, J.L., Y.X., and H.Z.; calculations, J.L., Y.X., and F.Y.; validation, J.L. and Y.X.; formal analysis, J.L. and A.Y.; investigation, J.L.; writing—original draft preparation, J.L. and Y.X.; writing—review and editing, Y.X., A.Y., B.Y., and F.Y.; supervision, H.Z., Y.W. (Yan Wang), and Y.W. (Yuting Wu). All authors have read and agreed to the published version of the manuscript.
Funding
This research was funded by the Beijing Natural Science Foundation (grant no. 3222024) and supported by the State Key Laboratory of Engines, Tianjin University (grant no. K2020-08).
Data Availability Statement
The data presented in this study are available upon request from the corresponding author.
Acknowledgments
The authors would like to express our sincere appreciation to the editors and reviewers for their valuable comments on this research.
Conflicts of Interest
The authors declare no conflict of interest.
References
- Wang, L.; Zhu, S.L.; Zhang, X.R.; Zhang, H.Y. Another way of cleaner public transportation: Four-stroke high torque CAE (Compressed Air Engine) performance analysis and CAE bus. Energy Rep. 2022, 8, 5727–5738. [Google Scholar] [CrossRef]
- Mahlia, T.M.; Saktisahdan, T.J.; Jannifar, A.; Hasan, M.H.; Matseelar, H.S. A review of available methods and development on energy storage; technology update. Renew. Sustain. Energy Rev. 2014, 33, 532–545. [Google Scholar] [CrossRef]
- Bazdar, E.; Sameti, M.; Nasiri, F.; Haghighat, F. Compressed air energy storage in integrated energy systems: A review. Renew. Sustain. Energy Rev. 2022, 167, 112701. [Google Scholar] [CrossRef]
- Wasbari, F.; Bakar, R.A.; Gan, L.M.; Tahir, M.M.; Yusof, A.A. A review of compressed-air hybrid technology in vehicle system. Renew. Sustain. Energy Rev. 2017, 67, 935–953. [Google Scholar] [CrossRef]
- Zhang, X.; Wang, X.; Li, W.; Zhu, Y.; Zuo, Z.; Chen, H. Energy and exergy analysis of compressed air engine systems. Energy Rep. 2021, 7, 2316–2323. [Google Scholar] [CrossRef]
- Rząsa, M.; Łukasiewicz, E.; Wójtowicz, D. Test of a New Low-Speed Compressed Air Engine for Energy Recovery. Energies 2021, 14, 1179. [Google Scholar] [CrossRef]
- Vishnuvardhan, M.; Prasad, K.S.; Purushothaman, J. Purushothaman. Design and experimental investigation of compressed air engine. Mater. Today Proc. 2020, 33, 3311–3313. [Google Scholar] [CrossRef]
- Liu, C.M.; You, J.J.; Sung, C.K.; Huang, C.Y. Modified intake and exhaust system for piston-type compressed air engines. Energy 2015, 90, 516–524. [Google Scholar] [CrossRef]
- Yu, Q.; Cai, M.; Shi, Y.; Yuan, C. Dimensionless Study on Efficiency and Speed Characteristics of a Compressed Air Engine. J. Energy Resour. Technol. 2015, 137, 044501. [Google Scholar] [CrossRef]
- Huang, C.Y.; Hu, C.K.; Yu, C.J.; Sung, C.K. Experimental Investigation on the Performance of a Compressed-Air Driven Piston Engine. Energies 2013, 6, 1731–1745. [Google Scholar] [CrossRef]
- Shen, Y.T.; Hwang, Y.R. Design and implementation of an air-powered motorcycles. Appl. Energy 2009, 86, 1105–1110. [Google Scholar] [CrossRef]
- Zeng, F.; Xu, J.; Zhao, R. Experimental research of a four-stroke piston type compressed air engine. In Web of Conferences; EDP Sciences: Lisses, France, 2019; Volume 80, p. 02002. [Google Scholar]
- Yan, D.; Xu, Y.; Zhang, H.; Yang, F.; Tong, L.; Yang, Y.; Wang, Y.; Wu, Y. Experimental study of compressed air engine working in parallel operation mode. Int. J. Energy Res. 2022, 46, 18049–18066. [Google Scholar] [CrossRef]
- Dou, W.; Li, D.; Lu, Y.; Yu, X.; Roskilly, A.P. Evaluation of ideal double-tank hybrid pneumatic engine system under different compression cycle scenarios. Energy Procedia 2017, 142, 1388–1394. [Google Scholar] [CrossRef]
- Dimitrova, Z.; Maréchal, F. Gasoline hybrid pneumatic engine for efficient vehicle powertrain hybridization. Appl. Energy 2015, 151, 168–177. [Google Scholar] [CrossRef]
- Fang, Y.; Lu, Y.; Yu, X.; Roskilly, A.P. Experimental study of a pneumatic engine with heat supply to improve the overall performance. Appl. Therm. Eng. 2018, 134, 78–85. [Google Scholar] [CrossRef]
- Ibrahim, H.; Younès, R.; Basbous, T.; Ilinca, A.; Dimitrova, M. Optimization of diesel engine performances for a hybrid windediesel system with compressed air energy storage. Energy 2011, 36, 3079–3091. [Google Scholar] [CrossRef]
- Xu, Y.; Zhang, H.; Yang, F.; Tong, L.; Yang, Y.; Yan, D.; Wang, C.; Ren, J.; Wu, Y. Experimental study on small power generation energy storage device based on pneumatic motor and compressed air. Energy Convers. Manag. 2021, 234, 113949. [Google Scholar] [CrossRef]
- Yi, T.; Ma, F.; Jin, C.; Huang, Y. A novel coupled hydro-pneumatic energy storage system for hybrid mining trucks. Energy 2018, 143, 704–718. [Google Scholar] [CrossRef]
- Xu, Y.; Zhang, H.; Yang, F.; Tong, L.; Yan, D.; Yang, Y.; Wang, Y.; Wu, Y. Experimental investigation of pneumatic motor for transport application. Renew. Energy 2021, 179, 517–527. [Google Scholar] [CrossRef]
Disclaimer/Publisher’s Note: The statements, opinions and data contained in all publications are solely those of the individual author(s) and contributor(s) and not of MDPI and/or the editor(s). MDPI and/or the editor(s) disclaim responsibility for any injury to people or property resulting from any ideas, methods, instructions or products referred to in the content. |
© 2023 by the authors. Licensee MDPI, Basel, Switzerland. This article is an open access article distributed under the terms and conditions of the Creative Commons Attribution (CC BY) license (https://creativecommons.org/licenses/by/4.0/).