Article

Effects of Alcohol-Blended Waste Plastic Oil on Engine Performance Characteristics and Emissions of a Diesel Engine

1
Faculty of Industrial Technology, Surindra Rajabhat University, Surin 32000, Thailand
2
School of Engineer and Innovation, Rajamangala University of Technology Tawan-ok, Chonburi 20110, Thailand
3
School of Manufacturing Engineering, Institute of Engineering, Suranaree University of Technology, Nakhon Ratchasima 30000, Thailand
4
Institute of Research and Development, Suranaree University of Technology, Nakhon Ratchasima 30000, Thailand
5
School of Mechanical Engineering, Institute of Engineering, Suranaree University of Technology, Nakhon Ratchasima 30000, Thailand
*
Author to whom correspondence should be addressed.
Energies 2023, 16(3), 1281; https://doi.org/10.3390/en16031281
Submission received: 31 October 2022 / Revised: 11 January 2023 / Accepted: 18 January 2023 / Published: 25 January 2023
(This article belongs to the Special Issue Energy Trends of Fuel Combustion in Diesel Engine)

Abstract

:
The current study aims to investigate and compare the effects of waste plastic oil blended with n-butanol on the characteristics of diesel engines and exhaust gas emissions. Waste plastic oil produced by the pyrolysis process was blended with n-butanol at 5%, 10%, and 15% by volume. Experiments were conducted on a four-stroke, four-cylinder, water-cooled, direct injection diesel engine with a variation of five engine loads, while the engine’s speed was fixed at 2500 rpm. The experimental results showed that the main hydrocarbons present in WPO were within the range of diesel fuel (C13–C18, approximately 74.39%), while its specific gravity and flash point were out of the limit prescribed by the diesel fuel specification. The addition of n-butanol to WPO was found to reduce the engine’s thermal efficiency and increase HC and CO emissions, especially when the engine operated at low-load conditions. In order to find the suitable ratio of n-butanol blends when the engine operated at the tested engine load, the optimization process was carried out by considering the engine’s load and ratio of the n-butanol blend as input factors and the engine’s performance and emissions as output factors. It was found that the multi-objective function produced by the general regression neural network (GRNN) can be modeled as the multi-objective function with high predictive performances. The coefficient of determination (R2), mean absolute percentage error (MAPE), and root mean square error (RSME) of the optimization model proposed in the study were 0.999, 2.606%, and 0.663, respectively, when brake thermal efficiency was considered, while nitrogen oxide values were 0.998, 6.915%, and 0.600, respectively. As for the results of the optimization using NSGA-II, a single optimum value may not be attained as with the other methods, but the optimization’s boundary was obtained, which was established by making a trade-off between brake thermal efficiency and nitrogen oxide emissions. According to the Pareto frontier, the engine load and ratio of the n-butanol blend that caused the trade-off between maximum brake thermal efficiency and minimum nitrogen oxides are within the approximate range of 37 N.m to 104 N.m and 9% to 14%, respectively.

1. Introduction

Since the COVID-19 virus spread in 2020, there has been a sudden increase in plastic waste. The proportion of plastic waste during the COVID-19 epidemic in Thailand increased from normal conditions by 62% in April 2020 compared to 2019 [1] because the government asked for cooperation from the public and private sectors in considering measures for working at home to stop the epidemic, resulting in a work from home setting. Everyone wants to change their lifestyle habits to the new home office norm. At the same time, working at home or staying safe has led to substantial growth in the food delivery and packaging business. In particular, plastic packaging has increased significantly. Plastic packaging produces about 23 million tons annually in Europe, and this is predicted to reach 92 million tons in 2050 [2].
Reflecting upon the emerging demand for plastics, Bangkok, the capital of Thailand, continued to observe an increase in plastic waste. Thus, after the COVID-19 pandemic, more planning for plastic waste management will be required. The COVID-19 pandemic resulted in the disruption of energy demands and domestic economic growth, which resulted in fluctuating fuel prices. However, the current trend in modern energy development focuses on increasing the share of renewable energy, which is low-cost in nature and accessible from many sources, and promoting the decentralization of production. The Thai government has started to pay more attention to alternative energy. This is so that the country can find other ways to produce energy that can be used in the country. Thailand has faced waste management problems for a long period of time. Initially, using landfills was a popular method. However, currently, the landfill area is more difficult to find. Disposal by incineration causes problems related to small dust particles. Currently, there is a development of waste disposal technology that can convert waste into energy, such as converting waste into fuel. This includes the reuse of plastic waste packaging as raw materials for production. This method saves space during the disposal of solid waste, reduces the use of new resources, and reduces the amount of waste to be disposed of.
Sustainability trends and resource crises are now focused on around the world. Circular economy principles have been developed and adapted to suit the times by focusing on the cost-effective use of resources and the maximum benefit. The purpose of this idea is to prevent resources from running out quickly and to prevent the generation of waste [3]. The production of waste plastic oil is an implementation of the circular economy principles in accordance with the national agenda. Currently, the BCG (Bio-Circular-Green) economic policy has been used to drive the economy of Thailand more and more [4], and it is applied to the management of plastic waste in a systematic and comprehensive manner. This will allow us to increase the value of waste along with the efficient use of resources. A circular economy will focus on waste management after consumption and will make the most cost-effective use of resources as well as the reuse of materials (reuse, refurbish, and sharing) and recycling (recycle and upcycle). Currently, finding various forms of renewable energy is the focus of research, especially renewable energy that can be obtained locally. Waste plastic oil is a type of renewable energy that has been considered for applications as an alternative fuel with respect to diesel. Plastic waste is processed into pyrolysis oil as a substitute for oil, which will help solve the increasing problem of waste while also reducing the rate of oil imports to create energy security. Plastic waste can be processed into pyrolysis oil because plastic waste contains hydrocarbons as a component, such as oil. The study of plastic pyrolysis can be performed in various conditions to obtain different yields and suitable content [5]. At the moment, there are many ongoing experiments focused on transforming plastic waste into pyrolysis oil.
Biobutanol has better physical and chemical fuel properties, such as calorific value, viscosity, and cetane number, compared to ethanol. Similarly to ethanol, butanol can also be produced by the fermentation of agricultural crops and waste resources such as cassava waste residue and waste food. Butanol can be used as blend components with diesel fuel to improve carbon monoxide (CO) and particulate matter emissions without any engine modifications [6]. Increasing the alcohol substitution ratio resulted in higher cylinder pressure and temperatures and heat release rates, while ignition delays decreased, leading to shorter combustion durations [7]. The combination of ethanol and butanol blended with diesel fuel was studied, and it was found that nitrogen oxides, carbon monoxide, and soot emissions decreased with the influence of higher oxygen content and the lower cetane number and calorific value of ethanol and butanol [8]. However, the blend with higher concentrations of alcohol fuel is limited, with some defective fuel properties such as lubricity, flash points, and the latent heat of vaporization. The addition of ethanol to waste plastic oil was investigated on a four-cylinder and direct injection diesel engine, and a reduction in nitrogen oxides was observed, along with an increase in specific fuel consumption and a decrease in thermal efficiency [9]. To extend the use of alcohol fuels, this research study is interested in studying engine performance, combustion characteristics, and the exhaust emissions of a diesel engine when using different ratios of waste plastic oil blended with n-butanol. In order to find a suitable ratio of n-butanol blends for practical fuels, the experimental results of the engine test were used to develop the prediction model using a multi-objective function via the general regression neural network (GRNN). Moreover, further investigations upon the optimum range of engine loads and the ratio of the n-butanol blend were achieved via the NGGA-II optimization technique when the trade-off between maximum thermal efficiency and minimum nitrogen oxide emissions was considered.

2. Materials and Methods

2.1. Test Fuels Preparation

In this experimental study, n-butanol (analytical grade) was purchased from Sigma Aldrich, while commercial diesel fuels conforming to the regulation of the Department of Energy Business, Ministry of Energy, Thailand (2022), were purchased from public fuel stations. According to the regulation, this diesel fuel contains 7% biodiesel by volume (B7). The waste plastic oil (WPO) used in this study was extracted from mixed plastic waste using a pyrolysis plant at the Center of Excellence in Biomass (COE), Suranaree University of Technology. WPO was blended with n-butanol at 5%, 10%, and 15% by volume. The descriptions of the test fuels used throughout this study are also listed in Table 1.

2.1.1. Gas Chromatography–Mass Spectrometry

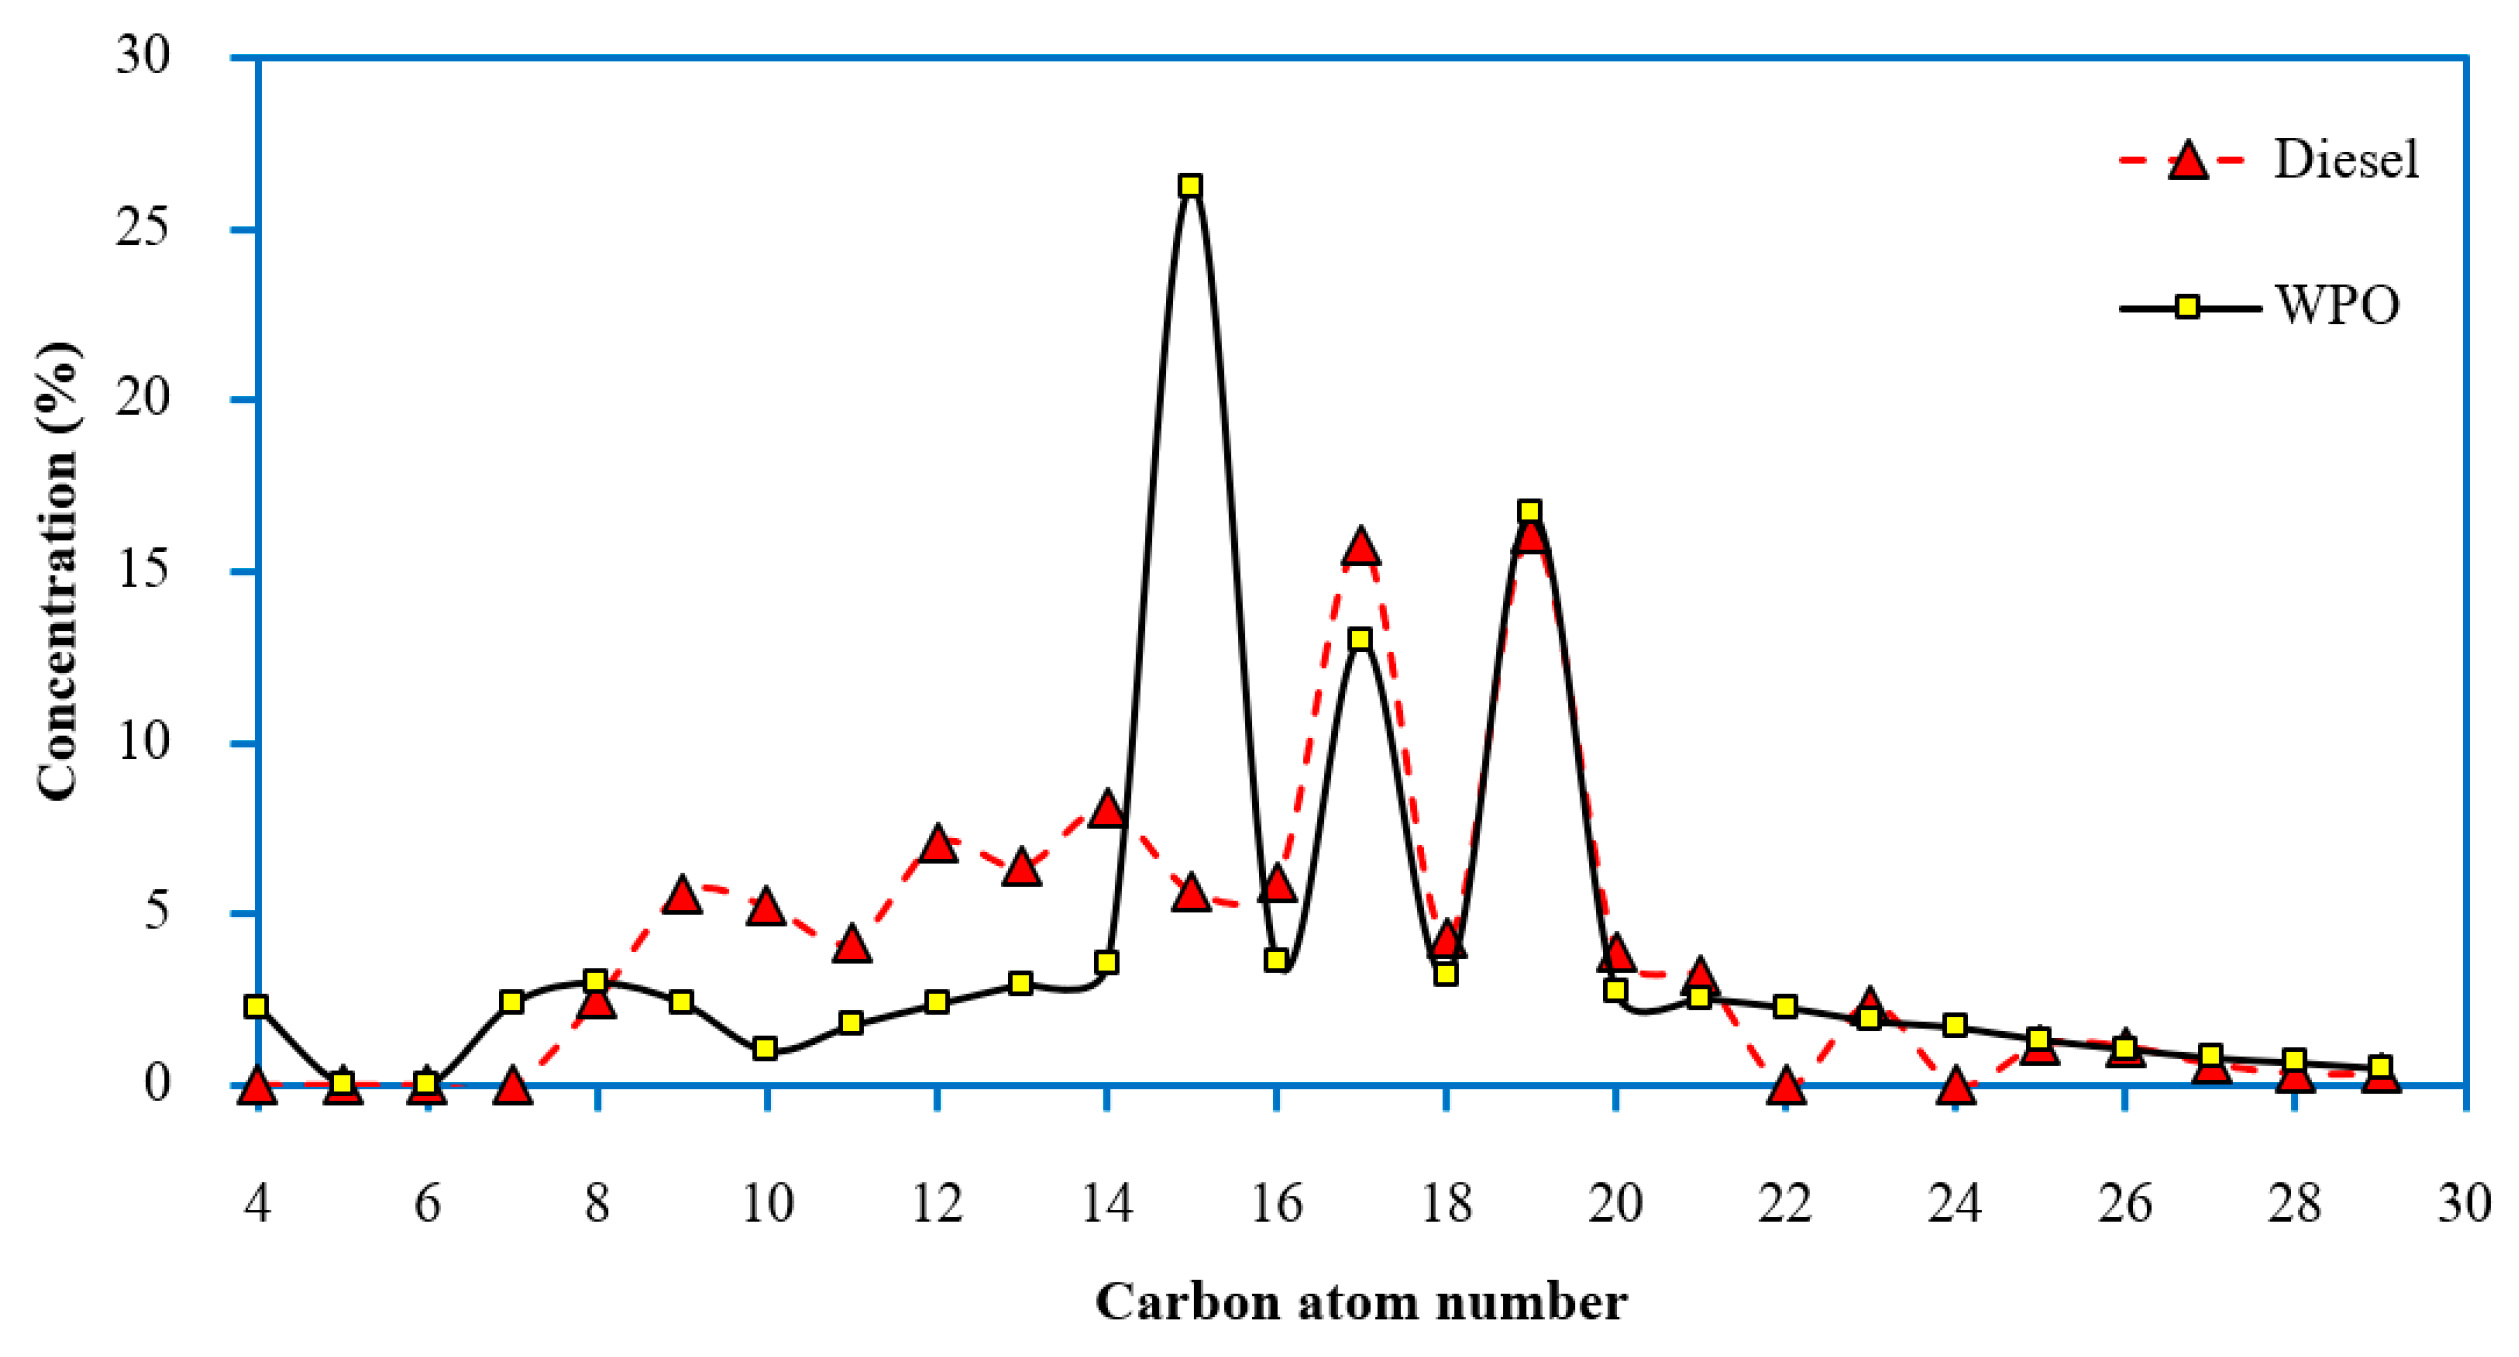
The WPO and diesel fuel were qualitatively analyzed by GC–MS, which identified the majority of the compounds. Figure 1 represents the chromatograms of WPO and diesel fuel, which showed more than 100 peaks. According to the results, the chemical compositions of WPO characterized by the GC–MS are described in Table 2 and Table 3. It was found that WPO is mainly composed of hydrocarbon chains ranging from C4 to C29, and it also commonly has aromatic compounds present. Furthermore, the study found that WPO consists of hydrocarbons in a group of gasoline (C6–C12, 12.85%), diesel (C13–C18, 74.39%), and fuel oil (C19–C23, 12.76%). Carbon number distributions in WPO and diesel fuel are shown in Figure 2.

2.1.2. Fuel Properties Characteristics of Test Fuels

For this study, the physical and chemical properties of waste plastic oil (WPO) and its blends with n-butanol are the kinematic viscosity, density, specific gravity, API gravity, flash point, cetane index, and gross calorific value, which are fuel properties that need to be used in enhancing the engine performance and exhaust emissions of diesel engines. The WPO and fuel blends were analyzed as per the ASTM standards for comparisons made with respect to commercial diesel fuel (B7). The experimental results are shown in Table 4. The kinematic viscosity of fuel is important for the lubrication and protection of the injection equipment from wear and affects the injection characteristics [10]. As a result, it can be seen that the kinematic viscosity of WPO was lower than diesel fuel due to the low molecular weight of WPOs [11]. However, this value was within the limits of the diesel fuel’s specification [12]. On the contrary, the flash point of WPO was found to be lower than diesel fuel. This reason is related to the components present in the WPO due to the low carbon number that leads to a reduction in the flash point and gross calorific value [13]. For fuel blends, it is observed that kinematic viscosity, API gravity, flash point, cetane index, and gross calorific value decreased with n-butanol additions, while waste plastic oil with a higher n-butanol content possesses a higher density and specific gravity. It is noted that the properties such as the density and viscosity of the fuel blended with butanol decrease nonlinearly as the temperature increases [14], so this may affect the quality of fuel atomization, the start of fuel injection, and the ignition delay period. After studying the properties of the fuel, it was found that waste plastic oil and its blends with n-butanol can be used as an alternative fuel in diesel engines. Their effects on engine performance, combustion characteristics, and exhaust emissions were studied and compared to diesel fuel operation.

2.2. Experimental Setup and Test Procedure

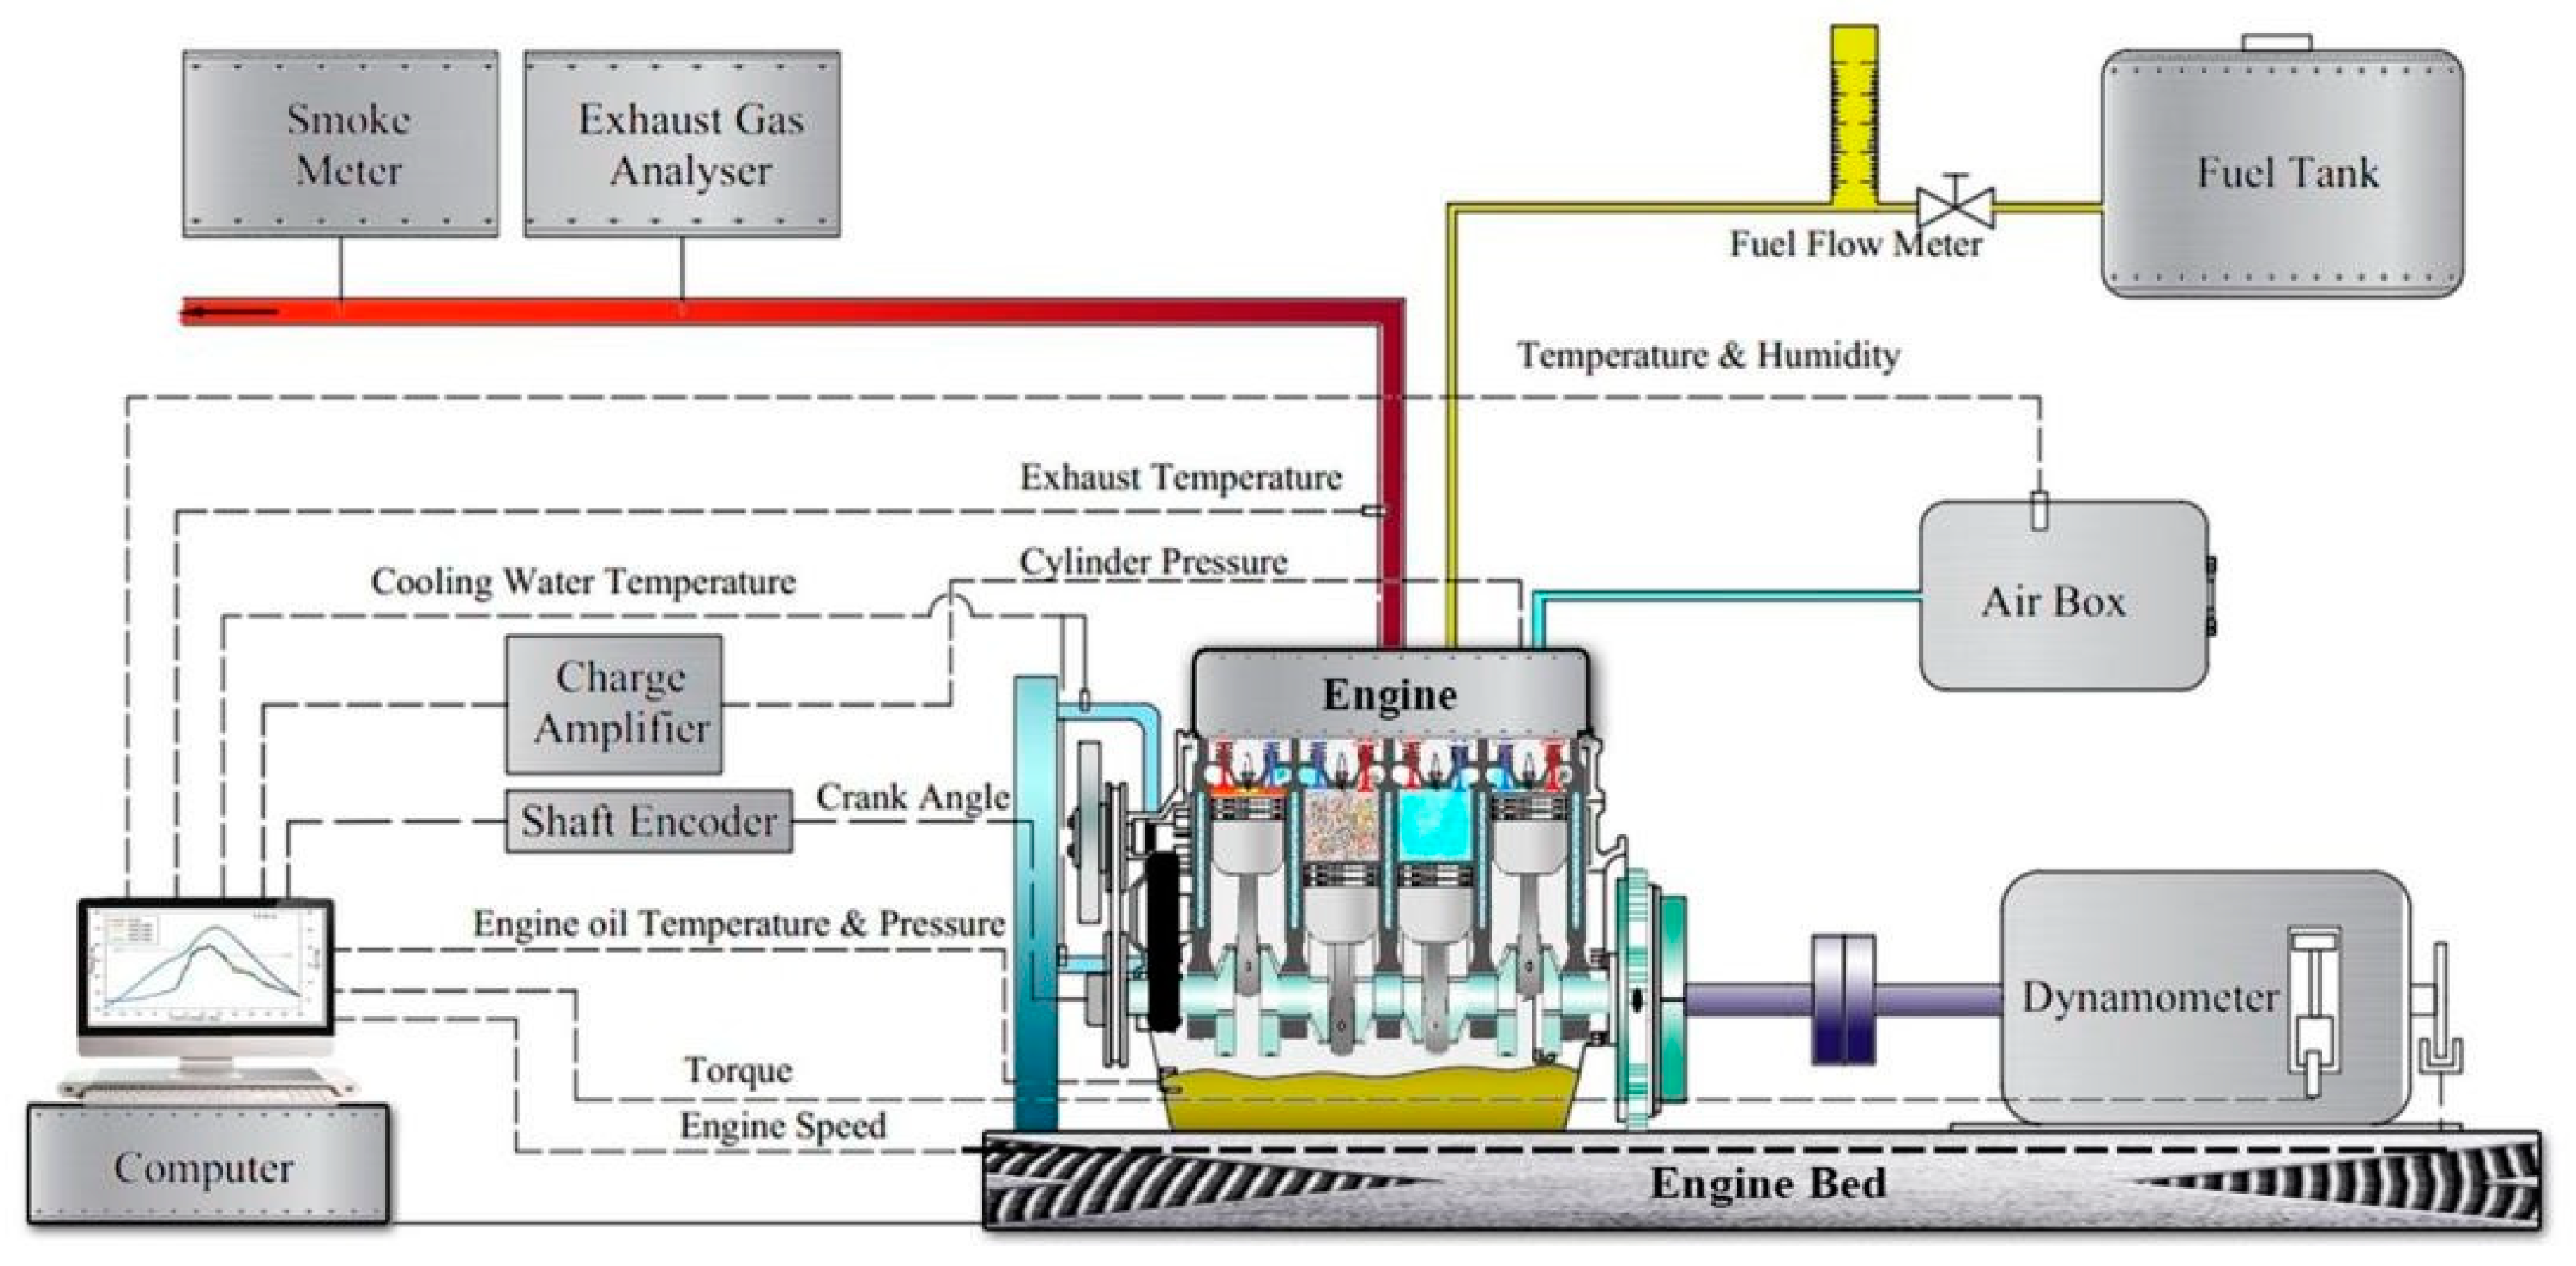
The test engine used for this study is a four-stroke, four-cylinder, water-cooled, direct injection (DI) diesel engine that is naturally aspirated. The technical specifications of the test engine are provided in Table 5. A hydraulic engine dynamometer with a load cell was used to measure the torque and power output of the test engine. The test engine operated at an engine speed of 2500 rpm with five different engine loads (30, 50, 70, 90, and 110 Nm). For the engine run tests, commercial diesel fuel was used as a baseline for comparisons with WPO and fuel blends. An air box was used to measure the air flow rate relative to the engine, and the volumetric fuel flow rate was measured using a burette and stopwatch. The engine crank’s angle position was measured by a Kistler crank angle encoder, type 2614CK1, which has a 0.1 crank angle degree resolution. A Kistler 6052C piezoelectric pressure transducer coupled with a Kistler 5064C charge amplifier was used to record the in-cylinder pressure. The in-cylinder pressure data were averaged for 100 cycles at each crank angle. A Testo 350 flue gas analyzer was used to measure exhaust gas emissions (NOx, CO, CO2, and HC). The technical specification of the gas analyzing device is represented in [15]. In each condition, readings were taken after the engine reached a steady state by the observation of engine load and engine speed. For every refueling operation, the engine ran for 10 min in order to consume the fuel entangled in the fuel lines. The repeatability of readings was guaranteed by duplicating the investigations thrice. The schematic diagram of the test engine setup is shown in Figure 3.

2.3. Multi-Objective Optimization for the Ratio of n-Butanol and Waste Plastic Oil Blends

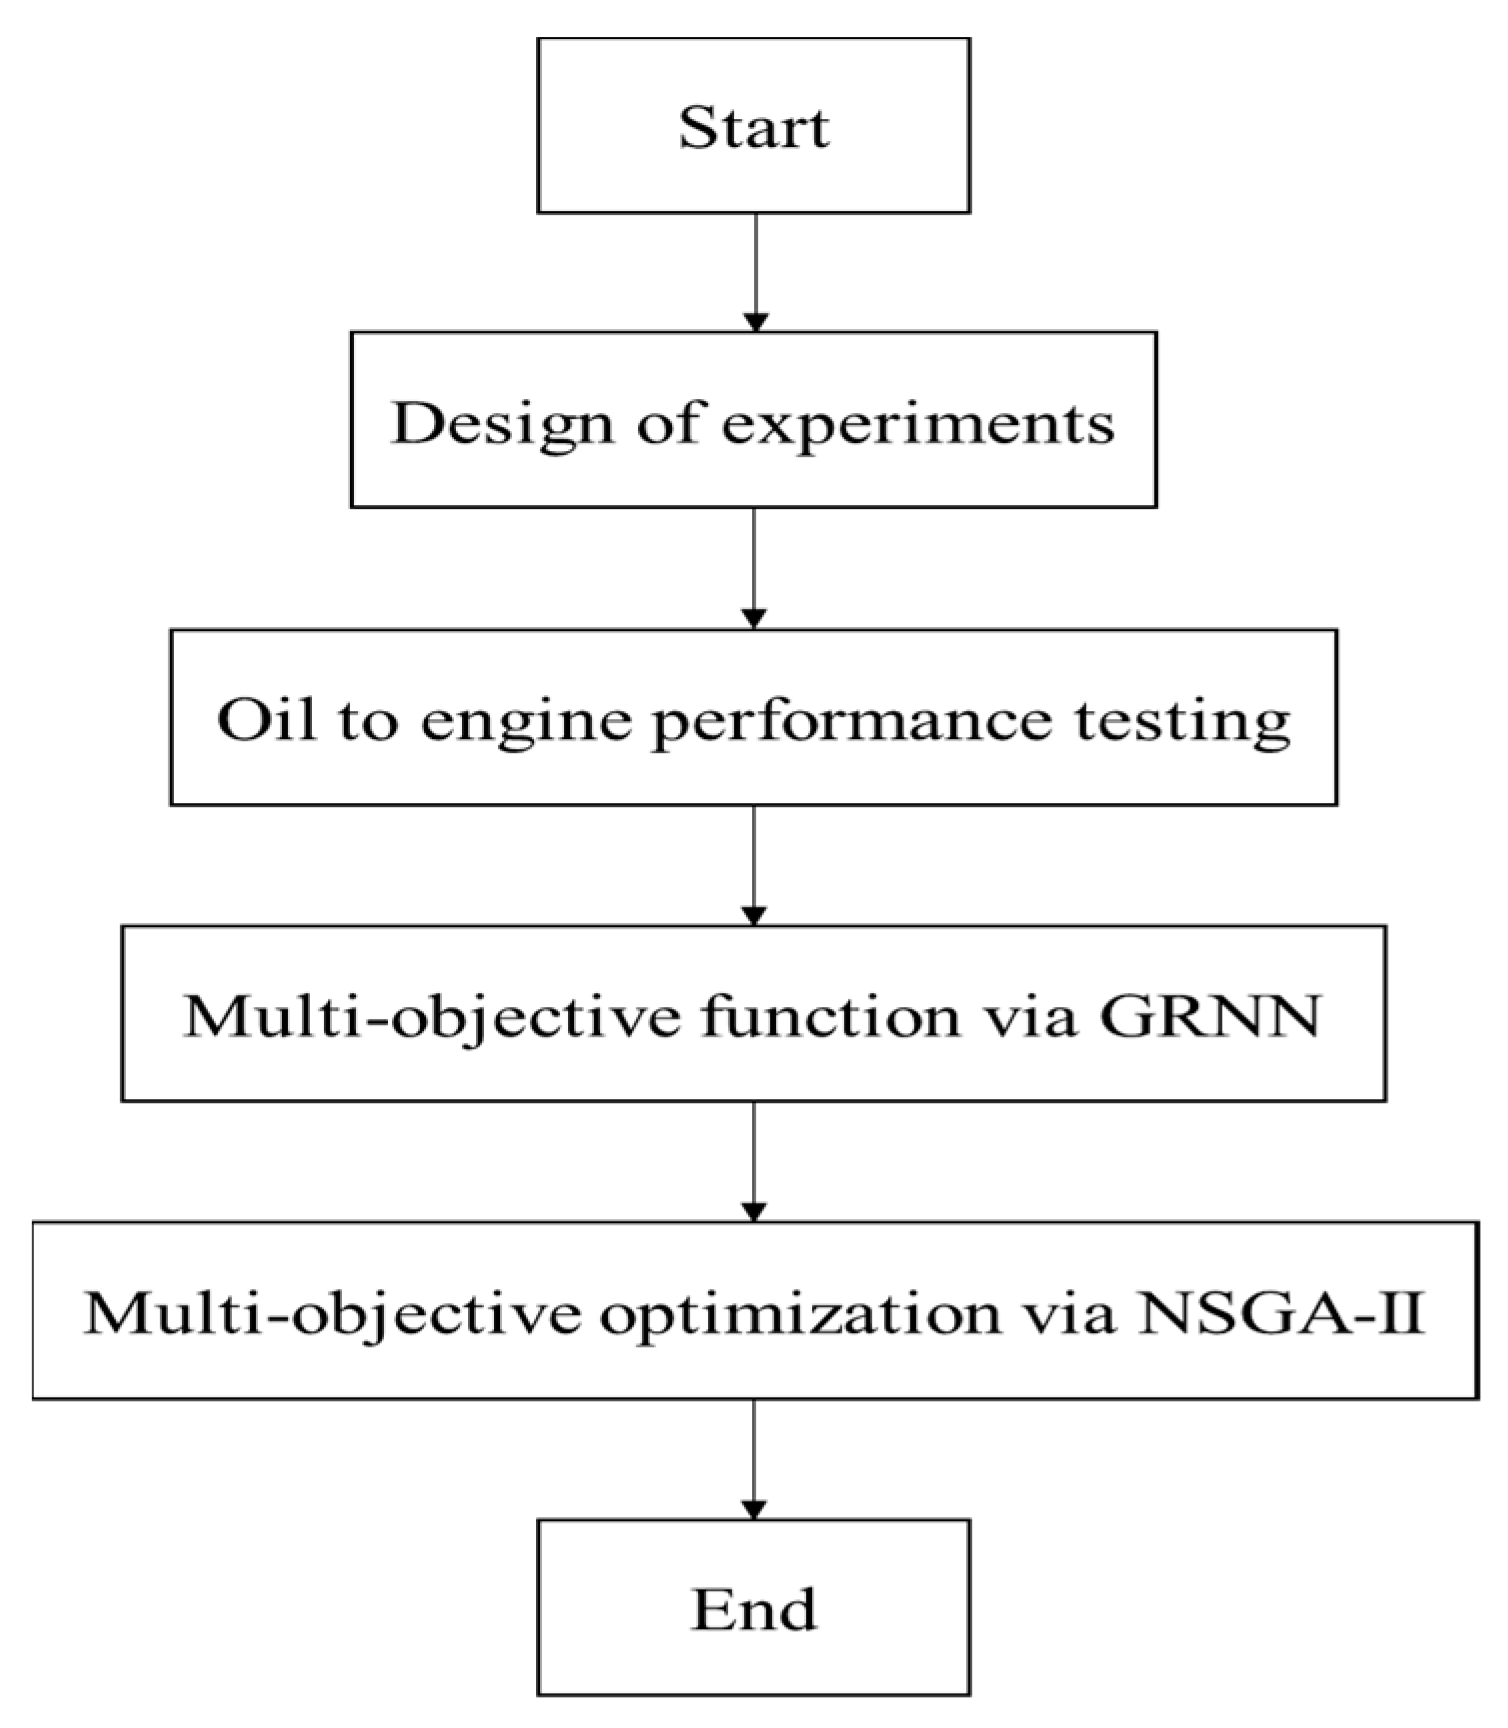
The engine loads and n-butanol blending ratios that resulted in the trade-off between the highest engine performance and lowest emission were identified via optimization techniques as an alternative to applications where the blended oil may be used in different engine loads or n-butanol blending ratios than those tested in this study. The nondominated sorting genetic algorithm II (NSGA-II), a multi-objective optimization technique, was chosen based on the number of objectives that needed to be optimized. The implementation of multi-objective optimization via NSGA-II can be expressed in Figure 4. This section only discusses the multi-objective function and their optimization using NSGA-II in accordance with the engine performance and emissions testing method mentioned in the section above.

2.3.1. Multi-Objective Function via a General Regression Neural Network (GRNN)

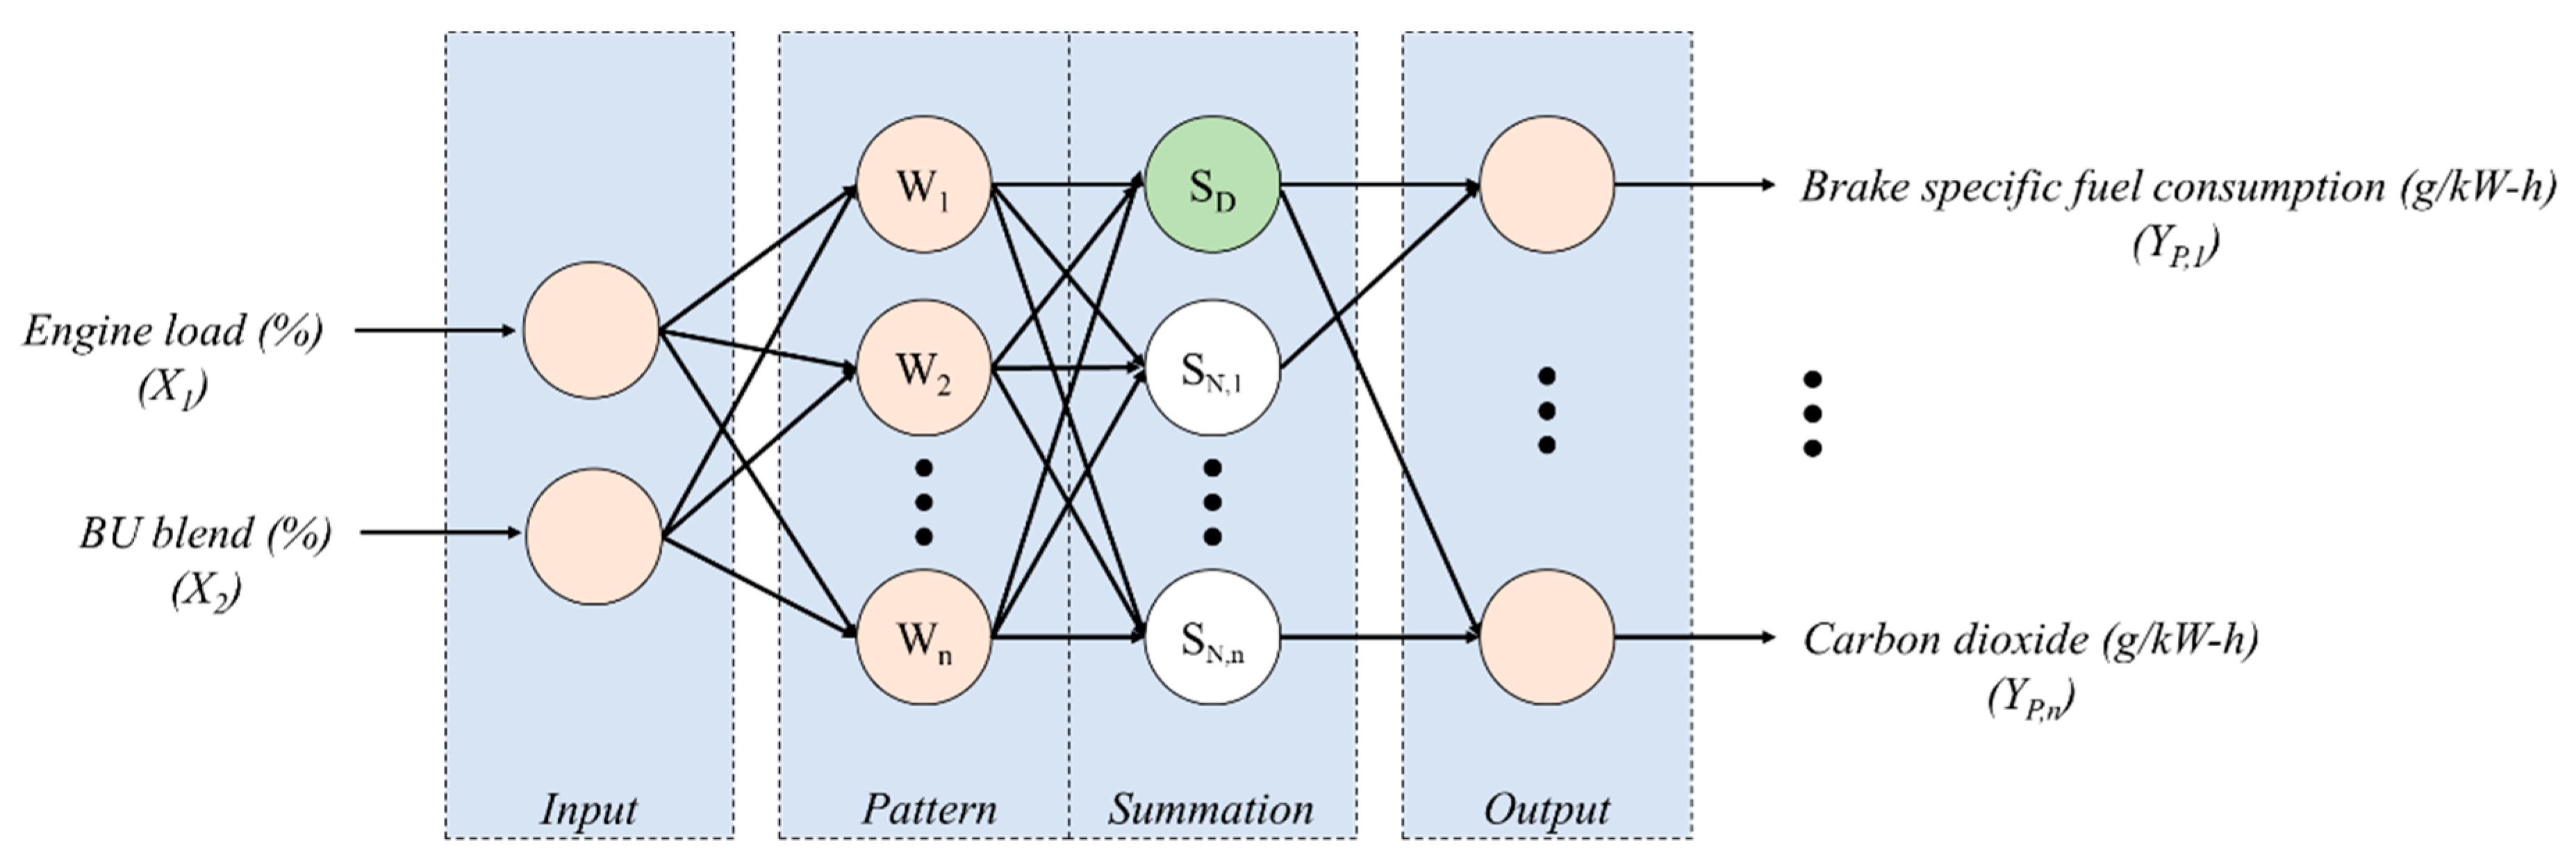
Obtaining an equation that depicts the relationship between input factors and output factors according to a problem’s behavior is necessary for the optimized conditions of any problem. The general regression neural network (GRNN), one of the supervised learning artificial intelligence systems with successful bio-oil prediction engine performance [16], was used in this study to obtain the equation that depicts the relationship between input factors and output factors, which is also known as the multi-objective function. The GRNN model is one of the radial basis function networks with strong regularized and prediction capabilities, and its models are capable of accurately predicting both linear and nonlinear issues. According to the characteristics of supervised learning, the model needs training data to develop its capacity to react to problematic behavior. The experiment data of oil-to-engine performance were used to train and test the GRNN model with a specific focus on the percentage of the blend of n-butanol and waste plastic oil. The engine load (%) and the percentage of the blend of n-butanol relative to waste plastic oil (abbreviation as BU blend (%)) were employed in the model’s input factors (X1 and X2), while the oil-to-engine performance and oil-to-engine emissions, namely the brake-specific fuel consumption (g/kW-h), brake thermal efficiency (%), nitrogen oxides (g/kW-h), total hydrocarbon (g/kW-h), carbon monoxide (g/kW-h), and carbon dioxide (g/kW-h), were employed in the model’s target or prediction output (Y1, Y2, …, Y6). In accordance with the oil-to-engine experiments, the modeling procedure, which was split into training and test data sets at a ratio of 70:30 via the holdout cross-validation technique, used the 20 data averages from each condition of the experiment. The GRNN model comprised four units: the input layer units, pattern layer units, summation layer units, and output layer units. The model was learned by transferring the training data set through the layers of the model using the feedforward learning technique, as shown in Figure 5. The feedforward learning technique, which is the learning characteristic of the GRNN model, can be described from each layer by starting with the input data entering the first layer and ending with the prediction results generated in the final layer [17].
Input layer units: Both the input and output of the training data set entered the model’s learning process in this layer. The number of neurons in this layer of the GRNN model cannot be changed; instead, it is determined by the dimensions of the input factors.
Pattern layer units: The input and output of the training data set were transferred through the units of the input layer into this layer, where the input data were transferred by one of the radial basis functions, the Gaussian kernel function, which measured the Euclidean distance between each input vector. The function transferred by the Gaussian kernel function can be expressed, as described in Equation (1). The number of neurons is determined by the amount of data used in the training set after input factors were transferred:
W i = exp ( ( X X i ) T ( X X i ) 2 S M 2 )
where W i is the transformed input data ( X i ), which can be called the “weight of the GRNN model”, and X is the input vector, which can be written as X = [ x 1 , x 2 , x 3 , , x n ] T , while n is the number of neurons at the input layer. S M is the smoothing parameter used to adjust the Gaussian kernel function.
Summation layer units: The learning procedure was carried out in this layer in two stages. In the first stage, the learning process was performed on the summation of the weight of the GRNN or W i obtained from the pattern layer units. The neuron that performed learning in the first stage is called the denominator neuron (SD), which can be expressed as Equation (2). In the second stage, the learning process was performed on the summation of the output factor that corresponded to the input data ( X i ) at the pattern layer units multiplied by the weight of the GRNN or W i . The neuron that performed learning in the first stage is called the numerator neuron (SN), which can be expressed as Equation (3). There will only be one SD neuron in the GRNN model, despite the fact that many SN neurons are dependent on the vector of the output factor of problems:
S D = i = 1 n W i
S N = i = 1 n W i Y i
where Y i is the output data corresponding to the input data ( X i ).
Output layer units: The learning outcomes of the SD and SN neurons were transferred into this layer after the completion of the two learning stages of the summation layer units. According to Equation (4), the relationship between SD and SN neurons can be used to express how the learning outcomes were translated into predictions that were made on the same scale as the actual results of the problem:
Y P , i ( X i ) = S N S D
where Y P , i is the prediction data corresponding to input data ( X i ).
The smoothing parameter, also known as a hyperparameter, controls the Gaussian kernel function performed in the pattern layer units of the GRNN model, which affects the model’s predictive performance. In this study, the smoothing parameters are optimized by the gradient descent optimization algorithm [18] during the modeling process to obtain the best performance of the GRNN model. The commonly used regression performance metrics, such as the coefficient of determination (R2), mean absolute percentage error (MAPE), and root mean square error (RMSE), were used to assess the effectiveness of the model, which can be calculated following Equations (5)–(7):
R 2 = 1 i = 1 n ( Y i Y P , i ) 2 i = 1 n ( Y i Y ¯ ) 2
M A P E = i = 1 n | Y i Y P , i Y i | n × 100
R M S E = i = 1 n ( Y P , i Y i ) 2 n
where Y ¯ is the mean of the actual output.

2.3.2. Multi-Objective Optimization via Nondominated Sorting Genetic Algorithm II (NSGA-II)

For multi-objective optimizations, the nondominated sorting genetic algorithm II (NSGA II) is used. By placing each member of a population in the order of their values for an objective function, NSGA II follows the theory of natural evolution. High fitness scores increase the likelihood that an individual will be chosen and reserved during the evolution process. Consequently, by gradually evolving, the Pareto optimal solution can be attained. According to the NSGA-II optimized, the results were not a single optimal solution that is similar to other optimization techniques but rather a collection of nondominant solutions. In this study, both the GRNN model and NSGA-II were performed in MATLAB programming, and the performed NSGA-II can be expressed as follows [19].
First: The parameters are set according to NSGA-II, and this study focuses on the multi-optimization of engine loads (%) and BU blends (%), which influence engine performances and emissions. Among the variety of output factors, brake thermal efficiency (%) and nitrogen oxides (g/kW-h) were selected as the objectives, and the optimized conditions are set according to Equations (8) and (9).
M a x i m u m B r a k e   t h e r m a l   e f f i c i e n c y i M i n i m u m N i t r o g e n   o x i d e s i } = F G R N N ( E n g i n e   l o a d i B U   B l e n d i )
30 E n g i n e   l o a d 110 0 B U   b l e n d 15
Second: The genetic algorithm’s initial population and generation are set. In this study, both the population and generation are set at 100.
Third: The results of the GRNN model (multi-objective function) from all populations are calculated.
Fourth: The new parent population using crowd testing and nondominated sorting is established, and the new offspring population is created using crossovers and mutations.
Fifth: The third step and fourth steps are repeated until the maximum generation is reached.

3. Results

3.1. Analysis of Variance of Results

A designed experiment is extremely helpful for discovering factors that influence an engine’s performance. An analysis of variance is used to investigate the controllable input factors: the fuel types, the engine’s load, and the operating conditions, which result in engine performance factors such as brake-specific fuel consumption (g/kW-h), brake thermal efficiency (%), nitrogen oxides (g/kW-h), total hydrocarbon (g/kW-h), carbon monoxide (g/kW-h), and carbon dioxide (g/kW-h). Table 6 and Figure 6 show the experimental results of brake-specific fuel consumption (g/kW-h) as an instance. The results provided main factors (the fuel types and the engine load) that are significant at a p-value of 0.000, and the increase in engine loads results in a decrease in brake-specific fuel consumption (g/kW-h). In addition, the interaction between the fuel types and the engine’s load is significant at a p-value of 0.000.
Prior to discussing the effects of different types of fuel on engine performance, gauge repeatability (GR&R), which defines repeatability as reflecting the basic inherent precision of the gauge, was carried out and reported to prove that the behavior of the engine’s performance results was not caused by uncertainty or non-standard measurement procedures. The Minitab statistical program was employed to ensure the effectiveness of the measurement system used in this study. The comparison of gauge repeatability (GR&R) and the total variance in engine performance and emission factors caused by the engine experiments using different test fuels are provided in Table 7. The test results demonstrate that the variation in the gauge is not significant, and the results showed 2.56% of the total variance. The measurement performance can be accepted in accordance with the AIAG reference measurement system acceptance criteria [20].

3.2. Engine Performance

The engine performance characteristics of the test engine in terms of brake-specific fuel consumption and brake thermal efficiency for waste plastic oil and its blends with n-butanol were evaluated and compared with diesel fuel operations.
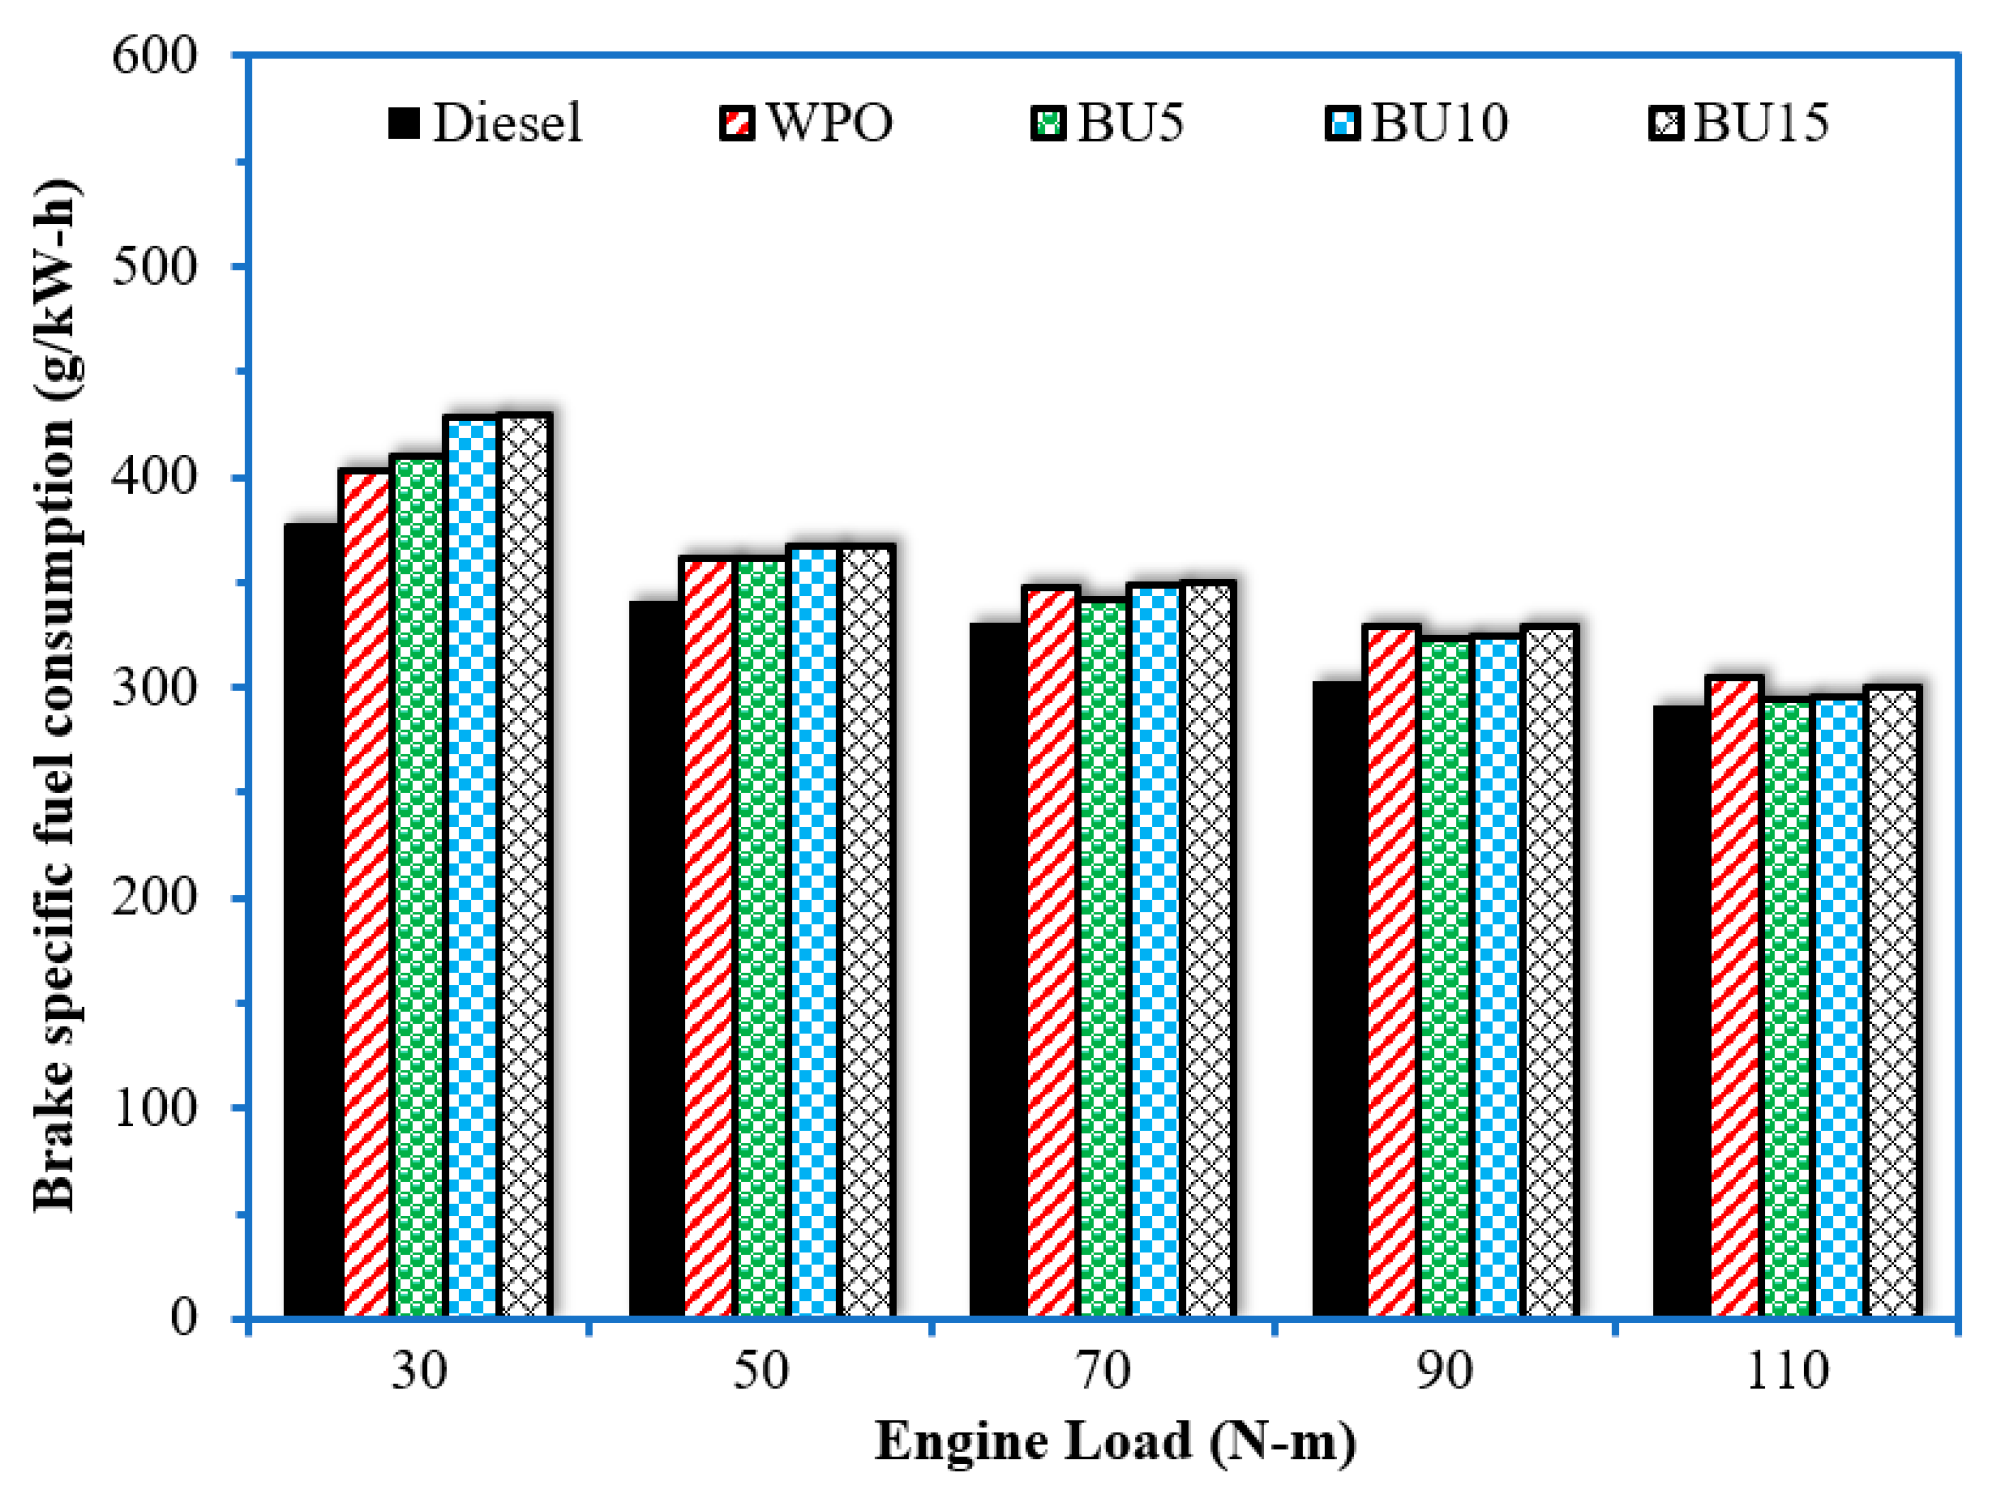
The variations in brake-specific fuel consumption (BSFC) with respect to engine loads for all test fuels are illustrated in Figure 7. In the experimental result, it can be observed that the BSFC decreases as the engine load increases for all test fuels. The WPO and fuel blends present higher BSFC than diesel fuel due to the lower energy content of WPO and n-butanol when compared to diesel fuel, which causes higher fuel consumption when producing the same power output [21]. Increased n-butanol concentrations in the fuel blend result in higher fuel consumption. However, such an increase in fuel consumption caused by the lower calorific value of n-butanol tends to be alleviated when the engine operates at high loads.
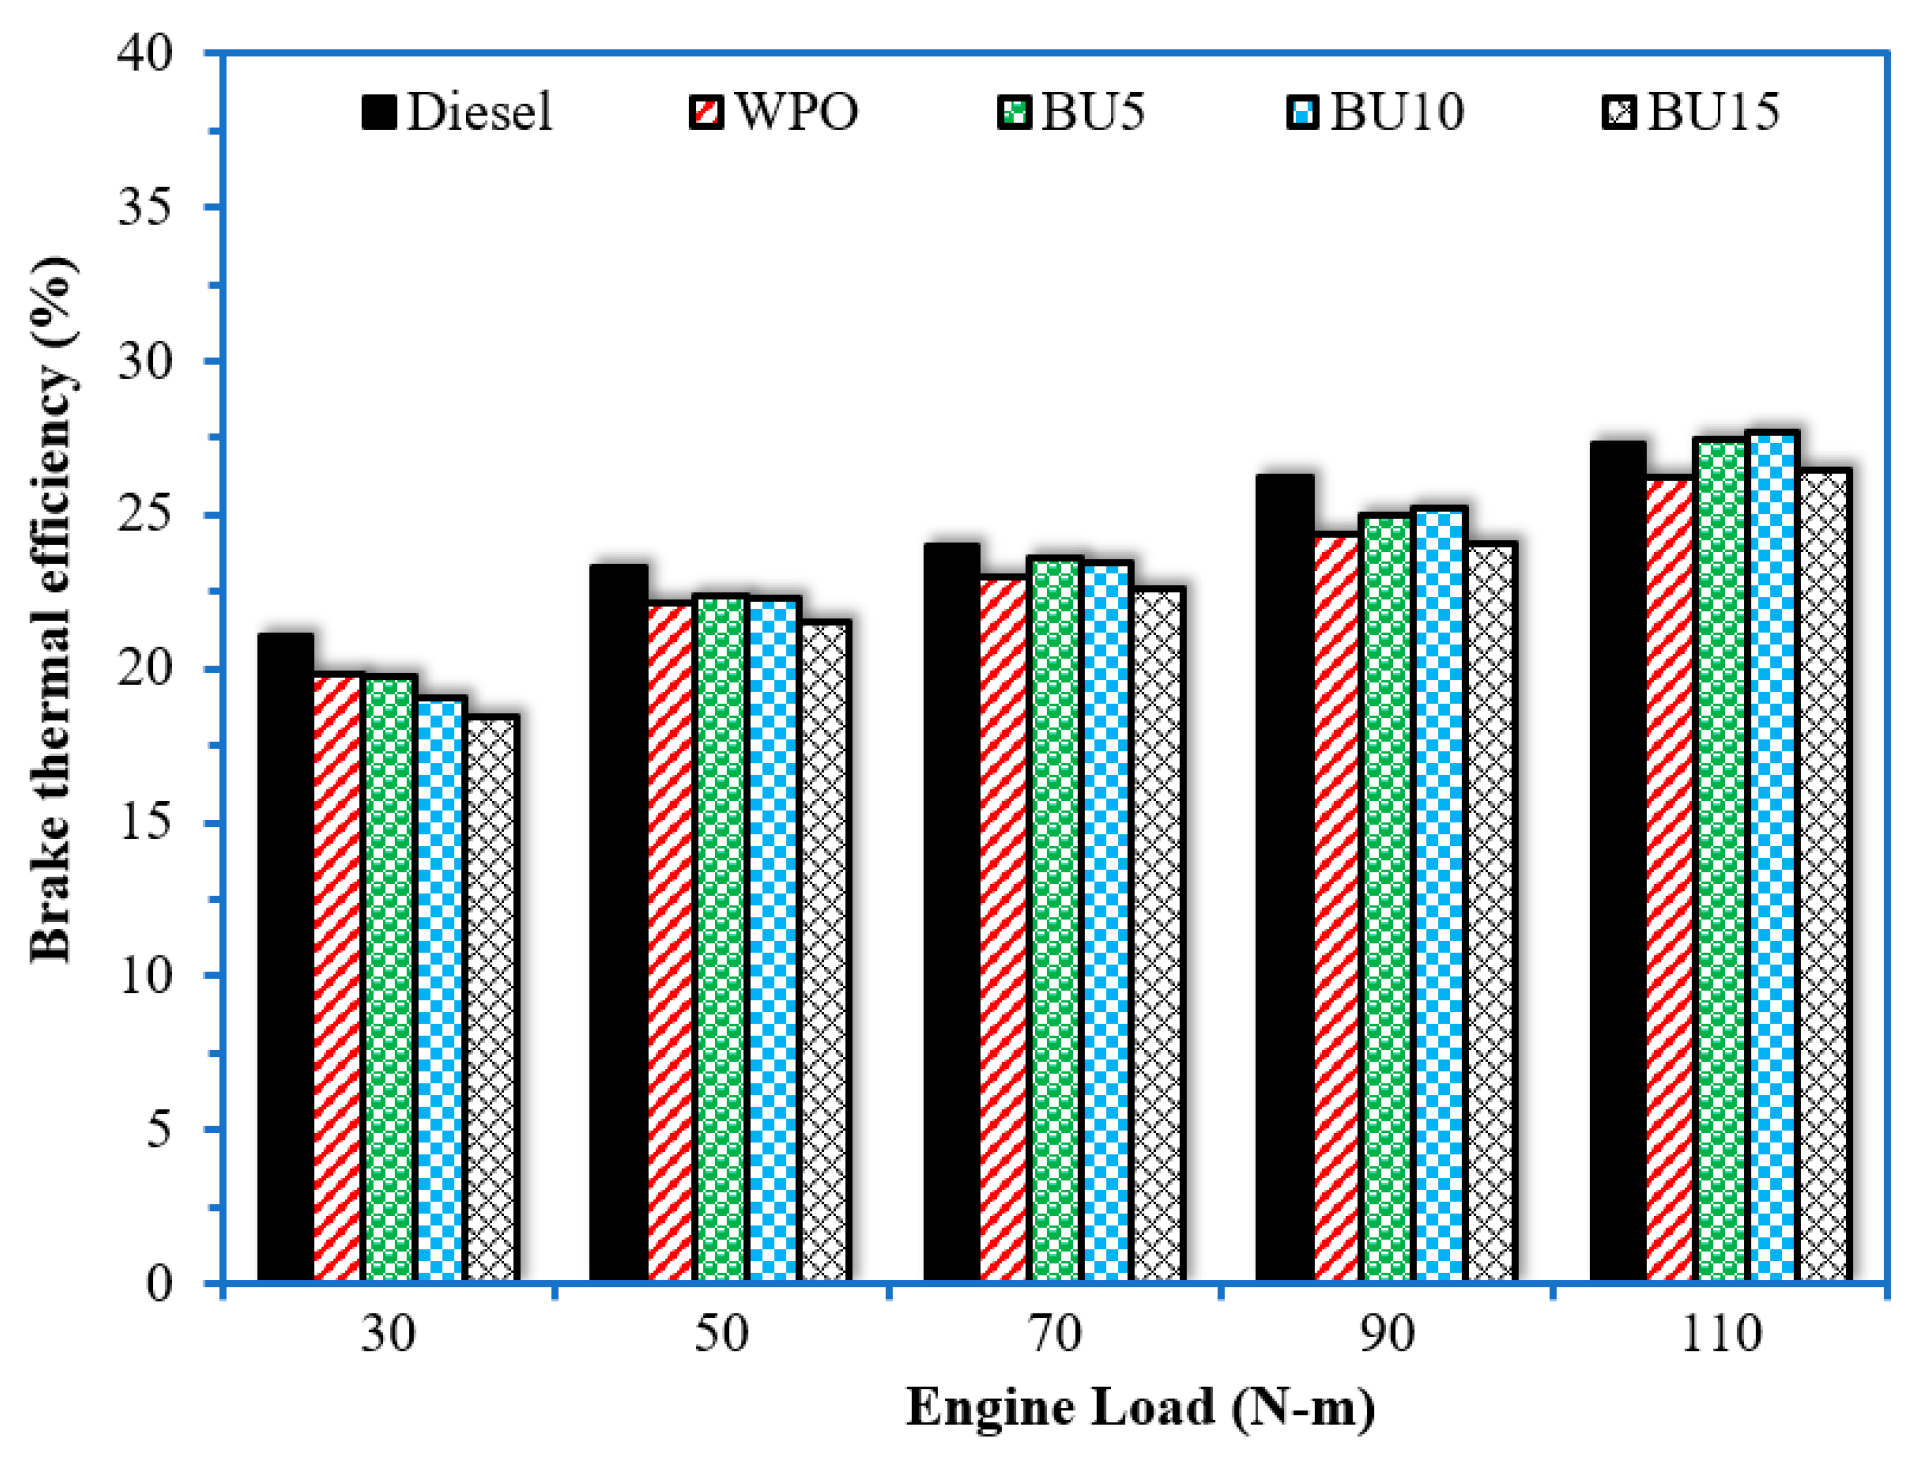
The variation in brake thermal efficiency (BTE) with respect to engine loads for all test fuels is illustrated in Figure 8. It can be observed that the BTE increases as the engine load increases for all test fuels. This is due to the increase in temperature and pressure within the combustion chamber as the increase in engine load results in higher conversions and lower heat loss, which can be attributed to an improvement in combustion [22]. When comparing diesel fuels and WPO, the WPO has a significantly lower BTE compared to diesel fuels for all engine loads. The addition of n-butanol to WPO decreases thermal efficiencies at low-load conditions (e.g., 30 N.m). The high vaporization heat and low cetane amounts in n-butanol, which tend to deteriorate combustion efficiency, can be used to justify such reductions in thermal efficiency. However, the opposite trend was obtained when the engine operated at middle to high loads, and the in-cylinder temperature was high enough to compensate for the effects of high vaporization heat and low cetane numbers in n-butanol. In addition, the presence of oxygen in the composition of the n-butanol promotes a complete combustion process, leading to an improvement in thermal efficiency [23]. It was noted that thermal efficiencies decreased with the effect of high vaporization heat and the low cetane number of n-butanol when the high concentration (e.g., 15%) was added to WPO, although the engine operated at the highest load condition.

3.3. Combustion Characteristics

In this section, we investigated how the test fuels burned in terms of the pressure in the cylinder, the maximum pressure, the rate of heat release, the maximum rate of heat release, and the coefficient of variance for the maximum pressure.
The in-cylinder pressure (ICP) is the most important parameter for engine behavior because it contains useful information related to the combustion process taking place in the combustion chamber [24]. The cylinder pressure of the engine can be measured by a pressure transducer mounted on the cylinder’s head. In this study, the comparison of the in-cylinder pressure profiles for test fuels at full engine loads is shown in Figure 9. It can be observed that the WPO and fuel blends have similar in-cylinder pressure profiles when compared to those of diesel fuel.
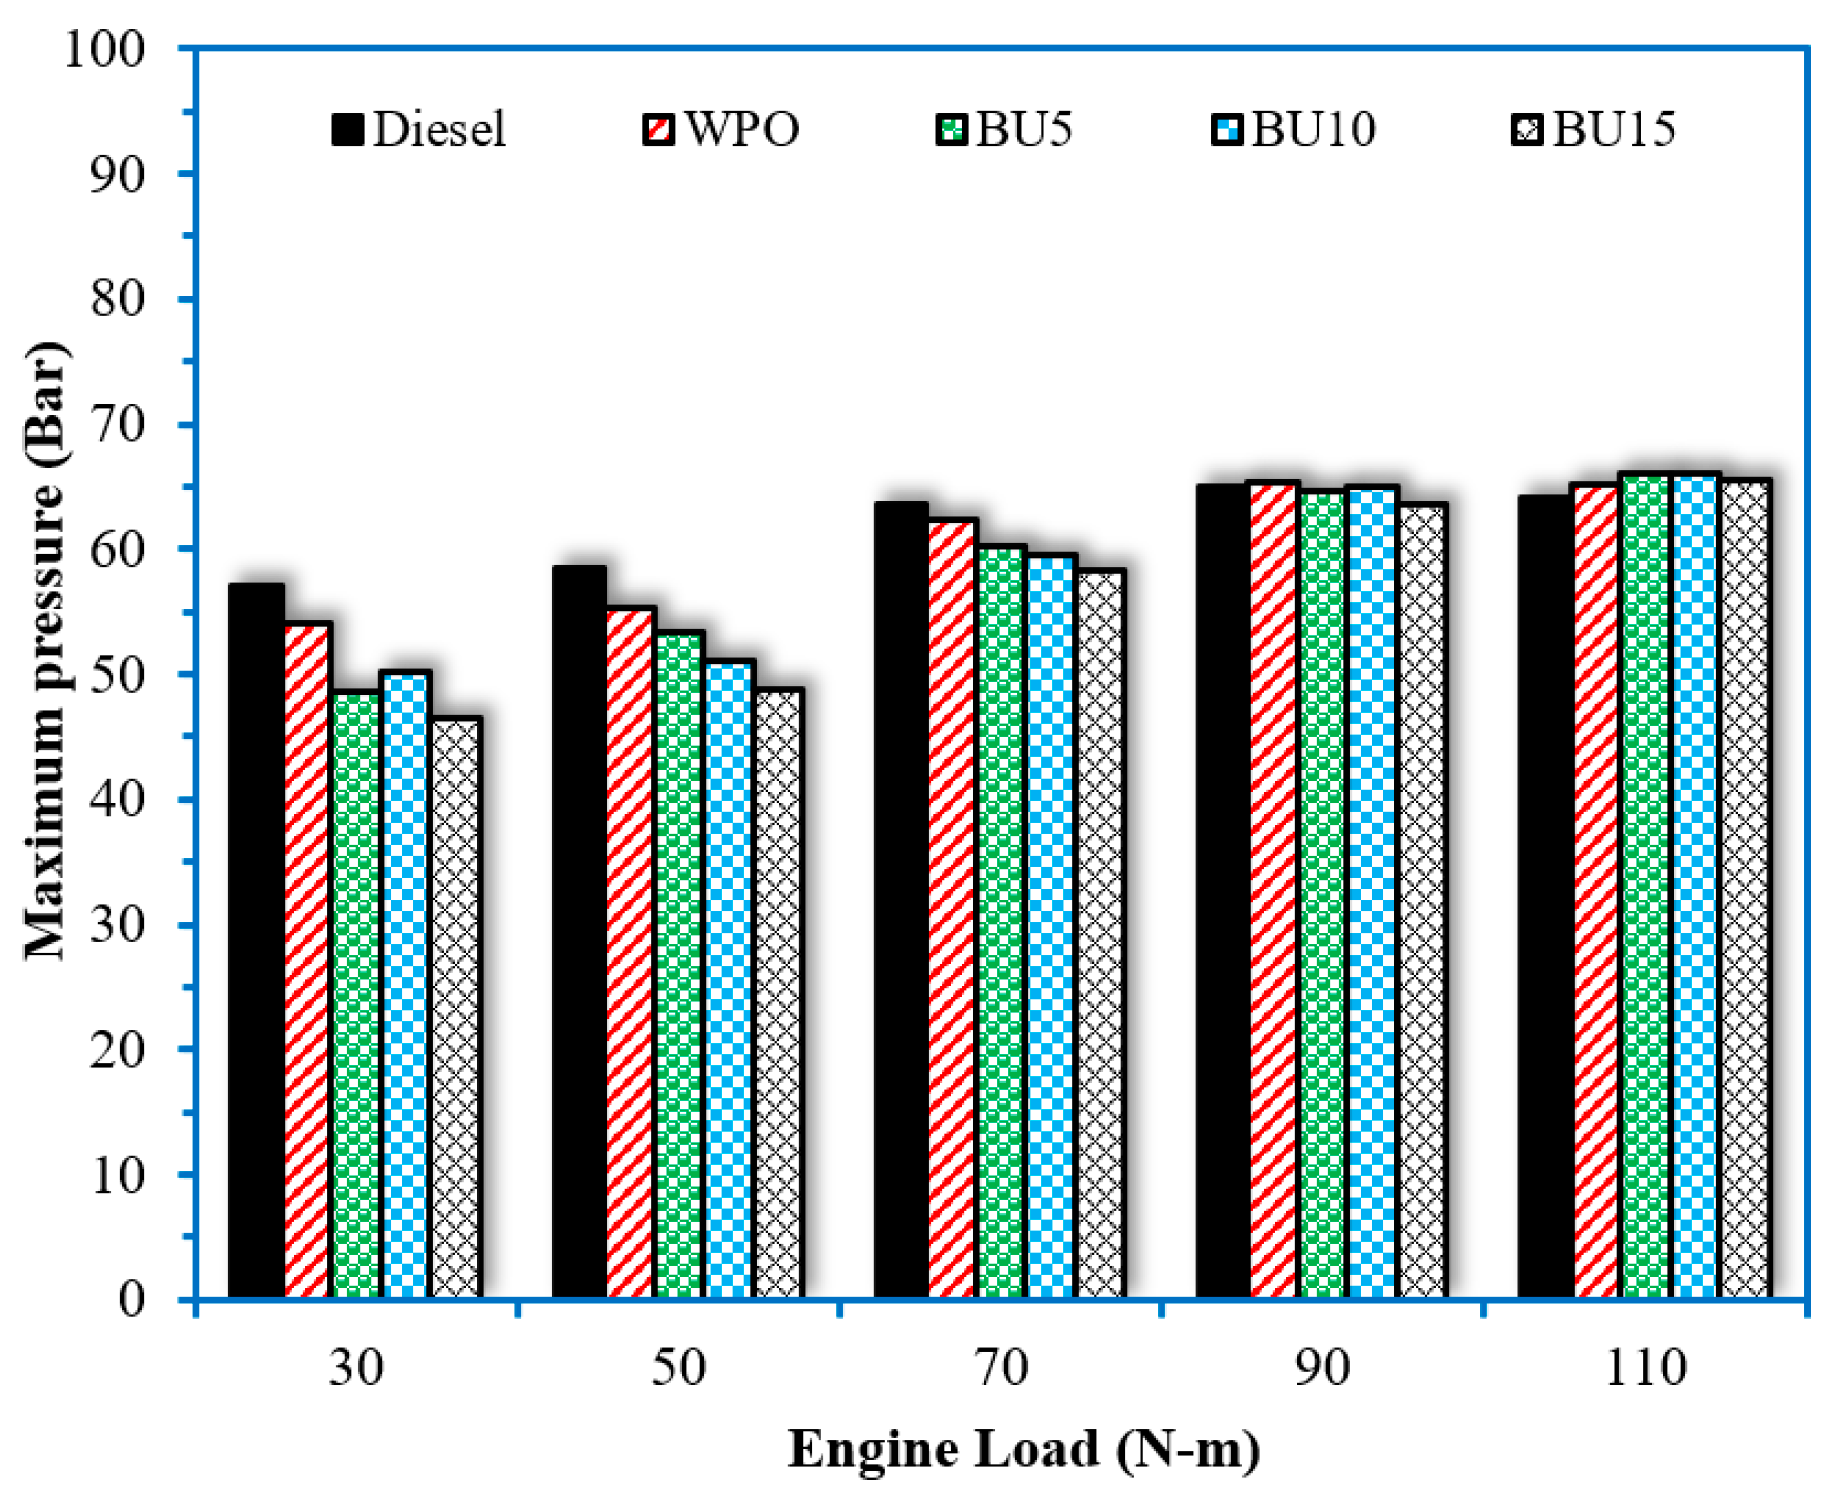
Moreover, the variation in the maximum cylinder pressure with engine load for test fuels at different engine loads is shown in Figure 10. The peak pressure depends on the combustion rate at the initial stages, which is influenced by the amount of fuel taking part in the uncontrolled combustion phase that is governed by the delay period. The results of this experiment show that the increases in n-butanol in diesel fuel resulted in decreased maximum pressure for low and middle engine loads. When the engine operates with high engine loads, the maximum pressure of the fuel blends does not noticeably change and is almost the same as that of diesel fuels.
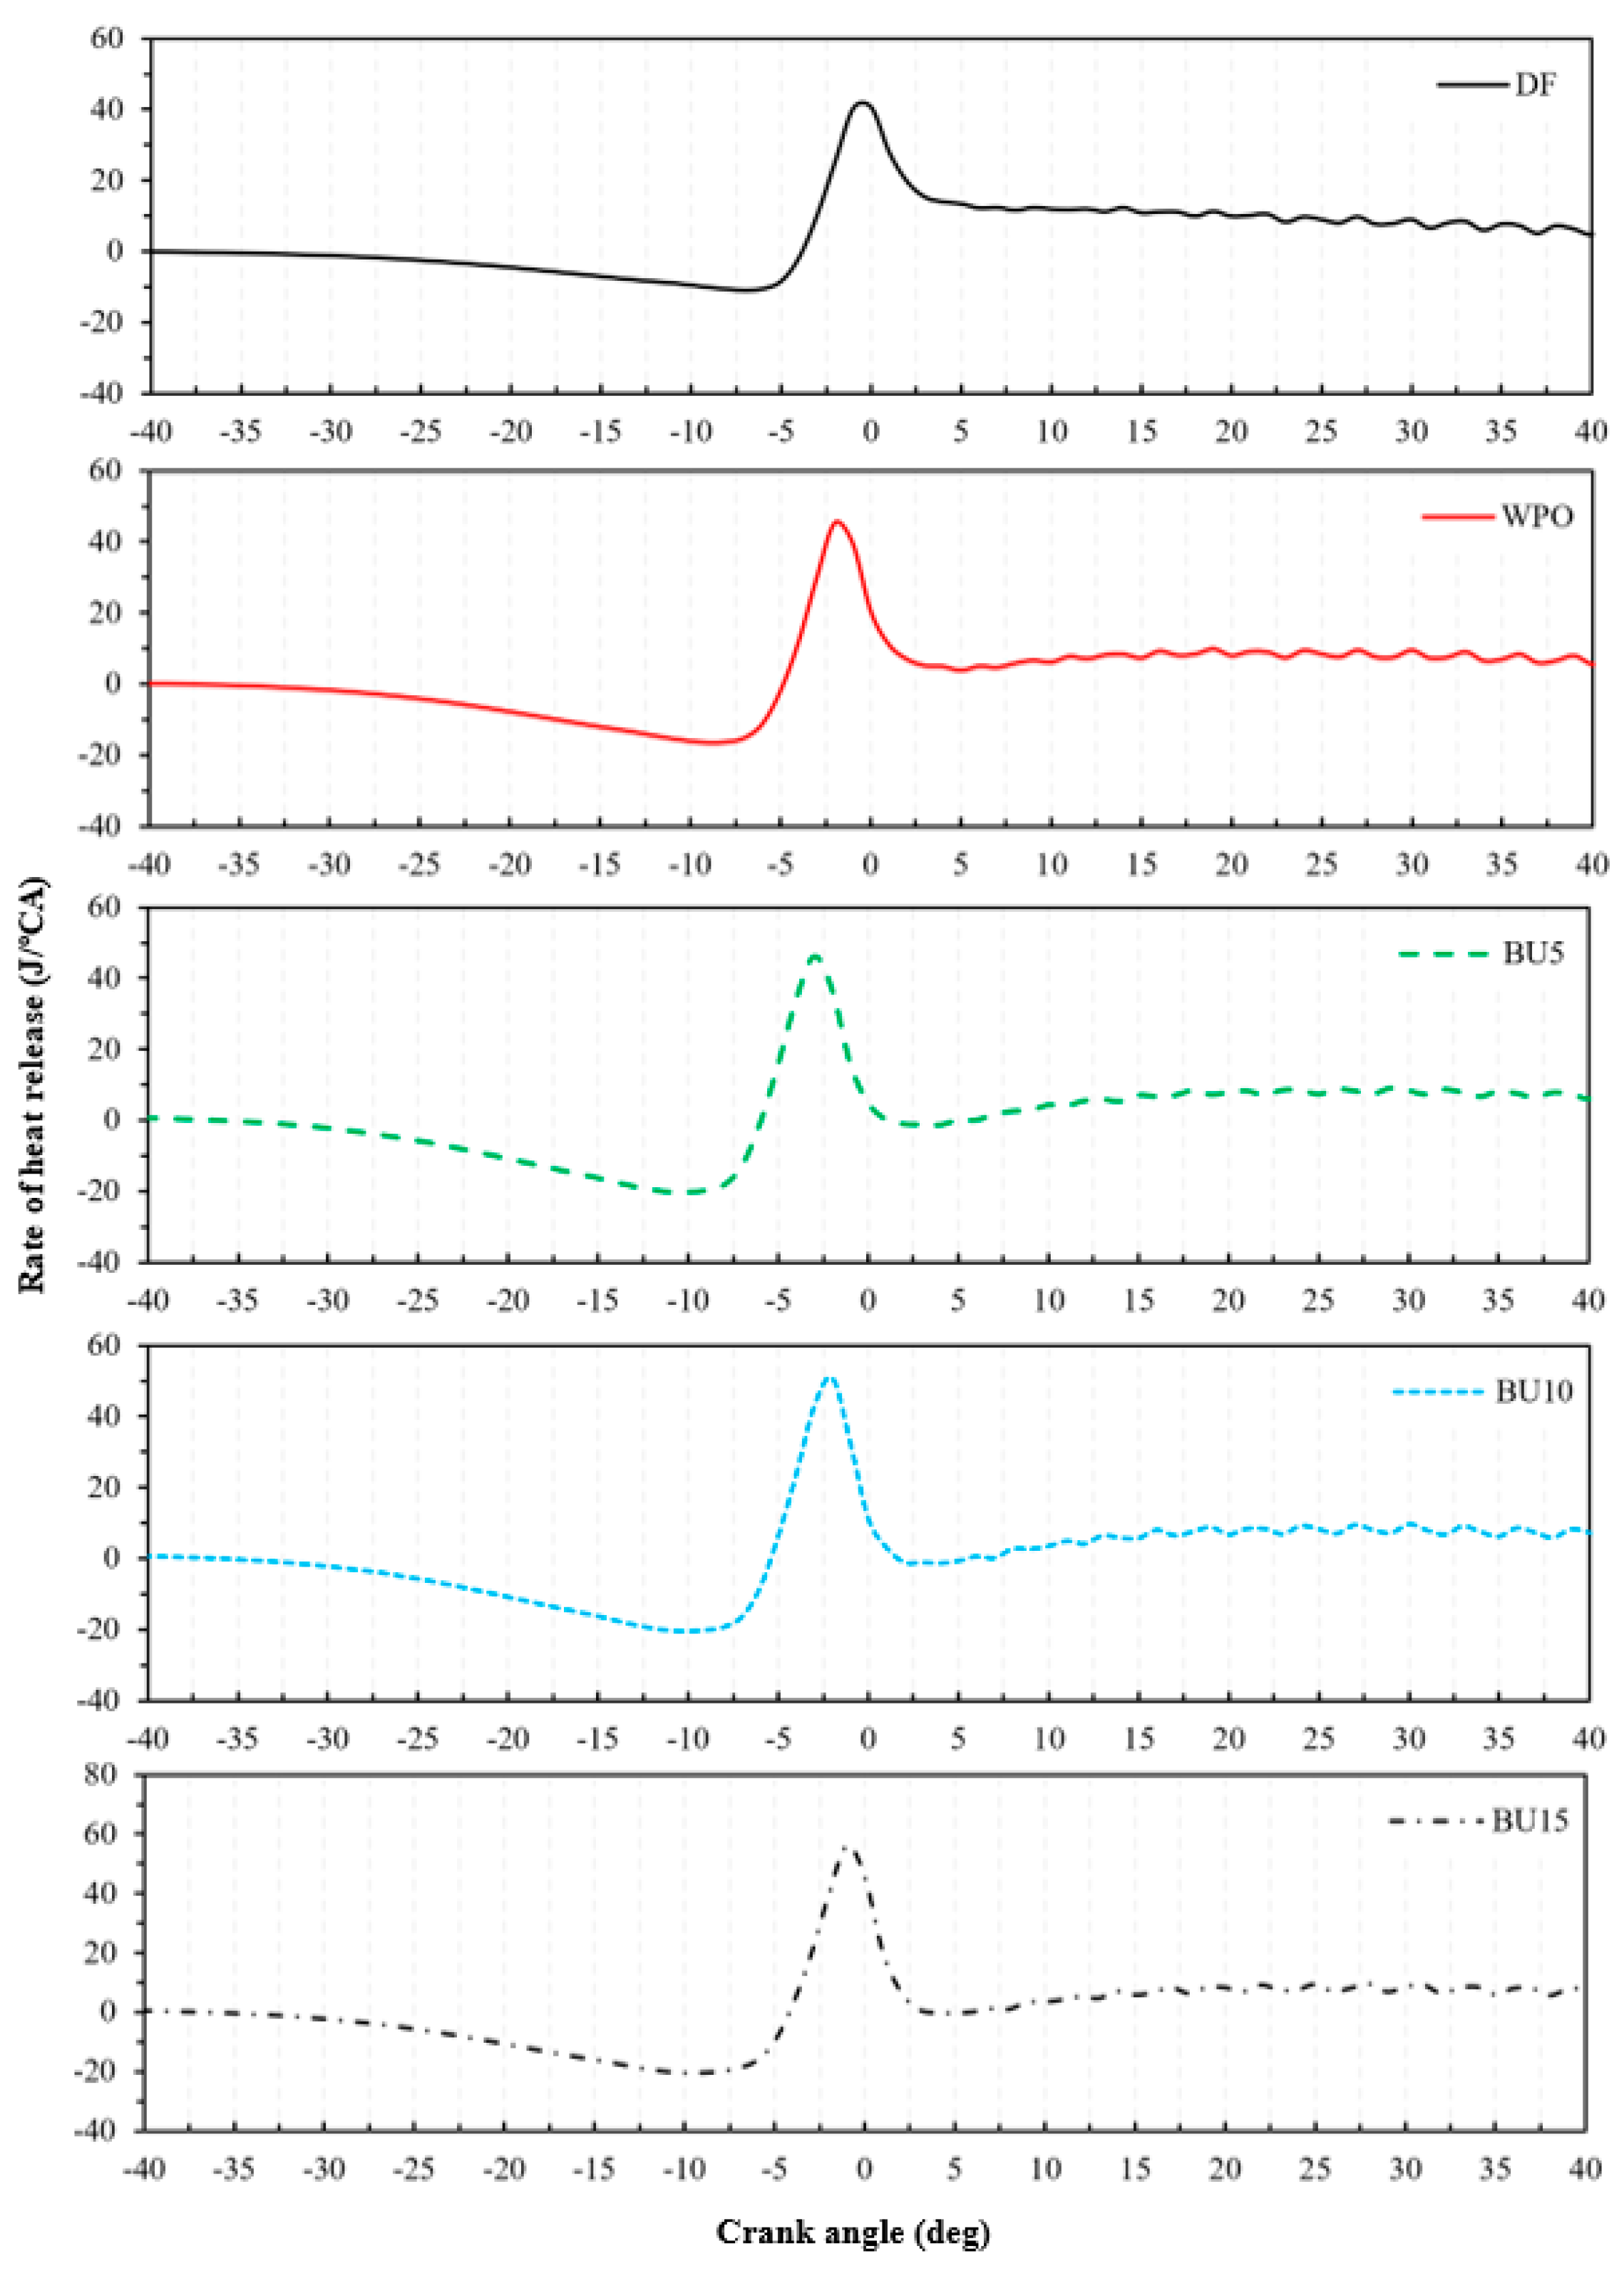
The rate of heat release (RoHR) is one important parameter of engine behavior that helps describe the combustion characteristics during the burning of fuel in the combustion chamber. The first law of thermodynamics, which was derived from energy conservation, was used to calculate RoHR along with the combustion products, which were assumed to be ideal gases [25]. The experimental results are shown in Figure 11. WPO tends to cause more difficulties in combustion. Moreover, the ignition delay period of the engine tended to increase with increasing n-butanol relative to WPO. This is because the vaporization of n-butanol exhibited high latent heat, which increases the temperature at which the mixture starts to burn on its own and lowers the temperature inside the combustion chamber [26].
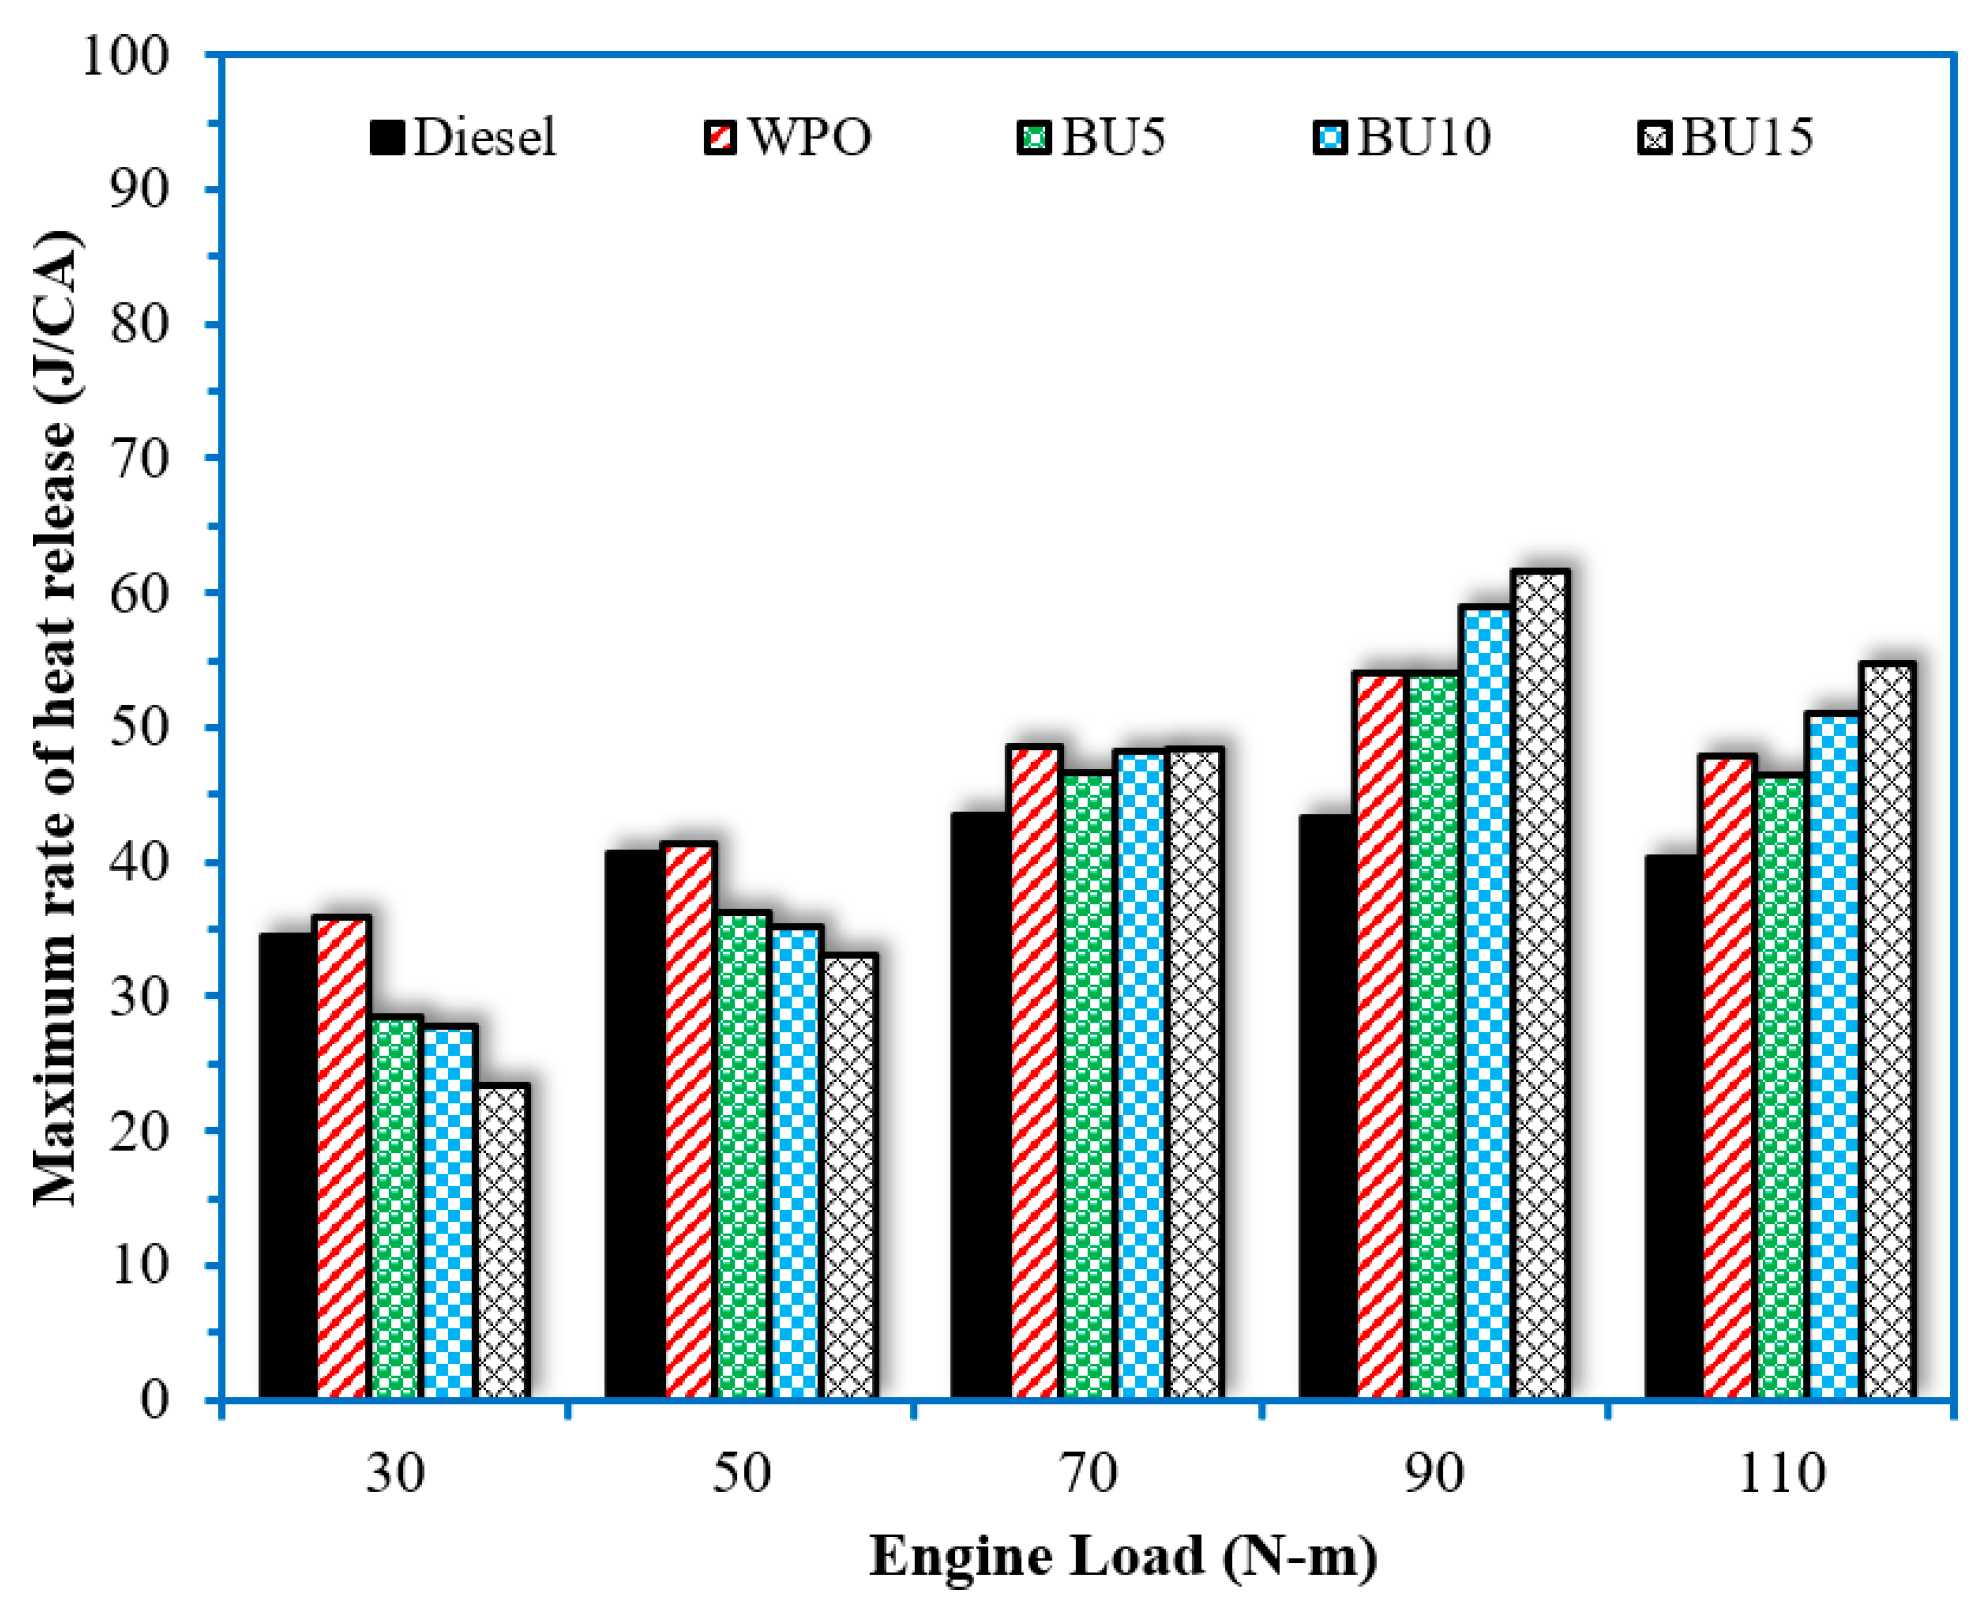
In addition, the variation in the maximum rate of heat release with the engine’s load for test fuels at different engine loads is shown in Figure 12. The higher the percentage of n-butanol in diesel fuel, the greater the reduction in the maximum rate of heat release for low and middle engine loads, and this can be observed compared to diesel fuels. However, the increment of n-butanol in diesel fuel at high engine load operations tends to increase the maximum rate of heat release. The main reason is that WPO and its blend require longer ignition delay periods, leading to more air–fuel mixtures inside the combustion chamber that are available for combusting once ignition begins, resulting in higher maximum rates of heat release [27].
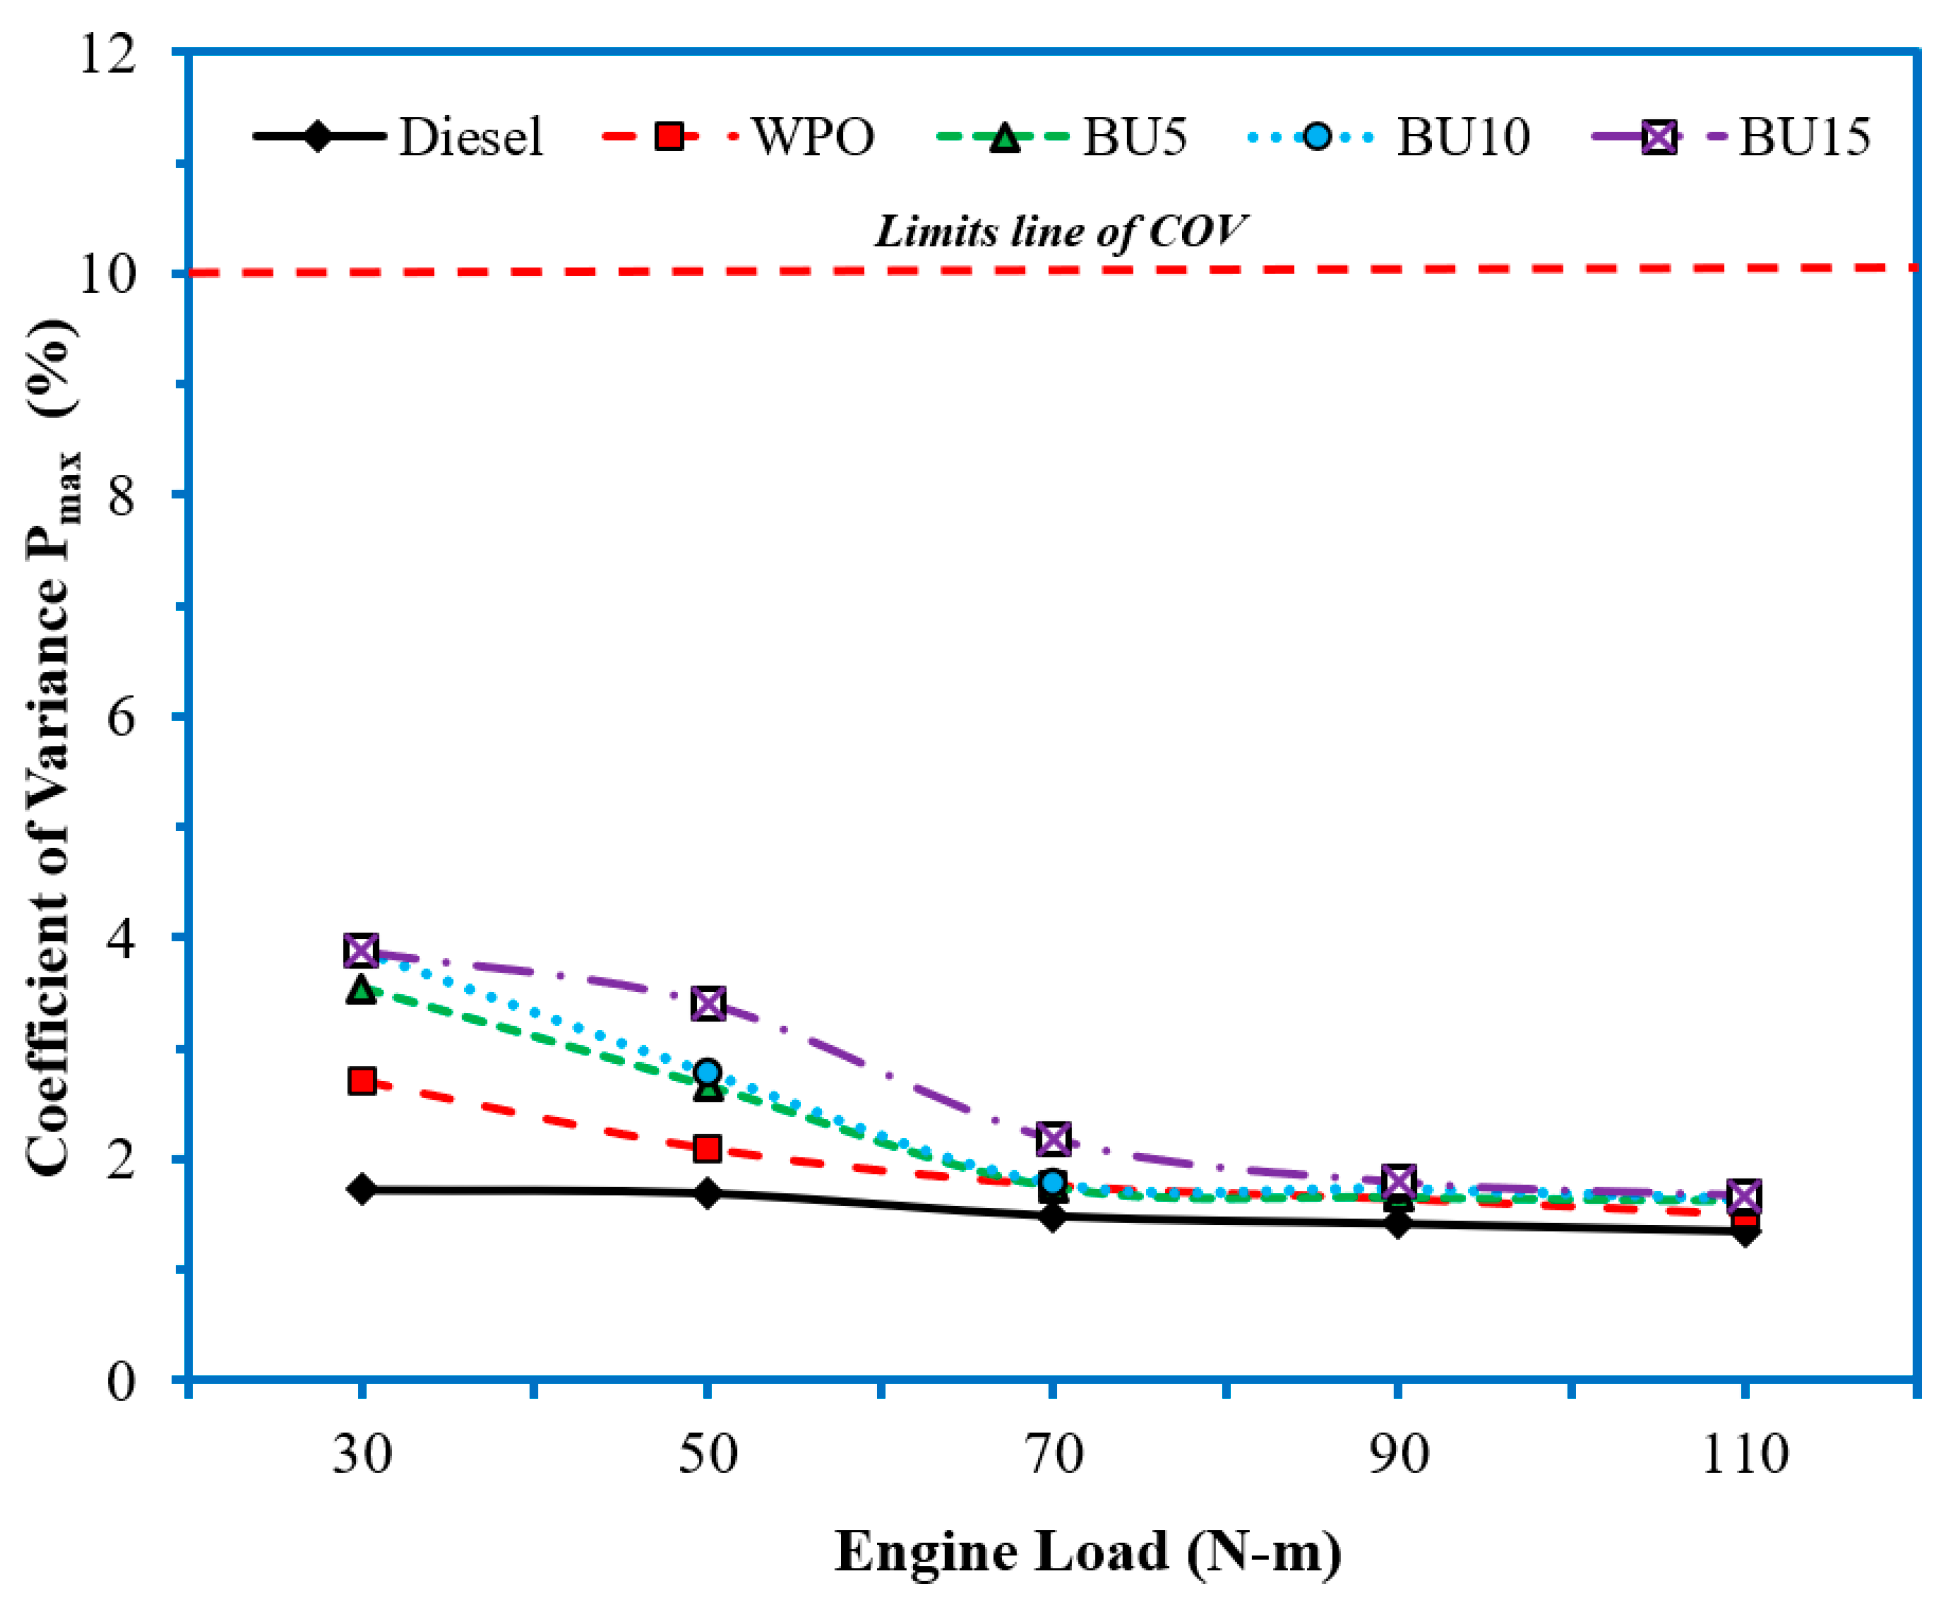
The coefficient of variance of the maximum in-cylinder pressure (COVPmax) was evaluated to assess the combustion stability of the engine operated with test fuels. The variation in COVPmax, along with engine load, is shown in Figure 13. The results showed that the COVPmax decreased as the engine loads increased for all test fuels, which demonstrated fewer cycle-by-cycle variations with respect to combustion behavior during the engine’s operation [28], while the increment of the n-butanol ratio in WPO led to an increase in the COVPmax values, especially at low engine load conditions where the temperature inside the combustion chamber was not high enough to compensate for the high latent vaporization heat of n-butanol. Nevertheless, the COVPmax of all test fuels was still lower than 10%, and this result suggests normal engine operations.

3.4. Emissions Characteristics

In this section, the emission parameters of the engine, such as nitrogen oxides, total hydrocarbons, carbon monoxide, and carbon dioxide, are shown and analyzed for each of the test fuels.
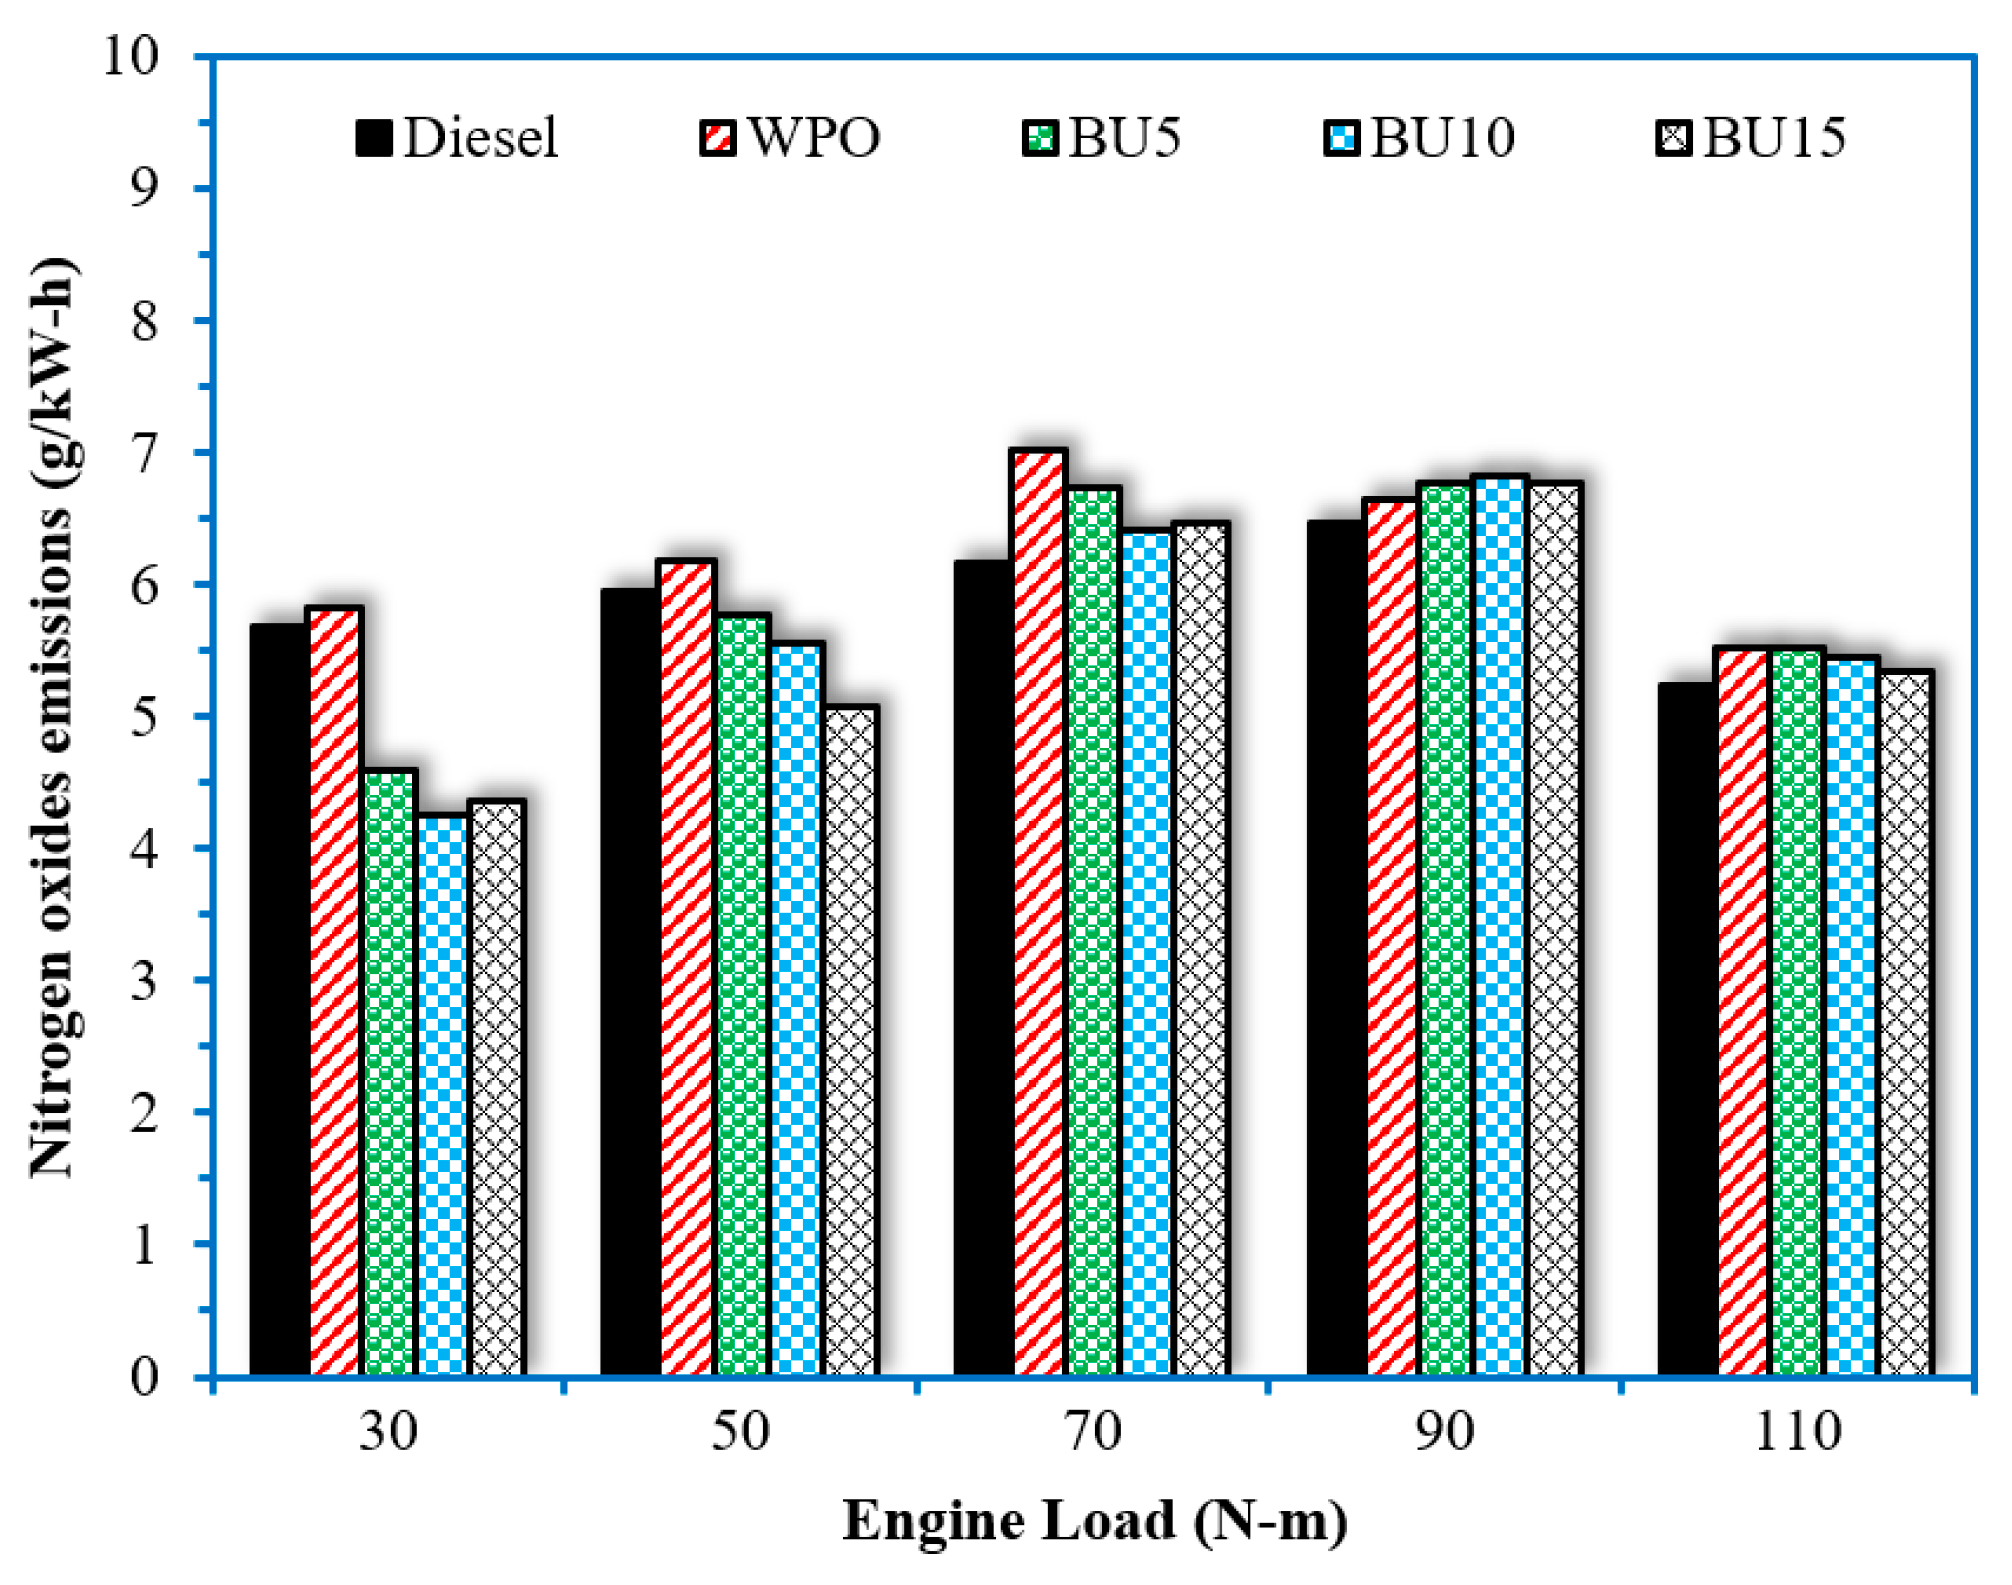
The variations in nitrogen oxide (NOx) emissions with increasing engine loads for all test fuels are shown in Figure 14. The major mechanisms of NOx formation in diesel engines include the thermal mechanism, the prompt mechanism, and the fuel mechanism. The increasing trend of NOx emissions when the engine load increased for all test fuels can be observed. This reason may be due to the high amount of fuel that is burned as the engine load increases, which results in high combustion temperatures inside the combustion chamber [29], while NOx emissions are usually high for WPO when compared with diesel fuel. As n-butanol is added to the WPO, there is a considerable decrease in NOx emissions because of the higher latent vaporization heat of n-butanol, resulting in lower temperatures inside the combustion chamber at low and middle engine load operations [30]. For this reason, it is not effective when the engine operates at a high engine load operation.
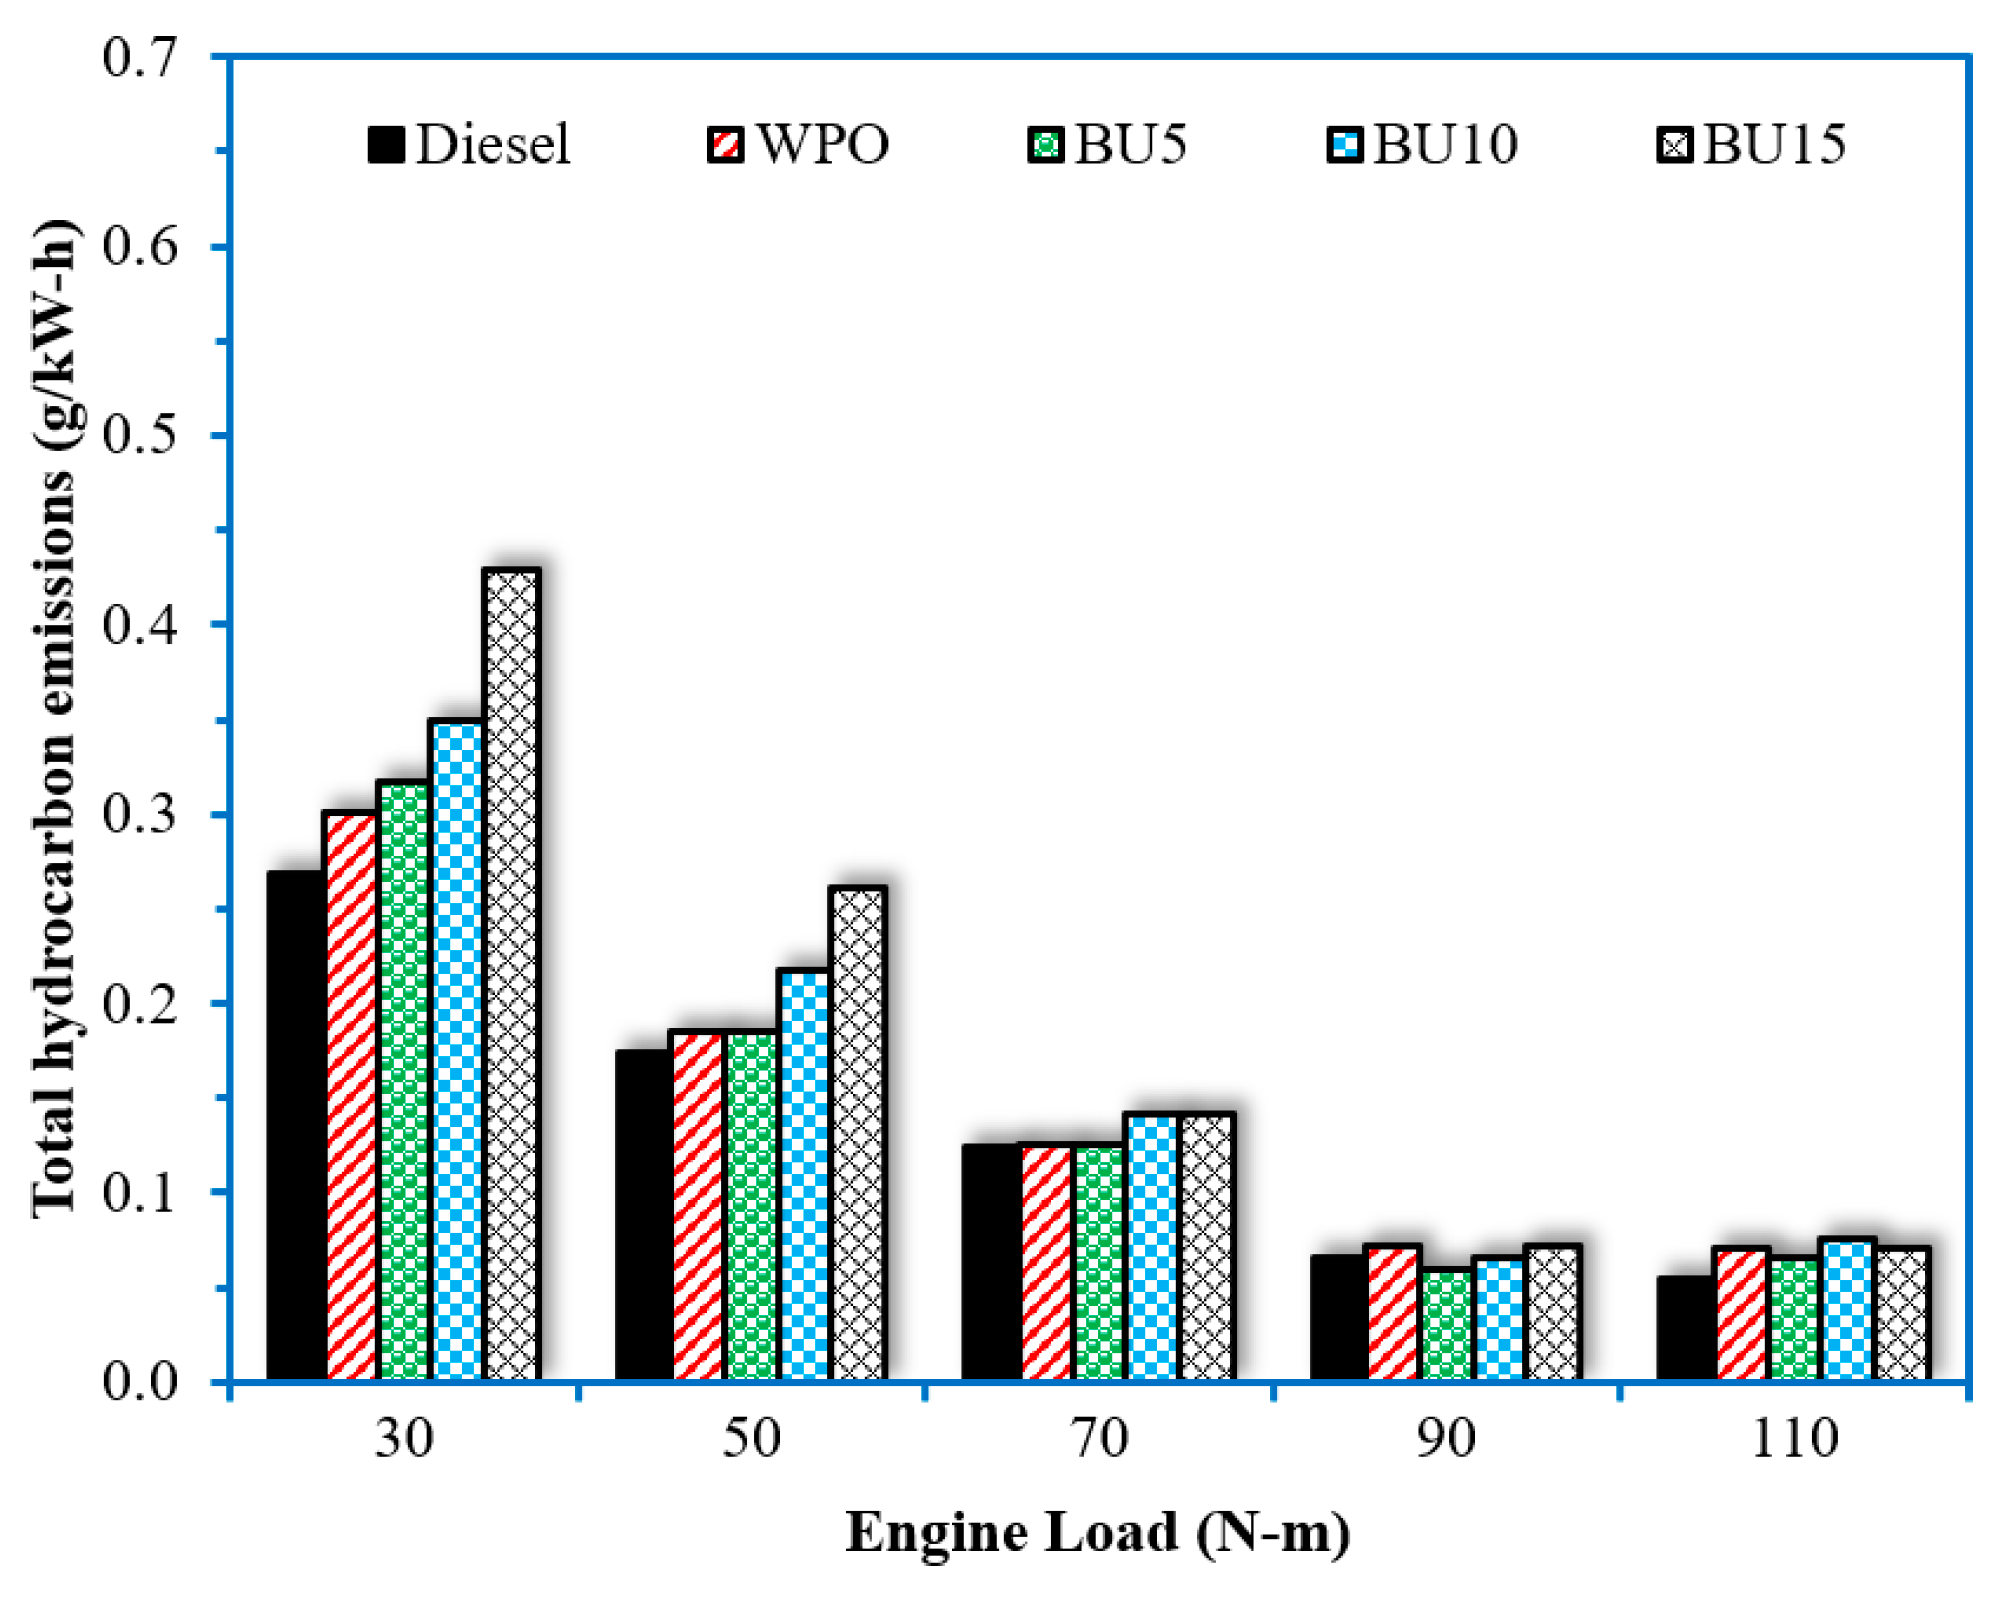
The formation of total hydrocarbon (HC) emissions in the exhaust gas emissions of diesel engines is due to flame-quenching operations in cold regions and poor combustion inside the combustion chamber [31]. The variation in HC emissions with increasing engine loads for all test fuels is shown in Figure 15. The results showed that the HC emissions of all test fuels decreased with increased engine load operations. When comparing WPO and diesel fuel, the HC emissions of WPO were higher than those of diesel fuel for all engine loads. While the increasing blend concentration of n-butanol in diesel fuel exhibited an increasing trend observed in HC emissions, this may be due to the higher latent vaporization heat of n-butanol (585 kJ/kg) [8] when compared to diesel fuel (270 kJ/kg), which results in flame-quenching processes inside the combustion chamber at a lower cylinder pressure and temperature in the combustion chamber [32].
Carbon monoxide (CO) emissions are products of incomplete combustion due to a deficiency of oxygen inside the combustion chamber during the combustion process [33], and its variation with respect to engine loads for all test fuels is shown in Figure 16. It can be seen that the CO emissions of all test fuels decrease with the increase in engine load operations, which causes an increase in combustion efficiencies when the engine’s load increases [12]. When comparing test fuels, increased CO emissions were obtained with the combustion of WPO compared to diesel fuels for all engine load conditions, while increasing the concentration of n-butanol in diesel fuel tends to increase CO emissions due to carbon in the n-butanol component, which cannot react with oxygen during combustion completely. Thus, the remaining carbon will produce increased carbon monoxide gas, and the latent vaporization heat will cause the flame to spread slowly and coolly. This lowers the temperature of the gas, which inhibits CO from turning into CO2 and causes the release of more CO [34].
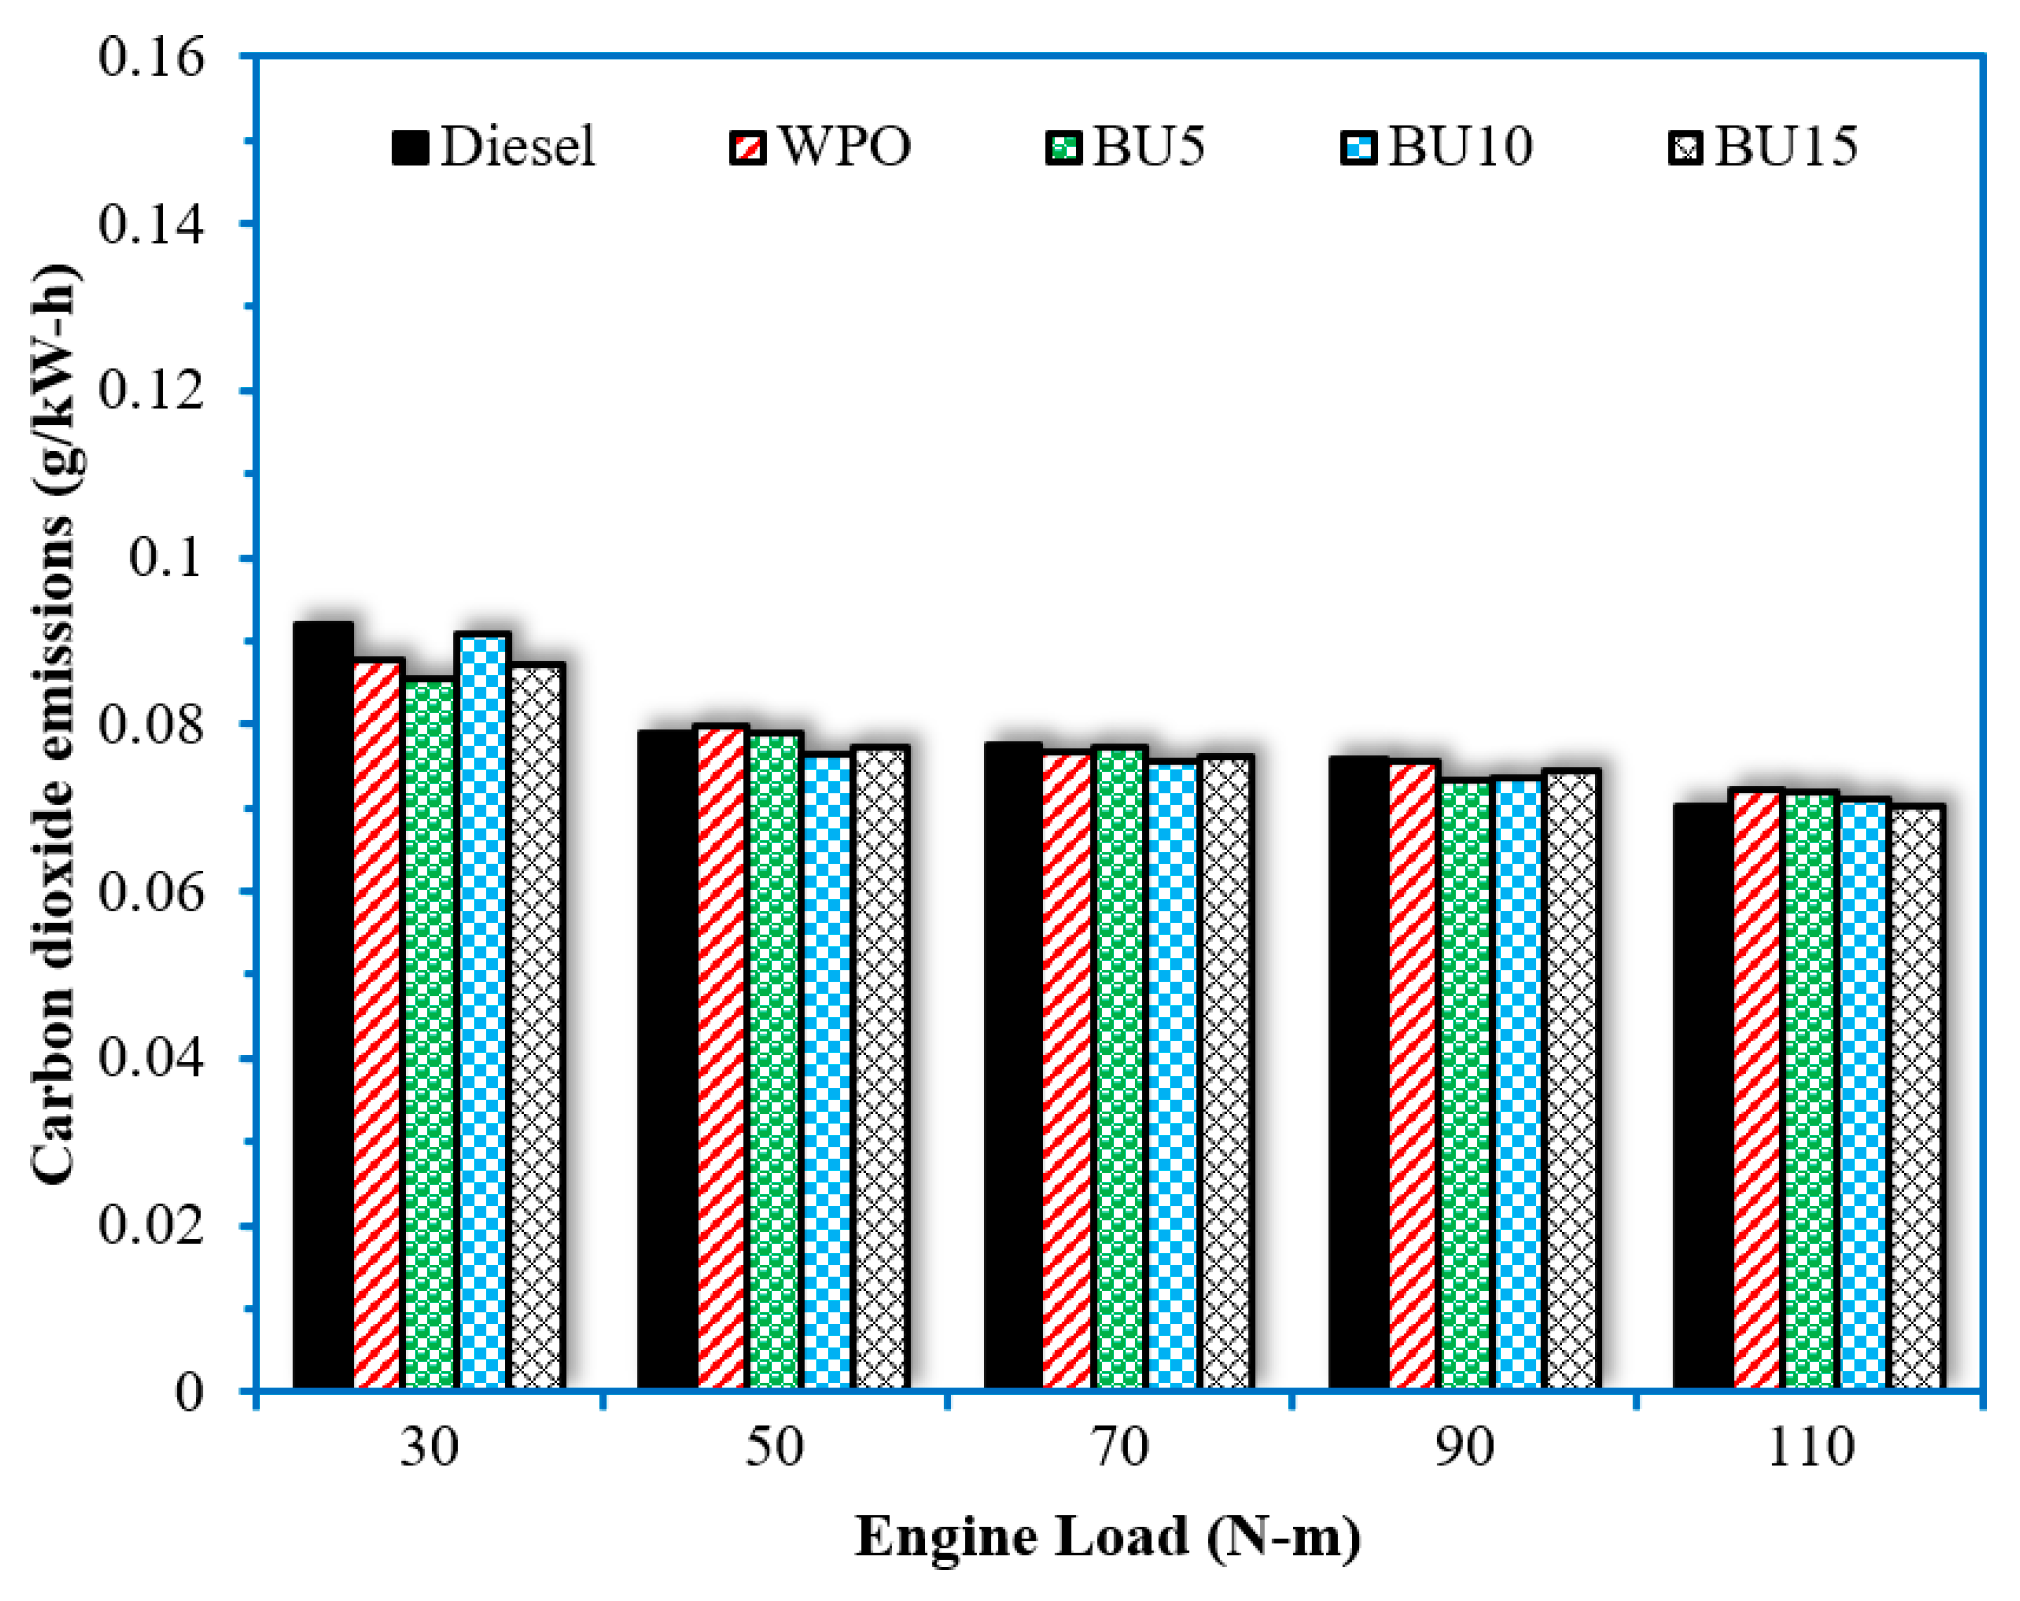
The source of carbon dioxide (CO2) emissions is a product of the complete combustion of hydrocarbon fuel under high-temperature conditions and oxygen availability. During combustion, the carbon in the hydrocarbon fuel is oxidized to CO; then, if the cylinder temperature is high enough and there is still enough O2 in the cylinder, CO2 is formed [35]. The experimental results are shown in Figure 17. It was observed that the CO2 emissions for all test fuels decreased when the engine load increased, which resulted from the high temperatures inside the combustion chamber during the combustion process of an engine. When comparing WPO and diesel fuels, the CO2 emissions of WPO were lower than diesel fuel due to its lower BTE than diesel fuel, which is caused by incomplete combustion [36]. Moreover, the increasing blend concentration of n-butanol in diesel fuel results in a significant decrease in CO2 emissions, although n-butanol is a highly oxygenated compound, which results in improved combustion processes. However, the influence of the non-availability of homogeneous charges inside the engine cylinder was more effective than the oxygenated compounds.

3.5. Results of Multi-Objective Function via GRNN

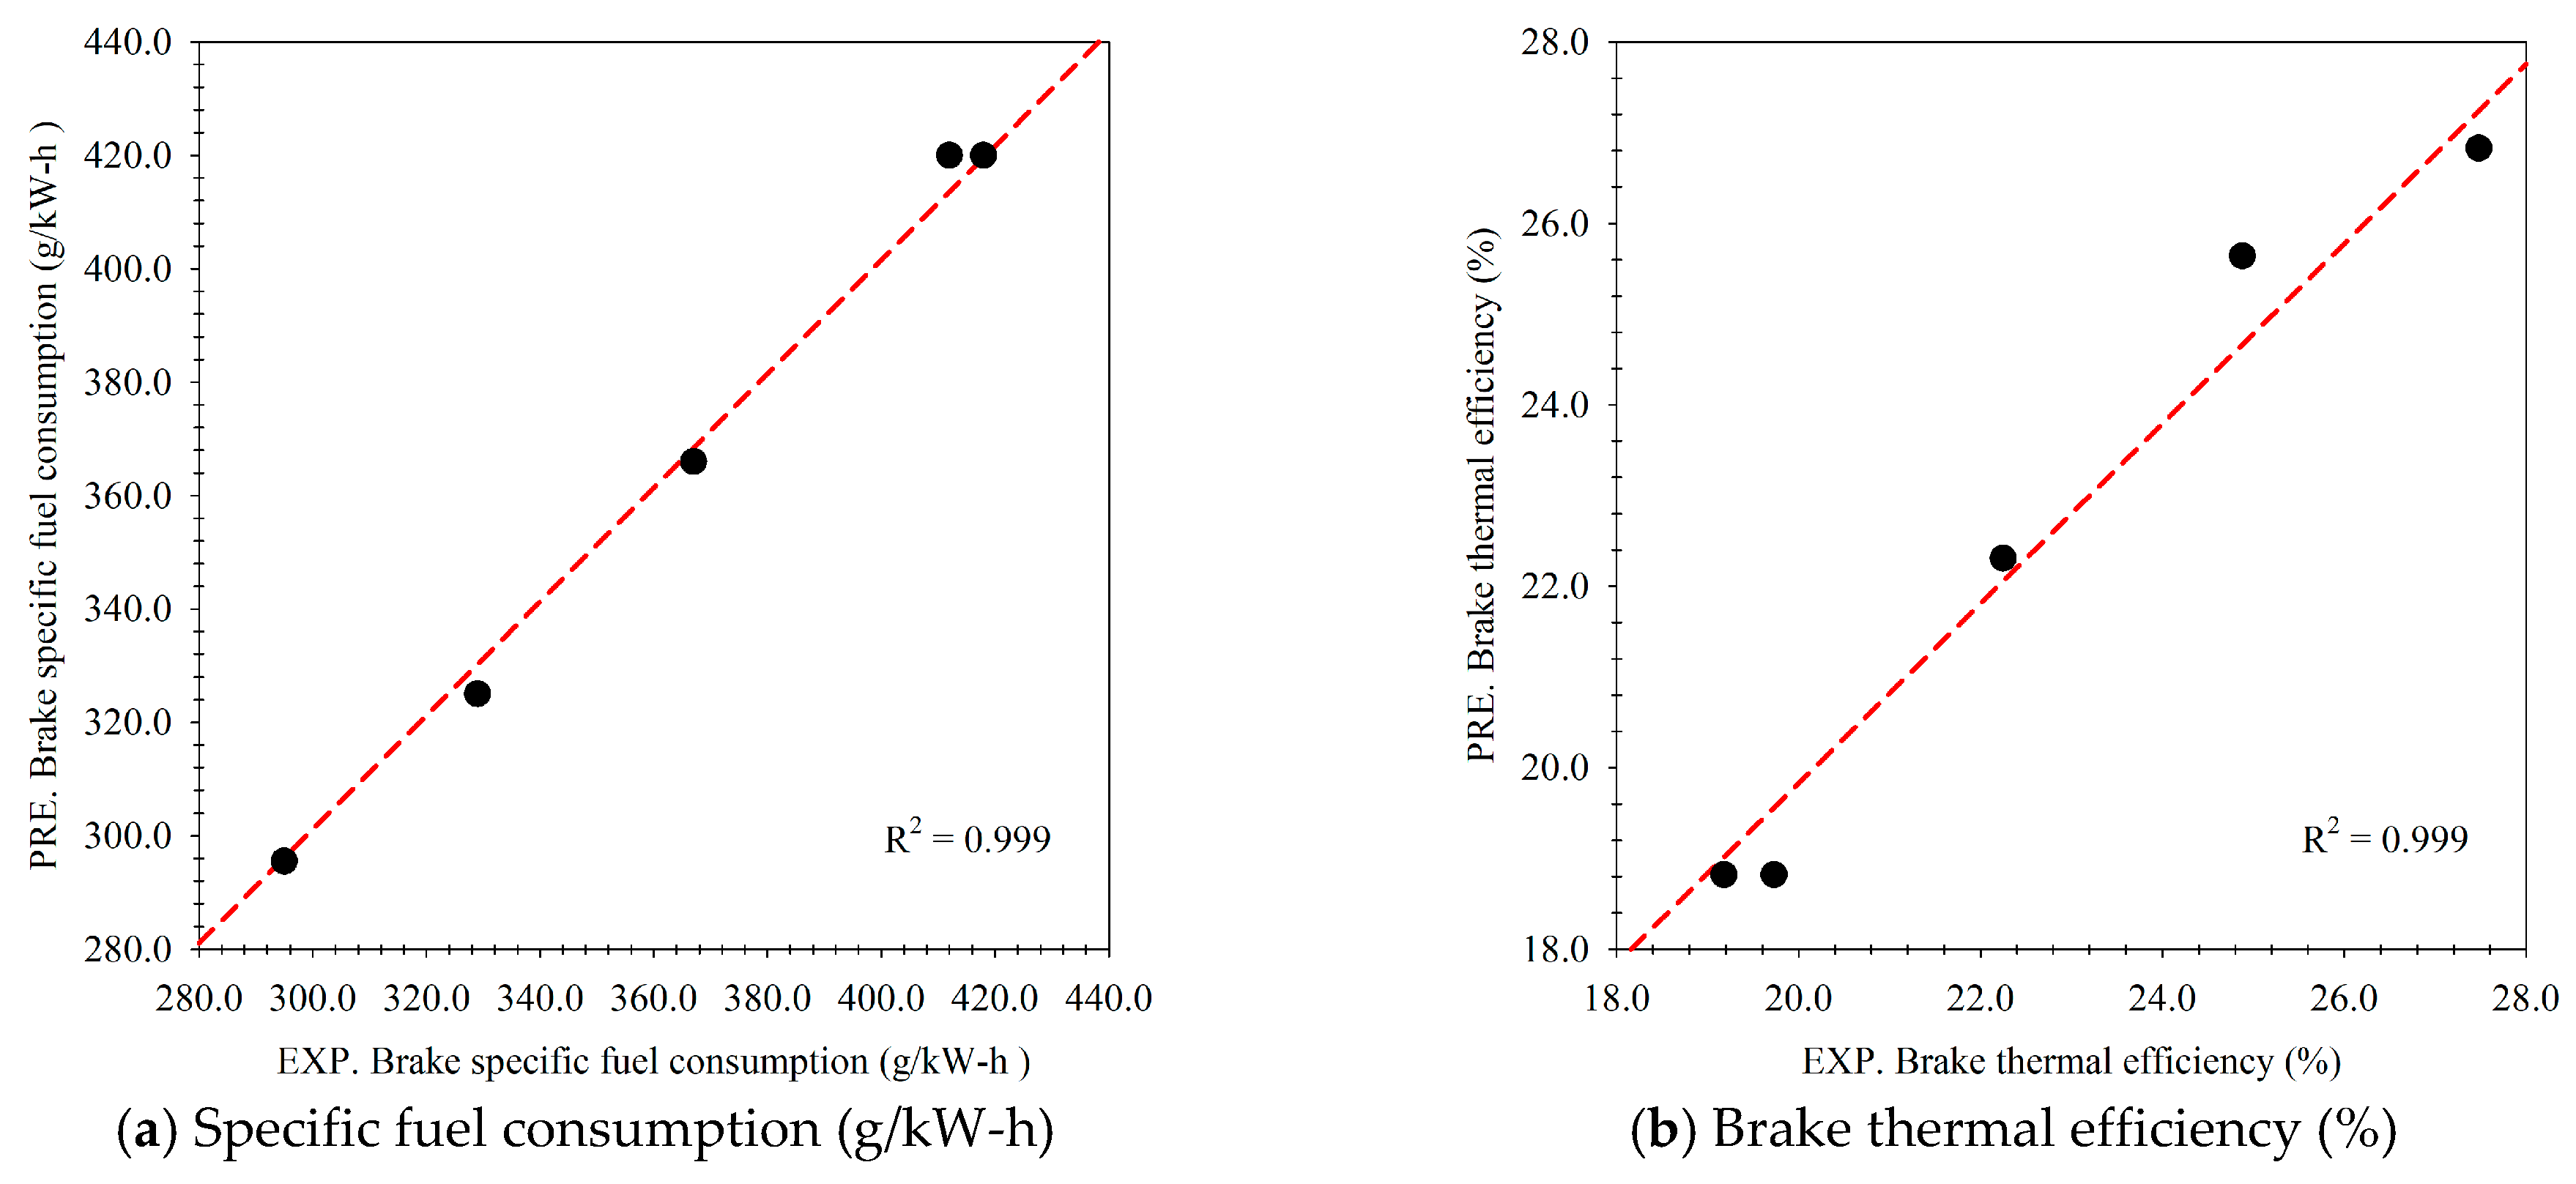
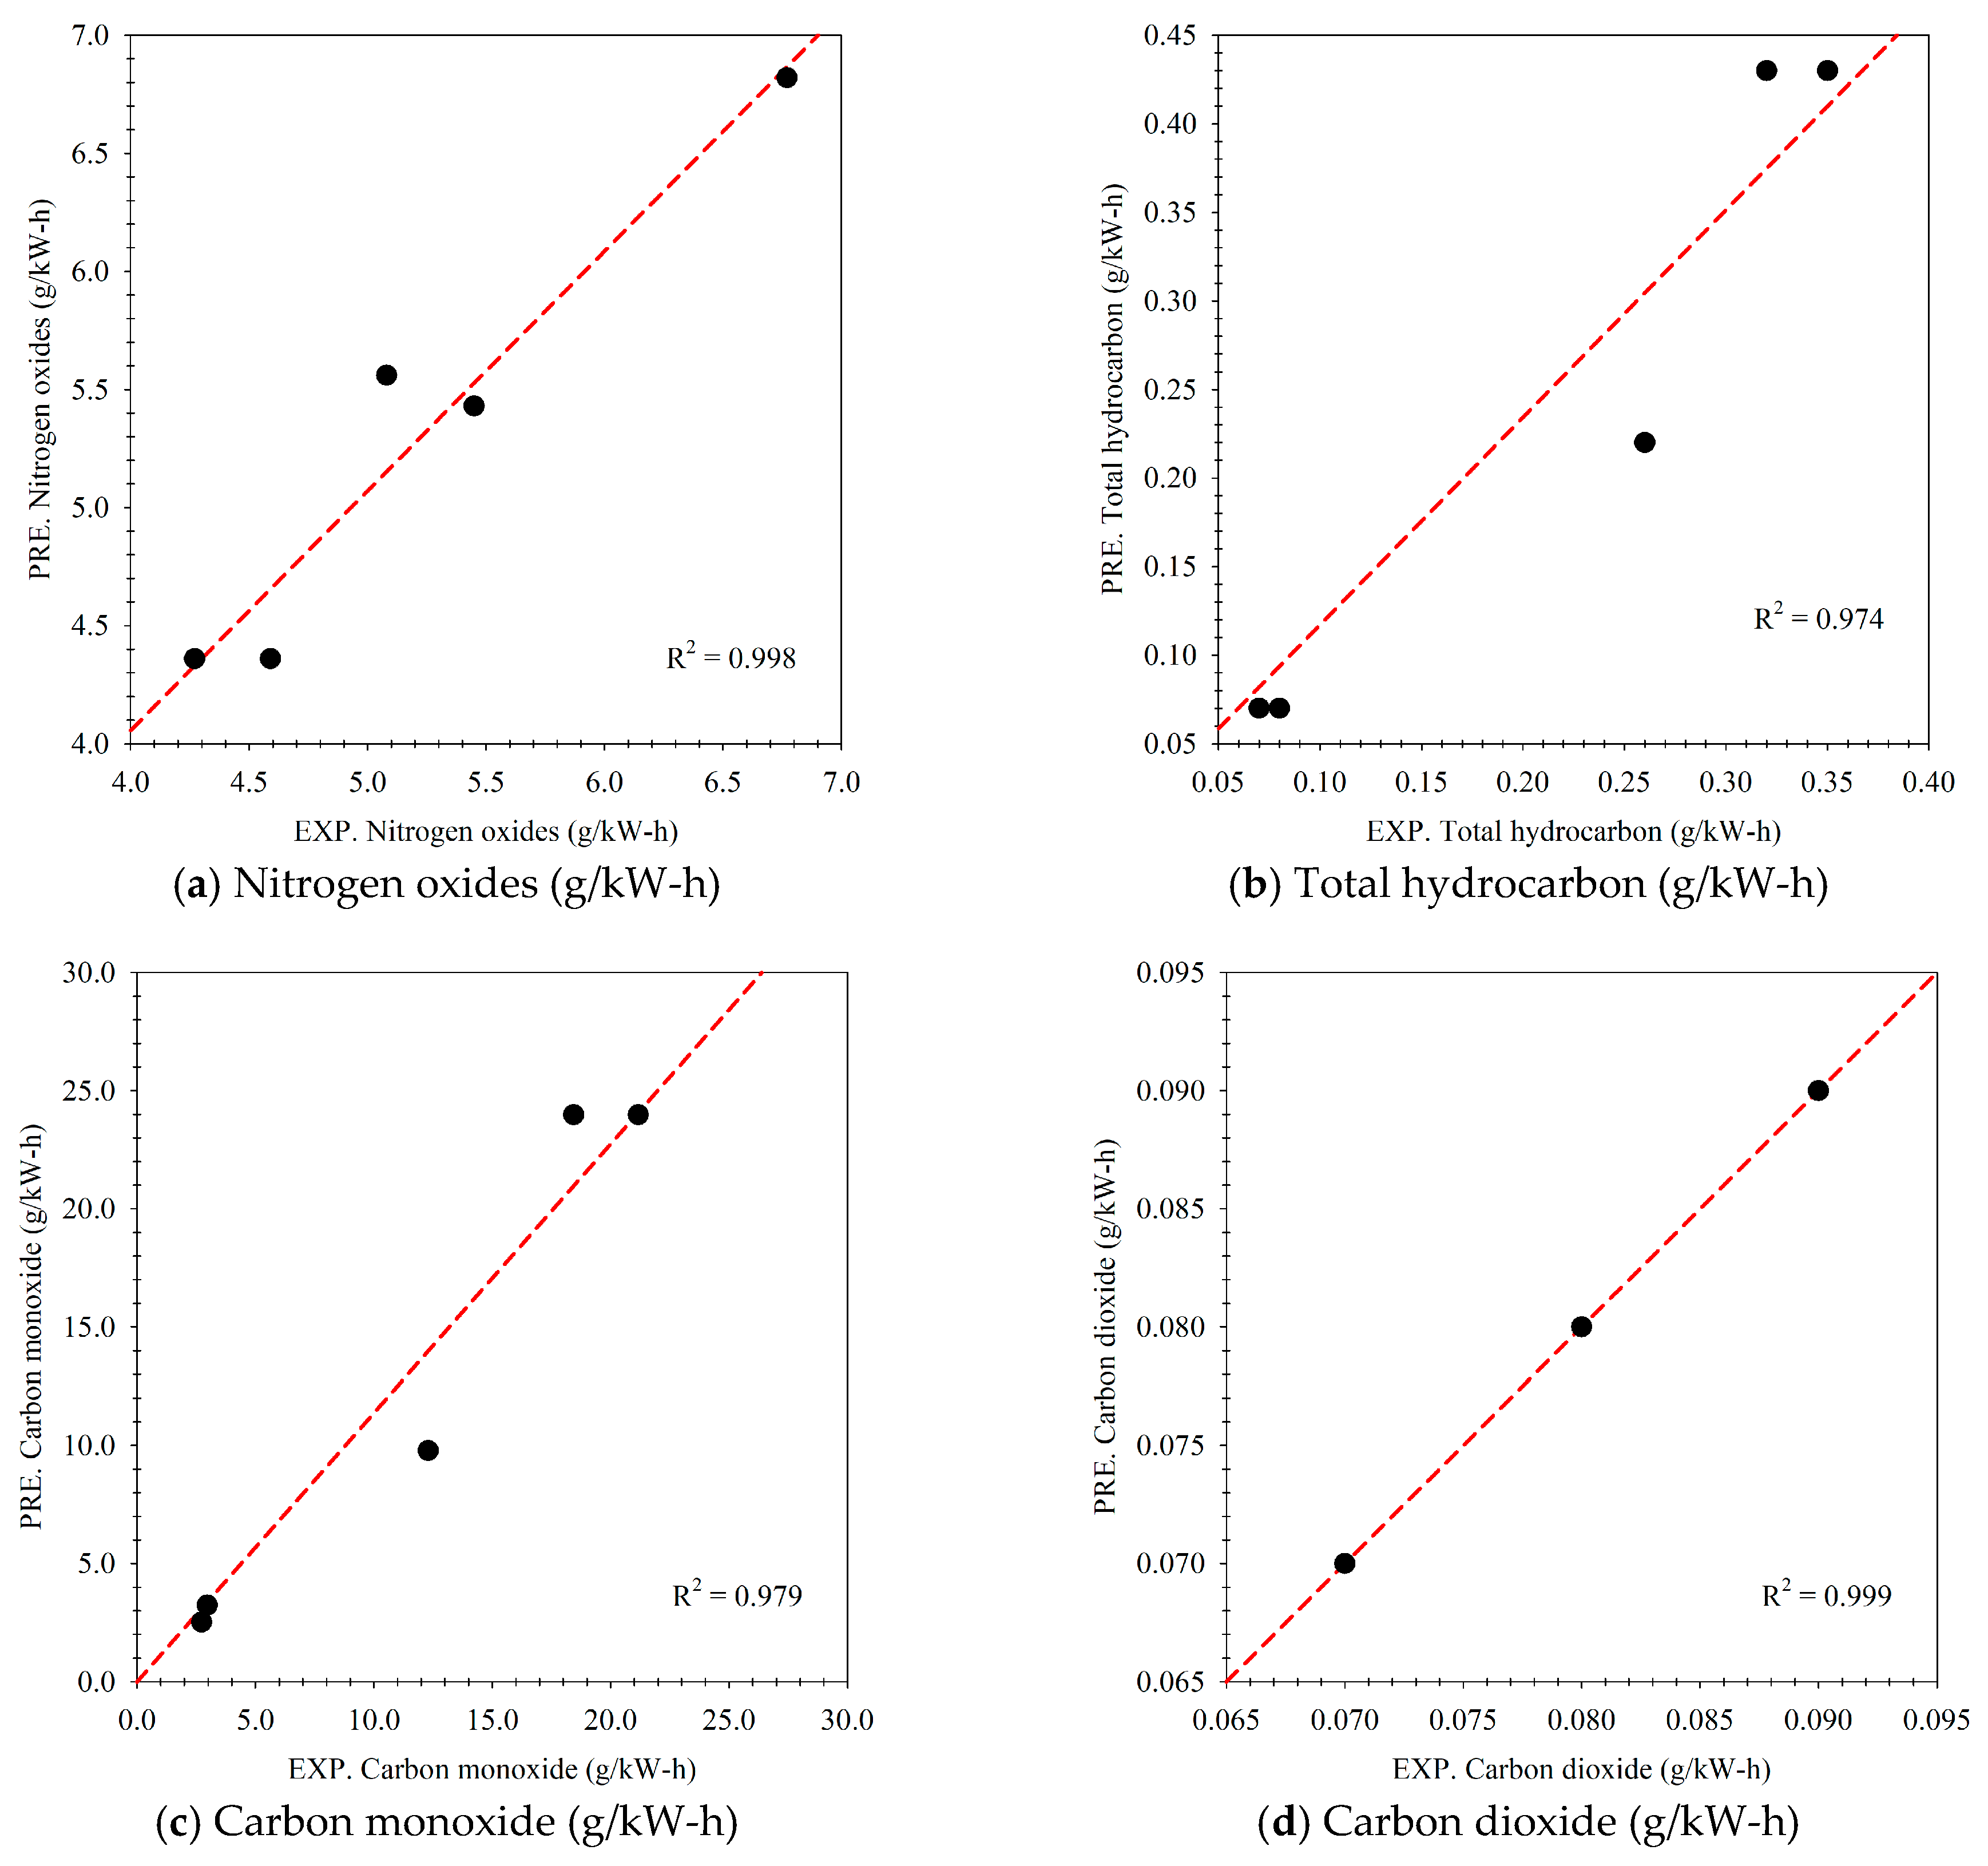
For multi-objective optimization, an equation that shows how the objectives relate to the problem’s inputs must first be considered; in this study, the equation demonstrates that this correlation is obtained from the GRNN. The prediction results of the GRNN model compared to the actual engine’s performance and the emissions of blended n-butanol with waste plastic oil are shown in Figure 18 and Figure 19, respectively. When predicting engine performances, the model’s performance showed that the prediction was successful. Considering brake-specific fuel consumption (Figure 18a), the model had performance metrics (R2, MAPE, and RMSE equal to 0.999, 1.113%, and 7.204, respectively) while the performances of the brake thermal efficiency (Figure 18b) are equal to 0.999, 2.606%, and 0.663, respectively. The model continued to exhibit high prediction performances, matching the predicted engine performance even after taking blended oil emissions into account. When considering nitrogen oxides (Figure 19a), the model had prediction performances equal to 0.998, 6.915%, and 0.600, respectively, which are identical to the engine performance’s predicted metrics. In addition to the predictive performance at nitrogen oxides, other emissions have predictive performance metrics equal to 0.974, 9.184%, and 0.030; 0.979, 8.911%, and 1.390; and 0.999, 1.333%, and 0.002, corresponding to the total hydrocarbon (Figure 19b), carbon monoxide (Figure 19c), and carbon dioxide (Figure 19d) contents, respectively. The model had a high prediction performance with respect to both engine performance and emission, which showed that the model had successfully represented the multi-objective function for the ratio of n-butanol and waste plastic oil blend optimization, according to the interpretation of Lewis’s research [37].

3.6. Optimized Results from NSGA-II Multi-Objective Optimization

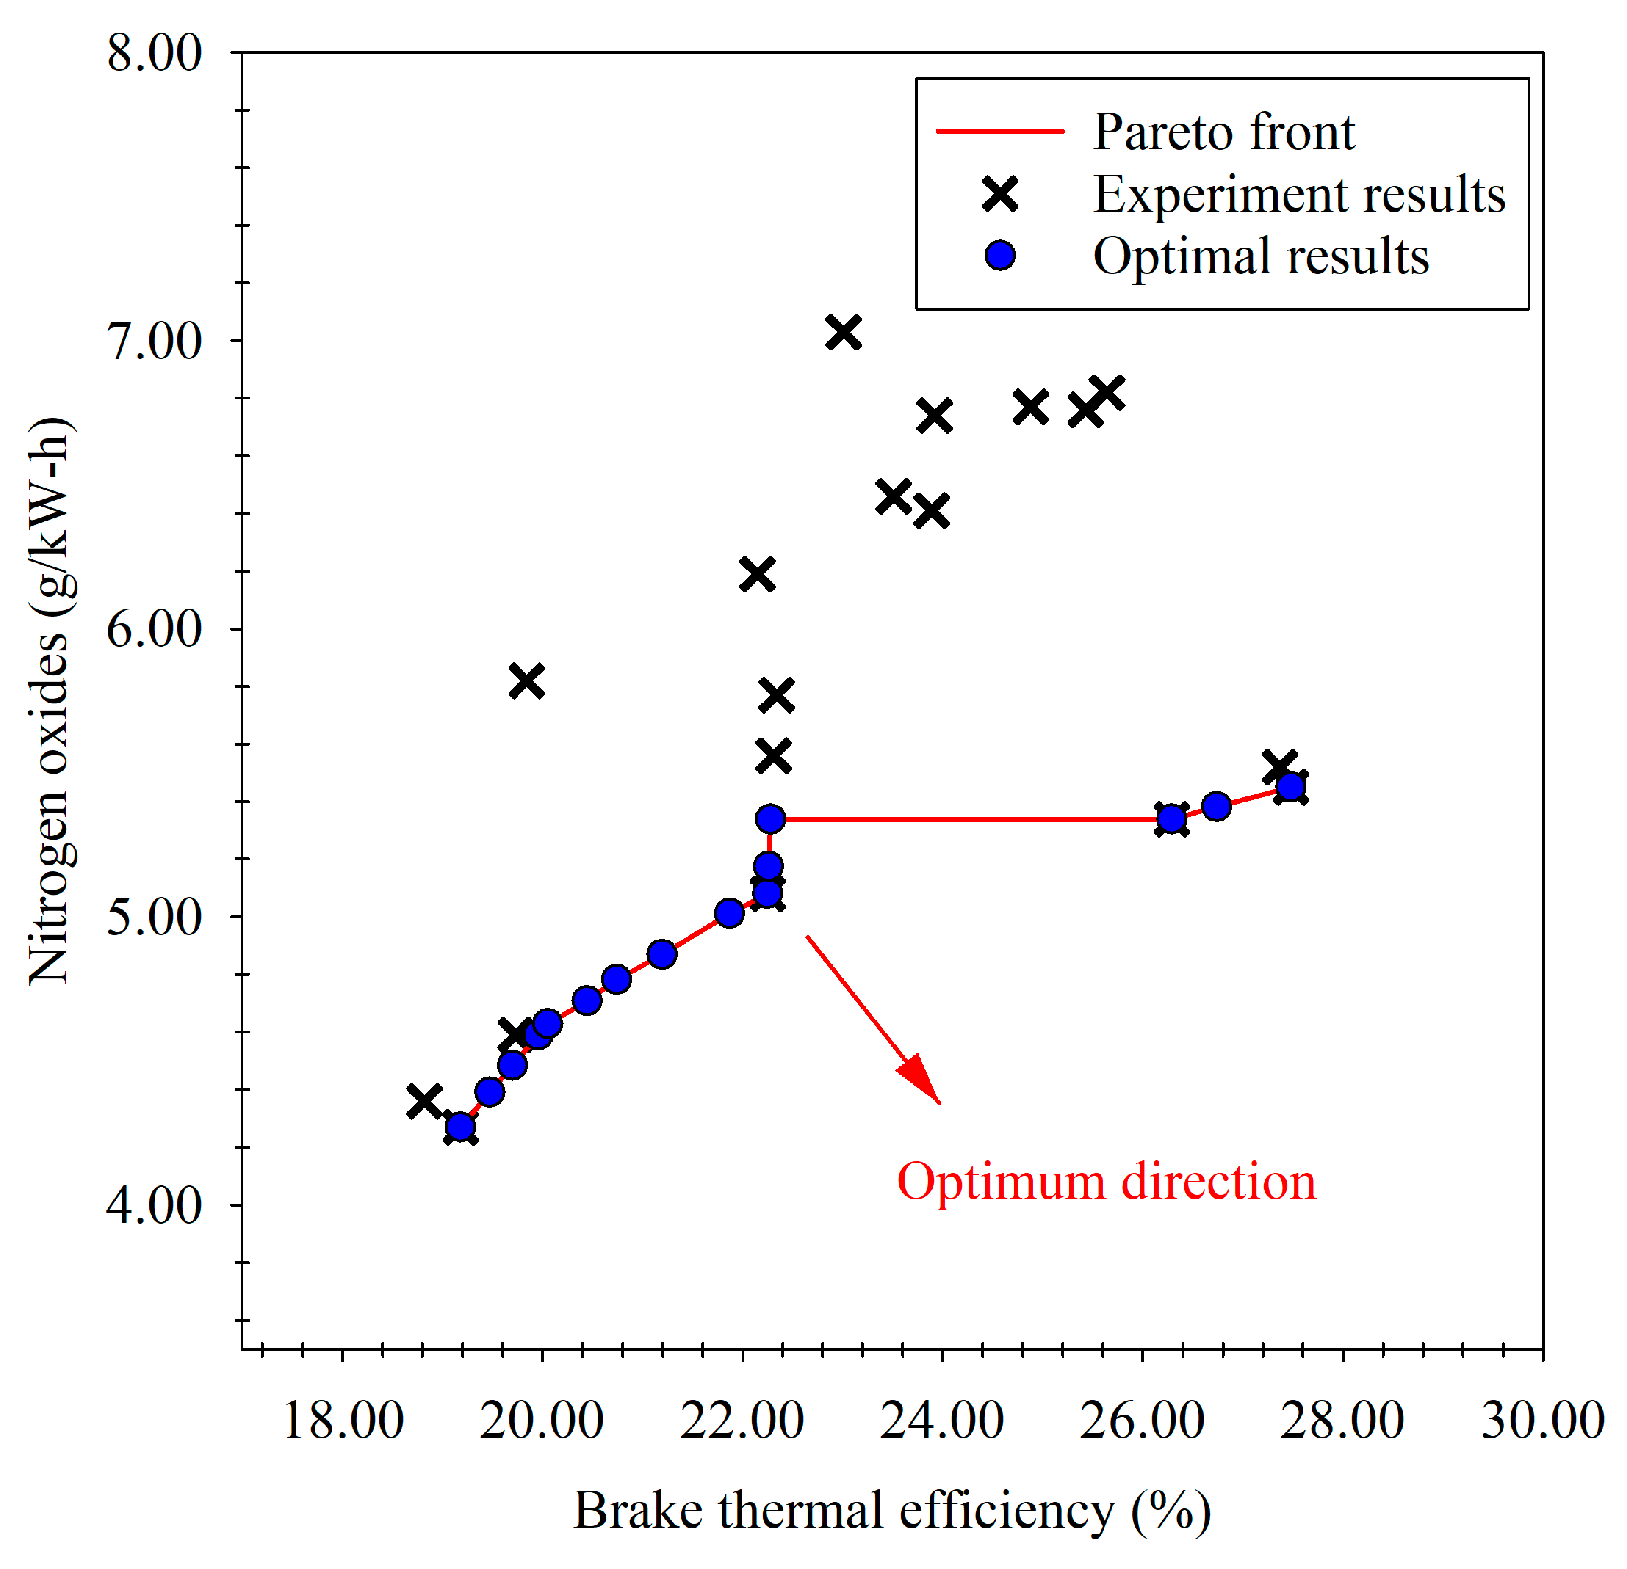
The optimal results obtained from the NSGA-II multi-objective optimization using the GRNN model as a multi-objective function are shown in Figure 20. The NGGA-II optimization technique did not yield a singular or unique point of optimality. According to its characteristics, the optimal result was shown in the form of a Pareto frontier following Figure 20. According to the objective function, the frontier line indicates the boundary of the optimal result depending on engine load and BU blend, which results in a trade-off between brake thermal efficiency and nitrogen oxides. Below the frontier line, the results are optimal, and above it, the results are not optimal. The optimal values of the input factors and corresponding output obtained from NSGA-II are shown in Table 8. As the frontier cause does not display the input factors value, there may be difficulty in using NSGA-II when providing an optimal frontier or boundary value.

4. Conclusions

The conclusions drawn from the present investigation—using WPO and four fuel blends as alternative fuels in diesel engines without any modifications at different volume percentages, including 5%, 10%, and 15% by volume—are summarized as follows:
  • The main hydrocarbons present in WPO ranged within different diesel fuels (C13–C18) at approximately 74.39%; thus, they can be used as alternative fuels in diesel engines. However, the specific gravity and flash point of WPO were out of the limit prescribed by the diesel fuel specification.
  • The addition of n-butanol to WPO was found to reduce engine thermal efficiencies at low loads, while an increase in thermal efficiency was obtained at high loads. The maximum improvement in thermal efficiency was achieved when the engine operated with 10% n-butanol in the WPO at an engine load of 110 N.m.
  • The addition of n-butanol to WPO tended to increase HC and CO emissions. Higher n-butanol concentrations in the fuel blend promoted higher HC and CO emissions, especially when the engine operated at low-load conditions. The benefit of blending n-butanol with WPO was found with a reduction in NOx emissions, especially at low-load conditions. The average 24% reduction in NOx emissions compared to WPO was achieved when the engine operated at a load of 30 N.m.
Optimized input factors such as engine loads (N.m) and the ratio of the n-butanol blend (%) to engine performance and emissions such as the brake thermal efficiency (%), and nitrogen oxides (g/kW-h) were determined depending on the observations resulting from blending n-butanol with waste plastic oil. The optimization process’s results can be concluded as follows:
  • In the optimization process, it was found that the multi-objective function produced by the general regression neural network (GRNN) can be modeled as the multi-objective function with high predictive performances. The model’s R2, MAPE, and RMSE values were 0.999, 2.606%, and 0.663, respectively, when brake thermal efficiency was considered, while nitrogen oxide values were 0.998, 6.915%, and 0.600, respectively.
  • As for the results of the optimization using NSGA-II, a single optimum value cannot be attained with the other methods, but the optimization’s boundary was obtained, which was established by making a trade-off between brake thermal efficiency and nitrogen oxides.
  • Following the Pareto frontier, the engine load and the ratio of the n-butanol blend that caused a trade-off between the maximum brake thermal efficiency and minimum nitrogen oxides are within the approximate ranges of 37 N.m to 104 N.m and 9% to 14% according to the input factors, respectively. However, there are many factors that still need to be studied, such as the quality of raw materials, the manufacturing process and products, the cost of economics, and end-user acceptance in the commercialization of waste plastic oil and its blend.
  • Future studies on engine modification, such as adjusting fuel injection timing and injection pressure, can be considered for further improvements via the increase in thermal efficiency and the decrease in exhaust emissions by using waste plastic oil and its blends.

Author Contributions

Conceptualization, E.S.; investigation, C.K., S.M., N.K. and A.W.; writing—original draft preparation, C.K.; writing—review and editing, C.K. and E.S.; supervision, A.A. and P.A. All authors have read and agreed to the published version of the manuscript.

Funding

This research was funded by SUT Research and Development Fund, Suranaree University of Technology, grant number IRD7-707-62-12-27.

Data Availability Statement

Not applicable.

Acknowledgments

SUT Research and Development Fund, Suranaree University of Technology, Thailand, is gratefully acknowledged for providing financial support through Project No. IRD7-707-62-12-27. The authors wish to acknowledge the Center of Excellence in Biomass (COE), Suranaree University of Technology, Thailand, for their support by providing the raw materials and equipment used for the production of waste plastic oil.

Conflicts of Interest

The authors declare no conflict of interest.

Nomenclature

BSFCBrake-specific fuel consumption
BTEBrake thermal efficiency
B7Commercial diesel fuel with 7% biodiesel
BU5Blend of 5% n-butanol and 95% waste plastic oil
BU10Blend of 10% n-butanol and 95% waste plastic oil
BU15Blend of 15% n-butanol and 95% waste plastic oil
COCarbon monoxide
CO2Carbon dioxide
COVCoefficient of variance
GC–MSGas chromatography–mass spectrometry
GRNNGeneral regression neural network
HCHydrocarbon
MAPEMean absolute percentage error
NOxNitrogen oxides
NSGA-IINondominated sorting genetic algorithm II
RSMERoot mean square error
R2Coefficient of determination
SDDenominator neuron
SNNumerator neuron
SMSmoothing parameter
WPOWaste plastic oil
WiTransformed of input of prediction model
XiInput of prediction model
YP,iOutput of prediction model
Y ¯ Mean of the actual output

References

  1. Siriporn, K.; Narongsak, N. Solid Waste: What is the situation during COVID-19? J. Public Health Nurse 2020, 34, 145–157. [Google Scholar]
  2. Guillard, V.; Gaucel, S.; Fornaciari, C.; Angellier-Coussy, H.; Buche, P.; Gontard, N. The next generation of sustainable food packaging to preserve our environment in a circular economy context. Front. Nutr. 2018, 5, 121. [Google Scholar] [CrossRef] [PubMed] [Green Version]
  3. Pisitsankkhakarn, R.; Vassanadumrongdee, S. Enhancing purchase intention in circular economy: An empirical evidence of remanufactured automotive product in Thailand. Resour. Conserv. Recycl. 2020, 156, 104702. [Google Scholar] [CrossRef]
  4. The Situation of Sustainable Production and Consumption Operations in Thailand in 2021. Thai SCP Network. Available online: https://waa.inter.nstda.or.th/stks/pub/bcg/20210825-bcg-SCP-2564.pdf (accessed on 14 August 2022).
  5. Hariadi, D.; Saleh, S.M.; Anwar Yamin, R.; Aprilia, S. Utilization of LDPE plastic waste on the quality of pyrolysis oil as an asphalt solvent alternative. Therm. Sci. Eng. Prog. 2021, 23, 100872. [Google Scholar] [CrossRef]
  6. Doğan, O. The influence of n-butanol/diesel fuel blends utilization on a small diesel engine performance and emissions. Fuel 2011, 90, 2467–2472. [Google Scholar] [CrossRef]
  7. Zhang, Z.; Tian, J.; Li, J.; Lv, J.; Wang, S.; Zhong, Y.; Dong, R.; Gao, S.; Cao, C.; Tan, D. Investigation on combustion, performance and emission characteristics of a diesel engine fueled with diesel/alcohol/n-butanol blended fuels. Fuel 2022, 320, 123975. [Google Scholar] [CrossRef]
  8. Zhang, Z.; Li, J.; Tian, J.; Dong, R.; Zou, Z.; Gao, S.; Tan, D. Performance, combustion and emission characteristics investigations on a diesel engine fueled with diesel/ethanol/n-butanol blends. Energy 2022, 249, 123733. [Google Scholar] [CrossRef]
  9. Maithomklang, S.; Sukjit, E.; Srisertpol, J. Experimental investigation of ethanol blended with waste plastic oil as an alternative biofuel in a diesel engine. Suranaree J. Sci. Technol. 2020, 27, 010022. [Google Scholar]
  10. Chandran, M.; Senthilkumar, T.; Murugesan, C. Characterization studies: Waste plastic oil and its blends. Energy Source Part A 2020, 42, 281–291. [Google Scholar] [CrossRef]
  11. Miandad, R.; Barakat, M.A.; Aburiazaiza, A.S.; Rehan, M.; Nizami, A.S. Catalytic pyrolysis of plastic waste: A review. Process Saf. Environ. Prot. 2016, 102, 822–838. [Google Scholar] [CrossRef]
  12. ASTM. Standard Test Method for Kinematic Viscosity of Transparent and Opaque Liquids:(and Calculation of Dynamic Viscosity); ASTM International: West Conshohocken, PA, USA, 2006. [Google Scholar]
  13. Luning Prak, D.J.; Simms, G.R.; Hamilton, M.; Cowart, J.S. Impact of low flash point compounds (hydrocarbons containing eight carbon atoms) on the flash point of jet fuel and n-dodecane. Fuel 2021, 286, 119389. [Google Scholar] [CrossRef]
  14. Trost, D.; Polcar, A.; Boldor, D.; Nde, D.B.; Wolak, A.; Kumbár, V. Temperature dependence of density and viscosity of biobutanol-gasoline blends. Appl. Sci. 2021, 11, 3172. [Google Scholar] [CrossRef]
  15. Wathakit, K.; Sukjit, E.; Kaewbuddee, C.; Maithomklang, S.; Klinkaew, N.; Liplap, P.; Arjharn, W.; Srisertpol, J. Characterization and impact of waste plastic oil in a variable compression ratio diesel engine. Energies 2021, 14, 2230. [Google Scholar] [CrossRef]
  16. Aengchuan, P.; Wiangkham, A.; Klinkaew, N.; Theinnoi, K.; Sukjit, E. Prediction of the influence of castor oil–ethanol–diesel blends on single-cylinder diesel engine characteristics using generalized regression neural networks (GRNNs). Energy Rep. 2022, 8, 38–47. [Google Scholar] [CrossRef]
  17. Wiangkham, A.; Ariyarit, A.; Aengchuan, P. Prediction of the influence of loading rate and sugarcane leaves concentration on fracture toughness of sugarcane leaves and epoxy composite using artificial intelligence. Theor. Appl. Fract. Mech. 2022, 117, 103188. [Google Scholar] [CrossRef]
  18. Chong, E.K.; Zak, S.H. An Introduction to Optimization, 4th ed.; Wiley: Hoboken, NJ, USA, 2013. [Google Scholar]
  19. Yin, E.; Li, Q. Multi-objective optimization of a concentrated spectrum splitting photovoltaic-thermoelectric hybrid system. Appl. Therm. Eng. 2023, 219, 119518. [Google Scholar] [CrossRef]
  20. Cepova, L.; Kovacikova, A.; Cep, R.; Klaput, P.; Mizera, O. Measurement system Anal-yses-gauge repeatability and reproducibility methods. Meas. Sci. Rev. 2018, 18, 20. [Google Scholar] [CrossRef] [Green Version]
  21. Kaewbuddee, C.; Sukjit, E.; Srisertpol, J.; Maithomklang, S.; Wathakit, K.; Klinkaew, N.; Liplap, P.; Arjharn, W. Evaluation of waste plastic oil-biodiesel blends as alternative fuels for diesel engines. Energies 2020, 13, 2823. [Google Scholar] [CrossRef]
  22. Singh, R.K.; Ruj, B.; Sadhukhan, A.K.; Gupta, P.; Tigga, V.P. Waste plastic to pyrolytic oil and its utilization in CI engine: Performance analysis and combustion characteristics. Fuel 2020, 262, 116539. [Google Scholar] [CrossRef]
  23. Oni, B.A.; Sanni, S.E.; Olabode, O.S. Production of fuel-blends from waste tyre and plastic by catalytic and integrated pyrolysis for use in compression ignition (CI) engines. Fuel 2021, 297, 120801. [Google Scholar] [CrossRef]
  24. Bizon, K.; Continillo, G.; Lombardi, S.; Mancaruso, E.; Vaglieco, B.M. ANN-based virtual sensor for on-line prediction of in-cylinder pressure in a diesel engine. Comput. Aided Chem. Eng. 2014, 33, 763–768. [Google Scholar]
  25. Heywood, J.B. Internal Combustion Engine Fundamentals, 2nd ed.; McGraw-Hill: New York, NY, USA, 2018. [Google Scholar]
  26. Oh, H.; Jung, J.; Bae, C.; Johansson, B. Combustion process and PM emission characteristics in a stratified DISI engine under low load condition. In Internal Combustion Engines: Performance, Fuel Economy and Emissions; IMechE; Woodhead: Sawston, UK, 2013; pp. 179–192. [Google Scholar]
  27. Adam, A.; Ramlan, N.A.; Jaharudin, N.F.; Hamzah, H.; Othman, M.F.; Mrwan, A.A.G. Analysis of combustion characteristics, engine performance and exhaust emissions of diesel engine fueled with upgraded waste source fuel. Int. J. Hydrogen Energy 2017, 42, 17993–18004. [Google Scholar] [CrossRef] [Green Version]
  28. Geng, L.; Bi, L.; Li, Q.; Chen, H.; Xie, Y. Experimental study on spray characteristics, combustion stability, and emission performance of a CRDI diesel engine operated with biodiesel–ethanol blends. Energy Rep. 2021, 7, 904–915. [Google Scholar] [CrossRef]
  29. Altun, Ş.; Öner, C.; Yaşar, F.; Adin, H. Effect of n-butanol blending with a blend of diesel and biodiesel on performance and exhaust emissions of a diesel engine. Ind. Eng. Chem. Res. 2011, 50, 9425–9430. [Google Scholar] [CrossRef]
  30. Kaewbuddee, C.; Wathakit, K.; Srisertpol, J. The Effect of n-Butanol to Waste Plastic Oil Fuel Blends Utilization on Engine Emissions of a Single Cylinder Diesel Engine. In Proceedings of the IEEE International Conference on Applied System Innovation 2018 IEEE ICASI 2018-Meen, Prior & Lam, Eds, Chiba, Japan, 13–17 April 2018; pp. 1224–1227. [Google Scholar]
  31. Ramalingam, S.; Rajendran, S. 14-Assessment of performance, combustion, and emission behavior of novel annona biodiesel-operated diesel engine. In Advances in Eco-Fuels for a Sustainable Environment; Azad, K., Ed.; Woodhead Publishing: Sawston, UK, 2019; pp. 391–405. [Google Scholar]
  32. Kaimal, V.K.; Vijayabalan, P. An investigation on the effects of using DEE additive in a DI diesel engine fuelled with waste plastic oil. Fuel 2016, 180, 90–96. [Google Scholar] [CrossRef]
  33. Rajasekaran, S.; Damodharan, D.; Gopal, K.; Rajesh Kumar, B.; De Poures, M.V. Collective influence of 1-decanol addition, injection pressure and EGR on diesel engine characteristics fueled with diesel/LDPE oil blends. Fuel 2020, 277, 118166. [Google Scholar] [CrossRef]
  34. Kalargaris, I.; Tian, G.; Gu, S. The utilisation of oils produced from plastic waste at different pyrolysis temperatures in a DI diesel engine. Energy 2017, 131, 179–185. [Google Scholar] [CrossRef]
  35. Jamrozik, A.; Tutak, W.; Grab-Rogaliński, K. Combustion stability, performance and emission characteristics of a CI engine fueled with diesel/n- butanol blends. Energies 2021, 14, 2817. [Google Scholar] [CrossRef]
  36. Awang, M.S.N.; Mohd Zulkifli, N.W.; Abbas, M.M.; Amzar Zulkifli, S.; Kalam, M.A.; Ahmad, M.H.; Mohd Yusoff, M.N.A.; Mazlan, M.; Wan Daud, W.M.A. Effect of addition of palm oil biodiesel in waste plastic oil on diesel engine performance, emission, and lubricity. ACS Omega 2021, 6, 21655–21675. [Google Scholar] [CrossRef]
  37. Lewis, C.D. Industrial and Business Forecasting Methods: A Practical Guide to Exponential Smoothing and Curve Fitting; Butterworth-Heinemann Scientific: Boston, MA, USA; London, UK, 1982. [Google Scholar]
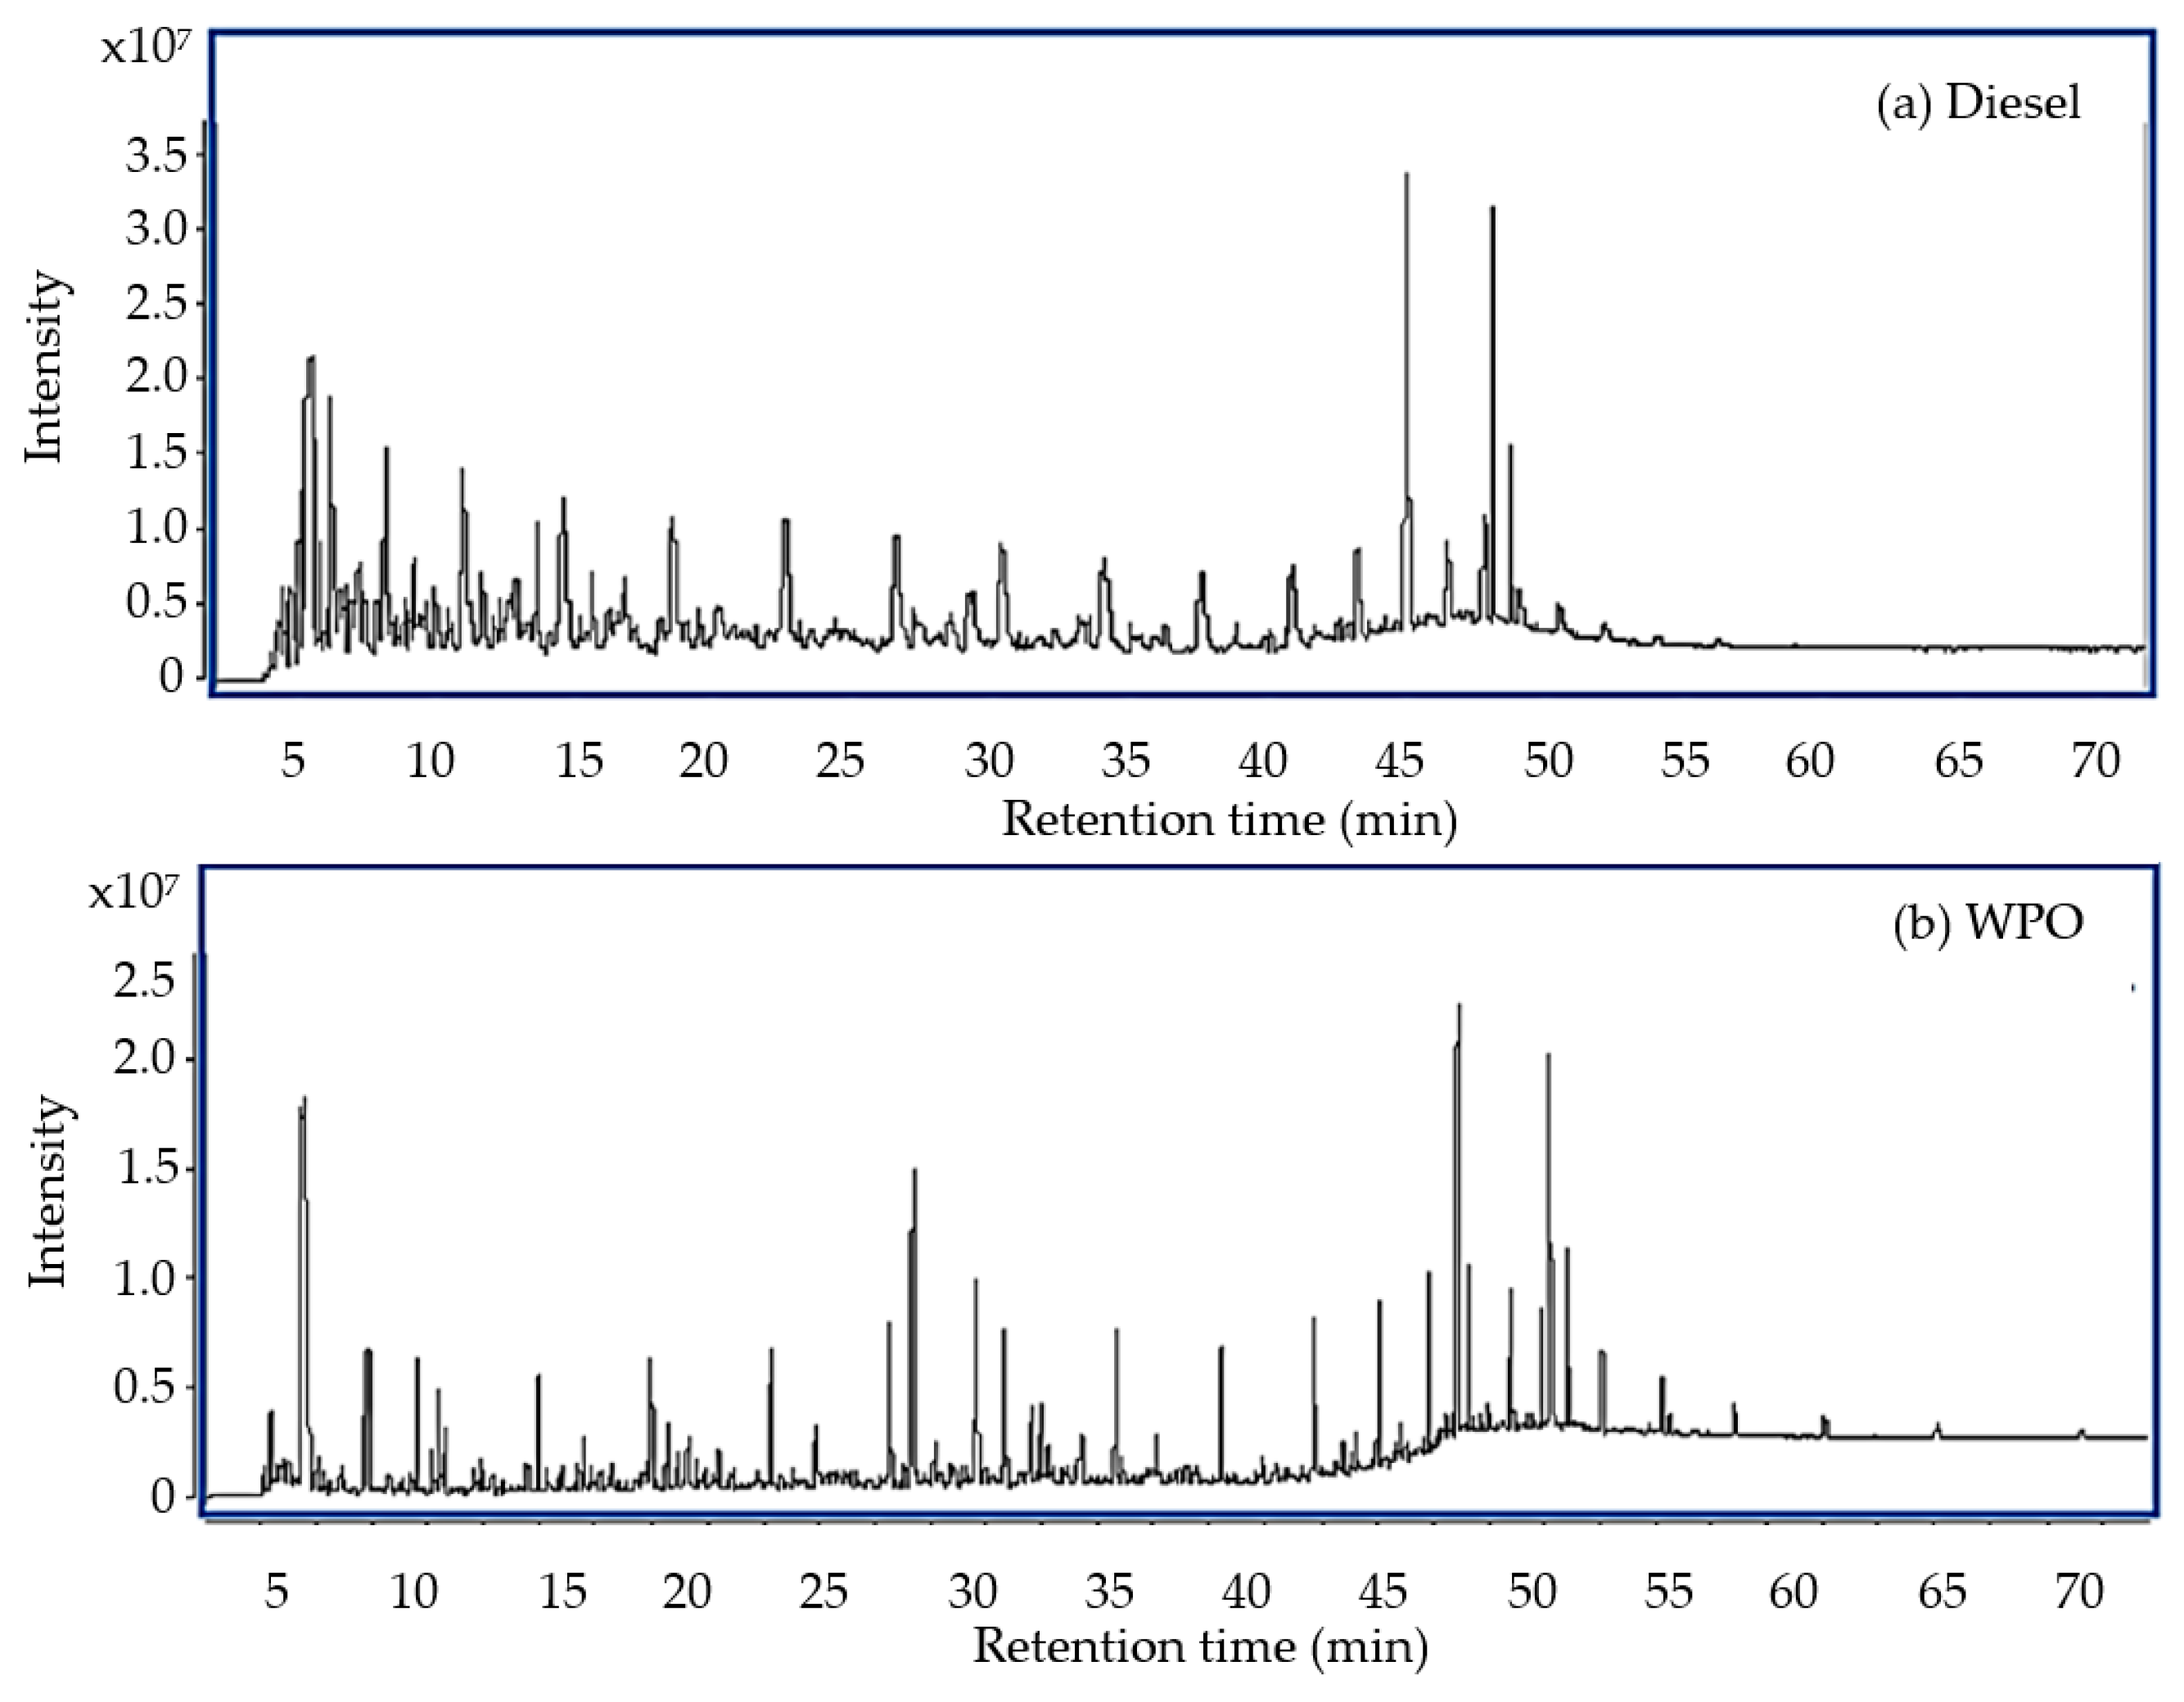
Figure 1. Total ion current chromatogram for diesel fuel and WPO.
Energies 16 01281 g001
Figure 2. Carbon number distribution in WPO and diesel fuel.
Energies 16 01281 g002
Figure 3. Schematic diagram of the experimental installation.
Energies 16 01281 g003
Figure 4. Implementation of the multi-objective optimization for the ratio of n-butanol and waste plastic oil blend.
Energies 16 01281 g004
Figure 5. Operation of multi-objective optimization for BU-blended oil conditions.
Energies 16 01281 g005
Figure 6. The result of the main effects and interactions of fuel types and engine load relative to brake-specific fuel consumption (g/kW-h).
Energies 16 01281 g006
Figure 7. Variations in brake-specific fuel consumption with engine loads.
Energies 16 01281 g007
Figure 8. Variation in brake thermal efficiencies with respect to engine load.
Energies 16 01281 g008
Figure 9. In-cylinder pressure variation of test fuels with a full engine load.
Energies 16 01281 g009
Figure 10. Variation in maximum pressures with engine loads.
Energies 16 01281 g010
Figure 11. Rate of heat release variations of the test fuels at full engine loads.
Energies 16 01281 g011
Figure 12. Variations in the maximum rate of heat release with engine loads.
Energies 16 01281 g012
Figure 13. Variation in the coefficient of variance Pmax with engine loads.
Energies 16 01281 g013
Figure 14. Variation in nitrogen oxide emissions with engine loads.
Energies 16 01281 g014
Figure 15. Variation in total hydrocarbon emissions with engine loads.
Energies 16 01281 g015
Figure 16. Variations in carbon monoxide emissions with engine loads.
Energies 16 01281 g016
Figure 17. Variations in carbon dioxide emissions with engine loads.
Energies 16 01281 g017
Figure 18. Multi-objective function results of engine performance from blended n-butanol with waste plastic oil via GRNN.
Energies 16 01281 g018
Figure 19. Multi-objective function results of emission from blended n-butanol with waste plastic oil via the GRNN algorithm.
Energies 16 01281 g019
Figure 20. Pareto frontier of the multi-objective optimization for the ratio of n-butanol and waste plastic oil blend.
Energies 16 01281 g020
Table 1. Description of test fuels used throughout this study.
Test FuelsDescription
DieselCommercial diesel fuel (B7: containing 7% biodiesel)
BU5Blend of 5% n-butanol and 95% waste plastic oil
BU10Blend of 10% n-butanol and 90% waste plastic oil
BU15Blend of 15% n-butanol and 85% waste plastic oil
Table 2. Chemical compound of diesel by GC–MS.
Retention Time (min)Chemical CompoundChemical FormulaConcentration (%)
4.35OctaneC8H180.94
4.49Cyclohexane, 1,4-dimethyl-C8H160.33
5.05NonaneC9H200.52
5.58Nonane, 4-methyl-C10H221.01
6.16DecaneC10H222.07
8.10UndecaneC11H242.28
9.13p-XyleneC8H100.57
9.88trans-2-Dodecen-1-olC12H24O1.76
10.93DodecaneC12H261.04
11.62Benzene, 1-ethyl-3-methyl-C9H120.45
13.55Benzene, 1,2,3-trimethyl-C9H120.54
14.50TridecaneC13H282.37
15.56Benzene, 1,2,4-trimethyl-C9H120.36
18.49TetradecaneC14H300.99
20.111-TetradeceneC14H280.33
22.55PentadecaneC15H320.33
26.53HexadecaneC16H342.63
30.37HeptadecaneC17H363.20
34.05OctadecaneC18H383.58
37.55NonadecaneC19H4013.76
40.80EicosaneC20H425.26
43.18HeneicosaneC21H443.64
44.96Hexadecanoic acid, methyl esterC17H34O21.57
46.43TricosaneC23H481.57
47.79Methyl stearateC19H38O23.73
48.0711-Octadecenoic acid, methyl esterC19H36O23.22
48.68Linoleic acid, methyl esterC19H34O23.01
49.03PentacosaneC25H520.50
50.44HexacosaneC26H542.72
52.10HeptacosaneC27H562.54
53.97OctacosaneC28H589.26
56.22NonacosaneC29H602.27
Table 3. Chemical compound of WPO fuel by GC–MS.
Retention Time (min)Chemical CompoundChemical FormulaConcentration (%)
4.31Pentane, 2,2,4-trimethyl-C8H180.94
4.39HeptaneC7H160.33
5.95NonaneC9H200.52
7.67DecaneC10H221.01
7.79TolueneC7H82.07
9.591-ButanolC4H10O2.28
10.12EthylbenzeneC8H100.57
10.35UndecaneC11H241.76
10.55Benzene, 1,2-dimethyl-C8H101.04
11.87Benzene, 1,4-dimethyl-C8H100.45
13.50Benzene, 1-ethyl-4-methyl-C9H120.54
13.89DodecaneC12H262.37
14.20MesityleneC9H120.36
15.56Benzene, 1,2,3-trimethyl-C9H120.99
15.83Dodecane, 4,6-dimethyl-C14H300.33
16.14Dodecane, 2-methyl-C13H280.33
17.97TridecaneC13H282.63
22.25TetradecaneC14H303.20
26.54PentadecaneC15H323.58
27.39α-GurjuneneC15H2413.76
29.63β-GurjuneneC15H245.26
30.64HexadecaneC16H343.64
31.57AlloaromadendreneC15H241.57
31.96γ-GurjuneneC15H241.57
34.60HeptadecaneC17H363.73
38.40OctadecaneC18H383.22
41.72NonadecaneC19H403.01
43.21Methyl tetradecanoateC15H30O20.50
44.04EicosaneC20H422.72
45.82HeneicosaneC21H442.54
46.87Hexadecanoic acid, methyl esterC17H34O29.26
47.29DocosaneC22H462.27
48.74TricosaneC23H481.88
49.91Methyl stearateC19H38O21.98
50.1911-Octadecenoic acid, methyl esterC19H36O28.76
50.30TetracosaneC24H501.69
50.80Linoleic acid, methyl esterC19H34O22.99
52.07PentacosaneC25H521.33
54.19HexacosaneC26H541.07
56.78HeptacosaneC27H560.81
60.01OctacosaneC28H580.67
64.08NonacosaneC29H600.50
Table 4. The physical and chemical properties of WPO and its blends.
Fuel PropertiesTest MethodTest Fuels
DieselWPOBU5BU10BU15
Kinematic viscosity @ 40 °C (cSt)ASTM D4453.443.072.572.562.46
Specific gravity @ 15 °CASTM D12980.8280.8000.7980.8030.805
API gravityASTM D129839.445.445.844.744.3
Density @ 15 °C (kg/m3)ASTM D1298827799800802804
Flash point (°C)ASTM D937836343230
Cetane indexASTM D97660.1868.9867.4964.0861.83
Gross calorific value (MJ/kg)ASTM D24045.3944.9844.5144.0343.45
Table 5. Technical specifications of the diesel engine.
Engine ParametersSpecifications
Engine model4JA1
Engine type4-cylinder, 4-cycle, water-cooled
Bore × Stroke93 mm × 92 mm
Compression ratio18.4
Displacement2449 cc
Rated power at 4000 rpm64.9 kW
Maximum torque at 2000 rpm171.5 N.m
Fuel injection typeDirect injection system with mechanical fuel injection
Number of fuel nozzle4
Fuel injection pressure18.1 MPa
Fuel injection timing14° bTDC
Table 6. The analysis of variance for results brake-specific fuel consumption (g/kW-h), using Adjusted SS for tests.
SourceDFSeq SSAdj SSAdj MSFp
Fuel Types46159.66159.61539.9543.970.000
Engine Load (N.m)4102,633.9102,633.925,658.59063.740.000
Fuel Types × Engine Load (N.m)161816.81816.8113.640.110.000
Error50141.5141.52.8
Total74110,751.9
S = 1.68253 R-Sq = 99.87% R-Sq (adj) = 99.81%
Table 7. Results of the gauge repeatability and reproducibility (GR&R).
Engine Performance or Emission FactorsGR&R (σ2Repeatability)σ2Total% of σ2Total
Brake-specific fuel consumption, BSFC2.272056.810.11
Brake thermal efficiency, BTE0.0208.7010.23
Nitrogen oxide, NOx0.0250.6923.61
Hydrocarbon, HC0.00000950.01202300.08
Carbon monoxide, CO0.02641.440.06
Carbon dioxide, CO20.00000630.000056011.25
Average2.56
Table 8. Results of multi-objective optimization via NSGA-II.
IndexEngine Load
(N.m)
BU Blend
(%)
Brake Thermal Efficiency
(%)
Nitrogen Oxides
(g/kW-h)
143.88112.47722.2825.339
237.45610.09219.1804.270
3103.6319.82827.4805.450
440.02912.95921.1954.869
539.9189.45119.4734.391
637.46410.09219.1804.270
740.00812.81320.7414.782
8103.21012.57226.7395.382
9103.37011.45327.4795.450
1044.33613.38722.2505.081
11101.36413.59026.2915.340
1239.99612.93420.4474.708
13103.6319.82827.4805.450
1439.9609.52819.9544.589
1542.31812.70322.2625.174
1639.94211.64919.6994.484
1739.97712.70220.0524.629
1840.07513.02121.8715.011
Disclaimer/Publisher’s Note: The statements, opinions and data contained in all publications are solely those of the individual author(s) and contributor(s) and not of MDPI and/or the editor(s). MDPI and/or the editor(s) disclaim responsibility for any injury to people or property resulting from any ideas, methods, instructions or products referred to in the content.