Abstract
The thermal management and reduction of energy consumption in cooling systems have become major trends with the continued growth of high heat dissipation data centers and the challenging energy situation. However, the existing studies have been limited to studying the influences of individual factors on energy saving and thermal management and have not been systematically summarized. Thus, this paper reviews the key factors in achieving thermal management and reducing energy consumption in each cooling system, the corresponding research, and optimization methods. To achieve these goals, in this paper, literature surveys on data center cooling systems are investigated. For data center air cooling, thermal management is mainly related to the uniform distribution of hot and cold air. Adjusting the porosity of perforated tiles can reduce energy consumption. For liquid cooling and free cooling systems, climate conditions, cooling system structural design, coolant type, and flow rate are key factors in achieving thermal management and reducing energy consumption. This paper provides the power usage effectiveness (PUE) values of the cooling systems in some cases. A summary of the key factors can provide directions for research on thermal management and energy reduction, and a summary of previous research can provide a basis for future optimization.
1. Introduction
In the last few decades, IT industries such as mobile telecoms, big data, and the Internet of Things have undergone rapid development and are needed in various fields [1]. As a result, the consumption of energy in data centers has experienced continuous and substantial growth due to data centers acting as the infrastructure for IT services. Despite the global financial crisis in 2008, the energy consumption of data centers increased by 56% between 2005 and 2010. Among them, the energy consumption of data centers in the United States has increased by nearly 20 times. The increase in energy consumption is driving the global energy crisis. It is important to note that the energy consumption of cooling in data center systems accounts for 30% to 50% of the total energy consumption [2]. The energy consumption share of each device is shown in Figure 1. For this circumstance, reducing cooling system energy consumption is more critical. Moreover, the safe operation of a data center depends on whether data center thermal management can be achieved, i.e., whether it can dissipate heat efficiently and maintain a uniform temperature distribution under safe conditions, which means that the cooling system needs to ensure efficient heat transfer capacity.
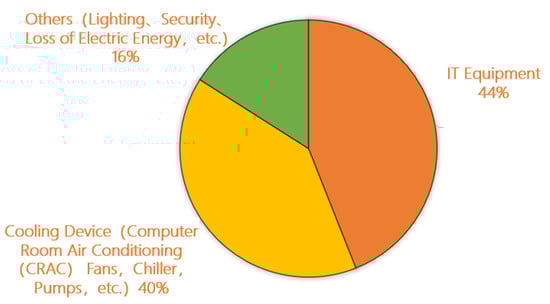
Figure 1.
Schematic diagram of data center energy distribution [3].
There are three major forms of data center cooling systems, namely, air cooling systems, liquid cooling systems, and free cooling systems. For air cooling systems, achieving thermal management is to obtain good airflow organization. In order to achieve good airflow organization, the size and location of barriers under the ventilation floor were adjusted by Sorell et al. [4] to increase the effective usable area, resulting in achieving a uniform distribution of airflow and enhancing the cooling efficiency. Fakhim et al. [5] closed cold aisles to restrict cold air in the server inlet, reducing hot and cold air mixing, which could reduce the maximum server temperature from 28 °C to 21 °C. Studies by Schmidt et al. [6,7,8] found that optimizing perforated tile structures and reducing tile opening areas helped to allow uniform airflow through the server. In terms of liquid cooling systems and free cooling systems, Ding et al. [9] compared the cooling capacity of annular thermosyphon under R22, R134a, and R410A by using an enthalpy difference laboratory. The results revealed that the heat transfer capacity of R410A was 8.7% and 4.8% higher than that of R134a and R22, respectively. In order to reduce the possibility of chilled water leakage, an in-line cooling component was designed by Cho et al. [10], which included water–refrigerant heat transfer and refrigerant–air-in-room heat transfer, ensuring safety, improving cooling efficiency, and reducing the PUE of the improved cooling system from 1.563 to 1.361 (a reduction of 43.5%). The existing research has just paid attention to the impacts of individual elements on achieving thermal management and low energy consumption, and, even in reviews, there are few summaries of the key factors affecting the cooling capacity and energy consumption of all cooling systems. The review by Zhang et al. [2] summarized the principles of various cooling systems as well as the design and innovation of cooling systems for reducing energy consumption in existing research. Methods for liquid cooling systems to improve cooling efficiency and for free cooling systems to improve energy efficiency were analyzed by Habibi et al. [11].
The purpose of this paper is to provide key factors, related literature studies, and optimization methods for cooling systems. In this paper, firstly, the key factors regarding how to keep the uniformity of temperature distribution in data centers and raise the heat transfer coefficient and energy efficiency under the conditions of using air cooling systems are offered. Moreover, the correlational and concrete studies of these factors are summarized in Section 2. Then, in Section 3 and Section 4, for free and liquid cooling systems in data centers, the primary elements affecting thermal management performance and energy consumption are discussed by collecting previous studies, and the specific research on key factors and optimization methods for cooling systems in the previous literature are discussed.
2. Air Cooling for Data Centers
This kind of technique can be achieved via the way that the chilled air is sent from the underfloor air supply system into the cold aisle. Then, the cold air, after passing through the servers and absorbing the heat dissipated from the servers, is, in turn, discharged into the distributed hot aisle as well as the computer room air conditioning (CRAC). The heated air is finally cooled by the water in the CRAC unit. The cycle is repeated again. For guaranteeing the speed of heat transfer, new data centers do not share CRAC with the building they are located in [12]. Separating hot and cold channels instead of sharing a single channel is conducted to avoid mixing hot and cold air and ensure the cooling efficiency of the air cooling system. The air cooling system in a data center is divided into a room-level cooling system and a row-level cooling system. Figure 2 illustrates the structural designs of both cooling systems. Unlike room-based cooling systems, the air conditioners in row-based cooling systems are usually installed in a row between rack servers or above the cold aisles, with the air from under the floor being fed directly into the cold aisles between the racks rather than being mixed with the original air throughout the data center [13]. Hence, row-based cooling systems, reducing the possibility of mixing cold air with hot air, are widely used in data centers due to the shorter airflow paths and the more sufficient cooling of the cooling target than room-based cooling systems. The combination of hot and cold aisles includes hot-cool-hot and cold-hot-cool aisle layouts. The cold-hot-cool aisle layout can improve the heat balance by at least 9% in row-based cooling systems, which makes it applicable.
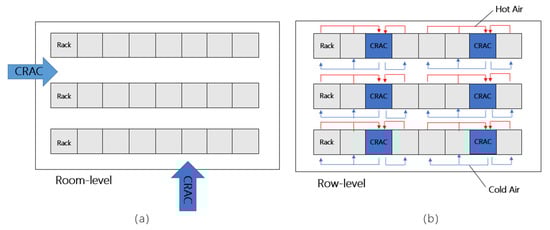
Figure 2.
Two types of room cooling systems: (a) room-based cooling system; (b) row-based cooling system [14].
2.1. Thermal Management Performance
2.1.1. Uniformity of Temperature Distribution
The uniformity of temperature distribution within a data center and the number of localized hot spots are critical factors for determining the success of thermal management. Hot and cold air mixing and localized hot spots are associated with a non-uniform plenum airflow distribution, which is closely linked to the pressure field of the plenum airflow. There are several dominant elements that determine the pressure field, such as the height of the raised floor, the degree of openness of the perforated tiles, and the deployment of obstacles in the plenum ventilation system [15]. A higher floor height results in a uniform server temperature distribution and efficient cooling, which represents the reduced likelihood of server overheating. The recommended floor height is 1.0–1.2 m, 0.6–0.8 m, and 0.4–0.6 m in open air cooling, a closed cold aisle structure, and a closed hot aisle structure, respectively, in [16]. A design of variable perforated tiles is proposed by Wang et al. [17]. Increasing the opening of the perforated tiles at the CRAC outlet and decreasing the opening before entering the cold aisle can availably alleviate the non-uniform distribution of plenum airflow without increasing pump power.
2.1.2. Cooling Efficiency
Reducing server temperatures to keep them at a safe operating temperature is the primary goal to be achieved by a cooling system. The factors influencing air cooling efficiency are analyzed by Oró et al. [18] based on fluid dynamics software. The results show that hot air mixing, a cold air bypass, and negative pressure at the air inlets of the split floor in a data room are the main factors affecting the efficiency. Hot and cold air mixing can be solved by closing the cold aisle, optimizing the air inlet arrangement, blocking the gap between racks, adding floor dividers, and adding ceiling vents [19]. Schmidt et al. [6] observed that the hot and cold air mixability is minimum and the optimal air cooling is obtained when the distance between the air inlet and the ceiling is 1 m by changing the position of the air inlet based on numerical simulations. The supply/return heat index (SHI/RHI), rack cooling index (RCI), and return temperature index (RTI) are commonly used as measures in today’s research, with SHI and RHI defined as follows:
where Q is the total amount of heat dissipated by all racks in the data center. δ Q is the enthalpy rise of the cold air before it enters the rack.
The supply heat index parameter SHI is the ratio of the heat gained by the cold aisle air before it enters the rack to the total heat gained by the air leaving the rack, while the rack heat index parameter RHI is the ratio of the total heat dissipated by all racks to the total heat gained by the air leaving the rack. SHI and RHI indicate the degree of mixing of hot and cold air.
The relationship between SHI and RHI can be expressed by (4). A better separation of hot and cold air is achieved when SHI tends toward 0 and RHI tends toward 1 [20].
The RCI is used to measure the degree of overheating and overcooling of a rack, including RCIHI and RCILO, and is defined as follows:
where Ti is the average temperature of each rack inlet; n is the total number of rack inlets; Tmax−rec is the maximum recommended temperature according to some guidelines or standards; Tmin−rec is the minimum recommended temperature according to some guidelines or standards; Tmax−all is the maximum allowed temperature according to some guidelines or standards; and Tmin−all is the minimum allowed temperature according to some guidelines or standards. Theoretically, the RCIHI should be equal to 1 to avoid overheating the rack.
The RTI is used to characterize the extent of cold air bypass and hot air return calculated by Equation (7). In order to minimize the extent of cold air bypass and hot air return, RTI should approach 1.
where Tr is the hot air return temperature, K; Ts is the cold air supply temperature, K; and ΔTe is the temperature difference before and after the air enters the rack [17].
Nada, S.A. et al. [21] experimentally tested the effects of three cold aisle arrangements on the degree of hot and cold air mixing in a data center.
The authors observed that compared with the free open aisle, the air intake temperature in the fully enclosed aisle dropped by 11%. When the rack power was 250 W, the SHI of the fully enclosed aisle was 0.03, and the RHI was 0.97, while the SHI of the free open aisles was 0.13, and the RHI was 0.84. Therefore, the SHI of the fully enclosed aisle increased and the RHI decreased significantly, which means the degree of mixing of cold and hot air in the fully enclosed structure decreased. Although the semi-enclosed cold aisle reduced the average intake temperature and average surface temperature, the mixing tendency of hot and cold air increased compared with the fully enclosed aisle. Furthermore, Fakhim et al. [5] experimented and numerically simulated to analyze temperature distribution and observed that the number of local hot spots is reduced and the cooling effect is improved by containing a cold aisle, blocking the blank spaces between the racks, making the CRAC unit’s location perpendicular to and aligned with the hot aisles, and adding ceiling vents and ceiling ducts. The combination of 100 cm ducts and cold aisle containment can fulfill the smallest SHI of 0.16 and the maximum temperature of up to 33.1 °C.
2.2. Energy Saving and Consumption Reduction of System
In the face of increasing energy scarcity, changes to the structural designs of cooling systems and the timely recovery of waste heat can help to improve energy efficiency and reduce energy consumption. At present, power usage effectiveness (PUE) is used as a metric for efficiently measuring and comparing data center energy efficiency and is defined as the ratio of the total power drawn by a data center facility to the power used by the IT equipment in that facility:
The total power drawn by a data center facility includes the energy consumed by the cooling system. Therefore, in order to yield higher data center energy efficiency, there is a need for all the energy consumed by the facility to be used to power the IT equipment and the energy consumption of the cooling system to be minimized. When the consumption of the cooling system decreases, the energy efficiency rises, and the PUE approaches one.
Researchers have achieved cooling system consumption reduction by adjusting structural parameters. Fulpagare et al. [22] built an air cooling system for a small data center to study the cooling effect using perforated tile porosity, air conditioning fan speed in the server room, cooler return water temperature, and thermal load of the partially closed and closed cold aisle containment as variables. The results showed that the lowest PUE of 1.38 was achieved at full thermal load using 50% perforated tiles for local sealing.
3. Free Cooling System
Free cooling systems are among the most effective energy-saving systems, which refers to a system using natural resources such as air and natural water for data center cooling.
3.1. Air-Side Economizers
Air is widely used to cool data centers because of its features, such as a low acquisition cost, a stable nature, such that air does not react at high temperatures, and high mobility, which means air-side economizers are useful for achieving heat dissipation. Air-side economizers can be implemented in both direct and indirect ways according to whether outdoor air is directly introduced into the data center for cooling. Air cooling can generally be achieved for a 30 kW single rack.
3.1.1. Direct Air-Side Economizers
Direct air cooling is the idea of drawing outside air into a data center for cooling equipment when the outside air temperature is lower than the indoor air temperature. The circulating air in the room is cooled by a CRAC unit until the supply of cold air can last for a long period of time [23]. The cooling system principle is plotted in Figure 3.
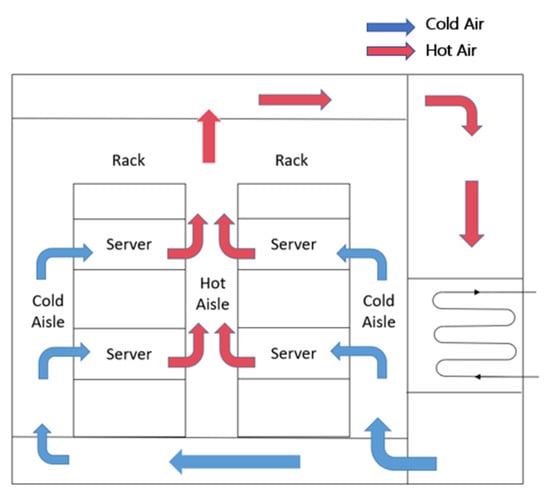
Figure 3.
Direct air-side economizers.
Applicability of System
Direct air cooling has strict air quality requirements. Humid air, particulate matter in the gas, and contaminants limit the use of direct air cooling [24]. The presence of high humidity and contaminants increases the risk of equipment operation. Increased concentrations of particulate matter can damage the electronic equipment in data centers and reduce their usability; hence, filtration or deposition of particulate matter is often used to reduce the risk of damage to electronic equipment. Nevertheless, this can also lead to increased investment costs [25]. The suitability of air cooling varies from region to region. Coles et al. [26] conducted a test on local outdoor air that was introduced into five data centers in the USA and India for cooling, and it was shown that the local air met the requirements for direct air cooling and data centers could be safely cooled without damaging the equipment. In addition, Hong et al. [27] determined that Kunming, Guangzhou, and Shanghai have an average of over 3000 h per year available for direct air cooling, whereas Beijing and Harbin are not suitable for cooling with direct air cooling due to severe haze and high levels of dust in the air.
Energy Saving and Consumption Reduction of System
Compared with conventional air conditioning cooling units, a direct air-side economizer does not require a refrigeration unit to produce low-temperature refrigerants but directly introduces external low-temperature air, which reduces power consumption and simplifies the system. Facebook’s data center in Oregon took advantage of this cooling system, with a PUE of 1.08. Geng et al. [28] introduced air directly into the Kunming data center and optimized the energy efficiency, resulting in the PUE being reduced from 1.9 to 1.56. The energy-saving effects of different cooling systems in data centers were analyzed based on the reference model set by the Seoul Municipality by Cho et al. [29]. The results showed that a direct cooling cycle can save about 68% of energy, whereas an indirect air cooling cycle can save 50% of energy, and a water-side cooling cycle can save 15%, which demonstrates that direct air cooling has good energy-saving properties.
The local climatic condition is one of the decisive factors in energy saving because direct air cooling is not suitable when the humidity is extremely high or low. The longer the cooling method is used with the shorter cooling time using vapor compression, the better the energy-saving effect. Siriwardana et al. [23] adopted weather data from 20 weather stations in Australia to analyze the potential for data center direct air cooling. The study showed that direct air cooling can only be used for long periods of time in dry and cold areas and not in hot and humid tropical areas such as Harwin and Townsville. Oró et al. [30] analyzed the energy-saving potential of using air cooling in data centers in five climate zones. By measuring the expenditure, a conclusion can be made that the cooler climates of areas where direct air-side economizers can be utilized for a longer period of time will decrease energy consumption by 15–22%; however, overly dry and humid areas have less applicability for this cooling method due to the increased power consumption and cost caused by the need for humidification or dehumidification. The Tokyo Data Center was cooled via a direct air cooling system in combination with evaporative cooling technology and IT equipment waste heat recovery technology [31]. Evaporative cooling technology uses water evaporation to absorb heat dissipated from the air and to increase the air humidity to an appropriate value, while IT equipment waste heat recovery transfers the waste heat generated by the equipment to the air, heats the air, increases the temperature, and reduces the relative humidity to a suitable level. The combined system offers annual energy savings of 20.8% compared with conventional air-conditioning and refrigeration systems. In addition, a drop in indoor temperature reduces the effect of energy saving, and for every 2 °C drop in temperature, energy savings decrease by 2.8–8.5%.
3.1.2. Indirect Air-Side Economizers
Indirect air-side economizers refer to the exchange of outdoor air with indoor hot air through a heat exchanger, bringing cold energy to the indoor air in order to cool the servers. The principle of the most typical rotary wheel indirect air cooling system is shown in Figure 4.
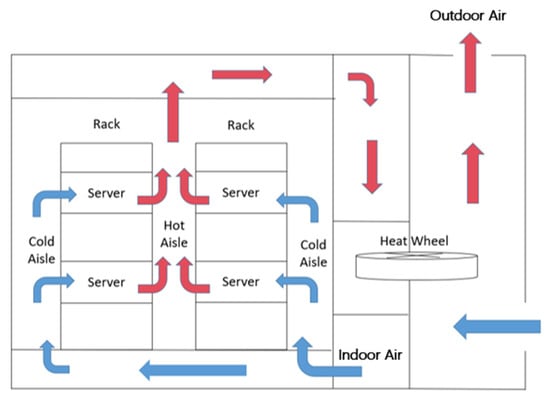
Figure 4.
Wheel indirect air cooling system [32].
Outdoor air does not enter the data center directly, helping to prevent harmful substances such as dust and smoke from entering the data center [33]. However, the heat transfer resistance between air and air will increase, resulting in the heat transfer area needing to be increased. An indirect evaporative cooling air conditioning unit was built in the Guang Ming District of Shenzhen to cool the data center, with a PUE value of 1.249 and a single cabinet power of 5.3 KW [34]. Efficient heat transfer between indoor and outdoor air is the key link to determining the energy-saving effect of a system. Ham et al. [32] compared the cooling effects of nine kinds of air-side heat exchangers in data centers. Compared with the traditional cooling system in data centers, the total cooling energy of the energy-saving device can be commonly saved by 47.5% to 62%. Among the nine types of cooling systems, indirect air-side economizers using an efficient heat exchanger can save 63.6% of the energy, while indirect air energy-saving devices using an inefficient heat exchanger can save the least energy. There are many kinds of heat exchangers. In previous studies, it was found that plate heat exchangers are more suitable for indirect air cooling. In the communication base station in Beijing, when the outdoor temperature is low enough, a plate heat exchanger is used to discharge the excess heat of the communication equipment. Compared with traditional air conditioning refrigeration, this cooling method can save 29% of the electricity consumption [35].
3.2. Water-Side Economizers
3.2.1. Direct Water-Cooled System
To provide sufficient cooling capacity for a data center, a direct water-cooled system uses natural cold water such as seawater and lake water to achieve direct cooling through a heat transfer piping facility. The system principle of the seawater cooling module is proposed as shown in Figure 5, whereby the cooling water absorbs the heat from the module and transfers it to the seawater after entering the heat exchanger. The kinetic energy of the seawater flow is captured and used to drive the cooling pump. Nonetheless, the system takes into account the effects of waves and weather, so it is not suitable for use in developing countries.
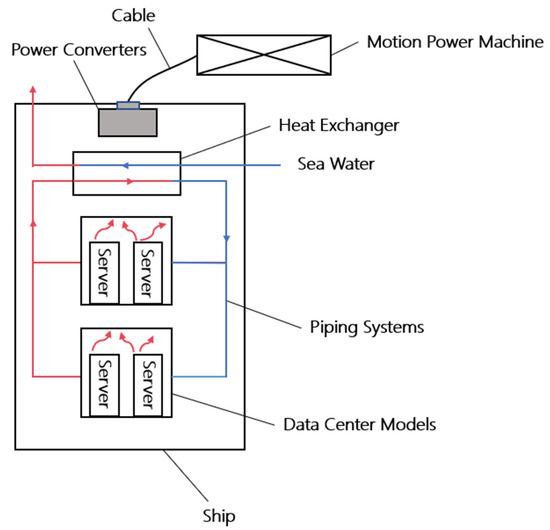
Figure 5.
Seawater cooling system [39].
Thermal Management Performance
Each server in a data center operates differently and requires different amounts of cooling. Therefore, Chen et al. [36] used seawater as a cooling source to exchange heat with chilled water and return water through plate heat exchangers on the seabed to achieve cooling of the data center. Then, the fixed water supply pump was changed to a mobile water supply pump to provide the corresponding cooling water flow to the server with different heat dissipation, and a mixed integer linear model was also established to obtain the optimal cooling water flow so as to improve the heat dissipation performance and reduce the occurrence of local hot spots. The improved system could make the surface temperature distribution of the data compartment more uniform.
Energy Saving and Consumption Reduction of System
The Dong Jiang Lake Data Center in Zi Xing City, Hunan Province, utilizing lake water for cooling, does not require mechanical refrigeration for 90% of the year, whereby the annual average PUE value is 1.1 [37]. Reducing the energy consumption of a cooling system is the main purpose of cooling with natural water sources. An energy optimization method based on a genetic algorithm was developed by Ling et al. [38] to optimize the temperature difference between the cooling water and the temperature of the supplied cooling water, which reduced the final energy consumption by up to 33.1%. However, due to the limitation of geographical factors and the requirements of environmental protection, this kind of cooling method is not universally applicable [39].
3.2.2. Air-Cooled System
An air-cooled system utilizes outdoor air in the dry cooler to absorb the heat of the circulating water in the computer room air handler (CRAH) device when the outdoor wet bulb temperature is low enough, resulting in the circulating water being cooled and re-entering the CRAHdevice to provide cooling capacity for the data center, which reduces or even eliminates the use of mechanical cooling and achieves the purpose of energy saving. The schematic of this system is depicted in Figure 6. In contrast, another conventional air-cooled system integrates a dry cooler with an air-cooled chiller, as shown in Figure 6. The air-cooled chiller is based on the principle of duplicating coolers to achieve redundancy, thereby increasing the heat exchange area and improving the cooling capacity, and the integration of the two coolers can reduce the footprint of the system.
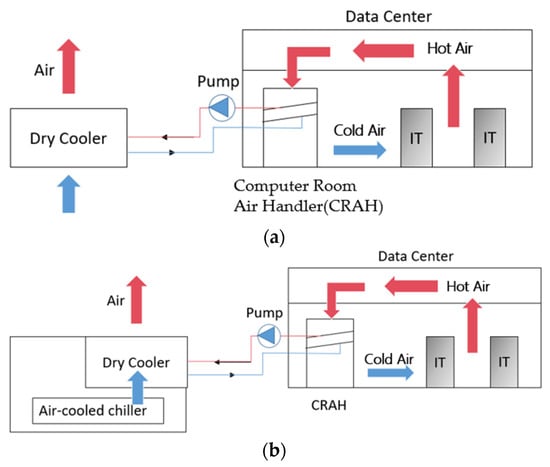
Figure 6.
Two types of air-cooled systems working as water-side economizers: (a) independent dry cooler; (b) integrated dry cooler with air-cooled chiller.
3.2.3. Cooling Tower System
After cooling via a cooling tower, the cooling water enters a plate heat exchanger or chiller to cool the cold water flowing through the CRAHunit, and then the cold water is cooled down and re-enters the CRAHunit to cool the air in the data center to realize circulating refrigeration. The schematic of this system is depicted in Figure 7.
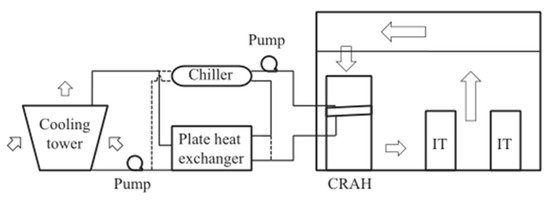
Figure 7.
Cooling tower system [32].
Depending on the outdoor wet bulb temperature, the system switches to full free cooling, partial free cooling, or mechanical cooling. The plate heat exchanger is turned on and the chiller is turned off in full free cooling mode, whereas the plate heat exchanger is turned off and the chiller is turned on in mechanical cooling mode. The system is divided into a series system and a parallel system according to whether the cold and cooling water pass through the plate exchanger and the chiller at the same time under partial free cooling conditions. At that time, the cold and cooling water in the tandem system pass sequentially through the plate heat exchanger and chiller, while the cold and cooling water in the parallel system pass only through the chiller or plate heat exchanger [40]. The system schematic and valve control are articulated in Figure 8 and Figure 9 and Table 1 and Table 2.
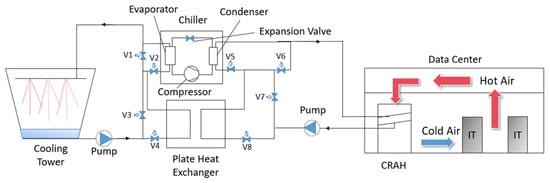
Figure 8.
Plate heat exchangers in series with chillers.
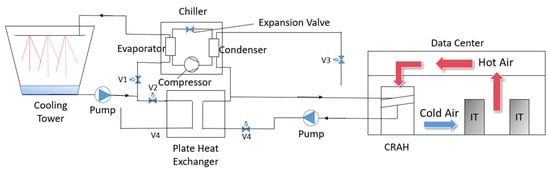
Figure 9.
Plate heat exchangers in parallel with chillers.

Table 1.
Equipment and valve operating status in series system [40].
Table 2.
Equipment and valve operating status in parallel system [40].
Ling et al. [41] developed an annual energy consumption model for a cooling tower system using lake water as the cooling source and evaluated the energy consumption of this cooling unit under different loads. Aiming to ensure the accuracy of the measurements, this model took into account the effects of the dynamic heat dissipation characteristics of servers, lake water temperature, outdoor weather conditions, and cooling plant thermal performance. The results showed that the average energy efficiency ratio of the cooling equipment ranged from 16.8 to 49.3, and the average PUE value ranged from 1.11 to 1.15 under 4 types of load factors, indicating that the cooling tower system was effective for saving energy.
Improvement of Cooling Capacity
The spray density and packing distribution of a cooling tower can be optimized to enhance the heat exchange between air and cooling water for providing lower-temperature cooling water to the plate heat exchangers and chillers. Huang et al. [42] used the NSWCT97 calculation program to optimize spray density and packing distribution. The cooling effect (temperature difference between before and after water cooling) temperature difference between before and after cooling of water cooling was increased by 0.7 °C compared with a uniform filler and uniform drench equipment and by approximately 0.3 °C compared with drench-only equipment.
Energy Saving and Consumption Reduction of System
Energy saving in cooling towers depends on extending the time of complete full free cooling and reducing the use of compressors in chillers. Li et al. [43] developed a model-based optimization method based on a cooling tower system to obtain the optimal free cooling switching point for different cooling load ratios to operate the system in full natural cooling mode as far as possible, and to obtain the optimal cooling tower approach temperature for the ambient wet bulb temperature. The results showed that via optimization, more than 100,000 kWh of energy can be saved practically throughout the year in different climate zones.
In addition to the cooling water, the chilled water flow rate and inlet temperature of CRAC units also have optimal values in terms of energy saving. Taking the Tianjin data center as an example, the optimal values for the above parameters could be obtained through building a heat dissipation model, a hybrid thermal management model, and an energy consumption model, which could achieve 21.3% energy savings and a 4.43% PUE reduction [44]. In addition to this, Alt et al. [45] combined a cooling tower system with a solar absorption cooling system, whereby solar collectors absorbed heat to power absorption chillers. Cooling water for the internal cooling cycle was supplied by the absorption chillers, and the cooling tower system restarted to supply cooling water at night when there was no solar supply. This system has been widely studied due to its good energy saving properties.
4. Liquid Cooling Systems
The cooling capacity of air in data centers is only about 37 W/cm2, representing air as having a low heat dissipation rate [11]. With the advent of high-performance processors, air cooling systems cannot meet the demand for processor cooling, so liquid cooling systems are gradually being implemented in data center cooling by virtue of the fact that liquid has a higher heat transfer coefficient.
4.1. Indirect Liquid Cooling
Indirect liquid cooling is the exchange of heat between a heat source and the coolant without contact. The cold water cooled by the external chiller is supplied by the coolant distribution unit (CDU) to the internal closed-loop cooling installed in the electronic device for cooling down electronic equipment, as shown in Figure 10. Traditional indirect cooling methods include cold plates and water blocks. The main chips of the server are cooled by cold plates, while other devices are still cooled by air cooling, enhancing heat dissipation. Although cold plates can only cool single racks of less than 45 k W, they are energy efficient and quiet. In terms of cost, this method does not require expensive water-cooling units and thus has some advantages over pure liquid cooling [46]. At present, the main focus of the enhancement of heat transfer characteristics of cold plates is on the properties of the porous medium of heat exchangers and the design of microchannel heat sinks. The PUE of a data center was decreased by 1.17–1.30 with enhancing heat dissipation in [47].
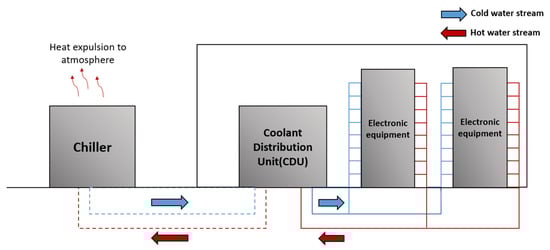
Figure 10.
The schematic diagram of indirect water cooling system [11].
4.1.1. Single-Phase Cooling
Single-phase liquid cooling means that the coolant does not undergo a phase change as it absorbs heat. Water can be used as a common coolant. Studies of dissipation enhancement on single-phase water-cooling methods have focused on the porous media properties of cold plates and the design of microchannel radiators. Singh et al. [48] designed a sintered porous heat sink for compact microprocessors that consists of rectangular channels made of 40% porosity and 1.44 × 10¹¹ m2 sintered porous copper. The cooling medium is water. The heat sink can achieve a heat removal of 2.9 W/cm2, and the effective thermal conductivity can be up to 32 W/(m-K). An enhanced microchannel heat sink with sectional oblique fins was also designed for thermal performance studies, which showed that the new heat sink had an enhanced heat transfer capability compared with conventional microchannel heat sinks. In particular, the enhanced system had a better heat transfer ability with smaller oblique angles and a smaller oblique fin pitch, and the best heat transfer performance was achieved at a fin pitch of 100 μm and an angle of 27° [49].
4.1.2. Two-Phase Cooling
Two-phase fluid cooling refers to the refrigeration of a cooling fluid by means of latent heat of phase change. Dielectric fluids and refrigerants with low boiling points can be used as cooling fluids [50]. In the current research, improving the structure of microchannel heat exchangers to achieve improved heat transfer performance has become the main development direction for two-phase boiling heat transfer. In addition, the presence of porous media is beneficial for strengthening the heat transfer on the boiling surface and for improving the thermal management performance of electronic devices. Over the years, many studies have been carried out on the application of porous materials in two-phase flow cooling systems [51]. Agostini et al. [52] developed a pump-driven two-phase cooling system containing a multi-microchannel silicon heat sink with R236fa as the cooling medium and studied the cooling system’s thermal characteristics. As shown in the study, the chip could be kept below 52 °C after cooling without overcooling, and the heat flux of the heat sink ranged from 24.2 to 222 W/cm2. Additionally, Zhao et al. [53] utilized a horizontal foam metal-filled tube with R134a as the cooling medium to study the heat transfer characteristic. As a result, by reducing the metal foam cell size, the heat transfer coefficient increased substantially, which not only dealt with more surface areas and boiling sites but also related to strong flow mixing. Moreover, the heat transfer coefficient of the copper foam tube was three times that of the ordinary copper tube.
4.1.3. Heat Pipe Cooling
Heat pipe cooling is a passive two-phase cooling method in which the coolant evaporates at the evaporating end of the heat pipe, flows to the condensing end via differential pressure, condenses, and exothermically generates liquid coolant again at the condensing end, and, eventually, the coolant returns to the evaporating end of the heat pipe via gravity (thermosiphon) or capillary action (wicked heat pipe) [54]. Common coolants include water, methanol, acetone, ammonia, R141b, NF, or SiO2-H2O, while water and ethanol are generally used in condensers to cool the condensing end of the heat pipe [55]. Heat pipe cooling offers efficient heat transfer with thermal conductivity several orders of magnitude higher than solid materials and reduces the possibility of leakage within the data centers at the same time. Apart from these advantages, heat pipes are highly efficient passive devices with simple constructions and have a high reliability and implementation ability for long-distance cooling, with no need to provide additional pumps, and moving parts [56,57,58,59]. In terms of cooling capacity, heat pipes are not significantly improved compared with cold plates [60].
Thermal Management Performance
Ding et al. [61] summarized the important influencing factors for loop thermosyphon (the filling ratio (FR) and coolant type). Scholars observed that a suitable FR should keep a system from overheating or subcooling, and CO2, whose heat transfer ability is 22–25% higher than that of R22, allows efficient heat transfer. Ahmadou et al. [62] designed a heat pipe with an inclined condenser for cooling the evaporated coolant to study the cooling performance of this heat pipe, using pentane as the coolant. The results showed that a heat pipe cooling system can carry twice the heat load of a conventional cooling system, enabling it to cool data centers with higher heat flow densities. The principle is illustrated in Figure 11.
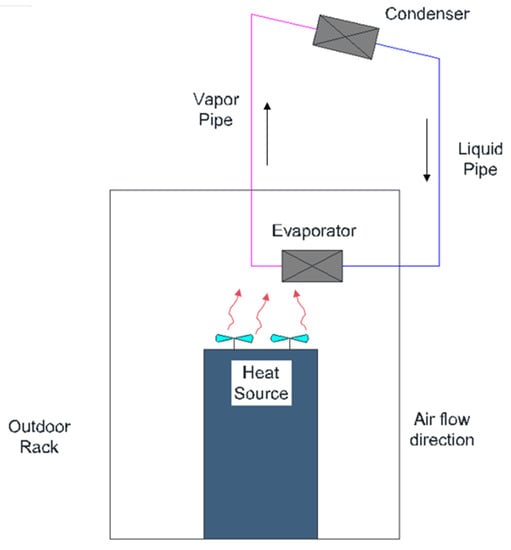
Figure 11.
Thermosiphon circuits in outdoor racks for cooling telecommunications equipment [62].
Energy Saving and Consumption Reduction of System
The energy-saving capability of a heat pipe is mainly related to the heat pipe structure as well as the coolant. A looped thermosiphon cooling system was constructed to charge CO2 and R410A, respectively, by Ding et al. [63] to study the operating characteristics of the system. The results showed that the PUE of CO2 was reduced by 0.013 compared with R410A throughout the year. A looped thermosiphon with a coupled compressor was proposed by Han et al. [64,65]. This heat pipe has two modes of operation, VC and TS. In this study, a new mode-switch valve and the design methods of the connection pipe and evaporator were used for the heat pipe, which increased the circulating flow of the two modes and especially the cooling capacity of the TS mode. The optimized system can reduce energy consumption by 34.3–36.94%. The system principle is shown in Figure 12.
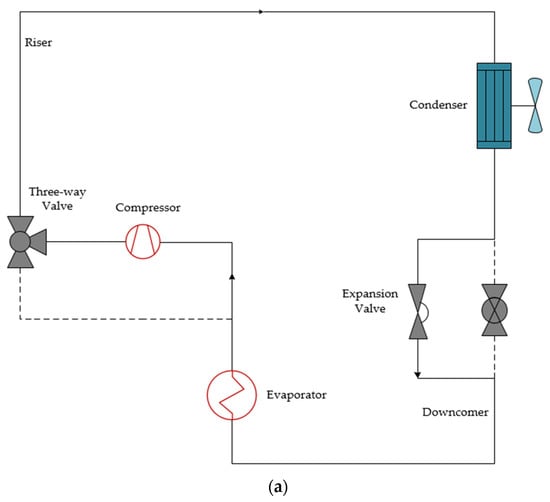

Figure 12.
Two modes of operation for combined cooling systems proposed by HAN et al.: (a) VC mode; (b) TS mode [64,65].
4.2. Direct Liquid Cooling
In direct liquid cooling, the coolant is in direct contact with the electronics for heat transfer, so it is necessary to ensure that the coolant is a dielectric fluid. Compared with indirect cooling systems, direct cooling has two advantages: (1) the coolant has electrical insulation, which can ensure the safety of electronic equipment; (2) indirect cooling needs to determine a specific liquid pipelines layout size according to the cooling load, but direct cooling overcomes these shortcomings and can be flexibly modified according to different cooling loads. Indirect liquid cooling mainly includes the following three forms.
4.2.1. Liquid Immersion Cooling
Liquid immersion cooling is characterized by high heat dissipation efficiency, uniform temperature, low noise, no pollution, high reliability, energy saving, high system safety, and a significant reduction in floor space compared with air cooling. Liquid immersion cooling is split into single-phase liquid immersion cooling and two-phase liquid immersion cooling. In single-phase liquid immersion cooling, the server is immersed in a closed container with a coolant that absorbs heat from the surface of the server and then flows into the heat exchanger where the heat is discharged. Finally, the server achieves cooling in the closed container. The temperatures of liquid coolant in front of CPU and under the outlet location are commonly measured to analyze the cooling capacity of the coolant under different power of CPU. The measuring position are shown in Figure 13a,b. Unlike single-phase liquid immersion cooling, the coolant of two-phase liquid immersion cooling absorbs heat from the surface of the server and then evaporates. Due to the existence of latent heat of phase change, two-phase liquid immersion cooling has a better heat dissipation capacity [66]. The schematic diagrams of single-phase and two-phase liquid immersion cooling are presented in Figure 13 and Figure 14.
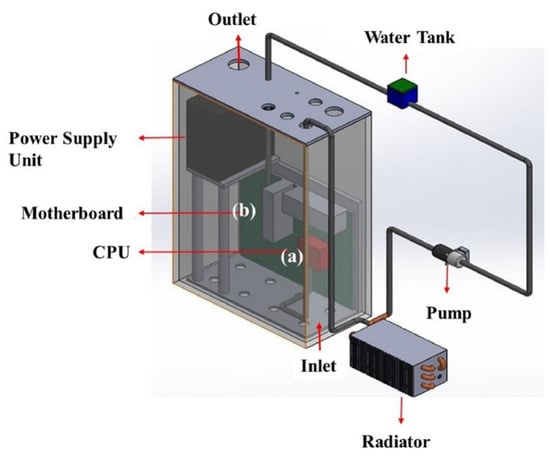
Figure 13.
The schematic diagram of single-phase [67].
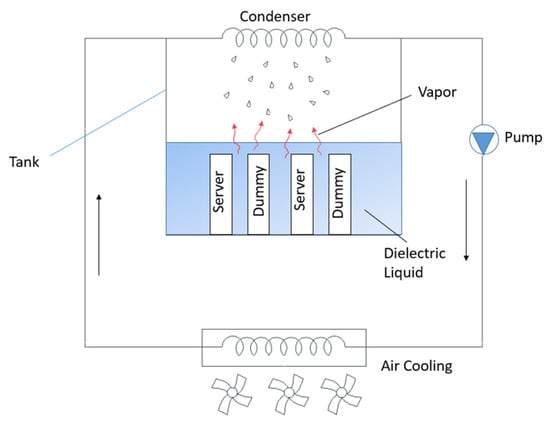
Figure 14.
The schematic diagram of two-phase [68].
Single-Phase Liquid Immersion Cooling
Single-phase immersion cooling can be applied to a single server rack with up to 100 k W. Commonly used coolants are mineral oil, synthetic oil, e-fluorinated fluids with higher boiling points, etc. According to Google, oil cooling technology can decrease the PUE by up to 1.02~1.03. Influencing factors of single-phase immersion cooling include coolant flow rate [69,70], coolant type, coolant inlet and outlet position, circulation temperature, heat sink structure [71,72], etc. The effects of these factors on the cooling effect are shown in Table 3.
Table 3.
Influences of factors on the refrigeration effect of single-phase immersion cooling.
Two-Phase Liquid Immersion Cooling
Two-phase liquid immersion cooling is available for a single server rack with up to 110 k W. Commonly used coolants can be selected from refrigerants and dielectric fluids with boiling points below the maximum tolerable temperature of the working parts, such as fluorocarbon fluids (FC-72, FC-87, and PF-5060) and hydroflurane (HFE7000, HFE-7100, and HFE-7300) [50,78]. It is worth noting that the unit cost of these fluorocarbon coolants is 10–20 times higher than that of mineral oils.
Thermal Management Performance
The influencing factors for two-phase liquid immersion cooling are mainly fin structure design, surface roughness, and coolant type. The studies on these parameters are illustrated in Table 4.
Table 4.
Influences of factors on the refrigeration effect of two-phase immersion cooling.
Energy Saving and Consumption Reduction of System
The PUE of two-phase liquid immersion cooling is closely related to server power. The higher the server power, the lower the PUE. A two-phase immersion liquid cooling system was established by Kanbur et al. [84], and the thermodynamic properties of the system were analyzed under 6 different thermal loads within a range of 3.43–9.17 KW. The experimental results showed that the coefficient of performance (COP) was the highest, reaching 6.67, and the PUE was the lowest, reaching 1.15 at the highest operating load. The COP was the lowest, reaching 2.5, and the PUE was the highest, reaching 1.4 at the lowest operating load. In addition, the use of seawater to absorb the heat of an evaporative coolant to extract salt can not only condensate the vapor but also realize the waste heat utilization of data centers and reduce energy consumption [85]. In 2019, Dawning Information Industry Co., Ltd. released the “Silicon Cube” high-performance computer, which used the immersion phase change liquid cooling technology method to approach the energy efficiency level of a single computer to the limit, and the PUE reached 1.04.
4.2.2. Spray Cooling
Spray cooling refers to the coolant being dispersed or atomized into fine droplets before making contact with the heated surface, and the droplets directly absorb surface heat to achieve the purpose of cooling. This cooling system offers a high heat flux removal capability and the ability to maintain safe temperatures of electronic components [86]. Yu et al. designed a closed-loop spray cooling system, as represented in Figure 15.
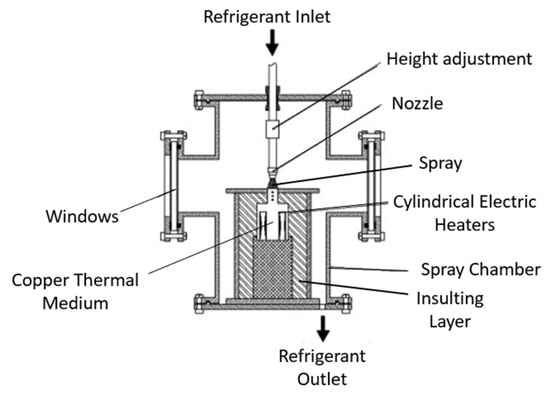
Figure 15.
Schematic of closed loop spray cooling system [87].
Nonetheless, the heat transfer mechanism of spray cooling is complex and is still being studied [88]. The spray cooling coolant can be R134a, PF-5060, R22, water, or methanol. Spray cooling has a strong cooling capacity, and can realize the cooling of a single cabinet with a power of 140 KW, but the nozzle is easy to block and difficult to maintain, and the cooling system requires a sealed steam chamber and a steam recovery device [60]. Water and R-134a were chosen as the cooling mediums by Hsieh et al. in [89]. The heat transfer performance test of spray cooling was conducted with spray mass flow and subcooling as variables. As represented in the results, for both water and R-134a, cooling performance increases with mass flow. However, because of the tiny degree of subcooling for R134-a, the effect of subcooling seems not significant. Nevertheless, this still shows that an increase in supercooling leads to the weakening of the heat dissipation effect. The water is more subcooled and therefore has a more pronounced effect on the cooling performance. According to the data, the cooling ability of water is better than that of R134-a.
The PUE of the improved plug-in spray-cooling-coupled waste-heat-driven absorption refrigeration system is still 1.44, as tested by Chen et al. [90]. A spray cooling system composed of a server and heater was developed by Kandasamy et al. [91] to study the effects of nozzle flow, condenser fan power, condenser cooling water flow, and heat load on the thermal performance of the system and spray chamber pressure. It should be noticed that the heater surface temperature could be reduced by 6.5 °C with the nozzle flow increasing and the pressure and temperature in the cavity decreasing, while the fan power, cooling water flow, and heat load had little effect on the thermal performance of the system. Compared with an air cooling system, the total energy consumption of this new spray-cooling system can be reduced by 25.8%.
4.2.3. Jet Impingement
Jet impingement refers to a high velocity coolant from a convergent nozzle being directly injected onto the heated surface for heat absorption and cooling [92], as shown in Figure 16. FC-32 and water are commonly used as coolants, but, recently, hybrid nanofluids increasing heat transfer efficiency have attracted the attention of researchers [93]. Jet impingement is currently rarely used in data center cooling. Nonetheless, the heat transfer coefficients for jet impingement and spray cooling are 16 to 275 W/cm2 and 3.97 to 250 W/cm2, respectively; thus, jet impingement cooling systems have better heat transfer performance than spray cooling systems [55]. Researchers have focused on researching jet velocity [94,95], nozzle structure [96,97], the structural design of the heating surface [98,99], and the distance [100,101] between the nozzle and the jet surface regarding the enhancement of the heat transfer coefficient. Baghel et al. [102] investigated heat transfer efficiency under three kinds of jet Reynolds numbers and four different ratios of surface-to-jet velocity. The increase in velocity favors fast heat removal. The flow boiling heat transfer mechanism of jet impinging on a smooth surface and a reinforced surface was experimentally investigated by Ndao et al. [103], and the conclusion can be drawn that supercooled boiling was the main heat transfer mechanism. The heat transfer coefficient of the reinforced surface with round microneedle fins (D = 125 μm) exceeded 150,000 W/(m2·K) when the flow rate was up to 2.2 m/s and R134a was used as a coolant, and nucleated boiling of the reinforced surface occurred at a lower wall superheat compared with that of smooth walls refraining from a too high wall temperature in order to dissipate heat in time.
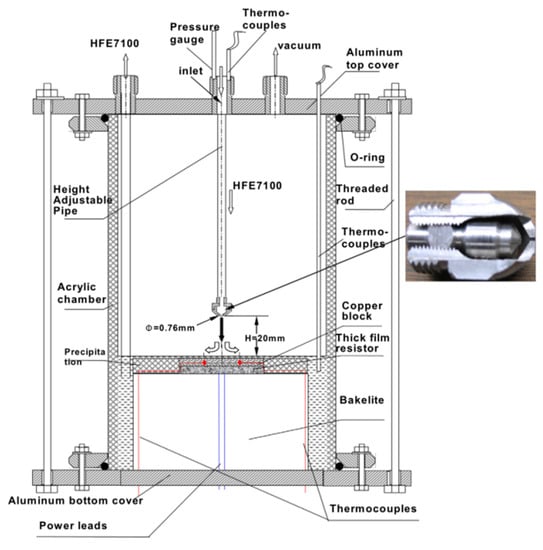
Figure 16.
Schematic of jet impingement system [104].
5. Conclusions and Further Recommendations
The main objective of this paper was to summarize the key factors for air, liquid, and free cooling systems to achieve low energy consumption and accomplish data center thermal management, and to describe the corresponding research as well as the optimization methods. The specific analysis is as follows:
- (1)
- With regard to air cooling data centers, where thermal management is mainly achieved by controlling the uniform distribution of airflow and the non-mixing of hot and cold air, researchers have further investigated the impacts of the height of the raised floor, the degree of openness of the perforated tiles, and the deployment of obstacles in the plenum ventilation system on the organization of airflow and have obtained the optimal values of these parameters through simulations and experiments. The system achieves energy consumption reduction mainly through changes in structural parameters, particularly the porosity of the porous tiles.
- (2)
- Other cooling systems include free cooling systems and liquid cooling systems. The cooling principles of each system were described in this paper. The corresponding PUE values and the cooling loads that can be achieved were provided at the same time.
- (3)
- The thermal management and energy saving of free cooling systems are mainly focused on climatic conditions, the structural design of the cooling systems, the free cooling switching point, and flow rates. The previous literature mainly focused on obtaining the optimal value of various factors through algorithms and improving the structural performance to save energy consumption and achieve uniform heat dissipation.
- (4)
- The thermal management and energy saving of liquid cooling systems are mainly focused on thermal loads, structural parameters, coolant flow rate, and coolant type. Researchers not only analyzed the relationships between these factors and cooling performance as well as energy consumption but also optimized the heat-exchange facility structures.
Although researchers have conducted a lot of research on energy conservation and efficient heat dissipation in cooling systems, there are still some gaps that entail future research. Water-side economizers and liquid cooling systems are home to PUEs approaching 1; therefore, both of them have a good trend of development. Water-side economizers are applied to areas where water resources are rich. However, the energy consumption of this system is mainly affected by the free cooling switching point, which is related to the cold water supply temperature and cooling load. The height of the free cooling switching point decides the time of complete free cooling. Therefore, a control system needs to be established to adjust the switching point according to the situation to extend the time of complete free cooling in order to save energy. A free cooling system, a system that has few requirements for the geographical location of a data center, is suitable for the cooling of high-power data centers. At present, no accurate conclusions have been reached on the heat transfer mechanisms of spray cooling and jet impingement, and there is still little research on energy saving and heat transfer enhancement by improving nozzle structure design in spray cooling and jet impingement. As two cooling systems with high efficiencies in heat transfer, they still need to be studied in more depth in the future.
Author Contributions
Conceptualization, S.X., H.Z. and Z.W.; investigation, S.X.; data collecting and processing, S.X.; writing—original draft preparation, S.X.; writing—review and editing, S.X.; visualization, S.X.; supervision, H.Z.; project administration, Z.W.; funding acquisition, H.Z. and Z.W. All authors have read and agreed to the published version of the manuscript.
Funding
This work was supported by the Shanghai Municipal Natural Science Foundation (20ZR1438600), the Special Project of Biomedical Science and Technology Support of Shanghai Science and Technology Innovation Action Plan (21S31900200), the Open Project of the Shanghai Key Laboratory of Multiphase Flow and Heat Transfer in Power Engineering and the Central Guidance on Local Science and Technology Development Fund of Shanghai City (No. YDZX20213100003002), the Special Project of Independent Innovation of Qingdao City (21-1-2-6-NSH).
Institutional Review Board Statement
Not applicable.
Informed Consent Statement
Not applicable.
Data Availability Statement
Not applicable.
Conflicts of Interest
The authors declare no conflict of interest.
References
- Rei, M.; Kao, Y.; Yeh, G.; Chen, S. Hydrogen-Tracking Clean Energy Progress. 2022. Available online: https://www.scirp.org/reference/referencespapers.aspx?referenceid=2719871 (accessed on 20 November 2022).
- Ebrahimi, K.; Gerard; Jones, F.; Fleischer, S. A review of data center cooling technology, operating conditions and the corresponding low-grade waste heat recovery opportunities. Renew. Sustain. Energy Rev. 2014, 31, 622–638. [Google Scholar] [CrossRef]
- Zhang, H.; Shao, S.; Xu, H.; Zou, H.; Tian, C. Free Cooling of Data Centers: A Review. Renew. Sustain. Energy Rev. 2014, 35, 171–182. [Google Scholar] [CrossRef]
- Sorell, V.; Escalante, S. Comparison of Overhead and Underfloor Air Delivery Systems in a Data Center Environment Using CFD Modeling. ASHRAE Trans. 2005, 111, 756–764. [Google Scholar]
- Cooling Solutions in an Operational Data Centre: A Case Study; Austrlia. 2006. Available online: https://schlr.cnki.net/en/Detail/index/GARJ2011/SJESD2E29E1DEFA346A456C82701BE8A4ABC (accessed on 19 November 2022).
- Schmidt, R.; Cruz, E. Cluster of High-Powered Racks Within a Raised-Floor Computer Data Center: Effect of Perforated Tile Flow Distribution on Rack Inlet Air Temperatures. J. Electron. Packag. 2004, 126, 510–518. [Google Scholar] [CrossRef]
- Karki, K.C.; Patankar, S.V. Airflow Distribution through Perforated Tiles in Raised-Floor Data Centers. Build. Environ. 2006, 41, 734–744. [Google Scholar] [CrossRef]
- Karki, K.; Radmehr, A.; Patankar, S. Use of Computational Fluid Dynamics for Calculating Flow Rates Through Perforated Tiles in Raised-Floor Data Centers. HVACR Res. 2003, 9, 153–166. [Google Scholar] [CrossRef]
- Ding, T.; Wen Cao, H.; Guang He, Z.; Li, Z. Experiment Research on Influence Factors of the Separated Heat Pipe System, Especially the Filling Ratio and Freon Types. Appl. Therm. Eng. 2017, 118, 357–364. [Google Scholar] [CrossRef]
- Development of an Independent Modular Air Containment System for High-Density Data Centers: Experimental Investigation of Row-Based Cooling Performance and PUE. Available online: https://schlr.cnki.net/en/Detail/index/GARJ2021_3/SJES8D602C1761817D756EEA6BD0F41795F6 (accessed on 20 November 2022).
- Khalaj, H.A.; Halgamuge, S.K. A Review on Efficient Thermal Management of Air- and Liquid-Cooled Data Centers: From Chip to the Cooling System. Appl. Energy 2017, 205, 1165–1188. [Google Scholar] [CrossRef]
- Choo, K.; Galante, R.M.; Ohadi, M.M. Energy Consumption Analysis of a Medium-Size Primary Data Center in an Academic Campus. Energy Build. 2014, 76, 414–421. [Google Scholar] [CrossRef]
- Experimental Study on the Performance of Compound Liquid-cooled Device for Communication Cabinet. Available online: https://kns.cnki.net/kcms/detail/detail.aspx?dbcode=CMFD&dbname=CMFD202201&filename=1021792657.nh&uniplatform=NZKPT&v=XH11-vCf_P1kTjMzzm5G1NVqBSv9ZiHY56DliLB9Mb7X-QpHcqGsaBR-mw0xHDrK (accessed on 20 November 2022).
- Cho, J.; Kim, Y. Development of Modular Air Containment System: Thermal Performance Optimization of Row-Based Cooling for High-Density Data Centers. Energy 2021, 231, 120838. [Google Scholar] [CrossRef]
- Zhang, K.; Zhang, Y.; Liu, J.; Niu, X. Recent Advancements on Thermal Management and Evaluation for Data Centers. Appl. Therm. Eng. 2018, 142, 215–231. [Google Scholar] [CrossRef]
- Effect of Raised Floor Height on Different Arrangement of Under-Floor Air Distribution Performance in Data Center. Procedia Eng. 2017, 205, 556–564. [CrossRef]
- Wang, I.-N.; Tsui, Y.-Y.; Wang, C.-C. Improvements of Airflow Distribution in a Container Data Center. Energy Procedia 2015, 75, 1819–1824. [Google Scholar] [CrossRef]
- Oró, E.; Garcia, A.; Salom, J. Experimental and Numerical Analysis of the Air Management in a Data Centre in Spain. Energy Build. 2016, 116, 553–561. [Google Scholar] [CrossRef]
- Patankar, S.V. Airflow and Cooling in a Data Center. J. Heat Transfer. 2010, 132, 073001. [Google Scholar] [CrossRef]
- Dimensionless Parameters for Evaluation of Thermal Design and Performance of Large-Scale Data Centers. 2002. Available online: https://www.docin.com/p-87101381.html (accessed on 20 November 2022).
- Nada, S.A.; Elfeky, K.E. Experimental Investigations of Thermal Managements Solutions in Data Centers Buildings for Different Arrangements of Cold Aisles Containments. J. Build. Eng. 2016, 5, 41–49. [Google Scholar] [CrossRef]
- Fulpagare, Y.; Hsu, P.-H.; Wang, C.-C. Experimental Analysis of Airflow Uniformity and Energy Consumption in Data Centers. Appl. Therm. Eng. 2022, 209, 118302. [Google Scholar] [CrossRef]
- Siriwardana, J.; Jayasekara, S.; Halgamuge, S.K. Potential of Air-Side Economizers for Data Center Cooling: A Case Study for Key Australian Cities. Appl. Energy 2013, 104, 207–219. [Google Scholar] [CrossRef]
- Stein, J. Waterside Economizing in Data Centers: Design and Control Considerations. ASHRAE Trans. 2009, 115, 192–200. [Google Scholar]
- Shehabi, A.; Horvath, A.; Tschudi, W.; Gadgil, A.J.; Nazaroff, W.W. Particle Concentrations in Data Centers. Atmos. Environ. 2008, 42, 5978–5990. [Google Scholar] [CrossRef]
- Air Corrosivity in U.S. Outdoor-Air-Cooled Data Centers Is Similar to That in Conventional Data Centers. Available online: https://www.zhangqiaokeyan.com/open-access_resources_thesis/0100074435637.html (accessed on 20 November 2022).
- Effects of Rapamycin on Cell Growth and Apoptosis of Pancreatic Carcinoma SW1990 Cells. 2011. Available online: http://en.cnki.com.cn/Article_en/CJFDTotal-ZZLL201101013.htm (accessed on 20 November 2022).
- Geng, H.; Li, J.; Zhou, C. Discussion on Outdoor air Cooling Energy Saving Technology of Data Center in Temperature Zone. Heat. Vent. Air Cond. 2017, 10, 19–25. [Google Scholar]
- Cho, J.; Kim, Y. Improving Energy Efficiency of Dedicated Cooling System and Its Contribution towards Meeting an Energy-Optimized Data Center. Appl. Energy 2016, 165, 967–982. [Google Scholar] [CrossRef]
- Oró, E.; Depoorter, V.; Pflugradt, N.; Salom, J. Overview of Direct Air Free Cooling and Thermal Energy Storage Potential Energy Savings in Data Centres. Appl. Therm. Eng. 2015, 85, 100–110. [Google Scholar] [CrossRef]
- Endo, H.; Kodama, H.; Fukuda, H.; Sugimoto, T.; Horie, T.; Kondo, M. Effect of Climatic Conditions on Energy Consumption in Direct Fresh-Air Container Data Centers. Sustain. Comput. Inform. Syst. 2015, 6, 17–25. [Google Scholar] [CrossRef]
- Ham, S.-W.; Kim, M.-H.; Choi, B.-N.; Jeong, J.-W. Energy saving potential of various air-side economizers in a modular data center. Appl. Energy 2015, 138, 258–275. [Google Scholar] [CrossRef]
- Daraghmeh, H.M.; Wang, C.-C. A Review of Current Status of Free Cooling in Datacenters. Appl. Therm. Eng. 2017, 114, 1224–1239. [Google Scholar] [CrossRef]
- Yan, Z.; Wu, X.; Huang, X.; Xu, J. Application Research of Indirect Evaporative Cooling Airconditioning Unit in Data Center. 2022. Available online: https://kns.cnki.net/kcms/detail/11.4519.tb.20220628.1629.002.html (accessed on 30 June 2022).
- Bao, L.; Wang, J.; Kang, L. The Applied Effect Analysis of Heat Exchanger Installed in a Typical Communication Base Station in Beijing of China. Energy Procedia 2012, 14, 620–625. [Google Scholar] [CrossRef]
- Chen, X.; Chen, X.; Yu, W.; Yan, Z. Optimization and Simulation on Heat Dissipation Structure of Subsea Data Center. Cryog. Supercond. 2022, 50, 28–35. [Google Scholar]
- Wang, J.; Zhou, C.; Li, Y.; Song, J.; Zhu, T.; Hao, B. Review of Key Technologies and Development Trend of Data Center Construction. Electr. Power Inf. Commun. Technol. 2022, 20, 1–21. [Google Scholar]
- Ling, L.; Zhang, Q.; Yu, Y.; Ma, X.; Liao, S. Energy Saving Analysis of the Cooling Plant Using Lake Water Source Base on the Optimized Control Strategy with Set Points Change. Appl. Therm. Eng. 2018, 130, 1440–1449. [Google Scholar] [CrossRef]
- Water-Based Data Center. Available online: https://www.zhangqiaokeyan.com/patent-detail/06130433169568.html (accessed on 20 November 2022).
- Zhang, Y.; Li, B.; Li, Z. Energy Saving Analysis of Partical Natural Cooling Mode in Large Data Centers. Heat. Vent. Air Cond. 2022, 52, 28–35. [Google Scholar]
- Ling, L.; Zhang, Q.; Zeng, L. Performance and Energy Efficiency Analysis of Data Center Cooling Plant by Using Lake Water Source. Procedia Eng. 2017, 205, 3096–3103. [Google Scholar] [CrossRef]
- Huang, D.; Du, C. Numerical Optimization Design of Packing and Spray Distribution of Counter Flow Cooling Tower. Chin. J. Appl. Mech. 2000, 1, 102–109. [Google Scholar]
- Li, J.; Li, Z. Model-Based Optimization of Free Cooling Switchover Temperature and Cooling Tower Approach Temperature for Data Center Cooling System with Water-Side Economizer. Energy Build. 2020, 227, 110407. [Google Scholar] [CrossRef]
- Zhang, J.; He, W.; Guo, R.; Li, H.; Liu, S.; Wei, J.; Wang, Y. Optimal Thermal Management on Server Cooling System to Achieve Minimal Energy Consumption Based on Air-Cooled Chiller. Energy Rep. 2022, 8, 154–161. [Google Scholar] [CrossRef]
- Alt, T.E. Options for Cooling Using Solar Energy from Flat Plate Collectors. In Solar Cooling and Dehumidifying; Martinez, A.R., Ed.; Pergamon: Oxford, UK, 1981; pp. 111–112. ISBN 978-0-08-027571-0. [Google Scholar]
- Xie, L.; Guo, L. Discussion on Liquid Cooling Technology and Its Development. Inf. Commun. Technol. 2019, 2, 22–25. [Google Scholar]
- Li, Y. Research on Application Status and Trend of Liquid Cooling Technology in Data Center. China New Telecommun. 2022, 24, 72–74. [Google Scholar]
- Singh, R.; Akbarzadeh, A.; Mochizuki, M. Sintered Porous Heat Sink for Cooling of High-Powered Microprocessors for Server Applications. Int. J. Heat Mass Transf. 2009, 52, 2289–2299. [Google Scholar] [CrossRef]
- Fluid Flow and Heat Transfer Investigations on Enhanced Microchannel Heat Sink Using Oblique Fins with Parametric Study. Available online: http://www.doc88.com/p-1806942972885.html (accessed on 20 November 2022).
- Fluoroketone C2F5C(O)CF(CF3)2 as a Heat Transfer Fluid for Passive and Pumped 2-Phase Applications. 2008. Available online: https://www.zhangqiaokeyan.com/academic-conference-foreign_meeting-257028_thesis/0705010324389.html (accessed on 20 November 2022).
- Pranoto, I.; Leong, K.C. An Experimental Study of Flow Boiling Heat Transfer from Porous Foam Structures in a Channel. Appl. Therm. Eng. 2014, 70, 100–114. [Google Scholar] [CrossRef]
- Agostini, B.; Thome, J.R.; Fabbri, M.; Michel, B. High Heat Flux Two-Phase Cooling in Silicon Multimicrochannels. IEEE Trans. Comp. Packag. Technol 2008, 31, 691–701. [Google Scholar] [CrossRef]
- Zhao, C.Y.; Lu, W.; Tassou, S.A. Flow Boiling Heat Transfer in Horizontal Metal-Foam Tubes. J. Heat Transf. 2009, 131, 121002. [Google Scholar] [CrossRef]
- Siedel, B.; Sartre, V.; Lefèvre, F. Literature Review: Steady-State Modelling of Loop Heat Pipes. Appl. Therm. Eng. 2015, 75, 709–723. [Google Scholar] [CrossRef]
- Kheirabadi, A.C.; Groulx, D. Cooling of Server Electronics: A Design Review of Existing Technology. Appl. Therm. Eng. 2016, 105, 622–638. [Google Scholar] [CrossRef]
- Integrated Thermal Management Techniques for High Power Electronic Devices. Available online: https://schlr.cnki.net/en/Detail/index/GARJ0010_1/NSTL18655737610842D7D6A2BC1AB8DCFC51 (accessed on 20 November 2022).
- Fahgiri, A. Heat Pipes, Review, Opportunities and Challenges. 2014. Available online: https://www.scirp.org/reference/ReferencesPapers.aspx?ReferenceID=1437409 (accessed on 20 November 2022).
- Zhou, G.; Li, J.; Jia, Z. Power-Saving Exploration for High-End Ultra-Slim Laptop Computers with Miniature Loop Heat Pipe Cooling Module. Appl. Energy 2019, 239, 859–875. [Google Scholar] [CrossRef]
- Shabgard, H.; Allen, M.J.; Sharifi, N.; Benn, S.P.; Faghri, A.; Bergman, T.L. Heat Pipe Heat Exchangers and Heat Sinks: Opportunities, Challenges, Applications, Analysis, and State of the Art. Int. J. Heat Mass Transf. 2015, 89, 138–158. [Google Scholar] [CrossRef]
- Chen, X.; Zhou, L.; Zhang, C.; Chen, X.; Wang, S.; Zhang, L.; Chen, J. Research Status and Future Development of Cooling Technologies for Green and Energy-Efficient Data Centers. Strateg. Study CAE 2022, 24, 94–104. [Google Scholar] [CrossRef]
- Ding, T.; Chen, X.; Cao, H.; He, Z.; Wang, J.; Li, Z. Principles of Loop Thermosyphon and Its Application in Data Center Cooling Systems: A Review. Renew. Sustain. Energy Rev. 2021, 150, 111389. [Google Scholar] [CrossRef]
- Two-Phase Thermosyphon Loop for Cooling Outdoor Telecommunication Equipments. Available online: https://schlr.cnki.net/en/Detail/index/GARJ2013/SJES14010600477923 (accessed on 20 November 2022).
- Ding, T.; Wen Cao, H.; Guang He, Z.; Da Wu, J.; Li, Z. Experimental Study on a Loop Thermosyphon Cooling System in Data Centers Using CO2 as a Working Fluid, Especially Thermal Environment and Energy-Saving Effect. Appl. Therm. Eng. 2020, 175, 115359. [Google Scholar] [CrossRef]
- Han, L.; Shi, W.; Wang, B.; Zhang, P.; Li, X. Development of an Integrated Air Conditioner with Thermosyphon and the Application in Mobile Phone Base Station. Int. J. Refrig. 2013, 36, 58–69. [Google Scholar] [CrossRef]
- Han, L.; Shi, W.; Wang, B.; Zhang, P.; Li, X. Energy Consumption Model of Integrated Air Conditioner with Thermosyphon in Mobile Phone Base Station. Int. J. Refrig. 2014, 40, 1–10. [Google Scholar] [CrossRef]
- Chhetri, A.; Kashyap, D.; Mali, A.; Agarwal, C.; Ponraj, C.; Gobinath, N. Numerical Simulation of the Single-Phase Immersion Cooling Process Using a Dielectric Fluid in a Data Server. Mater. Today Proc. 2022, 51, 1532–1538. [Google Scholar] [CrossRef]
- Cheng, C.-C.; Chang, P.-C.; Li, H.-C.; Hsu, F.-I. Design of a Single-Phase Immersion Cooling System through Experimental and Numerical Analysis. Int. J. Heat Mass Transf. 2020, 160, 120203. [Google Scholar] [CrossRef]
- Burak, K.B.; Chenlong, W.; Simiao, F.; Fei, D. System-level experimental investigations of the direct immersion cooling data center units with thermodynamic and thermoeconomic assessments. Energy 2021, 217, 119373. [Google Scholar]
- Heat Transfer Research; Investigators from National Taipei University of Technology Have Reported New Data on Heat Transfer Research (Design of a Single-Phase Immersion Cooling System Through Experimental and Numerical Analysis). 2020. Available online: https://schlr.cnki.net/en/Detail/index/GARJ2020/SPQD3F850D09FB6D17835D98A65534E229E6 (accessed on 20 November 2022).
- Kuncoro, I.W.; Pambudi, N.A.; Biddinika, M.K.; Budiyanto, C.W. Optimization of Immersion Cooling Performance Using the Taguchi Method. Case Stud. Therm. Eng. 2020, 21, 100729. [Google Scholar] [CrossRef]
- Kalbasi, R.; Afrand, M.; Alsarraf, J.; Tran, M.-D. Studies on Optimum Fins Number in PCM-Based Heat Sinks. Energy 2019, 171, 1088–1099. [Google Scholar] [CrossRef]
- Yazici, M.Y.; Avci, M.; Aydin, O. Combined Effects of Inclination Angle and Fin Number on Thermal Performance of a PCM-Based Heat Sink. Appl. Therm. Eng. 2019, 159, 113956. [Google Scholar] [CrossRef]
- Gandhi, D.; Chowdhury, U.; Chauhan, T.; Bansode, P.; Saini, S.; Shah, J.M.; Agonafer, D. Computational Analysis for Thermal Optimization of Server for Single Phase Immersion Cooling; American Society of Mechanical Engineers Digital Collection: New York, NY, USA, 2019. [Google Scholar]
- Li, B. Numerical Simulation and Optimization of Single-phase Immersion Liquid Cooling for Servers. 2021. Available online: https://kns.cnki.net/KCMS/detail/detail.aspx?dbname=CMFD202102&filename=1021044965.nh (accessed on 30 May 2021).
- Sun, Y.; Wang, Y.; Zhu, L.; Yin, B.; Xiang, H.; Huang, Q. Direct Liquid-Immersion Cooling of Concentrator Silicon Solar Cells in a Linear Concentrating Photovoltaic Receiver. Energy 2014, 65, 264–271. [Google Scholar] [CrossRef]
- Li, B.; Chen, Q.; Lin, Z. Analysis of factors influencing the heat dissipation performance of single-phase submerged liquid cooling of servers. Electron. World 2021, 19, 75–78. [Google Scholar]
- Jithin, K.V.; Rajesh, P.K. Numerical Analysis of Single-Phase Liquid Immersion Cooling for Lithium-Ion Battery Thermal Management Using Different Dielectric Fluids. Int. J. Heat Mass Transf. 2022, 188, 122608. [Google Scholar] [CrossRef]
- Leong, K.C.; Ho, J.Y.; Wong, K.K. A Critical Review of Pool and Flow Boiling Heat Transfer of Dielectric Fluids on Enhanced Surfaces. Appl. Therm. Eng. 2017, 112, 999–1019. [Google Scholar] [CrossRef]
- Yu, C.K.; Lu, D.C. Pool Boiling Heat Transfer on Horizontal Rectangular Fin Array in Saturated FC-72. Int. J. Heat Mass Transf. 2007, 50, 3624–3637. [Google Scholar] [CrossRef]
- Singh, P.; Patil, A.K. Experimental Investigation of Heat Transfer Enhancement through Embossed Fin Heat Sink under Natural Convection. Exp. Therm. Fluid Sci. 2015, 61, 24–33. [Google Scholar] [CrossRef]
- Zhang, K.; Li, M.-J.; Wang, F.-L.; He, Y.-L. Experimental and Numerical Investigation of Natural Convection Heat Transfer of W-Type Fin Arrays. Int. J. Heat Mass Transf. 2020, 152, 119315. [Google Scholar] [CrossRef]
- Manetti, L.L.; Moita, A.S.O.H.; de Souza, R.R.; Cardoso, E.M. Effect of Copper Foam Thickness on Pool Boiling Heat Transfer of HFE-7100. Int. J. Heat Mass Transf. 2020, 152, 119547. [Google Scholar] [CrossRef]
- Li, X.; Lv, L.; Wang, X.; Li, J. Transient Thermodynamic Response and Boiling Heat Transfer Limit of Dielectric Liquids in a Two-Phase Closed Direct Immersion Cooling System. Therm. Sci. Eng. Prog. 2021, 25, 100986. [Google Scholar] [CrossRef]
- Kanbur, B.B.; Wu, C.; Fan, S.; Tong, W.; Duan, F. Two-Phase Liquid-Immersion Data Center Cooling System: Experimental Performance and Thermoeconomic Analysis. Int. J. Refrig. 2020, 118, 290–301. [Google Scholar] [CrossRef]
- Multi-Criteria Thermoeconomic and Thermodynamic Assessments of the Desalination-Integrated Two-Phase Liquid-Immersion Data Center Cooling. 2020. Available online: https://schlr.cnki.net/en/Detail/index/GARJ2020/SPQD2695BF2CBF43209938A8D60BDE53B577 (accessed on 20 November 2022).
- Mudawar, I. Assessment of High-Heat-Flux Thermal Management Schemes. IEEE Trans. Comp. Packag. Technol. 2001, 24, 122–141. [Google Scholar] [CrossRef]
- Hou, Y.; Liu, J.; Su, X.; Qian, Y.; Liu, L.; Liu, X. Experimental Study on the Characteristics of a Closed Loop R134-a Spray Cooling. Exp. Therm. Fluid Sci. 2015, 61, 194–200. [Google Scholar] [CrossRef]
- Kim, J. Spray Cooling Heat Transfer: The State of the Art. Int. J. Heat Fluid Flow 2007, 28, 753–767. [Google Scholar] [CrossRef]
- Hsieh, S.-S.; Fan, T.-C.; Tsai, H.-H. Spray Cooling Characteristics of Water and R-134a. Part I: Nucleate Boiling. Int. J. Heat Mass Transf. 2004, 47, 5703–5712. [Google Scholar] [CrossRef]
- Chen, H. Effect of Flash Evaporation and Spray Droplet Characteristic on Heat Transfer Enhancement of Spray Cooling. 2018. Available online: https://kns.cnki.net/kcms/detail/detail.aspx?dbcode=CDFD&dbname=CDFDLAST2018&filename=1018048737.nh&uniplatform=NZKPT&v=HfcLh4qsCVdR22Q8ZlNKgxYdnrC8PnKPDNyBuYblO7UPmK0M1gX5AjUusI24LGgW (accessed on 16 April 2018).
- Kandasamy, R.; Ho, J.Y.; Liu, P.; Wong, T.N.; Toh, K.C.; Chua, S.J. Two-Phase Spray Cooling for High Ambient Temperature Data Centers: Evaluation of System Performance. Appl. Energy 2022, 305, 117816. [Google Scholar] [CrossRef]
- Guo, D.; Wei, J.J.; Zhang, Y.H. Enhanced Flow Boiling Heat Transfer with Jet Impingement on Micro-Pin-Finned Surfaces. Appl. Therm. Eng. 2011, 31, 2042–2051. [Google Scholar] [CrossRef]
- Hanafi, N.S.M.; Ghopa, W.A.W.; Zulkifli, R.; Abdullah, S.; Harun, Z.; Mansor, M.R.A. Numerical Simulation on the Effectiveness of Hybrid Nanofluid in Jet Impingement Cooling Application. Energy Rep. 2022, 8, 764–775. [Google Scholar] [CrossRef]
- Cardenas, R.; Narayanan, V. Heat Transfer Characteristics of Submerged Jet Impingement Boiling of Saturated FC-72. Int. J. Heat Mass Transf. 2012, 55, 4217–4231. [Google Scholar] [CrossRef]
- Ma, C.-F.; Bergles, A.E. Jet Impingement Nucleate Boiling. Int. J. Heat Mass Transf. 1986, 29, 1095–1101. [Google Scholar] [CrossRef]
- Mudawar, I.; Wadsworth, D.C. Critical Heat Flux from a Simulated Chip to a Confined Rectangular Impinging Jet of Dielectric Liquid. Int. J. Heat Mass Transf. 1991, 34, 1465–1479. [Google Scholar] [CrossRef]
- Zhou, D.W.; Ma, C.F.; Yu, J. Boiling Hysteresis of Impinging Circular Submerged Jets with Highly Wetting Liquids. Int. J. Heat Fluid Flow 2004, 25, 81–90. [Google Scholar] [CrossRef]
- Single-Phase and Flow Boiling Heat Transfer of Jet Impingement on Smooth and Enhanced Micro Structured Surfaces. Available online: https://www.zhangqiaokeyan.com/academic-degree-foreign_mphd_thesis/0206118787.html (accessed on 20 November 2022).
- Wadsworth, D.C.; Mudawar, I. Enhancement of Single-Phase Heat Transfer and Critical Heat Flux from an Ultra-High-Flux Simulated Microelectronic Heat Source to a Rectangular Impinging Jet of Dielectric Liquid. J. Heat Transf. 1992, 114, 764–768. [Google Scholar] [CrossRef]
- Katto, Y.; Kunihiro, M. Study of the Mechanism of Burn-Out in Boiling System of High Burn-Out Heat Flux. Bull. JSME 1973, 16, 1357–1366. [Google Scholar] [CrossRef]
- Shin, C.H.; Kim, K.M.; Lim, S.H.; Cho, H.H. Influences of Nozzle-Plate Spacing on Boiling Heat Transfer of Confined Planar Dielectric Liquid Impinging Jet. Int. J. Heat Mass Transf. 2009, 52, 5293–5301. [Google Scholar] [CrossRef]
- Baghel, K.; Zahra; Lee, J. Free Surface Planar Liquid Jet Impingement on a Moving Surface: Interfacial Flow and Heat Transfer Characteristics. J. Mech. Sci. Technol. 2022, 36, 5537–5549. [Google Scholar] [CrossRef]
- Ndao, S.; Peles, Y.; Jensen, M.K. Experimental Investigation of Flow Boiling Heat Transfer of Jet Impingement on Smooth and Micro Structured Surfaces. Int. J. Heat Mass Transf. 2012, 55, 5093–5101. [Google Scholar] [CrossRef]
- Wu, W.; Chow, L.; Wang, C.; Su, M.; Kizito, J.P. Jet impingement heat transfer using a Field’s alloy nanoparticle–HFE7100 slurry. Int. J. Heat Mass Transf. 2014, 68, 357–365. [Google Scholar] [CrossRef]
Disclaimer/Publisher’s Note: The statements, opinions and data contained in all publications are solely those of the individual author(s) and contributor(s) and not of MDPI and/or the editor(s). MDPI and/or the editor(s) disclaim responsibility for any injury to people or property resulting from any ideas, methods, instructions or products referred to in the content. |
© 2023 by the authors. Licensee MDPI, Basel, Switzerland. This article is an open access article distributed under the terms and conditions of the Creative Commons Attribution (CC BY) license (https://creativecommons.org/licenses/by/4.0/).