1. Introduction
Thermoset composite materials commonly used for structural marine energy components have up to a 50% reduction in strength when exposed to seawater, according to studies by Davies and Arhant [
1] and Davies et al. [
2], and are also not easily recyclable at end of life. Novel thermoplastic composite materials have been shown at a coupon scale to have improved seawater saturated properties [
1,
2] but have never been validated at a full scale in realistic subsea operating conditions. Previous work on wind turbine blades that use a thermoplastic resin called Elium (made by Arkema) showed a reduction in manufacturing costs of ~5% [
3]—less energy is needed to manufacture the blades because Elium cures at room temperature. For marine energy applications, we expect similar manufacturing cost advantages.
Larger-scale research conducted in a real sea environment is critical to understanding the value of thermoplastics to the marine industry. Additionally, load data from an operational tidal turbine are vital to validate numerical modelling tools and de-risk future deployments. Although many researchers have measured loads and validated models on model-scale turbines in towing tanks and flumes [
4,
5,
6,
7,
8,
9], very few load data sets are available for full-scale devices. Lake et al. [
10] measured strain on an operational floating tidal energy device, and full-scale testing of the SCHOTTEL tidal turbine was conducted according to International Electrotechnical Commission Technical Specification (IEC TS) 62600-200 for power performance assessment [
11]. As well, Harrold and Ouro [
12] reported rotor loads measured on a 400 kW tidal turbine and showed agreement with model predictions for ebb flow conditions. While these reports provide load data for larger-scale operational turbines, the blade design and composite blade layups were not reported or correlated with the loads. This leaves a gap in our knowledge of how blade design, materials, and manufacturing methods affect blade loads, and makes it challenging to validate blade models using the previously reported data.
The National Renewable Energy Laboratory (NREL) worked with Verdant Power to manufacture, characterize, and deploy both traditional epoxy composite blades and novel thermoplastic composite blades on Verdant Power’s Gen5d 5 m diameter turbines at the Roosevelt Island Tidal Energy (RITE) site in the East River in New York, enabling a side-by-side comparison of these materials and advancing the state of the art for better-performing composite materials. The secondary goal of this study was to enable blade and turbine models to be validated using operational load data correlated to the blade design. Epoxy blades were deployed on all three turbines on Verdant’s TriFrame in October 2020. In April 2021 one of the turbines with epoxy blades was replaced with a turbine with NREL-built and -instrumented thermoplastic composite blades. The thermoplastic turbine operated and produced power successfully for 3 months, contributing 31.8 MWh of energy into the New York City electric grid. In October 2021, the TriFrame, including an NREL-built data acquisition system (NDAQ) and thermoplastic rotor, were retrieved from the East River.
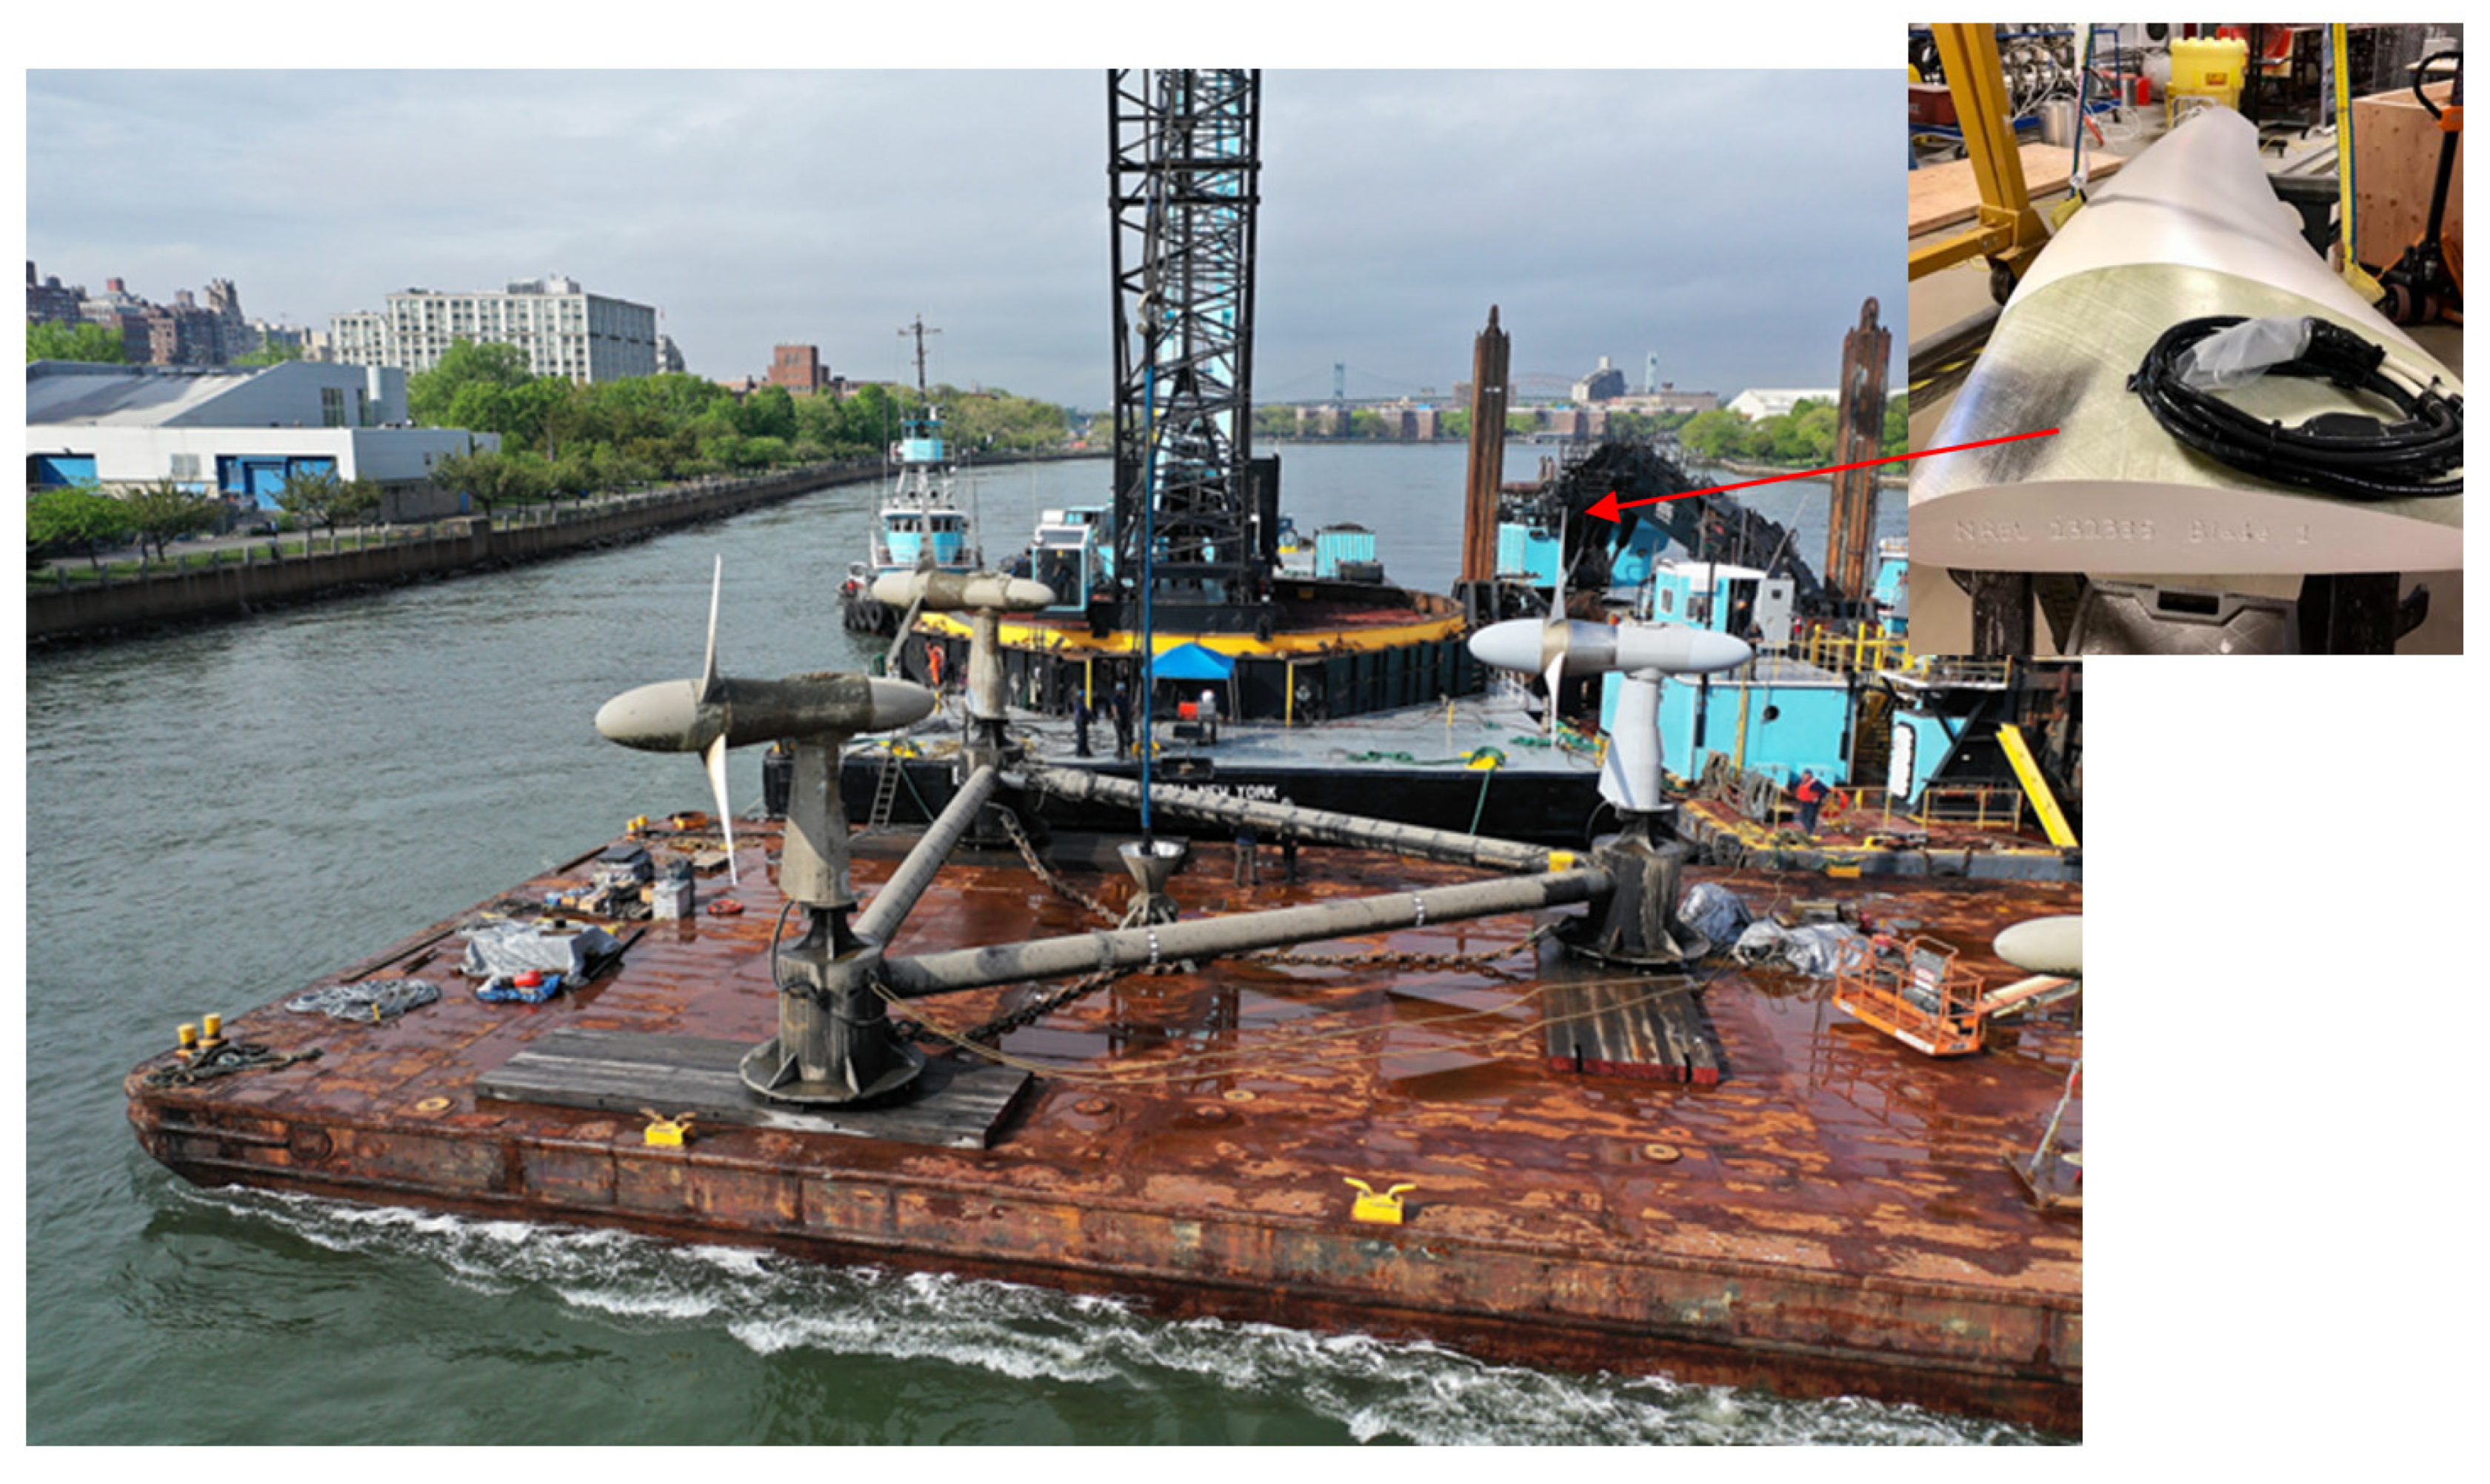
Figure 1 shows the retrieve-and-replace operation, with the thermoplastic blades on the turbine in the right side of the photograph.
The objective of this deployment was to collect load data for a large-scale operational tidal turbine with thermoplastic blades to (1) build confidence in the novel material and (2) validate numerical design tools to gain a better understanding of the operational conditions of such a device. Although there was a critical-path software error that resulted in only 4 h of load data being collected (discussed in more detail in
Section 4), the instrumentation and data acquisition system hardware were retrieved intact and still operational after the 6-month deployment. Because these types of measurement systems are new to the marine renewable industry, the aim of this article is to share the methodology and design of the instrumentation and NDAQ hardware to be leveraged for future deployments.
2. Data Acquisition System Design
This section outlines the design of the NDAQ. Verdant Power had upstream and downstream acoustic Doppler current profilers and equipment to monitor the power output of the turbines. With this already in place, the NDAQ was used to measure the strain and angular position of the thermoplastic blades. The Verdant Power 5 m diameter turbines have a tail cone with a ~1 m diameter void on the inside. The NDAQ was designed to fit within this tail cone where it would have minimal impact on overall performance and would not alter major drivetrain components. Because of budget and time constraints, it was not possible to modify the turbine or to add a slip ring to allow for communication between the rotating and non-rotating parts of the turbine. The measurement objectives of the NDAQ focused primarily on collecting data sufficient to quantify the structural performance (strain) of the thermoplastic blades and validate numerical models (blade angular location). The measurement criteria that guided the NDAQ system design were as follows:
Continuously acquire data for a 6-month deployment period
Gather strain measurements on all three blades at multiple locations, resulting in a total of 16 strain gages to be monitored
Record the angular position of the hub, resulting in the need for at least one accelerometer or inertial motion unit (IMU)
Acquire data at a frequency above the hub rotational frequency.
These measurement criteria and the inability to make any turbine modifications led to challenging space and environmental conditions that guided the structural design decisions. The following list summarizes the main challenges:
Because the nose cone of the turbine was flooded, the NDAQ would be continuously submerged under water for the duration of the deployment.
With no slip ring or turbine modifications, the NDAQ would have no shore-based power, communication, or data retrieval once deployed.
Because the nose cone is part of the rotating hub, the NDAQ would have to rotate with the rotor.
The NDAQ structure would be in contact with dissimilar metals in seawater.
The main challenges in the design of the NDAQ were (1) having sufficient battery capacity to operate over the deployment period, (2) ensuring the system could log and store data during the 6-month deployment, and (3) ensuring the system could fit within the turbine tail cone with no impact on turbine performance. These requirements led to a water-tight, self-contained system that operated solely on non-rechargeable battery power. With the need for a battery-powered system for 6 months of continuous operation, the use of the National Instruments-based NREL Modular Ocean Data Acquisition (MODAQ) system was determined to be infeasible due to the higher power requirements of MODAQ. Therefore, a platform that consumed less power was developed for this measurement campaign. The platform used the commercially available Campbell Scientific CR6 as a system controller and the Volt 116 as the analog-to-digital converter (ADC) for strain gage signals. This off-the-shelf system was chosen because it could satisfy the measurement requirements and substantially reduce the power requirement compared to the NREL MODAQ system. Furthermore, the components are designed for long-term, autonomous data acquisition with proven reliability from years of commercial deployments and ongoing use in other NREL-led environmental monitoring projects.
The NDAQ software did not contain any event-driven acquisition methods or conditional measurements (for example, “only record data when the turbines are rotating”) due to the uncertainty in the values that would be measured during the deployment and the risk of adding complexity. As a result, the potential acquisition rate was limited in favor of a slower but more regular sample rate from all sensors. The NDAQ operating plan was to start data collection immediately upon system power-up and continue throughout the deployment period, independent of the values being measured by the sensors.
The data logger file system was based on a FAT32 structure (common in low-power DAQ applications), which had a maximum of 32 GB of onboard storage. This storage limit constrained the data sample rate and bit resolution. The strain gage acquisition rate was chosen to be 20 Hz while the IMU data rate was 10 Hz, providing a sample rate well above the rotational rate of the turbine (~0.5 Hz). All data were saved as 16-bit floating point values along with time stamps in the Campbell Scientific TOB1 binary file format, which can be converted to more general formats in post-processing. From calculations and experience throughout pre-deployment testing, the 6-month deployment was expected to generate 28 GB of data following the onboard storage formatting being used. This would allow for an additional 3 weeks of data storage to account for variability in battery power based on environmental conditions and flexibility with the deployment or retrieval time frame. Data storage was intended to end once the external storage card was full to avoid overwriting data from the early stages of the deployment (this is where the error occurred, which will be discussed in detail in
Section 4).
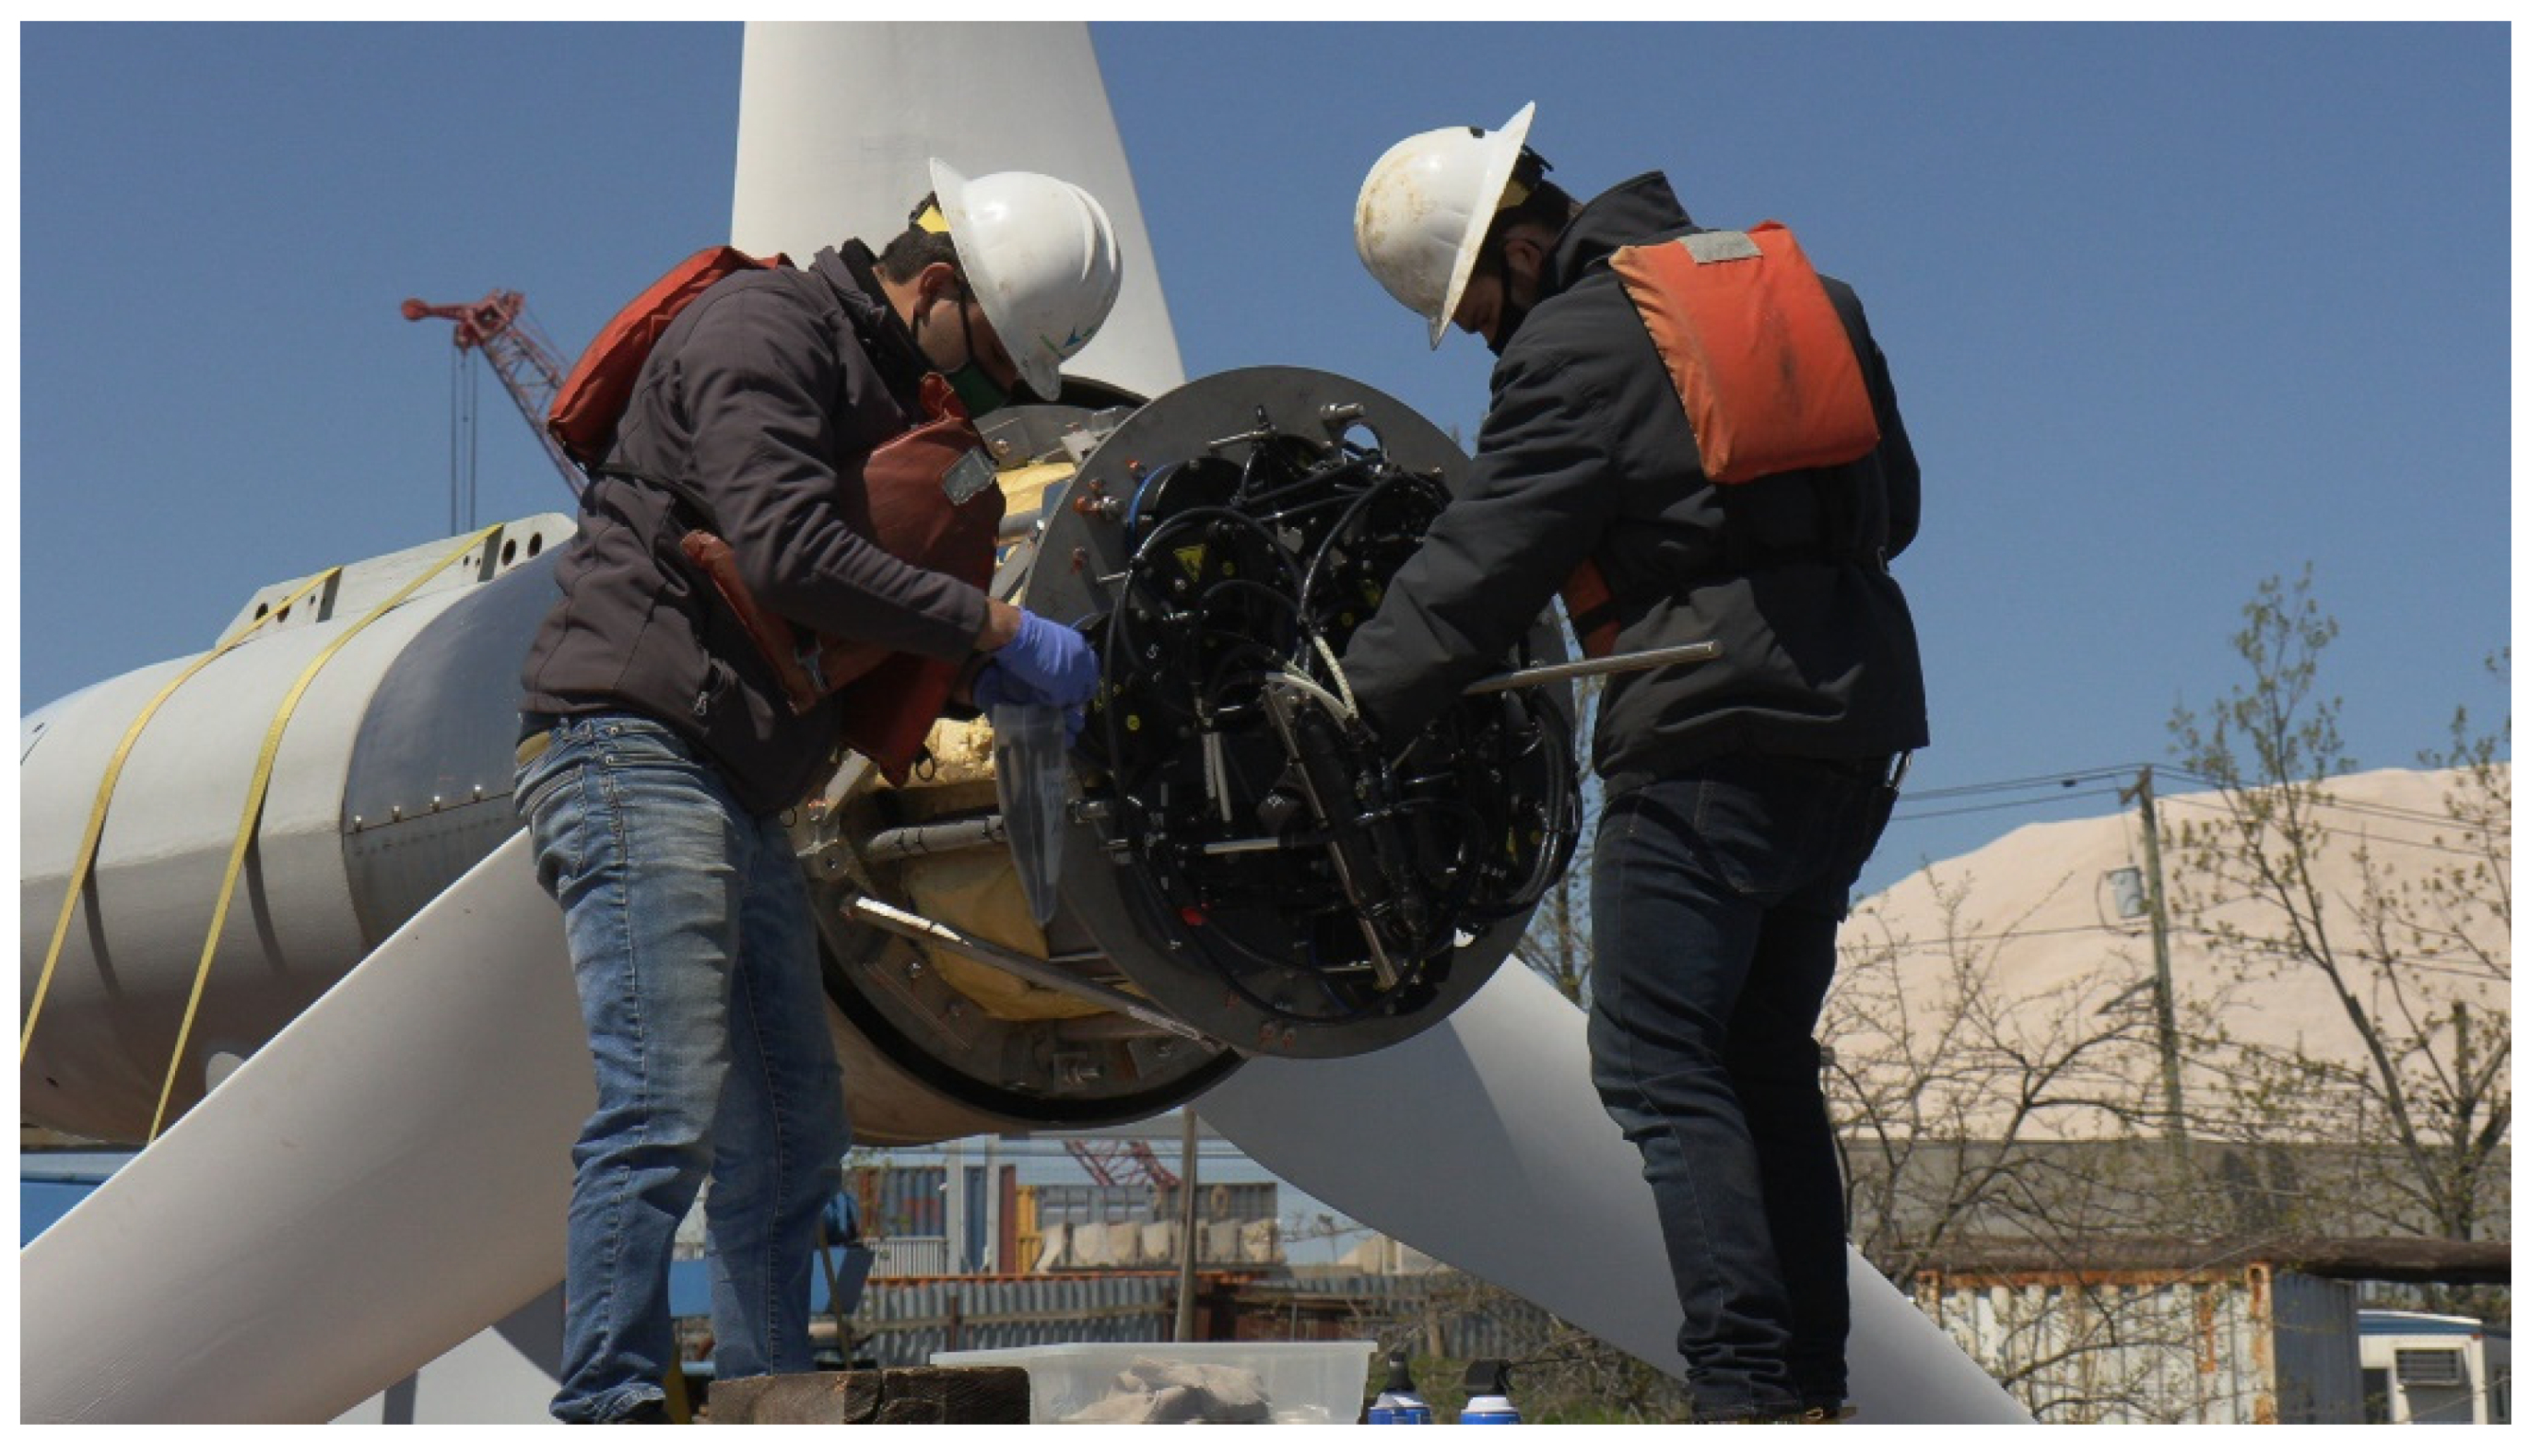
Figure 2 shows the Verdant Power turbine with the NREL-built thermoplastic blades and NDAQ being installed prior to the deployment.
2.1. Power Delivery
To monitor and record data for 16 strain gages and one IMU, the total power draw was estimated to be 6.2 W continuous, including power for all sensors based on the device specifications. This gave a battery capacity requirement of ~27,000 Wh to run the system for the 6-month deployment. Nortek 15 V, 1800 Wh battery packs based on Tadiran lithium-thionyl-chloride primary cells were used to supply power to the NDAQ. The total battery bank for the deployment consisted of 20 Nortek battery packs, giving a total rated capacity of 36,000 Wh. This additional capacity accounted for environmental factors affecting the capacity and allowed for additional deployment time if weather delayed the turbine retrieval. For example, supplier data sheets provided estimates of ~85–90% of rated battery capacity at the expected cooler East River water temperature, giving an estimated battery bank capacity of ~31,000 Wh when deployed in East River conditions. This capacity provided safety against battery pack failure while still fitting into the Verdant turbine hub. The battery bank was wired with each pack in parallel, creating a large capacity with isolating diodes restricting current flow out of individual battery packs and separating the total battery bank into two sections (
Figure 3).
2.2. Instrumentation
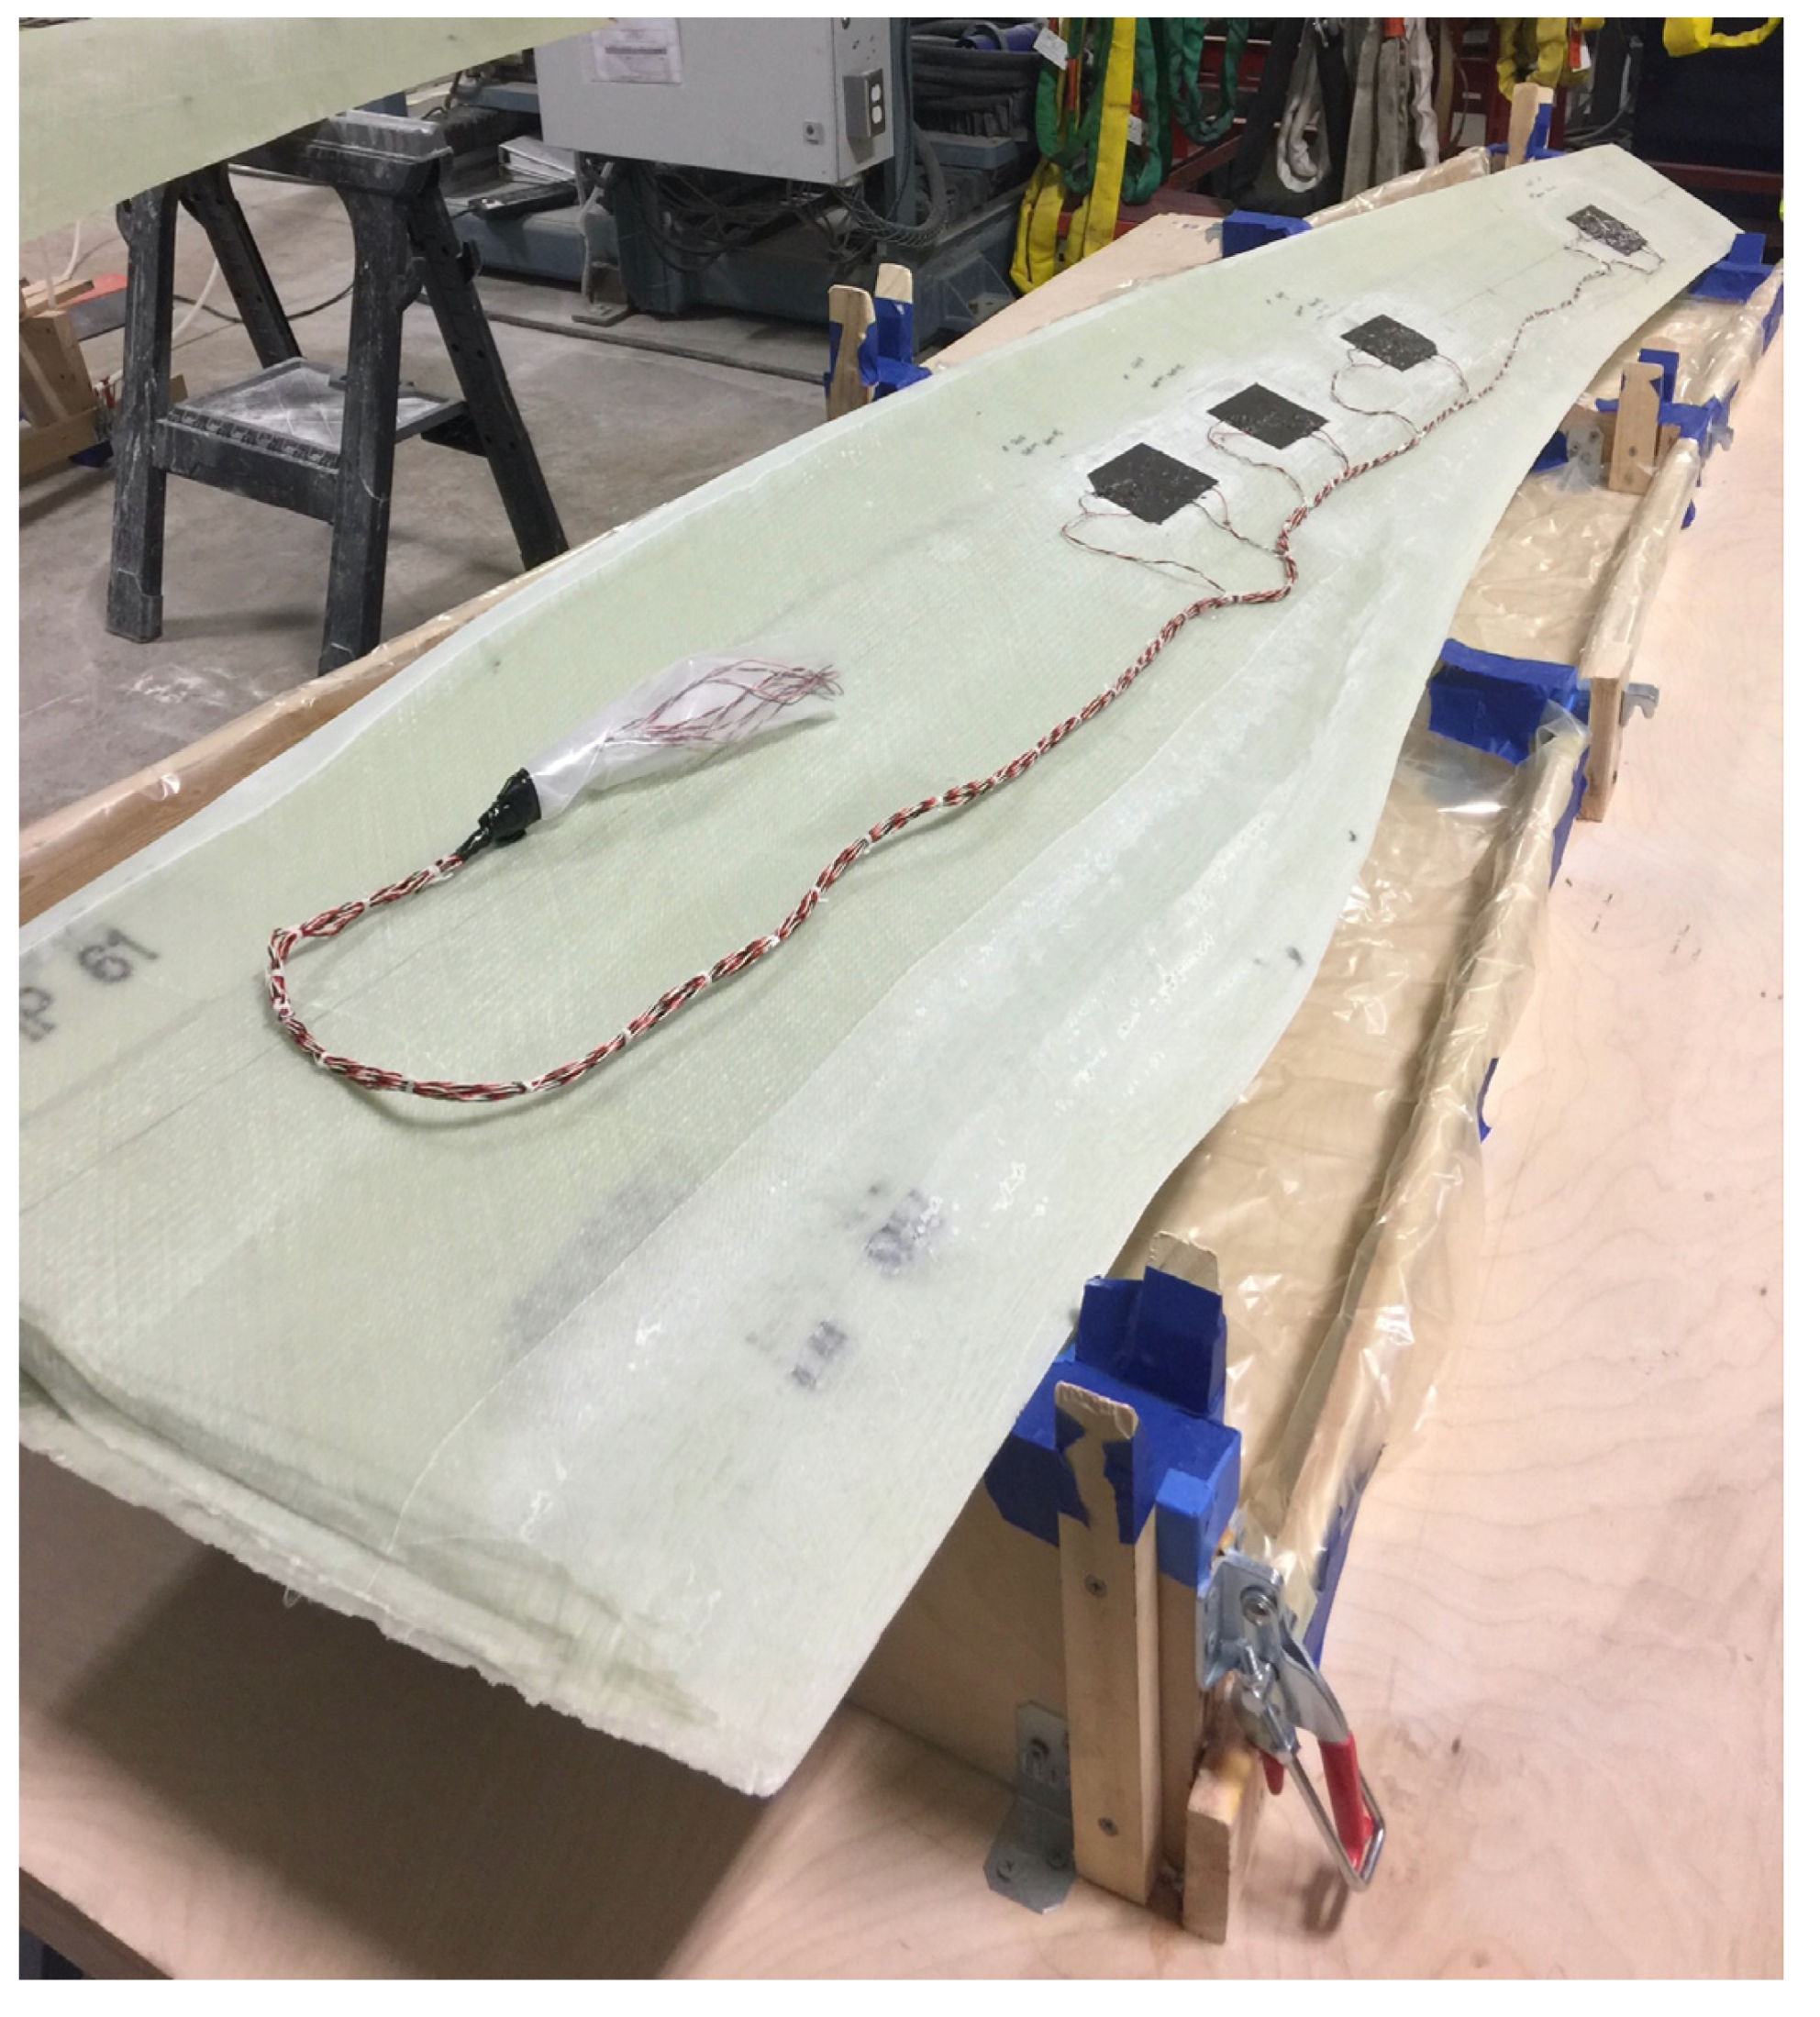
Vishay Micro-Measurements CEA-13-250UW-350 resistance strain gages were installed on the 2.5 m long internal skins of all three thermoplastic blades for strain measurement in both the flapwise and edgewise blade orientations in accordance with the requirements stated in IEC TS 62600-3 marine turbine measurement loads. All the strain gages had a nominal 350-ohm resistance and were connected in a three-wire configuration. Spar cap strain gages were orientated at 0 degrees (parallel with the spar cap) and mounted on the center of the spar caps on both the high- and low-pressure sides of the blade. Leading-edge (LE) and trailing-edge (TE) strain gages were positioned 50 mm in from the edge and oriented perpendicular to the local radial line. The radial line originates at the rotor center of rotation.
Table 1 shows the gage locations and names, and
Figure 4 shows the internal strain gages on the inside of one of the thermoplastic blade skins.
These internal strain gages correspond to external gage locations that were used on a blade manufactured specifically for structural testing (not deployed). This meant that after the deployment the internal gage readings for the deployed blades could be related to the external strains measured during structural testing of the non-deployed blade during post-processing. Because of a data collection issue discussed later, this method was not actually employed for this project.
Supplementary Materials shows the process for applying the internal strain gages for the deployed blades in detail.
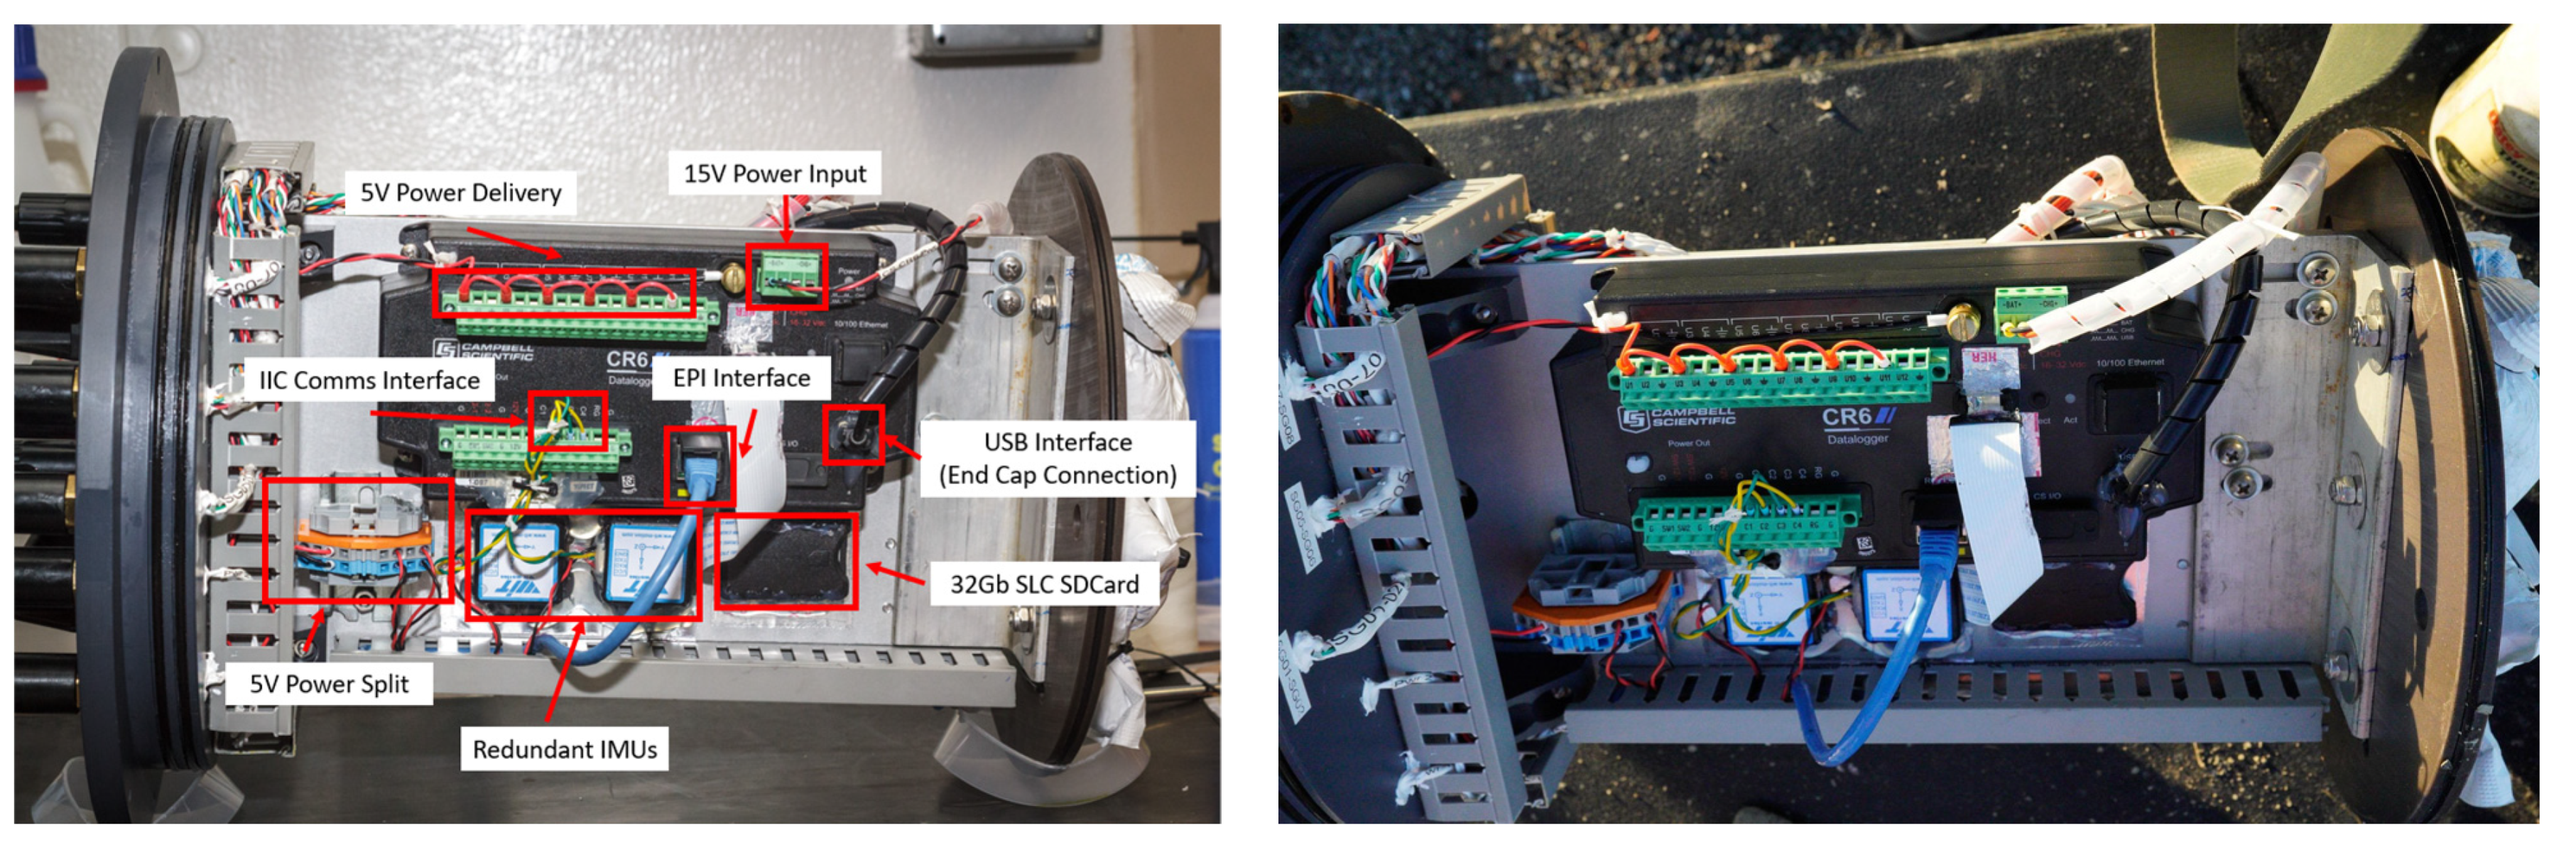
2.3. Data Logger
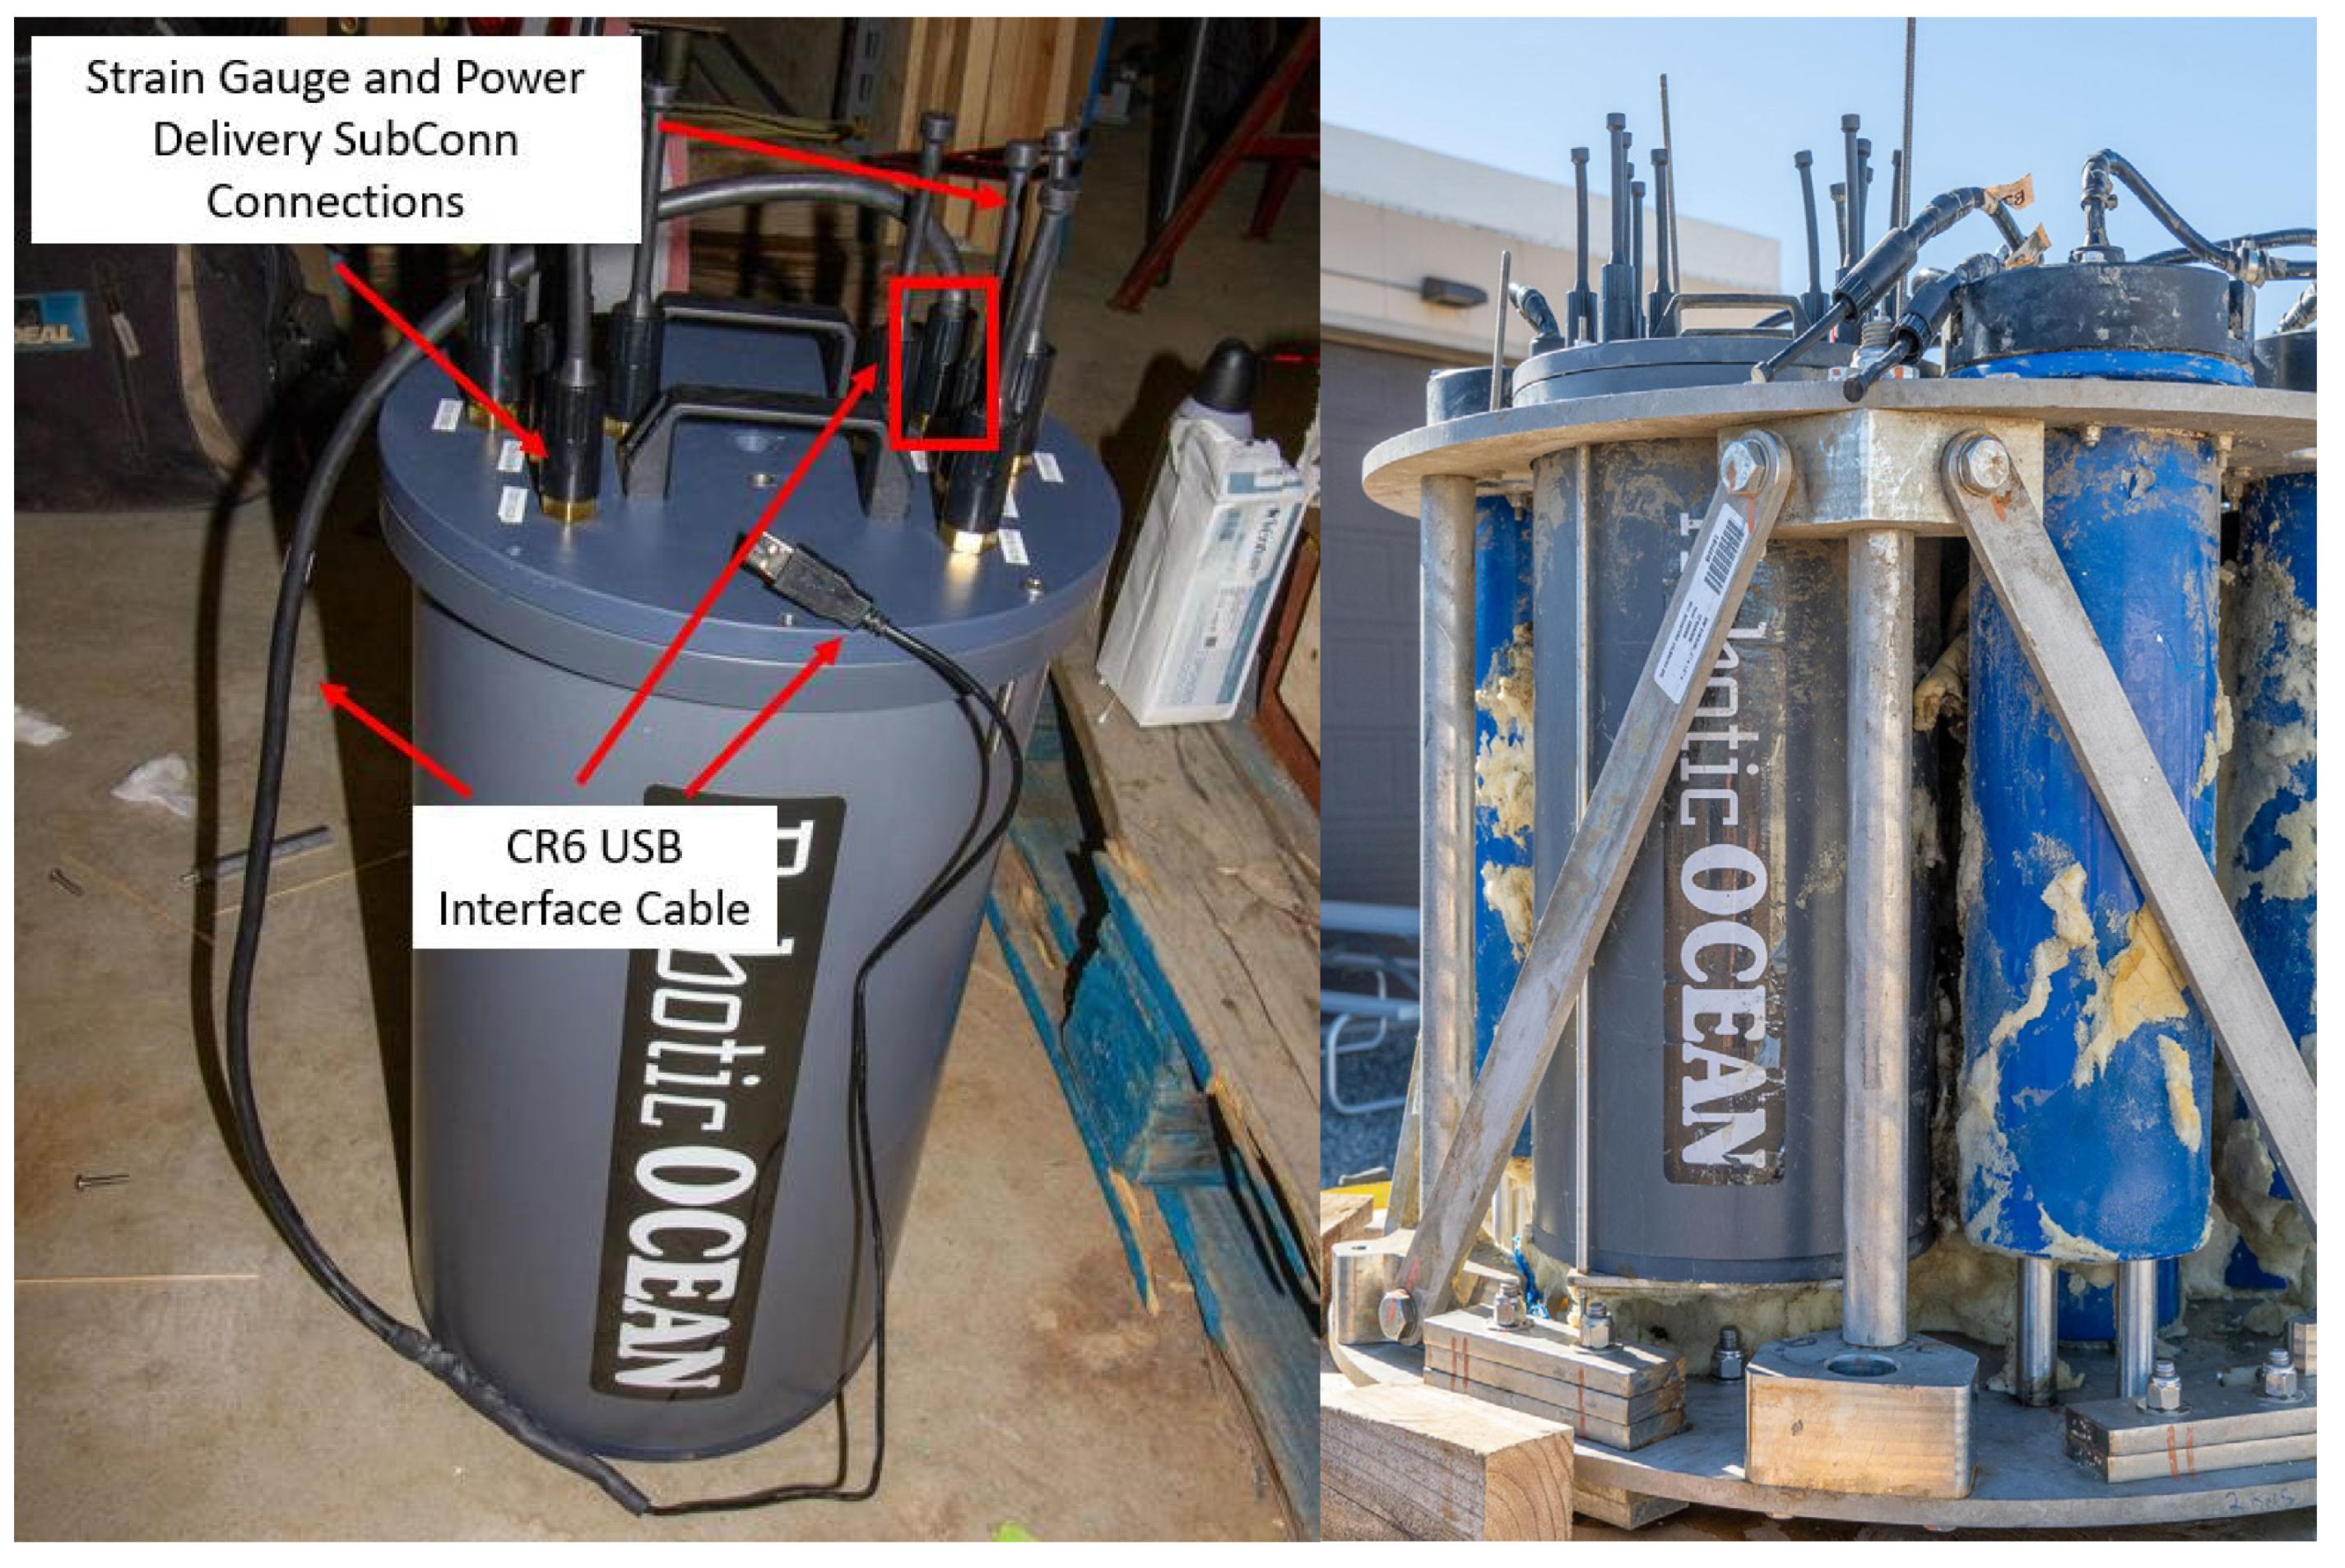
Figure 5 shows the Robotic Ocean canister (before and after deployment) used to house the Campbell Scientific data logger, analog-to-digital converter, strain gage bridge completions, power distribution circuitry, and IMUs. SubConn depth-rated bulkhead connectors (two-pin connectors for power and eight-pin connectors for strain gages) were wired through the lid to external sensors, batteries, and a USB. This canister had an applied vacuum and was sealed and remained under vacuum until it was recovered after the deployment. The wiring was designed to allow a user to operate and monitor the system without needing to remove the canister lid to connect directly to the data logger, allowing it to be used for dockside calibrations and monitored during start-up.
The CR6 data logger and Volt 116 ADC were connected via the Campbell Scientific proprietary Ethernet Peripheral Interface (EPI) which allowed the two devices to be mounted on custom brackets on the backplane within the canister (shown in
Figure 5,
Figure 6 and
Figure 7). Strain gage sensor wiring was routed directly to the ADC where the bridge completions were made, measured, and transferred to the data logger via ethernet to be saved. The IMUs (based on the MPU-6050 chipset) were powered and monitored with the data logger. A tight-fit brace was mounted at the base of the backplane to provide extra stability to the entire system within the canister and reduce any loading on the end cap, which could induce leaks during the deployment.
Figure 6 shows the parallel connections for both halves of the battery bank with diode isolators to prevent power-back if the battery banks were compromised. The individual battery packs all contained small battery management systems that limited individual cell balancing behavior while fully connected. By using newly built, primary-cell battery packs for this system, the initial state of charge for the entire battery pack was well balanced, and no indication of uneven power draw from any part of the battery pack was observed.
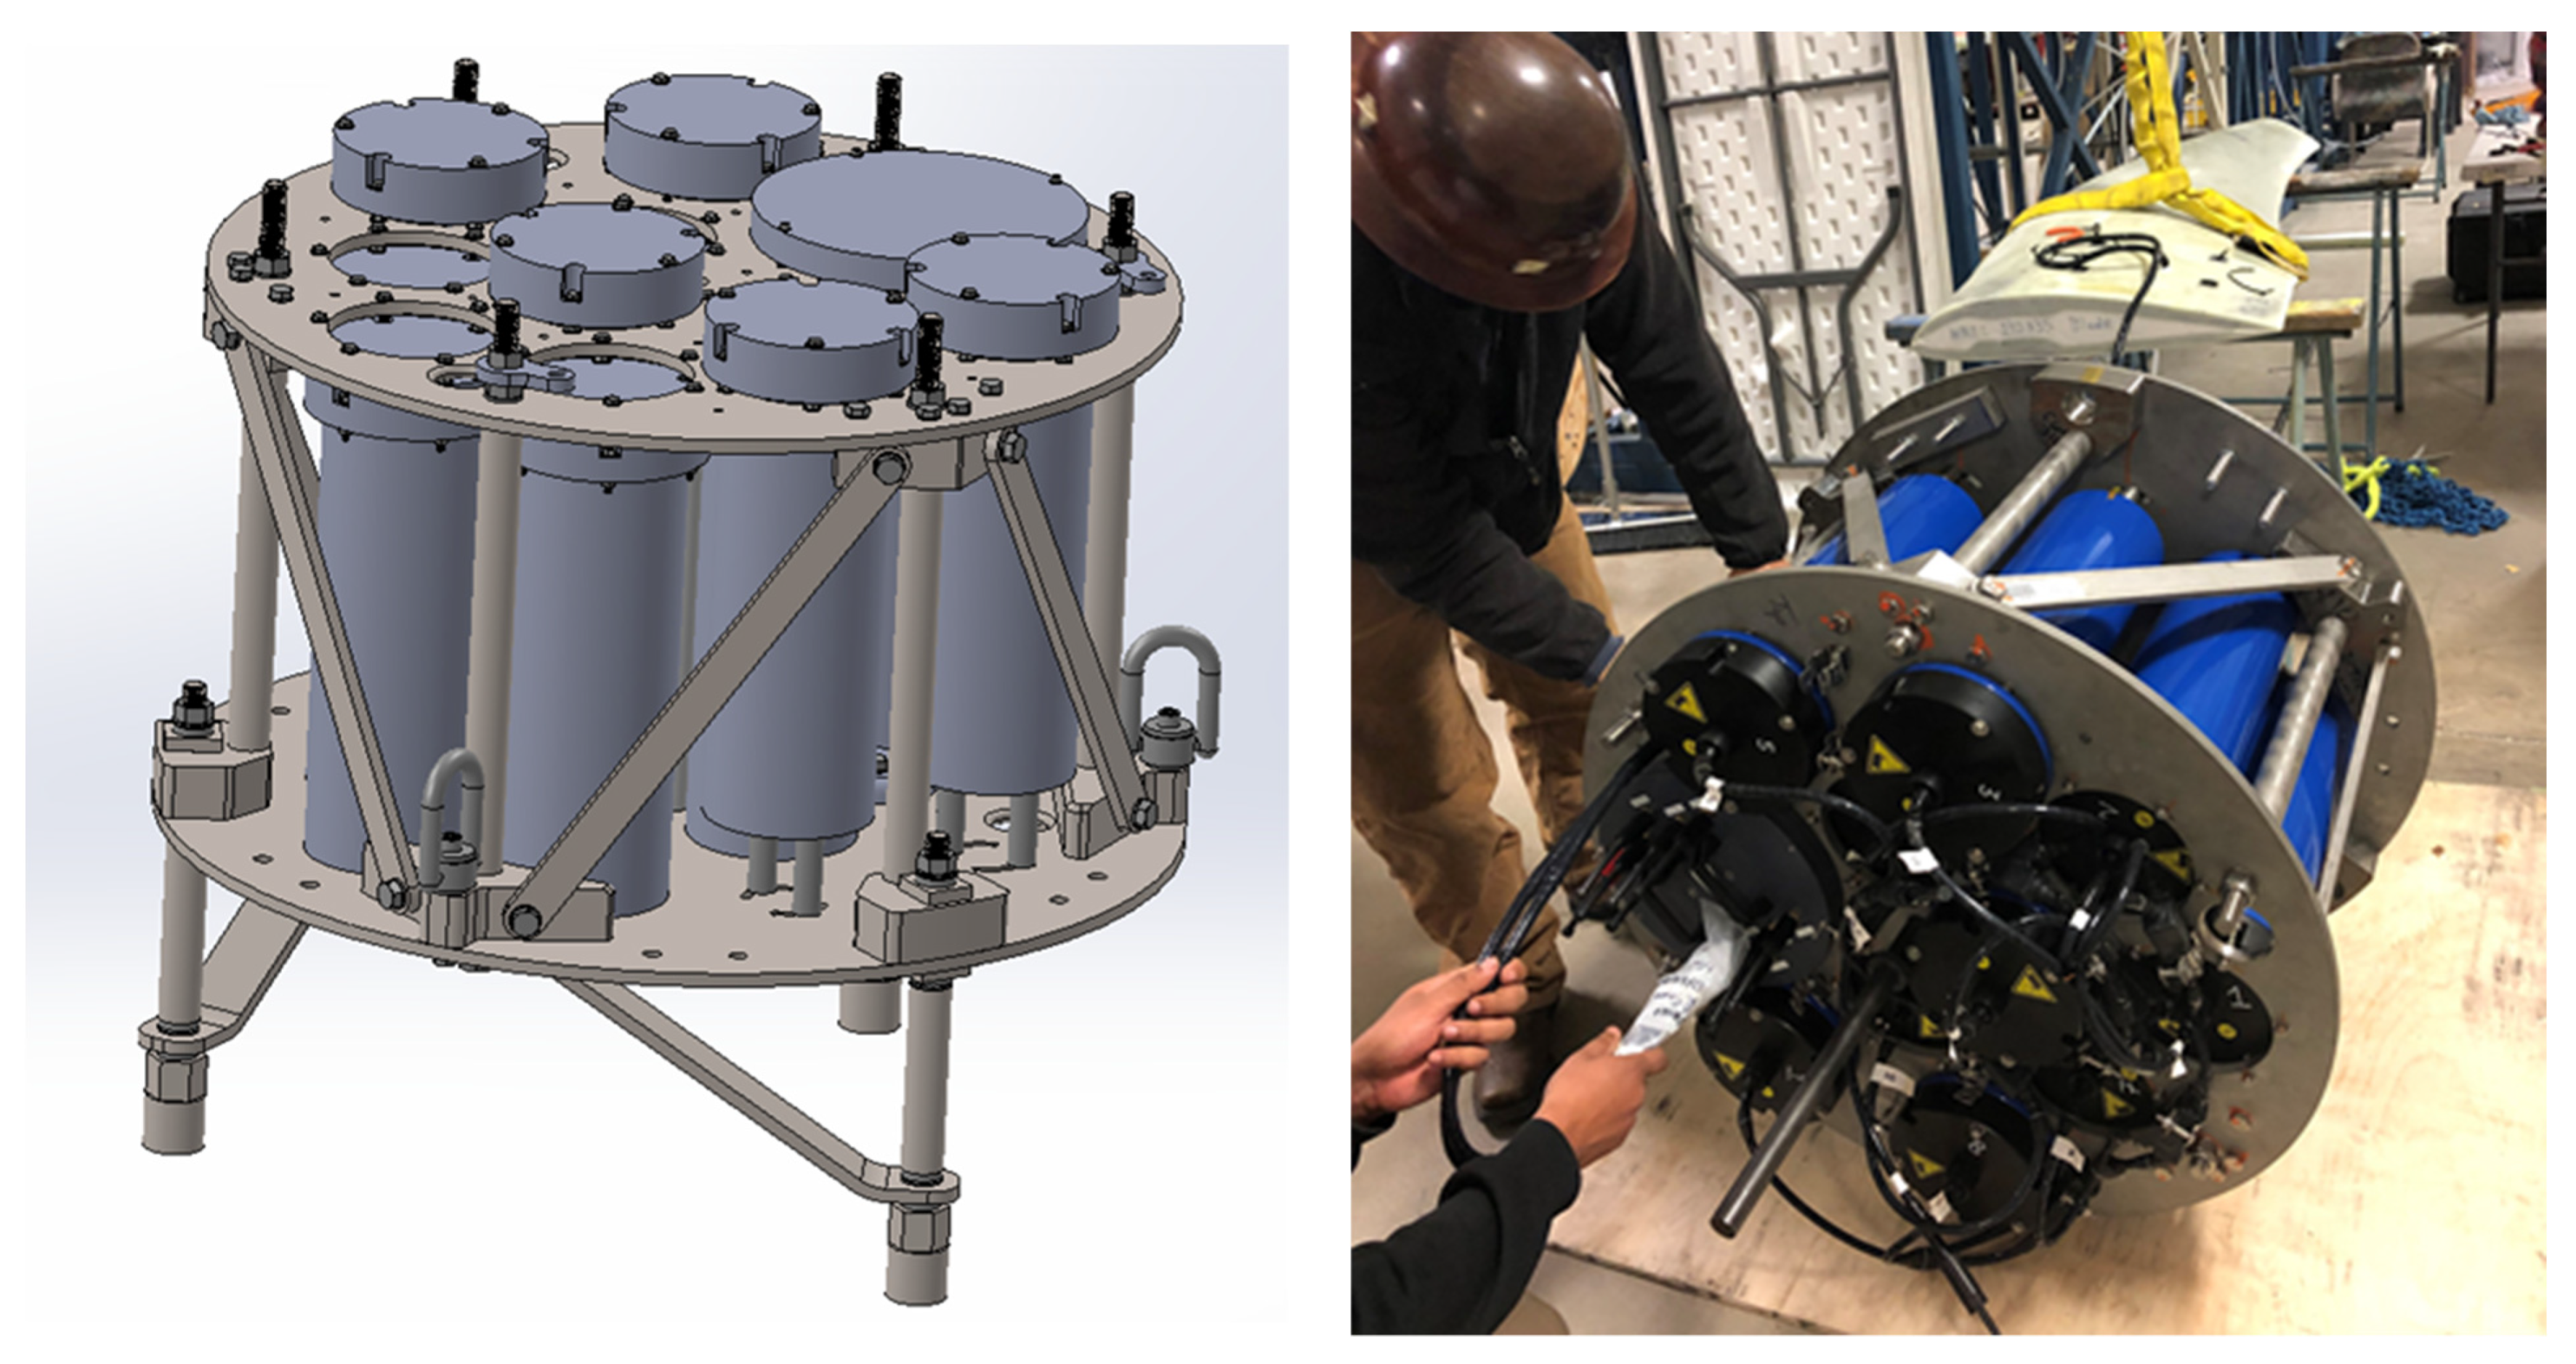
2.4. NDAQ Structure
The NDAQ structure was designed based on a structural analysis of the expected loads and modeled in SolidWorks with the turbine tail cone to ensure a proper fit. The array of 10 Nortek battery canisters, the Robotic Ocean canister containing the data logger, and the structure itself all had to fit within the tail cone of the rotor. Because the turbine has a relatively low rotational speed and all components are close to the center of rotation, the structural design was more space-constrained than strength-limited. Ultimately, a wrapped-truss design was chosen to transfer the rotational loads to the hub. The final structure comprised round plates at the top and bottom, threaded rods inside compression tubes connecting the plates, and diagonal braces forming the truss. The structure was mounted to the hub using three existing bolts located on the hub in a rotationally symmetric pattern.
The entire structure, including the hardware, was constructed using 316 stainless steel components. Additional features included pass-through holes for wiring, removable lifting fixtures for rotation and installation, and a sacrificial anode to minimize galvanic corrosion during deployment.
Figure 8 shows a SolidWorks model of the NDAQ and a photo of the NDAQ being connected to one of the thermoplastic blades.
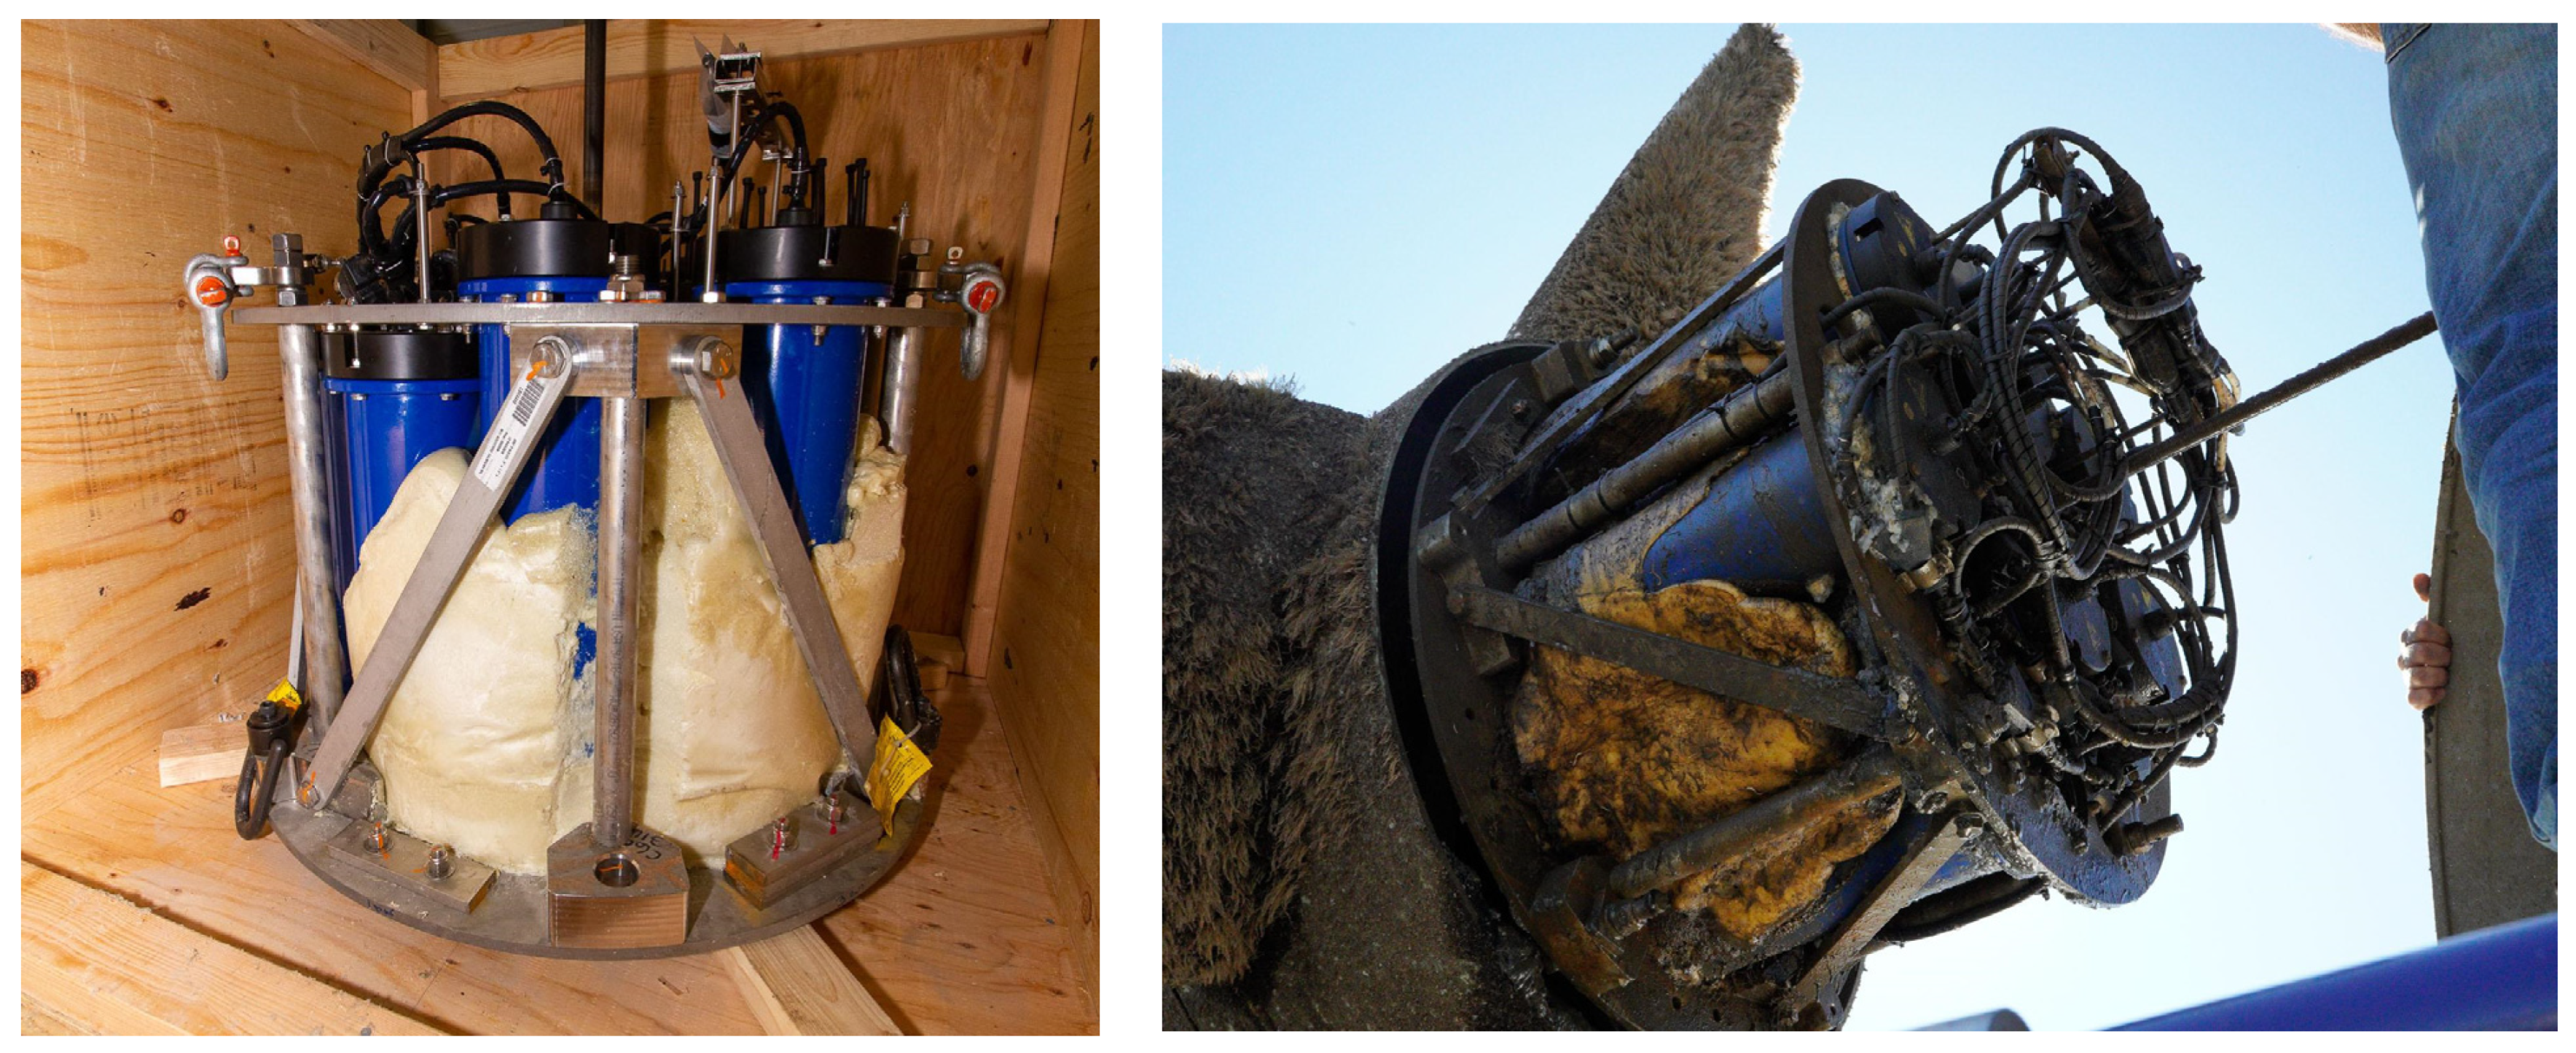
For the NDAQ to not introduce excessive cyclic loads on the turbine shaft, it was rotationally balanced by adding weights circumferentially. This was performed by placing a solid steel shaft through the center of the structure (coincident with the rotor axis) and suspending the steel shaft on roller bearings. Weights were added to the top side of the structure; then, the light and heavy sides of the structure were reevaluated until there was little to no rotational bias. After completing the NDAQ build-out and validating that it was working properly, the team filled the voids between battery canisters with a FiberGlast polyurethane expanding foam to help increase buoyancy and reduce the in-water weight of the NDAQ.
Figure 9 shows the NDAQ with the foam both before and after deployment.
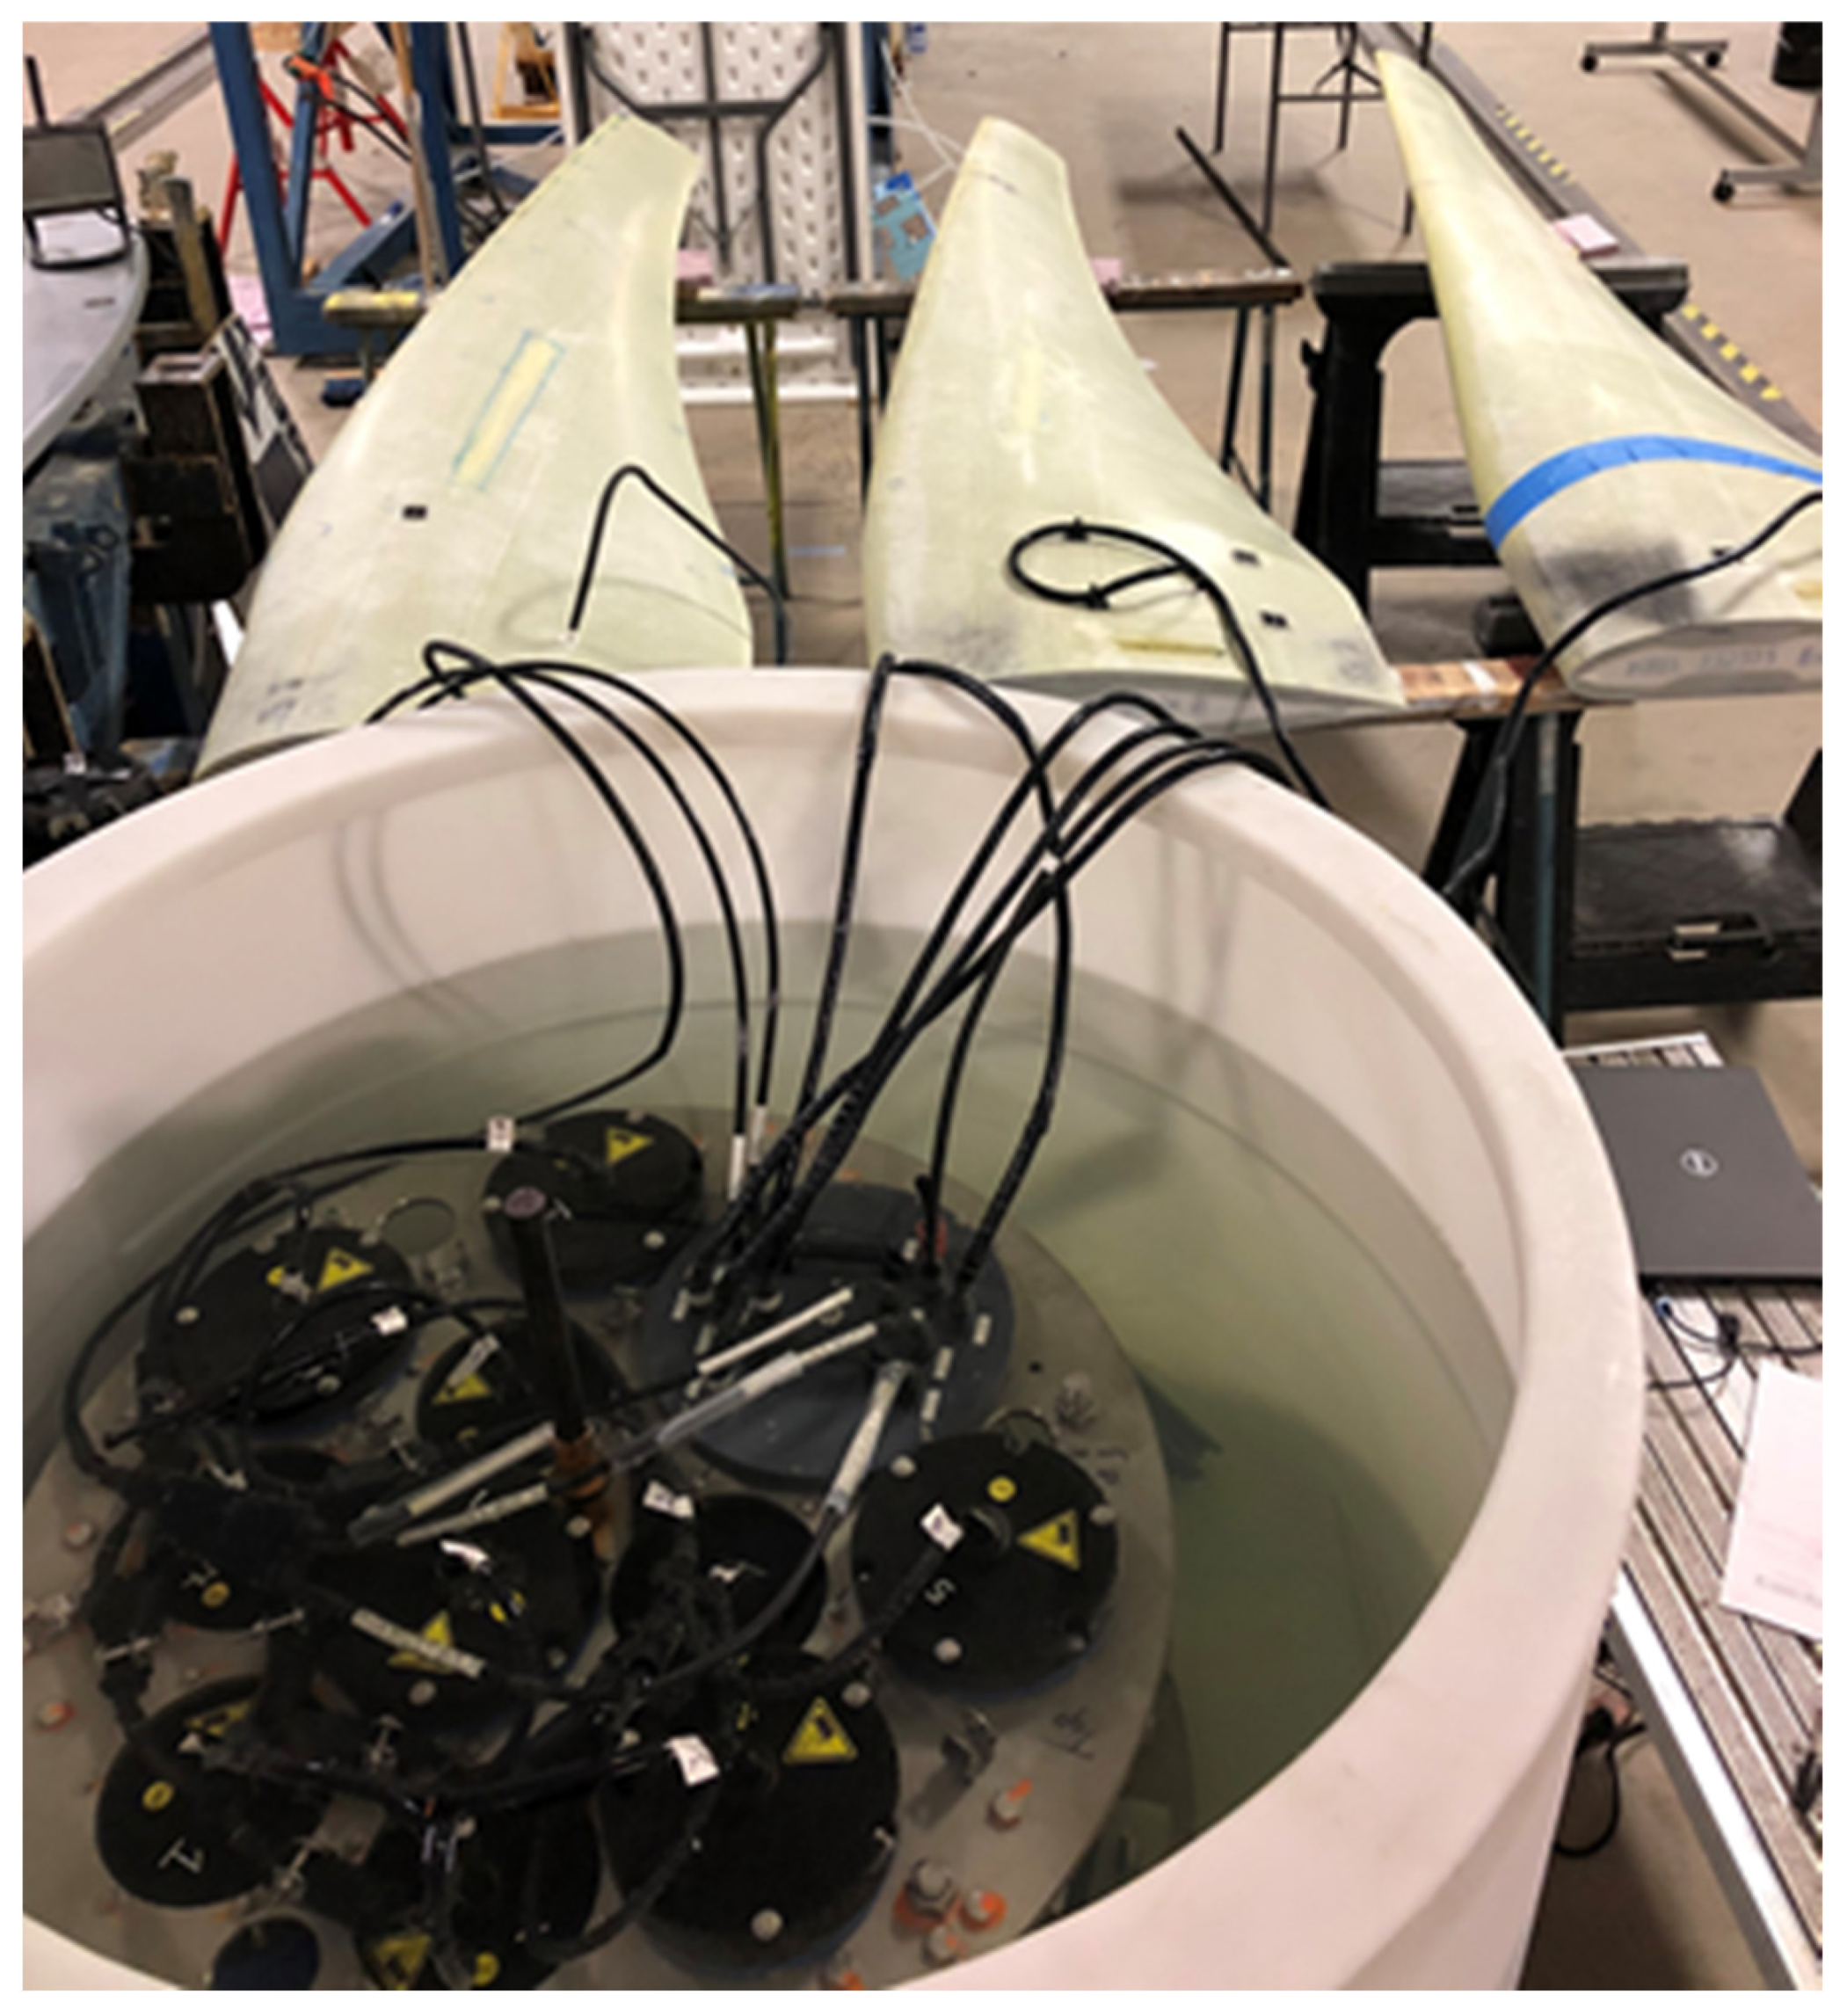
3. Data Acquisition System Validation
The final stage prior to sending the NDAQ for deployment was to verify that the strain gages and instrumentation were functioning as expected, and the data logger canister and battery canisters were sealed properly. To do this, the NDAQ was first fully connected to all sensors and a separate testing battery pack to simulate the total battery bank. The NDAQ was configured to run in deployment operating mode for 10 days. During this test, all data from the strain gages and IMU were successfully recorded and logged on the internal memory card. In addition to the normal operation tests, an external power monitoring system was put in place to monitor the total system power draw. Several power disconnect tests (plug and unplug the testing battery bank) were performed to identify potential issues that would cause the system to stop acquisition. No issues were observed. Upon a complete power interrupt, the system resumed normal operation once power was restored.
Once testing was complete, the NDAQ was connected to all three blades and submerged in a tank of water for 3 days to test the canister seals and vacuum applied to the NDAQ canister (
Figure 10). At this time, a submerged weight was taken and compared to the normal weight to determine the structure’s buoyancy. The submergence test confirmed that all wired connections and seals were installed correctly and functioned well under water for the limited duration of the test.
The only issue that arose during testing was a long-term idle sleep setting that was active on the IMU. During the data collection it was observed that after 36 h the IMU would stop transmitting data. Once identified, this setting was changed so the IMU would never sleep; however, this highlights the importance of longer-term testing.
During the pre-deployment testing of the fully connected NDAQ system, an in-house National Instruments DAQ was used to monitor the real-time power consumption of the NDAQ running on battery power over a weeklong period. It was found that the total system draw was ~2.1 W continuous, as opposed to the previous 6.2 W estimate. The difference was attributed to removing and turning off any built-in communication or unnecessary features on the NDAQ Campbell Scientific system for the deployment that were not default system settings and therefore not reported in equipment data sheets. With this experimentally confirmed power consumption, the operational life of the system was estimated to be ~600 days, which was well above the deployment period, providing a considerable cushion for any type of power delivery failure. The NDAQ’s capabilities were determined to satisfy the main design parameters.
Based on the results of the verification process, the NDAQ and blades were deemed ready for deployment and were sent to Verdant Power for installation on the turbine.
4. Deployment and Recovery of Deployed NDAQ
In April 2021, the Verdant Power TriFrame, including the NDAQ and thermoplastic rotor, were deployed in the East River, where they remained for 6 months. Although the code written to operate the NDAQ was verified and tested thoroughly at NREL prior to sending the NDAQ to Verdant, upon retrieval of the system after the 6-month deployment, only 4 h of data were recorded for the last 4 h of operation of the NDAQ. A last-minute code change was made after the verification process; upon investigation of the post-deployed code, it was found that a negative sign was missed in the read/write function. The negative sign represents “auto-allocation” on the memory card, allowing the NDAQ to continually grab more memory as data comes in. In what was deployed (2 vs. −2), the system allocates a fixed amount of memory for two files, and the oldest files are overwritten as new data come in (all in the same space in memory, which makes any old data unrecoverable). This caused the code to read 4 h of data and then write over these data repeatedly instead of continuing to write until the storage card was full. This means that even though data were read by the NDAQ during the deployment, they was overwritten on the card.
The code change was implemented to remove data storage of a strain gage that was damaged during bonding of the blade in order to save space on the memory card. Since the strain gages were applied internally to the two blade skins, when the blade skins were bonded together, one of the wires was pinched and damaged. The code change was not communicated to the team, and the use of the NDAQ during dockside calibration and other periods with an active connection to the NDAQ were not sufficient in time duration to highlight this specific error. Hence, the error was not caught before deployment.
This error was a result of inadequate quality assurance and quality control (QA/QC) processes for the deployed NDAQ software. In most DAQ cases that NREL has experience with, rigorous software QA/QC is unnecessary because they are monitored and repairable in real time. In this case, once the NDAQ was deployed, communication with the system for fault monitoring, status, or data validity checks was impossible until it was retrieved 6 months later. This risk should have been identified, and the same stringent QA/QC should have been used for the software as for the hardware and structural testing.
NDAQ Structure and Instrumentation
The NDAQ structure was completely intact upon retrieval, including the foam, tail cone, and supports. All cable connections were still secure and had not been damaged during deployment. The NDAQ canister that housed the Campbell Scientific data acquisition system still had the vacuum seal, which was implemented by NREL prior to shipping in February 2021 (
Figure 9). However, there was no power being drawn from the batteries and 0 V were measured coming to the DAQ from the batteries.
The ultimate failure of the NDAQ occurred on 13 September 2021 (5.5 months into the 6-month deployment), and was due to an inadequate amount of zinc in contact with the structure. Once the zinc anodes had fully deteriorated, the next pieces to corrode were the battery canisters, which resulted in a short circuit from water ingress to several of the Nortek battery cans. When one battery canister shorted, we suspect that it put the rest of the batteries into a fail-safe mode. However, when the batteries were disconnected to check them individually and then reconnected, they reset and the DAQ turned back on. After this reset, the last voltage readings recorded were at ~15.1 V, meaning that the whole battery bank was only 20% discharged.
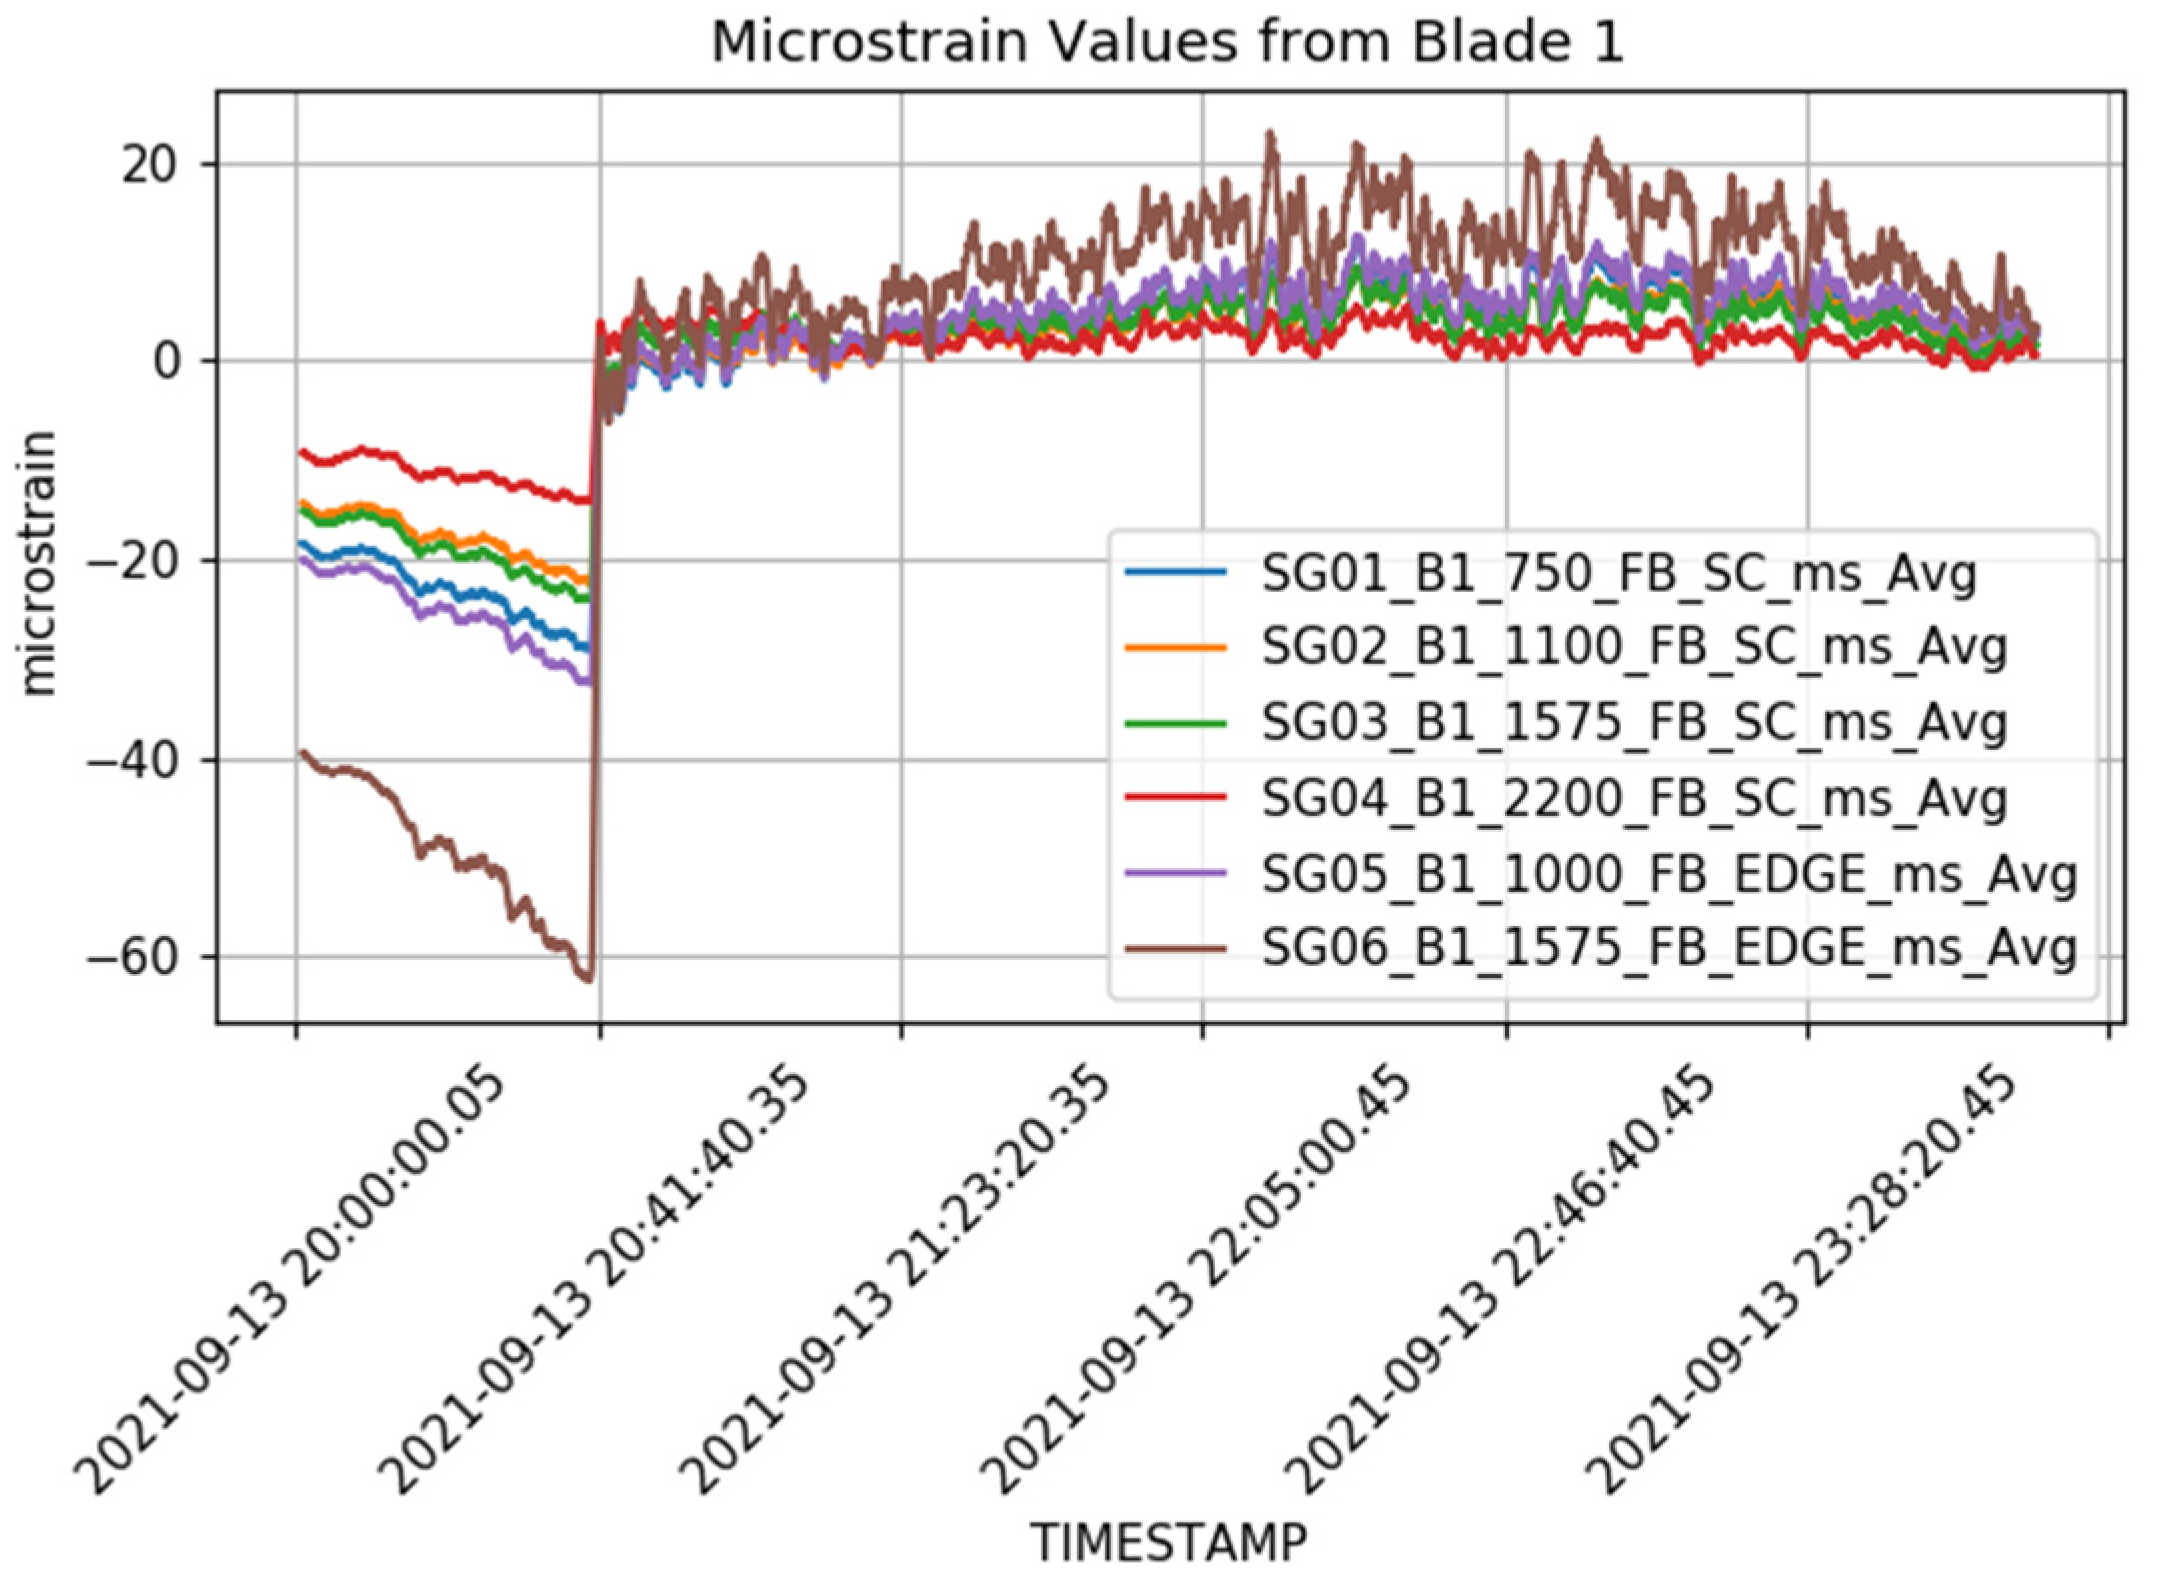
All strain gages and IMUs were found to be operating within acceptable ranges after deployment once external power was applied. This means that all connections between the blade strain gage locations and the NDAQ survived the deployment. Four hours of data (strain gages and IMU) were recorded by the NDAQ on 13 September 2021, as shown in
Figure 11. Upon post-deployment verification, the NDAQ recorded ~242 million iterations of the sampling, equating to 3.7 billion data points total, and it powered down between hours 3370 and 3372 of operation (140 days). This suggests that the NDAQ was fully functional up until this date.
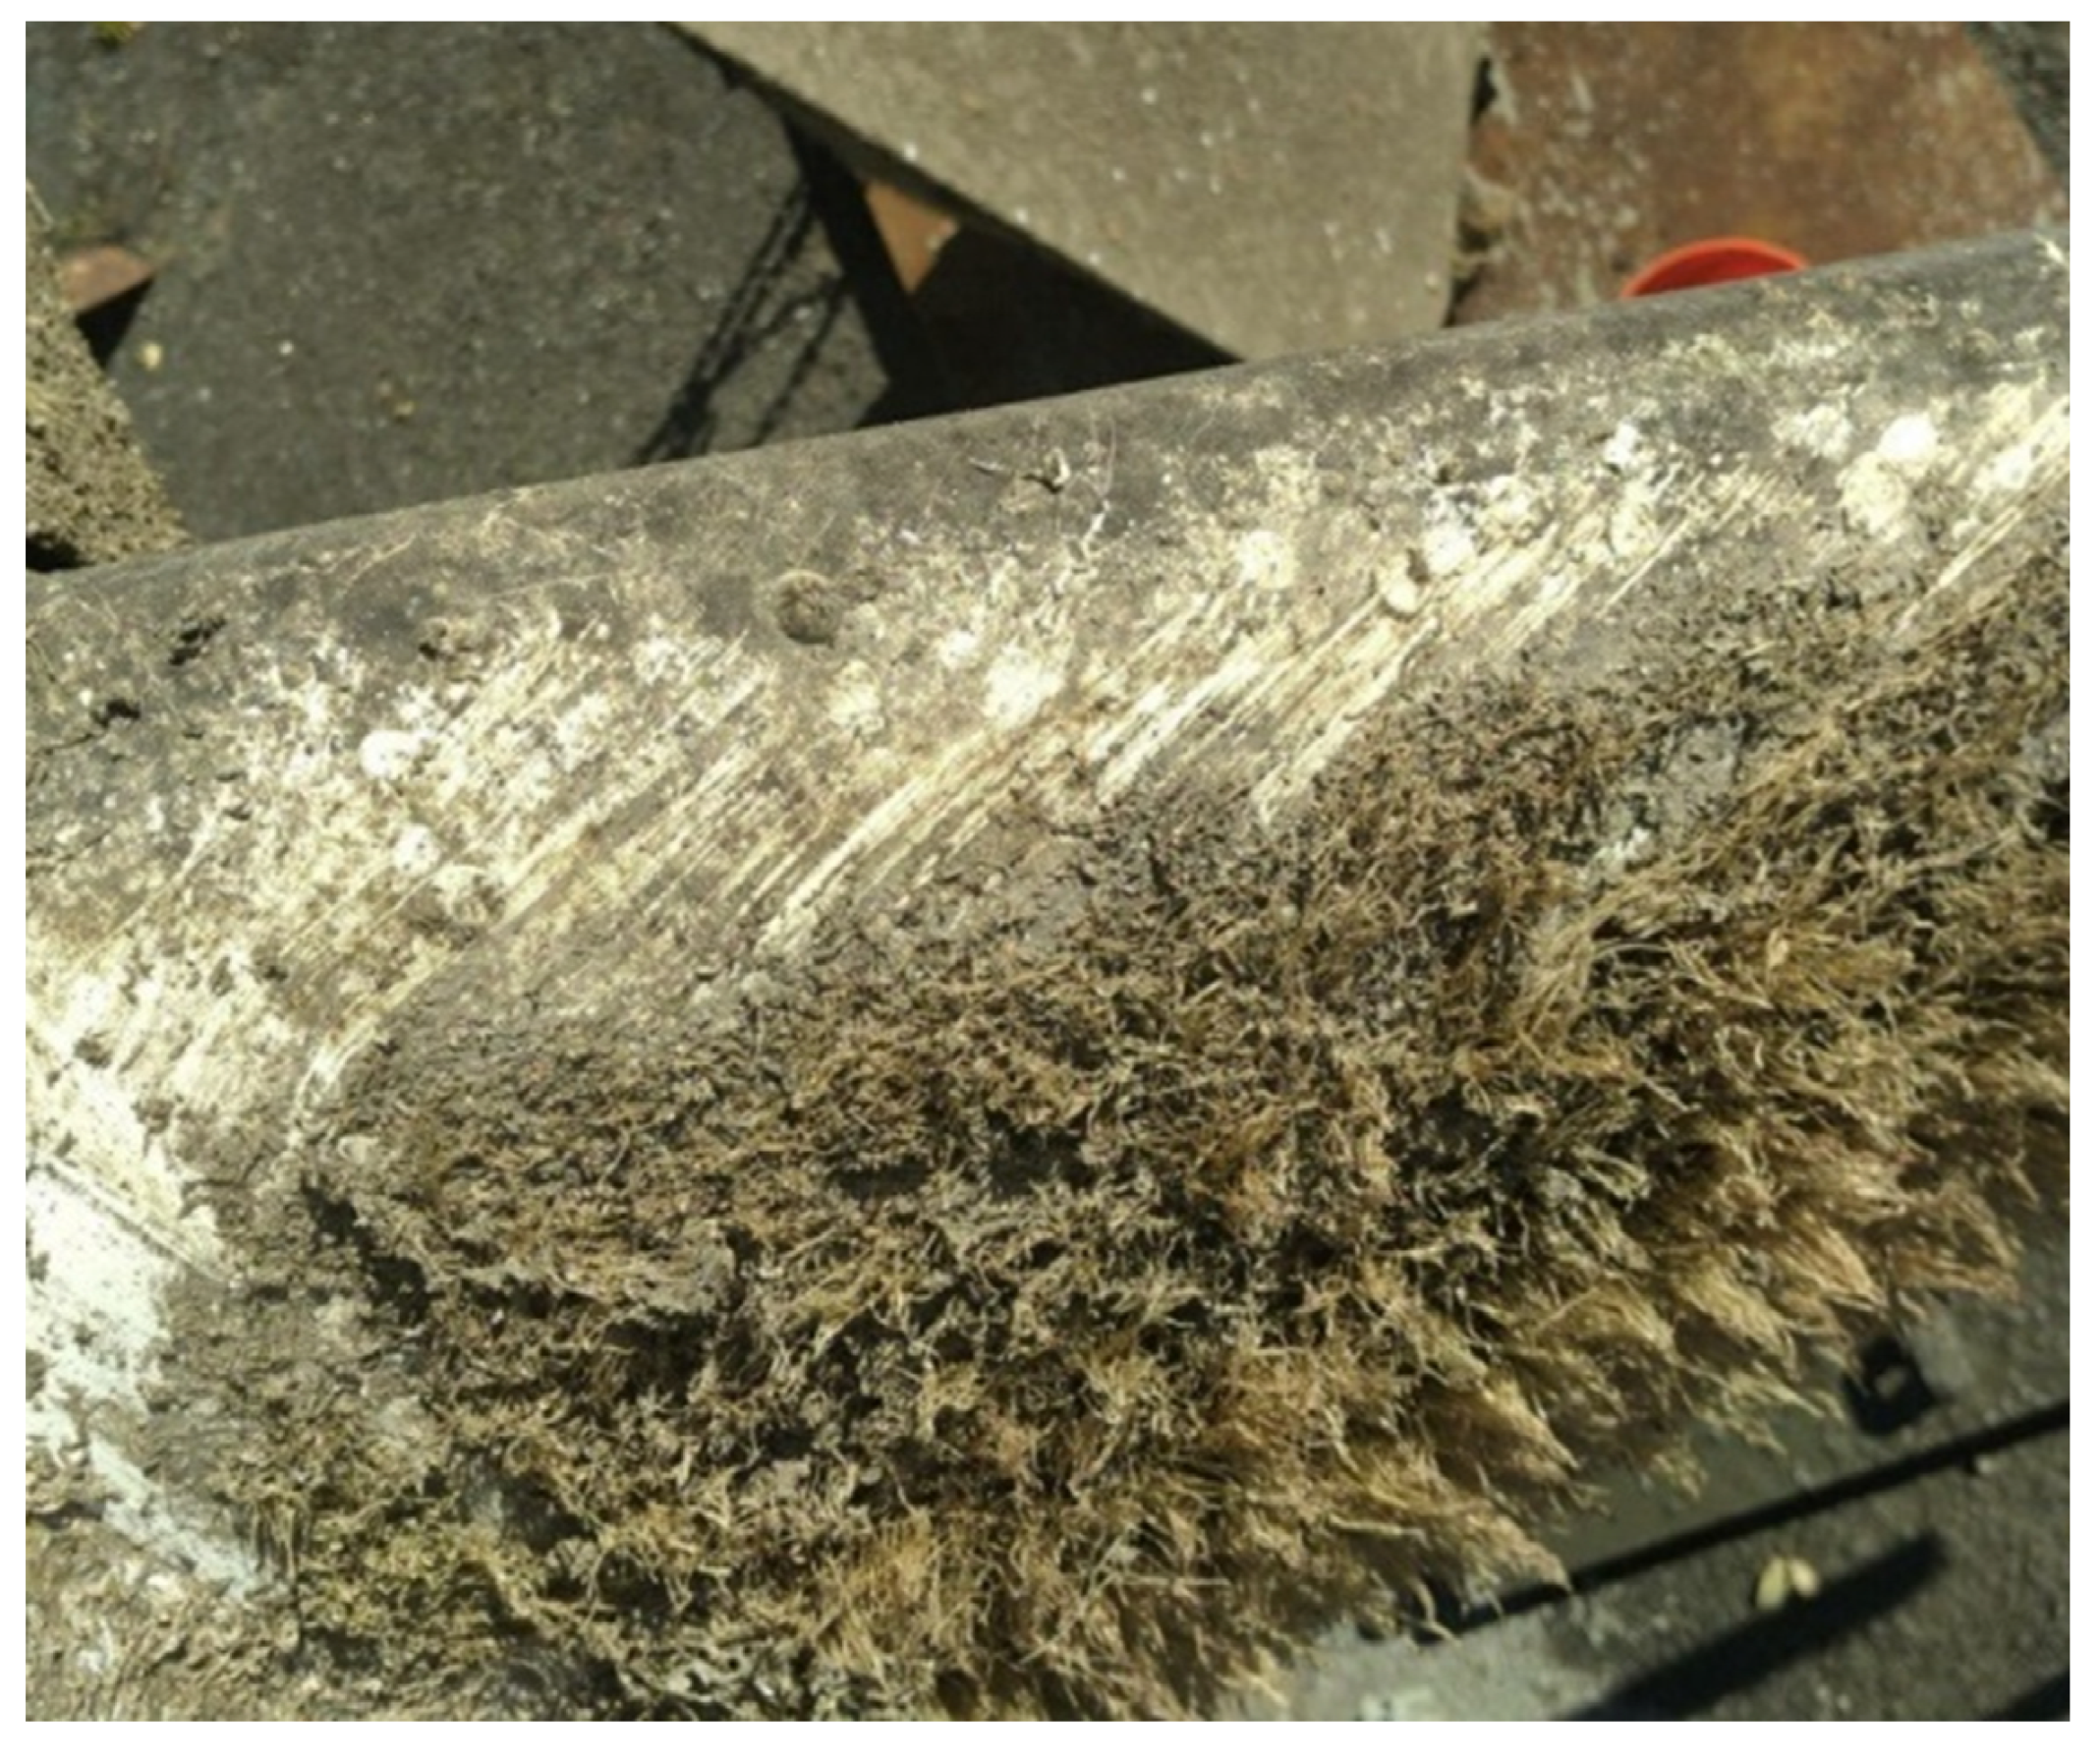
Furthermore, the thermoplastic blades were completely intact with no signs of structural damage. The blades had approximately 1 inch (25.4 mm) of marine growth, mud, and barnacles, which is attributed to the parked conditions of the rotor after the junction box failure. All blades, including the epoxy blades, had similar levels of growth, as shown in
Figure 12. The team is conducting post-deployment structural validation of both thermoplastic and epoxy blades to further assess the structural and material state of the blades after the deployment.
5. Discussion and Conclusions
This was the first deployment of a rotating, stand-alone data acquisition system for an operational tidal turbine with embedded blade strain gages. The fact that all gages and the NDAQ survived the deployment and operated as intended is a positive step forward for the marine energy industry. However, the code error that resulted in a loss of collected data during the deployment could have been avoided. The team documented lessons learned and the steps NREL and others could take to mitigate similar risks in the future.
First, NREL will implement strict processes for code development and verification that will require all code to be fully tested and will prevent code changes after testing. Any change to the code, no matter how small, invalidates any previous verifications. Once a piece of code has been tested, any further changes should be made impossible, unless a full verification can be repeated. Additionally, a system of software checkpoints and sign-offs will be implemented such that after a verification has been performed, the code is no longer accessible without the appropriate sign-offs.
Next, for this deployment, alternative solutions to a stand-alone NDAQ (such as a slip ring or wireless data transmission between the rotating and nonrotating turbine components) were considered too expensive or too time-intensive based on the already-built Verdant turbines. Having live monitoring or adhering to a more detailed reverification process after any alterations were made to the system would have immediately presented this code error and allowed NREL to correct it so that data could be collected as intended. Wireless communications for a live data feed for a system such as the one discussed here would be difficult. Optical data transmission would have suffered due to the amount of sediment in the river and acoustic methods of data transmission are bulky, have a low data transmission rate, and have large power requirements. Wireless EM transmission (such as WiFi) also suffers from strong signal attenuation in water but shows the potential for being a viable option for short-distance data transmission in a system such as this. Implementing a wireless transmission system here would have provided the data needed to identify and correct the coding error but would have also represented a minimum fivefold increase in system power consumption.
In the future, we should invest in systems that will allow for better communication and monitoring of data. NREL has already implemented wireless data transmission systems to actively transmit data from a submerged, rotating, operational turbine. Significant effort was put into the DAQ structural design to place the transceivers above the waterline, but in strong flows they are submerged by water crests. This system was designed in response to the outcomes of this deployment, which highlights the need for active system monitoring and represents the initial steps NREL is taking to improve the capabilities of the Lab for successful open-water, bespoke DAQ builds.
Author Contributions
Investigation, R.E.M., A.S. (Andrew Simms), A.B., R.B., M.M. and A.S. (Andy Scholbrock); Writing—original draft, R.E.M.; Funding acquisition, R.E.M. and L.K. All authors have read and agreed to the published version of the manuscript.
Funding
This research was funded by U.S. Department of Energy Office of Energy Efficiency and Renewable Energy Water Power Technologies Office.
Data Availability Statement
Not applicable.
Acknowledgments
This work was authored by the National Renewable Energy Laboratory, operated by Alliance for Sustainable Energy, LLC, for the U.S. Department of Energy (DOE) under Contract No. DE-AC36-08GO28308. The views expressed in this article do not necessarily represent the views of the DOE or the U.S. Government. The U.S. Government retains and the publisher, by accepting the article for publication, acknowledges that the U.S. Government retains a nonexclusive, paid-up, irrevocable, worldwide license to publish or reproduce the published form of this work, or allow others to do so, for U.S. Government purposes. The employees at Verdant Power Inc. were critical to making this work possible. NREL thanks them for their significant effort.
Conflicts of Interest
The authors declare no conflict of interest.
References
- Davies, P.; Arhant, M. Fatigue behaviour of acrylic matrix composites: Influence of seawater. Appl. Compos. Mater. 2018, 26, 507–518. [Google Scholar] [CrossRef]
- Davies, P.; Le Gac, P.Y.; Le Gall, M. Influence of sea water aging on the mechanical behaviour of acrylic matrix composites. Appl. Compos. Mater. 2016, 24, 97–111. [Google Scholar] [CrossRef]
- Murray, R.E.; Jenne, S.; Snowberg, D.; Berry, D.; Cousins, D. Techno-economic analysis of a megawatt-scale thermoplastic resin wind turbine blade. Renew. Energy 2019, 131, 111–119. [Google Scholar] [CrossRef]
- Porter, K.; Ordonez-Sanchez, S.E.; Murray, R.E.; Allmark, M.; Johnstone, C.M.; O’Doherty, T.; Mason-Jones, A.; Doman, D.A.; Pegg, M.J. Flume testing of passively adaptive composite tidal turbine blades under combined wave and current loading. J. Fluids Struct. 2019, 93, 102825. [Google Scholar] [CrossRef]
- Blackmore, T.; Myers, L.E.; Bahaj, A.S. Effects of turbulence on tidal turbines: Implications to performance, blade loads, and condition monitoring. Int. J. Mar. Energy 2016, 14, 1–26. [Google Scholar] [CrossRef]
- Galloway, P.W.; Myers, L.E.; Bahaj, A.S. Quantifying wave and yaw effects on a scale tidal stream turbine. Renew. Energy 2014, 63, 297–307. [Google Scholar] [CrossRef]
- Galloway, P.W.; Myers, L.E.; Bahaj, A.S. Experimental and Numerical Results of Rotor Power and Thrust of a Tidal Turbine Operating at Yaw and in Waves. In Proceedings of the World Renewable Energy Congress, Linköping, Sweden, 8–13 May 2011; pp. 2246–2253. [Google Scholar]
- Doman, D.A.; Murray, R.E.; Pegg, M.J.; Gracie, K.; Johnstone, C.M.; Nevalainen, T. Dynamic Testing of a 1/20th Scale Tidal Turbine. In Proceedings of the 2nd Asian Wave and Tidal Energy Conference, Tokyo, Japan, 28 July–1 August 2014. [Google Scholar]
- Milne, I.A.; Day, A.H.; Sharma, R.N.; Flay, R.G.J. The characterisation of the hydrodynamic loads on tidal turbines due to turbulence. Renew. Sustain. Energy Rev. 2016, 56, 851–864. [Google Scholar] [CrossRef]
- Lake, T.; Hughes, J.; Togneri, M.; Williams, A.J.; Jeffcoate, P.; Starzmann, R.; Kaufmann, N.; Masters, I. Strain gauge measurements on a full scale tidal turbine blade. Renew. Energy 2021, 170, 985–996. [Google Scholar] [CrossRef]
- Jeffcoate, P.; Starzmann, R.; Elsaesser, B.; Scholl, S.; Bischoff, S. Field measurements of a full scale tidal turbine. Int. J. Mar. Energy 2015, 12, 3–20. [Google Scholar] [CrossRef]
- Harrold, M.; Ouro, P. Rotor loading characteristics of a full-scale tidal turbine. Energies 2019, 12, 1035. [Google Scholar] [CrossRef]
Figure 1.
Verdant Power’s TriFrame being deployed in the East River in New York, with the National Renewable Energy Laboratory’s (NREL’s) thermoplastic blades on the turbine in the right side of the photograph. A close-up photograph of one thermoplastic blade is shown, indicated by the arrow.
Figure 1.
Verdant Power’s TriFrame being deployed in the East River in New York, with the National Renewable Energy Laboratory’s (NREL’s) thermoplastic blades on the turbine in the right side of the photograph. A close-up photograph of one thermoplastic blade is shown, indicated by the arrow.
Figure 2.
Verdant Power turbine with NREL thermoplastic blades and the NREL data acquisition system (NDAQ).
Figure 2.
Verdant Power turbine with NREL thermoplastic blades and the NREL data acquisition system (NDAQ).
Figure 3.
15 V Nortek Battery Bank configuration for the Data Acquisition system.
Figure 3.
15 V Nortek Battery Bank configuration for the Data Acquisition system.
Figure 4.
Blade 2 high-pressure skin with strain gage instrumentation for Channels 8–10 (given in
Table 1). From left to right these are named SG07-BL2-1100-FB-SC, SG08-BL2-1300-FB-SC, SG09-BL2-1575-FB-SC, and SG10-BL2-2200-FB-SC.
Figure 4.
Blade 2 high-pressure skin with strain gage instrumentation for Channels 8–10 (given in
Table 1). From left to right these are named SG07-BL2-1100-FB-SC, SG08-BL2-1300-FB-SC, SG09-BL2-1575-FB-SC, and SG10-BL2-2200-FB-SC.
Figure 5.
Robotic Ocean DAQ canister (left) before deployment and (right) after deployment. All seals and the internal vacuum remained intact for the duration of the deployment.
Figure 5.
Robotic Ocean DAQ canister (left) before deployment and (right) after deployment. All seals and the internal vacuum remained intact for the duration of the deployment.
Figure 6.
Campbell Scientific data logger (left) before deployment and (right) after deployment. All components of the system were in “as-deployed” condition once retrieved. No visible damage or unexpected wear of any kind was observed.
Figure 6.
Campbell Scientific data logger (left) before deployment and (right) after deployment. All components of the system were in “as-deployed” condition once retrieved. No visible damage or unexpected wear of any kind was observed.
Figure 7.
The Campbell Scientific Volt 116 data logger mounted in the canister with strain gage wiring (left) before deployment and (right) after deployment. The power terminal block can be seen next to the ADC.
Figure 7.
The Campbell Scientific Volt 116 data logger mounted in the canister with strain gage wiring (left) before deployment and (right) after deployment. The power terminal block can be seen next to the ADC.
Figure 8.
(left) 3D image of NDAQ structure; (right) thermoplastic blade being connected to NDAQ.
Figure 8.
(left) 3D image of NDAQ structure; (right) thermoplastic blade being connected to NDAQ.
Figure 9.
NDAQ with foam fill (left) before deployment and (right) after deployment.
Figure 9.
NDAQ with foam fill (left) before deployment and (right) after deployment.
Figure 10.
Three thermoplastic blades connected to the NDAQ, and the NDAQ submerged in water.
Figure 10.
Three thermoplastic blades connected to the NDAQ, and the NDAQ submerged in water.
Figure 11.
Strain gage data for thermoplastic Blade 1 during deployment, showing 4 h of data collected in September when the rotor was parked due to the junction box failure. The step change shows the rotor going from parked to operating.
Figure 11.
Strain gage data for thermoplastic Blade 1 during deployment, showing 4 h of data collected in September when the rotor was parked due to the junction box failure. The step change shows the rotor going from parked to operating.
Figure 12.
Marine growth on blade.
Figure 12.
Marine growth on blade.
Table 1.
Strain gage channel list for thermoplastic Blades 1, 2, and 3. For the labeling of the strain gages in column two, SG denotes “strain gage,” BL denotes “blade” (Blade 1 is BL1), FB denotes “full bridge,” QB denotes “quarter bridge,” SC denotes “spar cap,” and HP denotes “high pressure skin,” giving the location of the strain gage on the blade.
| Channel | Name | Blade | Span from Center of Turbine Rotation (r) | Span from Root Face of Blade (z) | Full or Quarter | Chord Position | Purpose |
|---|
| 1 | SG01-BL1-750-FB-SC | 1 | 750 | 250 | FB | SC | Flap Loads |
| 2 | SG02-BL1-1100-FB-SC | 1 | 1100 | 600 | FB | SC | Flap Loads |
| 3 | SG03-BL1-1575-FB-SC | 1 | 1575 | 1075 | FB | SC | Flap Loads |
| 4 | SG04-BL1-2200-FB-SC | 1 | 2200 | 1700 | FB | SC | Flap Loads |
| 5 | SG05-BL1-1000-FB-EDGE | 1 | 1000 | 500 | FB | EDGE | Edge Loads |
| 6 | SG06-BL1-1575-FB-EDGE | 1 | 1575 | 1075 | FB | EDGE | Edge Loads |
| 7 | SG07-BL2-1100-FB-SC | 2 | 1100 | 600 | FB | SC | Flap Loads |
| 8 | SG08-BL2-1300-FB-SC | 2 | 1300 | 800 | FB | SC | Flap Loads |
| 9 | SG09-BL2-1575-FB-SC | 2 | 1575 | 1075 | FB | SC | Flap Loads |
| 10 | SG10-BL2-2200-FB-SC | 2 | 2200 | 1700 | FB | SC | Flap Loads |
| 11 | SG11-BL3-1100-FB-SC | 3 | 1100 | 600 | FB | SC | Flap Loads |
| 12 | SG12-BL3-1300-FB-SC | 3 | 1300 | 800 | FB | SC | Flap Loads |
| 13 | SG13-BL3-1575-FB-SC | 3 | 1575 | 1075 | FB | SC | Edge Loads |
| 14 | SG14-BL3-2200-FB-SC | 3 | 2200 | 1700 | FB | SC | Edge Loads |
| 15 | SG15-BL3-1575-QB-HP-TE Panel | 3 | 1575 | 1075 | QB-HP | TE Panel | Trend Monitoring of interest |
| 16 | SG16-BL3-1700-QB-HP-50p Chord | 3 | 1700 | 1200 | QB-HP | 50p Chord | Trend Monitoring of interest |
| Disclaimer/Publisher’s Note: The statements, opinions and data contained in all publications are solely those of the individual author(s) and contributor(s) and not of MDPI and/or the editor(s). MDPI and/or the editor(s) disclaim responsibility for any injury to people or property resulting from any ideas, methods, instructions or products referred to in the content. |
© 2023 by the authors. Licensee MDPI, Basel, Switzerland. This article is an open access article distributed under the terms and conditions of the Creative Commons Attribution (CC BY) license (https://creativecommons.org/licenses/by/4.0/).


 ,
, 


