Abstract
Primary frequency regulation (PFR) is a crucial operating condition for PSPs to realise frequency modulation, and the effectiveness of PFR is significant to the stability of power system frequency. Several challenges and risks have been presented in the PFR process for conventional PSPs, especially for those which run in the isolated grid, such as water inertia, negative damping of speed governor and ultra-low frequency oscillation (ULFO). Variable-speed pumped storage plants (VSPSPs) have the potential to overcome the negative impacts on regulation performance caused by hydraulic factors, due to the advantages of rapid power regulation and independent active power control from turbine output. In this paper, the primary task is to conduct a comprehensive assessment for PFR performance of VSPSPs in isolated power systems. Initially, the hydraulic–mechanical–electrical numerical models are established. Secondly, the rotational speed stability of the pump-turbine is quantified and the advantages of VSUs in suppressing ULFO are assessed. Relevant results reveal that the performance of VSUs is better than that of FSUs in the regulation process. Finally, assessments of frequency regulation performance under various scenarios are conducted with four indicators (standard deviation of power differences, power regulation time delay, settling time and overshoot).
1. Introduction
Electricity generation from intermittent renewable energy sources (IRESs), such as wind energy and solar energy, has been increasing in recent years [1]. The inherent stochastic and unstable features of IRESs pose a serious threat to the safety and stability of power systems [2]. Hence, suppressing oscillations of IRES generation and retaining balance between electricity production and consumption with an effective and efficient approach is a common and key issue in the energy industry [3,4,5]. Conventional hydropower, especially for PSPs, has been undertaking the task of peak and frequency modulation in power systems for more than two decades due to the advantages of diverse working conditions and power regulation with rapidity and stability [6,7]. The effectiveness, flexibility and reliability of PSPs in regulating system frequency is verified in actual generation systems such as hydro-wind [8], hydro-photovoltaic [9] and hydro-wind–solar hybrid power systems [10]. In these hybrid power systems, especially those in isolated power systems, controlling grid frequency in an allowable range of rated frequency is a critical issue [11,12].
The operation modes of PSPs include grid-connected operation mode (GCOM) and isolated operation mode (IOM). The former is a common and primary mode while the latter serves in accidental cases and high-voltage direct current (HVDC) sending terminals [13]. For both modes, PFR is a significant working condition for PSPs to regulate system frequency at the temporal scale of seconds [14]. Operating in the isolated grid, the PFR performance of PSPs is severe and complicated due to the inherent features of pump-turbines and improper setting of controller parameters [15,16,17,18]. The challenges and risks of PSPs are summarized as follows:
- (1)
- The increasing effect of water inertia reduces the stable region of PSPs and is adverse to the operation stability of a pump-turbine [15].
- (2)
- Larger values of controller parameters reveal the rapid response of guide vane opening to frequency deviation while the damping characteristics of the speed governor are worsening [17,18].
- (3)
- The joint impacts of water inertia and controller parameters will result in ULFO of system frequency, which is observed in several hydro-dominant power systems and HVDC sending terminals [15,16].
- (4)
- The water level oscillation in a surge tank will cause frequency oscillation and the impact is more severe under IOM [14].
As an advanced technology, variable-speed operation of PSPs which adopt DFIMs reveals several unique operating characteristics compared to FSUs, such as the flexibly adjustable operation speed and bidirectional transfer of mechanical power [19,20]. Hence, the efficiency of pump-turbine for VSUs can be improved and more importantly, the rotational speed of pump-turbine is decoupled from system frequency according to the concept of slip, and the hydraulic characteristics of the pump-turbine cannot directly affect the output power [21]. As a result, VSUs have the potential for overcoming the challenges and risks of FSUs under IOM in theory.
Based on the abovementioned discussions, this paper aims to provide a comprehensive assessment for PFR of VSUs. On this topic, previous studies mainly focus on regulation performance assessment and control strategy designment. Representative achievements are listed as follows:
- (1)
- For regulation performance assessment, Bidgoli et al. built a comprehensive model of VSU connected to a single machine infinite bus system and a two aera power system [22]. The dynamic behaviours of VSPSPs were studied under various operation modes (generating, motor), and comprehensive evaluations were conducted in terms of frequency regulation, fault condition, damping characteristics, harmonic distortion and so on [22]. Yang and Yang adopted four indicators to assess the power regulation performance of VSPSPs [19]. Relevant results revealed that VSUs outperformed FSUs under every selected scenario, while the excitation system and power stabilizers of FSUs were not considered. Yao et al. focused on the operational efficiency of VSPSPs and proposed a novel steady-state model for the stability analysis of VSPSP [23]. Martinez-Lucas et al. evaluated the fatigue risk of penstock in VSPSP through computational fluid dynamics simulations and concluded the effects of variable-speed operation [24].
- (2)
- For control strategy design, the controller structure and strategy are diverse between FSUs and VSUs. Conventional FSUs utilise a speed governor of pump-turbine to regulate system frequency, while for VSUs, the PFR controller is designed with the vector control system of rotor-side convertor [11,25]. Gong et al. proposed a PFR control strategy for VSUs and the controller was simulated through an isolated system [26]. Bidgoli et al. proposed a novel vector control method for VSUs to increase the fault ride-through capability. The effectiveness of the strategy was verified in both generating and pumping mode [27]. Li et al. provided an advanced coordinated control strategy to increase the efficiency of pump-turbine and realise rapid active power regulation at the same time [28]. Yan et al. discussed the operation characteristics of VSPSPs and revealed that in the coordinated operation of one VSU and several FSUs, excitation system of FSUs can provide reactive power support for VSU [29]. Relevant research offers reference to the design of an isolated power system with VSUs in this study.
Based on these discussions, the novelty of this paper can be characterized as the explanations for three issues: (1) whether water hammer has an effect on the stability and regulation performance of VSUs? (2) which subsystem is vital to the stable operation of VSUs in isolated power system? (3) whether VSUs outperform FSUs in isolated grid from the perspective of system frequency stability and power regulation quality?
This paper is organised as follows: Section 2 introduces the performance mechanism of VSPSPs and the integrated model is built accordingly. Section 3 provides the design methods of simulation in the paper. Detailed simulation and assessment results are shown in Section 4. Operation risks and advantage analysis are conducted between FSFSP and VSPSP in this section.
2. Modelling of FSPSPs and VSPSPs
FSPSPs and VSPSPs are complicated and integrated hydraulic–mechanical–electrical systems. Hence, the primary object of this section is the mathematical modelling of major subsystems of FSPSPs and VSPSPs. The parameters with their descriptions are concluded in the Appendix A. FSPSPs utilise a conventional synchronous machine while the VSPSP studied in this paper utilises DFIM as the generator motor. The common subsystems of FSPSPs and VSPSPs are pump-turbine and speed governor.
2.1. Modelling of Hydraulic–Mechanical Subsystem
The hydraulic–mechanical subsystem includes the pump-turbine, elastic penstock and speed governor. The pump-turbine model is linearised with six coefficients as shown in Equation (1) [12,30].
where eqy, eqω and eqh are the transfer functions of turbine flow rate on guide vane opening, speed and head, while ey, eω and eh are the transfer functions of turbine torque on guide vane opening, speed and head. The structure of the pump-turbine and penstock is shown in Figure 1.
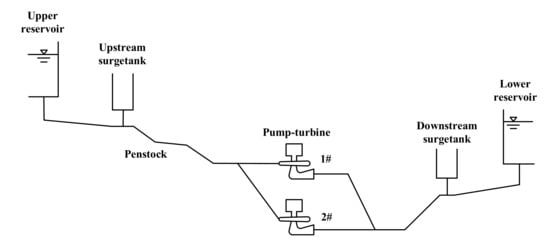
Figure 1.
Schematic diagram of pump-turbine system and penstock structure.
Considering the water column elasticity and water inertia, the model of the penstock can be summarized as [22]:
The models of speed governors include a PI controller and two nonlinear components (saturation and rate limiting). For FSPSPs, the input of the PI controller is the deviation of system frequency, while for VSPSPs, the input is the rotational speed of the pump-turbine [19,26]. The equation of PI controller and block diagram of speed governors are respectively shown in Equation (3) and Figure 2.
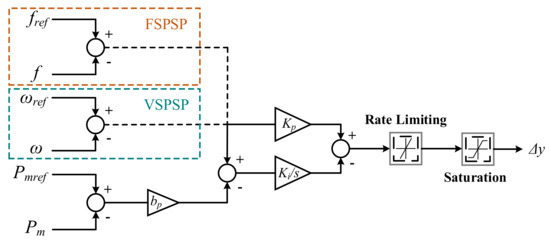
Figure 2.
Block diagram of pump-turbines’ speed governor in FSPSPs and VSPSPs.
2.2. Modelling of DFIM and Vector Control
Traditional FSPSP utilises a synchronous machine as the generator while VSPSP utilises DFIM, which is the primary difference [25]. A vector control system is applied in DFIM which can realise decoupled control of active and reactive power. A brief block diagram is given in Figure 2 to reveal the operating mechanism of DFIM.
2.2.1. Relations between Angular Frequency of Rotor (ωmr) and Frequency
For FSPSPs, ωmr is coupled with system frequency as shown in the first equation of Equation (4) [19,31]. The oscillation of ωmr is equivalent to the oscillation of system frequency. The concept of slip is shown in the second equation of Equation (4), which reveals that the ωmr for VSPSPs is decoupled from system frequency. Under this circumstance, the oscillation of ωmr will not directly result in the variation of system frequency.
2.2.2. Mechanical Model of DFIM
The nonlinear characteristics of DFIM can be expressed by voltage and flux equations [19,22,31]. The equations after Park's Transformation are given in Equations (5) and (6). The stator active and reactive power are calculated by d-q components of stator voltage and stator current, which are given in Equation (7).
2.2.3. Vector Control System Applied in DFIM
Vector control theory is applied in the control approach of grid-side converter and rotor-side converter of DFIM. To obtain more general conclusions and more objective assessments, the vector control system in this paper utilises a conventional style according to the literature [32]. The block diagram of DFIM with vector control system is shown in Figure 3.
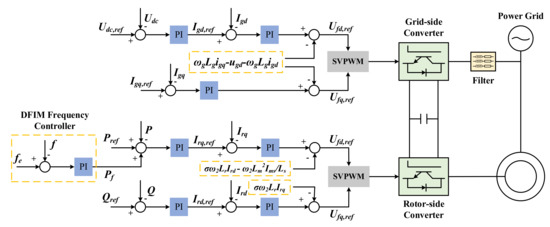
Figure 3.
Block diagram of vector control system in DFIM.
The purpose of a grid-side converter is to regulate DC bus voltage and reactive power, and in the vector control system, the two variables can be controlled by d-q components of Ig (the AC current on grid-side filter). The reactive power reference (Igq,ref) is usually set to zero, which reveals that the grid-side converter is seldom applied in the participation of reactive power regulation [32].
For the rotor-side converter, the primary object is to realise rapid tracking and decoupled control of active and reactive power [21,22]. According to the decoupling control theory, stator active power and reactive power are respectively controlled by rotor voltage [31]. The active power reference in the rotor-side vector control system is set according to the requirement of the power system. The additional term Pf in Figure 3 is various from control strategies of DFIM. Setting Pf to zero reveals that the DFIM in VSPSP does not participate in frequency regulation.
2.2.4. Frequency Regulation System of DFIM and F-VPSP
DFIM in wind farms with a maximum power point tracking (MPPT) strategy cannot respond to the variation of system frequency which is adverse to the stability of the grid [6,26]. Hence, droop control strategy and virtual inertia control strategy are introduced to DFIM controllers [29]. Considering the similarities between wind farms and VSPSP, similar control methods are introduced and improved in VSPSPs. To obtain a more general conclusion, a typical PI controller is modelled in the control of system frequency, which is shown in the ‘DFIM frequency controller’ of Figure 3 [11]. The output of frequency regulation system is input to the rotor-side vector control system as Pf.
3. Case Description and Assessment Indicators
3.1. Case Description
In this paper, the PFR performance of FSFSPs and VSPSPs is quantified and assessed based on two isolated operation modes (F-FPSP and F-VPSP), as shown in Figure 4. Each mode is divided into two groups according to the controller parameters. The major parameters are concluded in Table 1 and the main features of two modes are introduced as follows:
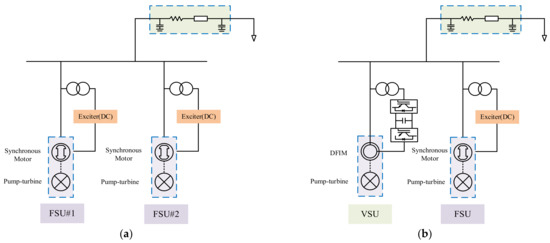
Figure 4.
Diagram of isolated power systems applied in the paper: (a) F-FPSP; (b) F-VPSP.

Table 1.
Introduction of F-FPSP and F-VPSP.
F-FPSP: The isolated power system consists of two uniform FSUs (FSU#1 and FSU#2). The base power of FSUs is 300 MW and the electric load is 450 MW. In the hydraulic–mechanical subsystem, the parameters of the pump-turbine remain the same among FSU#1 and FSU#2. The frequency disturbance is induced by a sudden load increase of 0.1 pu.
F-VPSP: The isolated power system consists of an FSU and a VSU. The base power is 300 MW and the electric load is 450 MW. The parameters of the pump-turbine in the FSU and VSU are constant with FSU#1 and FSU#2 of F-FPSP. The frequency disturbance is induced by a sudden load increase of 0.1 pu, which is the same as F-FPSP. The detailed simulation parameters are shown in Appendix A.
Controller parameters of the speed governor in FSU#1 and FSU utilised in this paper divide into two groups, which are Set1 (Kp = 3 and Ki = 0.6) and Set2 (Kp = 9 and Ki = 6). To maintain the ωm of pump-turbine within the allowable range, the speed governor parameters of pump-turbine in VSU select Set2 and do not change during the simulations below [22].
3.2. Assessment Indicators
Considering that dynamic performances are diverse under different operation modes and quantified assessments should be conducted for output power and system frequency separately, four indicators are cautiously selected to assess the regulation stability and complementary characteristics of F-FPSP and F-VPSP. The indicators applied in this paper are introduced as below:
- (1)
- Standard deviation of power difference (DP_std) [22]DP_std is defined as the standard deviation of absolute power difference which is calculated from active power response (Ps_i) and active power reference (Psref_i) of each time step. A smaller DP_std reflects a superior regulation performance of F-FPSP and F-VPSP on compensating power fluctuations.
- (2)
- Power regulation time delay (P_delay) [22]In Equation (9), Psref_Td is a new time series of power reference with a time delay (Td). P_delay is defined as the Td corresponding to the maximum correlation coefficient of the time series of power response (Ps) and Psref_Td. This indicator quantifies the rapidity of generating units when tracking the power target.
- (3)
- Settling time (Ts) and overshoot (Os) [14]
Settling time and overshoot depict regulation stability from the perspective of automatic control theory. Ts represents adjustment time and Os can quantify the system stability. Both indicators are calculated based on the frequency response.
The indicators under a step response are concluded and depicted in Figure 5.
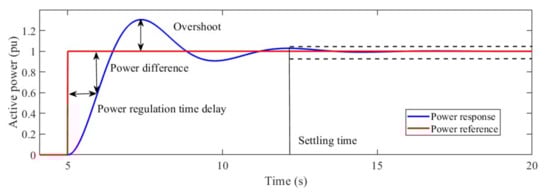
Figure 5.
Illustration of power response and power reference.
4. Numerical Simulations and Analysis
In this section, the operating behaviours of F-FPSP and F-VPSP under IMO are simulated based on the models in Section 2, and quantitative assessments are conducted according to the indicators in Section 3. Considering that the studied systems are complicated and highly coupled hydraulic–mechanical–electric systems, the parameters of different subsystems have diverse impacts on the dynamic behaviour of frequency regulation. Hence, according to current research and literature, water inertia (Tw), proportional gain in speed governor (Kp) and integral gain in speed governor (Ki) are selected as key parameters. The impacts of different key parameters on the system stability and regulation performance are concluded through simulation results.
4.1. Stability Analysis for Pump-Turbine Rotational Speed under Various Scenarios
According to the discussions in Section 2.2.1, the effects of pump-turbine rotational speed on the frequency stability of a power system are direct and indirect for FSUs and VSUs, respectively. Hence, this section focuses on the operating stability of pump-turbine based on the two modes (F-FPSP and F-VPSP), and the simulations are organised as follows:
- (1)
- Tw= 0.3 s, Tw= 1.5 s, Tw= 3 s and Tw= 4 s are selected as four typical scenarios to study the impacts of water hammer on pump-turbine stability;
- (2)
- Two sets of PI controller parameters are applied in FSU#1 of F-FPSP and FSU of F-VPSP to study the rotational speed stability of pump-turbine. The PI controller parameters of pump-turbine in FSU#2 and VSU remain unchanged during the simulation.
Figure 6 illustrates the simulation results of ω m in various scenarios. Figure 6a,b represents the situation that the effects of water hammer on generating units are slight. For FSU#1, the regulation performance is superior with larger Kp and Ki, while the variation of Tw has a slight impact on the speed regulation. The ωm of pump-turbine in VSU is more unstable despite the small values of Tw and the peak value is much larger than FSU#1.
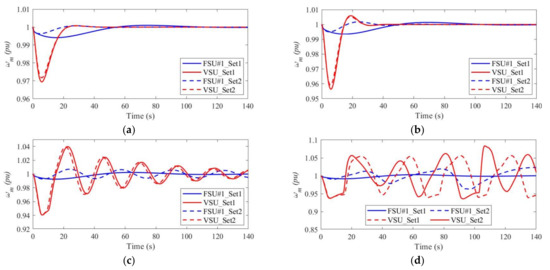
Figure 6.
Comparison of rotational speed of pump-turbine in different settings of Tw: (a) Tw = 0.3 s; (b) Tw = 1.5 s; (c) Tw = 3 s; (d) Tw = 4 s.
As Tw increases to 3, the response of rotational speed of FSU#1 with smaller controller parameters (Set1) retains stable while oscillation with 0.03 Hz is observed in FSU#1_Set2. This phenomenon corresponds with relevant theories stating that a severe effect of water hammer and improper set of controller parameters will cause ultra-low frequency oscillations. However, for VSU_Set1 and VSU_Set2, oscillations with larger amplitudes are found in the simulation results, which reveals that the effect of water hammer is more serious in VSUs. The stability of the pump-turbine in VSU is inferior to FSU#1. Figure 6d depicts diverging oscillations of FSU#1 and VSU when Tw increases to 4 and oscillation amplitudes of VSU are still larger. ULFO is not observed in FSU#1_Set1 while response time increases to more than 100 s, and the generation unit cannot satisfy requirements about PFR.
Quantified assessments about Figure 6 are listed in Table 2 and Table 3. Indicators are composed of settling time (Ts), overshoot (Os), peak time (Pt) and maximum deviation of rational speed (Dw). Ts and Pt can clearly demonstrate the performance of response reaction, while Os and Dw are relevant to the oscillation amplitude. The simulation time is set to 140 s and the mark ‘>140’ means the oscillation cannot converge to the pre-set error range during the simulation time. The cells marked with ‘Divergent’ indicate that divergent oscillations are observed under the scenario and settling time cannot be calculated. For the two situations above, the ratio is meaningless and is marked with ‘\’. According to the definition of the indicators, the ratio, which is more than 100%, indicated that the performance of VSU is inferior to FSU.
Table 2.
Assessment results of pump-turbine stability with Set1.
Table 3.
Assessment results of pump-turbine stability with Set2.
As Tw increases, operation stability of all four groups is deteriorated, which is revealed by the increase in four indicators. Ratios that are less than 100% only appear at the settling time terms in both tables, which depicts that the pump-turbine in VSU has more response speed than that in FSU under these scenarios. However, for Os and Dw, every ratio is much larger than 100%, where the minimum one is 226.9% and the maximum one is 1024.14%. This phenomenon depicts that the ω m of the pump-turbine in VSUs has a larger oscillation amplitude. It is also notable that the ratio is more than 472.46% at Tw = 0.3 s and Tw = 1.5 s. This means that the ωm of a pump-turbine in VSU oscillates violently even when the effect of water inertia is slight. This phenomenon illustrates the instability of pump-turbines in VSUs.
For all four simulation groups, FSU#1_Set1 is the only group that retains stable when Tw increases to 4, while the adjustment speed is fairly slow. Adjustment speed increases as bigger parameters are applied, as shown in Table 3. However, undamped and divergent oscillations occur after Tw increases to 3 and 4, and settling time is larger than 140 s for FSU#1_Set2 and VSU_Set2. The sudden increase of Pt in FSU#1_Set2 and VSU_Set2 at Tw = 4 s is the result of the occurrence of divergent oscillation.
4.2. Advantages of F-VPSP in Suppressing ULFO of System Frequency
Section 4.1 reveals that ULFO occurs on the system frequency of FSUs and ωm of pump-turbines in VSUs. The regulation performance of the pump-turbine rotational speed in FSUs is equivalent to the frequency stability of the power system. However, the system frequency of VSUs is decided by rotor speed and frequency of field current according to the operation mechanism of DFIM. Thus, the oscillation of rotor speed cannot affect the frequency of the power system, which explains the potential of VSUs for suppressing ULFO of system frequency.
Higher values of Tw and PI controller parameters reveal the higher occurrence probability of ULFO, according to the previous studies [17,26] and simulation results in this paper. Hence, parameter Set2 is selected in this section to conduct relevant studies of ULFO. Figure 7 illustrates the dynamic response of system frequency and rotational speed of pump-turbine in F-VPSP when Tw is equal to 3.3 s. As a comparison, the frequency response of F-FPSP at Tw = 3.3 s is also depicted in Figure 7. For F-FPSP, divergent oscillation occurs in the frequency response of F-FPSP and the frequency is 0.0258 Hz. For F-VPSP, the frequency restores stability within 25 s and the maximum frequency deviation is 0.361 Hz, which is acceptable. Although F-VPSP has superior PFR performance, similar oscillation is observed in the rotational speed of a pump-turbine in VSU whose amplitude is 0.032 pu and frequency is 0.04 Hz. This phenomenon reveals that the effects caused by water hammer cannot be transferred to the power system, while the oscillation of rotational speed also requires to be restricted to allowable range.
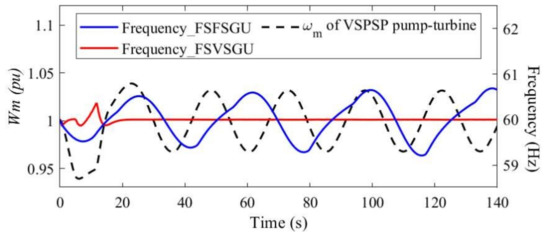
Figure 7.
Dynamic behaviour of system frequency and rotational speed of pump-turbine.
Figure 8 depicts the dynamic response of system frequency of F-FPSP and F-VPSP when Tw increases from 2.7 s to 3.3 s. The transition of F-FPSP system frequency from damped oscillation to divergent oscillation is depicted in Figure 8a. Undamped oscillation occurs at Tw =3.1 s, which can be seen as a critical value of system stability. The amplitude and frequency of oscillation are 0.454 Hz and 0.03 Hz, which corresponds with the features of ULFO.
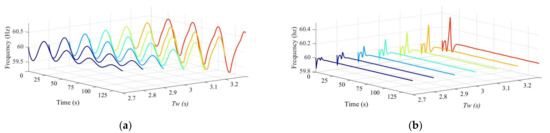
Figure 8.
Frequency response with Tw increasing from 2.7 s to 3.3 s: (a) F-FPSP; (b) F-VPSP.
Dynamic behaviour and regulation performance are improved when VSU is applied and relevant results are shown in Figure 8b. The main advantages of F-VPSP in rapid and stable frequency regulation is revealed in Figure 8b. As Tw increases from 2.7 s to 3.3 s, settling time increases from 15.4 s to 27.3 s and the maximum of frequency deviation rises from 0.143 Hz to 0.361 Hz. Although the results depict that frequency regulation performance is slightly deteriorated as the increase of Tw, for all seven groups of F-VPSP, frequency oscillation is convergent and is acceptable compared with F-FPSP.
4.3. Sensitivity Analysis Based on F-FPSP and F-VPSP Models
Section 4.2 depicts that ULFO will occur under the severe effect of water hammer and that the oscillation can be suppressed with the introduction of VSU. However, F-FPSP and F-VPSP are complicated hydraulic–mechanical–electrical coupled systems. The effects of various subsystems and their parameters on system frequency are different and need to be quantified.
Here, to quantify the effects of different subsystem parameters on system stability and regulation performance, global sensitivity analysis is conducted based on the F-FPSP and F-VPSP models. Saltelli’s sensitivity theory is estimated with the Monte Carlo method applied, and the results are depicted in Figure 9 and Figure 10, respectively. The analysed parameters are listed in Table 4. Standard deviation of power difference is selected to assess regulation quality and frequency variation (difference of maximum frequency and minimum frequency during the simulation) is chosen to quantify frequency stability.
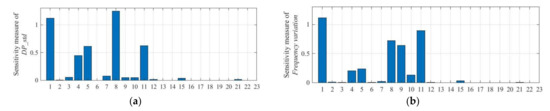
Figure 9.
Total effect of parametric uncertainty of F-FPSP system parameters on frequency regulation performance: (a) Effect on standard deviation of power difference (DP_std); (b) Effect on frequency variation.
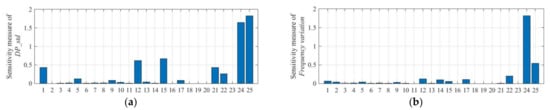
Figure 10.
Total effect of parametric uncertainty of F-VPSP system parameters on frequency regulation performance: (a) Effect on standard deviation of power difference (DP_std); (b) Effect on frequency variation.
Table 4.
Parameters and relevant subsystems in sensitivity analysis.
As Figure 9 shows, hydraulic system, speed governor and pump-turbine have a prominent influence on the assessment results for F-FPSP. The dominant parameters for DP_std and relevant ranking are: eqy1 > Tw > eh1 > Ki1 > Kp1, while for frequency variation, the results are: Tw > eh1 > eqy1 > ey1 > Ki1 > Kp1. The sensitivity results of F-VPSP are reverse compared with F-FPSP, as shown in Figure 10. The rank of influential sensitivity index for DP_std is: Kif > Kpf > Xd > Ka > Tw > T’do > T″do and for frequency variation, the rank is: Kpf > Kif > T″do.
The parameters of the DFIM frequency controller have the highest sensitivity index for both indicators, which illustrates that VSU is more vital for the PFR performance of F-VPSP system. The impacts of water inertia and pump-turbine parameters on regulation performance are more obvious while their effects on system stability are slight. Comparing F-VPSP with F-FPSP, the sensitivity indexes of Tw, Ki1 and Kp1 in F-VPSP are smaller than those in F-FPSP, which means that the ULFO can be suppressed with the introduction of VSU and its frequency regulation system.
4.4. Regulation Performance Assessment of F-FPSP and F-VPSP under IMO
In this section, performance assessment is conducted based on the four indicators in Section 3. The impacts of water inertia and controller parameters are considered. The values of Set1 and Set2 are the same as in Section 4.1.
DP_std is an indicator quantifying complementary capability of generating units and is calculated based on the output active power of F-FPSP and F-VPSP. As Figure 11a shows, the DP_std increases with Tw and the increasing rate is higher when larger controller parameters are applied. The F-VPSP outperforms F-FPSP at every Tw when parameter Set2 is selected, while for groups using parameter Set1, the intersection point is observed at Tw = 3 s, which depicts that F-FPSP performs better under severe effects of water hammer.
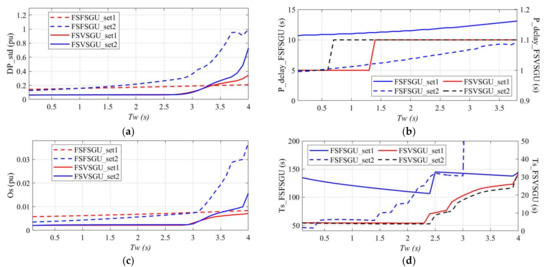
Figure 11.
Impacts of water inertia on dynamic performance indicators of F-FPSP and F-VPSP: (a) Standard deviation of power difference; (b) Power delay; (c) Overshoot; (d) Settling time.
Power delay (P_delay) can quantify the capability of rapid power response of different generation units. As Tw increases, P_delay of F-FPSP keeps rising and a larger controller parameter (parameter Set2) can reduce P_delay and help accelerate the speed of power response. The transformation law of Tw on P_delay of F-VPSP is diverse from F-FPSP. For F-VPSP_Set2, the value of P_delay remains 1 s when Tw is less than 0.9 s and increases to 1.1 s when Tw is more than 1 s. For F-VPSP_Set1, the similar inflection point occurs at Tw = 1.1 s. The alteration is tiny and is uncorrelated with the strength of water hammer and the selection of controller parameters. This reveals the advantage of F-VPSP in rapid power response.
Overshoot (Os) is an indicator depicting oscillation amplitude and is applied to assess frequency stability in this paper. For F-FPSP, the intersection point occurs at Tw = 3.1 s, and according to Figure 7 in Section 4.2, undamped oscillation of system frequency appears when parameter Set2 is applied. F-FPSP with larger controller parameters performs better when the effects of water hammer are slight, while the stability is deteriorated as Tw increases. An inflection point is found around Tw = 2.9 s for F-VPSP. The oscillation amplitude of F-VPSP is uncorrelated with controller parameters and Tw when the effects of water inertia is slight. A sudden increase of O s occurs in F-VPSP after Tw increases to 3 s, while the system frequency response is stable and convergent according to the results in Section 4.2.
Settling time (Ts) assesses both regulation speed and stability of system frequency. As Figure 11d shows, larger speed governor parameters can reduce settling time in F-FPSP while for F-VPSP, the impact of speed governor is slight. Unstable state only occurs at Ts = 3.1 s for F-FPSP_Set2, which is presented through the sudden increase of Ts. The settling time becomes infinite under this circumstance because the oscillation is not convergent. For F-VPSP, the regulation speed is more rapid than F-FPSP and the system frequency remains stable under every selected scenario. This reveals the advantage of F-VPSP in rapid frequency regulation.
5. Conclusions
This study focused on the dynamic behaviour and regulation performance of VSPSPs in isolated power systems, and the major purpose was to carry out a comprehensive assessment of PFR performance for FSVSPs and VSPSPs under IOM. The mathematical models of various subsystems were built, and F-FPSP as well as F-VPSP were applied as two typical systems to conduct simulation. In order to quantify the operation stability and PFR performance, four indicators were introduced and divided into two groups that assessed power regulation performance (standard deviation of power difference, power delay) and frequency stability (settling time and overshoot of frequency).
Based on the models of two typical systems, the stability of the pump-turbine and system frequency for FSUs and VSUs were studied initially. The ratios between the VSU and the FSU of Dw (maximum deviation of rotational speed) were more than 100% under every scenario (Tw = 0.3 s, Tw = 1.5 s, Tw = 3 s and Tw = 4 s), where the maximum and minimum values were 226.9% and 1024.14%, respectively. The results illustrate that the pump-turbine rotational speed stability of VSUs is inferior to that of FSUs under the circumstances. Nevertheless, despite the severe oscillation of rotational speed, the advantages of VSUs in suppressing ULFO are presented. For F-VPSP, system frequency remained stable at Tw = 3 s and Tw = 4 s; instead, similar oscillation was observed in the rotational speed of pump-turbine. In conclusion, F-VPSP has the ability of suppressing ULFO at the cost of pump-turbine rotational speed instability of VSU.
Secondly, sensitivity analysis was conducted to study the diverse impacts of different subsystems on the system performance. Hydraulic system, speed governor and pump-turbine are significant to power regulation quality and frequency stability in F-FPSP, while for F-VPSP, frequency controller parameters play a dominant role in tracking power variation and regulating system frequency. The impacts of hydraulic system and pump-turbine for F-VPSP are slighter, which is diverse from F-FPSP. The primary reason for the difference is the independent power generation from turbine output for VSUs.
Finally, PFR performance assessment of F-FPSP and F-VPSP were conducted through four indicators. The impacts of water inertia and controller parameters were the primary focuses and the results reveal that the increase in water inertia will result in the worsening of PFR performance for both FSUs and VSUs under IOM. When smaller controller parameters are adopted, F-FPSP outperform F-VPSP as the increase of water inertia. Nevertheless, the PFR performance of F-VPSP is superior to F-FPSP under every scenario (from Tw = 0.3 s to Tw = 4 s) with the adoption of larger controller parameters. In summary, due to the advantages of rapid power regulation and independent power generation from turbine output for VSUs, VSPSPs are more suitable for shouldering the frequency regulation duty in isolated power systems than conventional FSPSPs.
Author Contributions
S.L. and Z.C., conceptualization, methodology, software, writing—original draft, writing—reviewing and editing; they contributed equally to this paper; K.H., software, formal analysis, and data curation; D.C., subfunding acquisition, supervision, writing—review and editing. All authors have read and agreed to the published version of the manuscript.
Funding
This research is supported by the Fundamental Research Funds for Northwest A&F University (No./Z1090220172), the scientific research foundation of the Natural Science Foundation of Shaanxi Province of China (2019JLP-24), the Shaanxi Science and Technology Innovation Team and the Water Conservancy Science and Technology Program of Shaanxi Province (2018slkj-9).
Data Availability Statement
The data presented in this study are available in Appendix A.
Conflicts of Interest
The authors declare no conflict of interest.
Nomenclature
| DFIM | Double-fed induction machine | Qs> | Reactive power on the stator side |
| FSU | Fixed-speed unit | Udc | DC-link voltage |
| GCOM | Grid-connected operation mode | Uf | Converter output voltage |
| HVDC | High-voltage direct current | Ur | Rotor voltage |
| IOM | Isolated operation mode | Us | Stator voltage |
| IRES | Intermittent renewable energy source | y | Guide vane opening |
| MPPT | Maximum power point tracking | ωs | Angular frequency of stator voltages\currents |
| PFR | Primary frequency regulation | ωr | Angular frequency of rotor voltages\currents |
| PSP | Pumped storage plant | ωm | Rotational speed of pump-turbine |
| ULFO | Ultra-low frequency regulation | ωmr | Angular frequency of rotor |
| VSU | Variable-speed unit | ψs | Stator flux |
| Δ | Deviation from the initial value | ψr | Rotor flux |
| Subscripts and superscripts | Constants | ||
| bp | Regulation coefficient | ||
| d | d-axis component | emω,y,h | Partial derivative coefficient |
| q | q-axis component | Eqω,y,h | Partial derivative coefficient |
| ref | Reference value | fe | Nominal system frequency |
| sg | Parameters of speed governor | Ki | Constant of integral term |
| vc | Parameters of vector control | Kp | Constant of proportional term |
| Lg | Filter inductance | ||
| Variables | Lm | Magnetizing inductance | |
| Lr | Rotor inductance | ||
| f | System frequency | Ls | Stator inductance |
| h | Relative deviation of head | np | Number of pole pair |
| Ig | AC current on grid-side filter | Rr | Rotor resistance |
| Ir | Stator current | Rs | Stator resistance |
| Is | Stator current | Te | Time constant of water column elasticity |
| Pm | Mechanical power of pump-turbine | Tw | Water starting constant |
| Ps | Active power on the stator side | Ty | Servo time constant |
| q | Relative deviation of discharge | α | Elasticity coefficient of penstock |
Appendix A
Table A1.
Values of parameters for F-VPSP.
Table A1.
Values of parameters for F-VPSP.
| DFIM | Pump-Turbine | Waterway and Governor | Controllers | ||||
|---|---|---|---|---|---|---|---|
| Para. | Values | Para. | Values | Para. | Values | Para. | Values |
| Ls | 3.6 pu. | ey | 0.95 pu. | Tr | 0.115 s | Kp (VC) | 10 |
| Lr | 3.6 pu. | eω | −0.75 pu. | Tw | 0.3 s-4 s | Ki (VC) | 2 |
| Rs | 0.012 pu. | eh | 1.50 pu. | Ty | 0.1 s | Kp (FC) | 0.5 |
| Rr | 0.013 pu. | eqy | 0.65 pu. | α | 0.5 | Ki (FC) | 1 |
| Lm | 3.475 pu. | eqω | 0.10 pu. | — | — | Kp (SG) | 3 |
| — | — | eqh | 0.47 pu. | — | — | Ki (SG) | 0.6 |
‘VC’ represents the vector control system. ‘FC’ represents the frequency controller system. ‘SG’ represents the speed governor of pump-turbine.
Table A2.
Values of parameters for F-FPSP.
Table A2.
Values of parameters for F-FPSP.
| Synchronous Machine and Excitation System | Waterway and Governor | Pump-Turbine | |||||
|---|---|---|---|---|---|---|---|
| Para. | Values | Para. | Values | Para. | Values | Para. | Values |
| Xd | 0.768 pu. | T’’do | 0.049 s | Te | 0.115 s | ey | 0.7 pu. |
| X’d | 0.249 pu. | T’’qo | 0.0283 s | Tw | 0.3 s-4 s | eω | −0.96 pu. |
| X’’d | 0.187 pu. | Ka | 100 pu. | Ty | 0.1 s | eh | 1.44 pu. |
| Xq | 0.512 pu. | Ta | 0.001 pu. | α | 0.5 | eqy | 0.66 pu. |
| X’’q | 0.189 pu. | Kf | 0.001 pu. | — | — | eqω | 0.10 pu. |
| T’do | 7.88 s | — | — | — | — | eqh | 0.47 pu. |
References
- Tarroja, B.; Forrest, K.; Chiang, F.; AghaKouchak, A.; Samuelsen, S. Implications of hydropower variability from climate change for a future, highly-renewable electric grid in California. Appl. Energy 2019, 237, 353–366. [Google Scholar] [CrossRef]
- Tang, Y.M.; Bai, Y.; Huang, C.Z.; Du, B. Linear active disturbance rejection-based load frequency control concerning high penetration of wind energy. Energy Convers. Manag. 2015, 95, 259–271. [Google Scholar] [CrossRef]
- Li, H.H.; Mahmud, M.A.; Arzaghi, E.; Abbassi, R.; Chen, D.Y.; Xu, B.B. Assessments of economic benefits for hydro-wind power systems: Development of advanced model and quantitative method for reducing the power wastage. J. Clean Prod. 2020, 277, 123823. [Google Scholar] [CrossRef]
- Javed, M.S.; Ma, T.; Jurasz, J.; Amin, M.Y. Solar and wind power generation systems with pumped hydro storage: Review and future perspectives. Renew. Energy 2020, 148, 176–192. [Google Scholar] [CrossRef]
- Zhang, J.J.; Xu, B.B.; Chen, D.Y.; Li, H.H.; Mahmud, M.A.; Govaerts, W. Local bifurcation and continuation of a non-linear hydro-turbine governing system in a single-machine infinite-bus power system. IET Gener. Transm. Dis. 2020, 14, 3346–3355. [Google Scholar] [CrossRef]
- Xu, B.B.; Chen, D.Y.; Venkateshkumar, M.; Xiao, Y.; Yue, Y.; Xing, Y.Q.; Li, P.Q. Modeling a pumped storage hydropower integrated to a hybrid power system with solar-wind power and its stability analysis. Appl. Energy 2019, 248, 446–462. [Google Scholar] [CrossRef]
- Kong, Y.G.; Kong, Z.G.; Liu, Z.Q.; Wei, C.M.; Zhang, J.F.; An, G.C. Pumped storage power stations in China: The past, the present, and the future. Renew. Sust. Energy Rev. 2016, 71, 720–731. [Google Scholar] [CrossRef]
- Xie, T.T.; Zhang, C.B.; Wang, T.T.; Cao, W.Z.; Shen, C.H.; Wen, X.K.; Mao, C. Optimization and service lifetime prediction of hydro-wind power complementary system. J. Clean Prod. 2021, 291, 125983. [Google Scholar] [CrossRef]
- Zhu, F.L.; Zhong, P.A.; Sun, Y.M.; Xu, B.; Ma, Y.F.; Liu, W.F.; Zhang, D.C.; Dawa, J.M. A coordinated optimization framework for long-term complementary operation of a large-scale hydro-photovoltaic hybrid system: Nonlinear modeling, multi-objective optimization and robust decision-making. Energy Convers. Manag. 2020, 226, 113543. [Google Scholar] [CrossRef]
- Ding, Z.Y.; Wen, X.; Tan, Q.F.; Yang, T.T.; Fang, G.H.; Lei, X.H.; Zhang, Y.; Wang, H. A forecast-driven decision-making model for long-term operation of a hydro-wind-photovoltaic hybrid system. Appl. Energy 2021, 291, 116820. [Google Scholar] [CrossRef]
- Martinez-Lucas, G.; Sarasua, J.I.; Sanchez-Fernandez, J.A. Eigen analysis of wind-hydro joint frequency regulation in an isolated power system. Int. J. Elec. Power 2018, 103, 511–524. [Google Scholar] [CrossRef]
- Xu, B.B.; Li, H.H.; Campana, P.E.; Hredzak, B.; Chen, D.Y. Dynamic regulation reliability of a pumped-storage power generating system: Effects of wind power injection. Energy Convers. Manag. 2020, 222, 113226. [Google Scholar] [CrossRef]
- Yang, W.J.; Yang, J.D.; Guo, W.C.; Norrlund, P. Response time for primary frequency control of hydroelectric generating unit. Int. J. Elec. Power 2016, 74, 16–24. [Google Scholar] [CrossRef]
- Guo, W.C.; Yang, J.D. Stability performance for primary frequency regulation of hydro-turbine governing system with surge tank. Appl. Math. Model. 2018, 54, 446–466. [Google Scholar] [CrossRef]
- Jiang, C.X.; Zhou, J.H.; Shi, P.; Huang, W.; Gan, D.Q. Ultra-low frequency oscillation analysis and robust fixed order control design. Int. J. Elec. Power 2019, 104, 269–278. [Google Scholar] [CrossRef]
- Yang, W.J.; Huang, Y.F.; Zhao, Z.G.; Yang, J.D.; Yang, J.B. Stability region of hydropower plant with surge tank at HVDC sending terminal. Energy Sci. Eng. 2021, 9, 694–709. [Google Scholar] [CrossRef]
- Wang, S.J.; Wu, X.Y.; Chen, G.; Xu, Y. Small-Signal Stability Analysis of Photovoltaic-Hydro Integrated Systems on Ultra-Low Frequency Oscillation. Energies 2020, 13, 1012. [Google Scholar] [CrossRef]
- Lu, X.M.; Chen, L.; Ding, C.J.; Zhang, Y.W.; Min, Y. Hopf Bifurcation and Limit Cycle in Islanded Hydro-Dominant Sending Systems. Power Syst. Technol. 2018, 42, 2544–2550. (In Chinese) [Google Scholar]
- Yang, W.J.; Yang, J.D. Advantage of variable-speed pumped storage plants for mitigating wind power variations: Integrated modelling and performance assessment. Appl. Energy 2019, 237, 720–732. [Google Scholar] [CrossRef]
- Kougias, I.; Aggidis, G.; Avellan, F.; Deniz, S.; Lundin, U.; Moro, A.; Muntean, S.; Novara, D.; Perez-Diaz, J.I.; Quaranta, E.; et al. Analysis of emerging technologies in the hydropower sector. Renew. Sust. Energy Rev. 2019, 113, 109257. [Google Scholar] [CrossRef]
- Kuwabara, T.; Shibuya, A.; Furuta, H.; Kita, E.; Mitsuhashi, K. Design and dynamic response characteristics of 400 MW adjustable speed pumped storage unit for Ohkawachi Power Station. IEEE Trans. Energy Convers. 1996, 11, 376–382. [Google Scholar] [CrossRef]
- Bidgoli, M.A.; Yang, W.J.; Ahmadian, A. DFIM versus synchronous machine for variable speed pumped storage hydropower plants: A comparative evaluation of technical performance. Renew. Energy 2020, 159, 72–86. [Google Scholar] [CrossRef]
- Yao, W.W.; Deng, C.H.; Peng, P. Optimization Method and Reduced-Order Steady-State Model for Variable-Speed Pump-Turbine Unit. IEEE Access 2021, 9, 31130–31142. [Google Scholar] [CrossRef]
- Martinez-Lucas, G.; Perez-Diaz, J.I.; Chazarra, M.; Sarasua, J.I.; Cavazzini, G.; Pavesi, G.; Ardizzon, G. Risk of penstock fatigue in pumped-storage power plants operating with variable speed in pumping mode. Renew. Energy 2019, 133, 636–646. [Google Scholar] [CrossRef]
- Iliev, I.; Trivedi, C.; Dahlhaug, O.G. Variable-speed operation of Francis turbines: A review of the perspectives and challenges. Renew. Sust. Energy Rev. 2019, 103, 109–121. [Google Scholar] [CrossRef]
- Gong, G.X.; Lv, J.L.; Jiang, X.J.; Sun, X.D. Operation control of doubly-fed variable-speed pumped-storage units participating in primary frequency regulation. Energy Storage Sci. Technol. 2020, 9, 1878–1884. (In Chinese) [Google Scholar]
- Bidgoli, M.A.; Mohammadpour, H.A.; Bathaee, S.M.T. Advanced Vector Control Design for DFIM-Based Hydropower Storage for Fault Ride-Through Enhancement. IEEE Trans. Energy Convers. 2015, 30, 1449–1459. [Google Scholar] [CrossRef]
- Li, H.; Huang, Z.J.; Liu, H.T.; Song, E.B.; Xiao, H.W.; Luo, L.; Huang, Z.X. Control strategy of rapid power response for AC excited pump storage unit. Electr. Power Autom. Equip. 2017, 37, 156–161+175. (In Chinese) [Google Scholar]
- Yan, W.; Shi, X.J.; Shi, Y.F.; Liu, W.Q.; Wu, L.; Ding, Y. Research on Unit Control Strategy of AC Excitation Variable Speed Pump Storage Unit. Large Electr. Mach. Hydraul. Turbine 2020, 6, 84–90. (In Chinese) [Google Scholar]
- Xu, B.B.; Wang, F.F.; Chen, D.Y.; Zhang, H. Hamiltonian modeling of multi-hydro-turbine governing systems with sharing common penstock and dynamic analyses under shock load. Energy Convers. Manag. 2020, 108, 478–487. [Google Scholar] [CrossRef]
- Hu, K.Q.; Deng, Y.W.; Chen, D.Y. Advantages of variable-speed pumped storage plants in generating phase-modulation mode: Rapidity and stability. IET Renew. Power Gen. 2020, 14, 3732–3741. [Google Scholar] [CrossRef]
- Zhu, D. Modeling and Analysis for Doubly-Fed Wind Power Generation System. Master’s Thesis, Zhejiang University of Technology, Hangzhou, China, 2019. (In Chinese). [Google Scholar]
Disclaimer/Publisher’s Note: The statements, opinions and data contained in all publications are solely those of the individual author(s) and contributor(s) and not of MDPI and/or the editor(s). MDPI and/or the editor(s) disclaim responsibility for any injury to people or property resulting from any ideas, methods, instructions or products referred to in the content. |
© 2023 by the authors. Licensee MDPI, Basel, Switzerland. This article is an open access article distributed under the terms and conditions of the Creative Commons Attribution (CC BY) license (https://creativecommons.org/licenses/by/4.0/).