1. Introduction
Most countries are concerned about energy, the environment, and, in particular, global warming because of its negative impact on the environment. Thermal power plants are still used to generate electricity around the world because they have a significant advantage: they ensure power system stability (similar to nuclear power plants), as opposed to green energy power plants, which are unstable (from the point of view of continuous production of electricity). After February 2022, the emphasis will shift back to these types of power plant, most of which burn coal and are linked directly to environmental pollution. If coal were still used today, the reserves would last another 200 years. Environmental protection laws can be fulfilled by reducing the emissions from power plants and employing innovative coal-burning technologies [
1,
2,
3].
Electrostatic precipitators (ESPs) consume about 1% of the energy produced by a thermal power station. They are designed as sections connected in series, each with its own high-voltage source. Dry plate-type ESPs are used for dust removal in power plants, paper mills, cement plants, the steel industry and the chemical industry, and have two major functions (depending on the industry): reducing ambient air pollution and collecting dust particles for reuse [
4,
5,
6,
7].
Single-stage ESP usually takes the form of a series of vertical plates (collecting electrodes), which are normally at ground potential (and positive potential), with insulated discharging electrodes (and negative potential) positioned midway between them. The voltage between electrodes can be 60–70 kV, depending on the spacing of the collecting electrode and the type of the discharge electrode. Industrial ESPs are typically two-, three-, or four-section ESPs [
1,
8].
Near the discharge electrodes, the resultant high electric field ionizes the gas molecules, forming negative ions and electrons that migrate under the influence of the electric field into the inter-electrode space where the dust particles pass. The larger particles receive an electric charge by collision with ions and electrons or by induction charging for the smallest particles. The charged particles then move under the influence of the electric field and migrate to the collecting electrodes, where they are deposited. The collecting electrodes are usually mechanically rapped after a period of time to remove the deposited dust layers. De-dusting with ESPs is based on the electric charging of dust particles from combustion gases, storing them on the collecting electrodes of the sections, and subsequently collecting the dust (by rapping the collection electrodes and discharge electrodes) in bunkers. The dust particles are electrically charged and produced by the discharge electrodes (which have high negative potentials) and depend on the dust resistivity [
9,
10,
11].
Understanding the phenomenon of ESPs is beneficial for their design and development. The modeling based on Deutsch’s equation, which is constantly being refined. The collection efficiency of ESPs is, in principle, determined by the migration speed of the dust particles, the surface of the collection electrodes, and the volume flow rate of the gas. Every section has an impact on collecting efficiency. From the input to the output, an increasing number of dust particles are collected. The dust particles of decreasing sizes gather as they approach the outlet [
8,
12].
Supplying the sections with intermittent or pulsed high-voltage sources can result in enhanced dust collection in the event of high-resistivity dust. The dust accumulated on the collection electrodes will induce voltage decreases of the order of kV as well as an implicit decrease in the dust’s electric charge. The increased currents in the sections are caused by the dust’s decreased resistivity. Typically, to improve the collecting performance of ESPs, the conventional power sources can be replaced with alternative types (intermittent power supply, pulse high-voltage, or high-frequency, high-voltage power converters), or a section can be added to the output (a more expensive solution) [
13,
14].
The processes of ESPs are complex, mostly relying on gas flow and the interaction of electrically charged dust particles with the electric section. Dust particle dispersion and gas turbulence in ESPs are affected by the electrical charge-discharge process of dust particles. Turbulence in ESPs is caused by the non-uniform distribution of gas velocity and dust concentration. The type of combustion (e.g., coal) utilized in the boiler has a direct impact on the dust content of the gases (spray combustion or grate combustion). After coal grinding and the combustion process in thermal power plants, it is critical to obtain dust particles with sizes of the order of µm and tens of µm that can be collected more easily. Dust particle migration velocities have values in centimeters per second and are lower for smaller dust particles. The migration speed is governed by the intensity, viscosity, and particle diameter of the electric section and is limited to a higher value for a given particle diameter. The speed of charge carriers (electrons and ions) does not remain constant over time and has values of tens of m/s [
15,
16,
17,
18].
The voltages applied to the sections influence the ESP collection efficiency, which is closely related to their dust resistivity. For high-resistivity dusts, intermittent or pulse high-voltage supplies can be used with good results. The use of power sources that ensure the highest feasible voltage level is a critical condition [
13,
19,
20,
21,
22].
Rapping the collecting electrodes alters the ESPs’ collection efficiency. Many ESPs use groups of hammers and anvils to rap on a regular basis. By varying the intensity and frequency of rapping, electromagnetic rappers can improve the rapping of collecting surfaces [
9,
17,
23].
The science and understanding of ESPs have reached a high level, in recent years. The physics of electric fields, the charging mechanism of particles, their migration velocities, and their collection have become well understood. Software programs (using powerful PCs) with the ESP’s mathematical model to perform complicated calculations and predict ESP performances have been designed [
10,
24].
The current-voltage (or current density-voltage) properties of ESP sections are particularly important in regulating the processes. The current-voltage characteristics are critical for estimating the used power and evaluating the ESPs’ collection efficiency. The discharge current increases with the discharge electrode decreasing, because the electric field at the tip increases, leading to increase of gas ionization rate. The voltage applied to the electrodes is restricted primarily by the distance between the electrodes. The measured current-voltage characteristics are dynamic, which means that they fluctuate over time (due to various factors) [
25,
26,
27].
Some studies are carried out on the influence of dust resistivity, the dust layer on collecting electrodes, and the rapping of the sections on the collection efficiency of ESP collection [
4,
5,
6,
18,
19,
20]. The objective of this article is to study the influence of the voltage forms applied between the section electrodes (through simulations and experiments), the dust layer on the collecting electrodes, and the dust resistivity (through simulations) on the collection efficiency of industrial ESPs used at power plants.
The paper is divided into five sections. The second section discusses ESPs used in thermal power plants. The third section simulates electrical and technological settings for ESPs with three sections. Experimental results with ESPs and related discussions are discussed in the fourth section. Conclusions on ESPs with three sections from thermal power plants are presented in the fifth section.
2. Electrostatic Precipitators Used in Thermal Power Plants
De-dusting of gases from thermal power plants is an important application of a plate-type ESP.
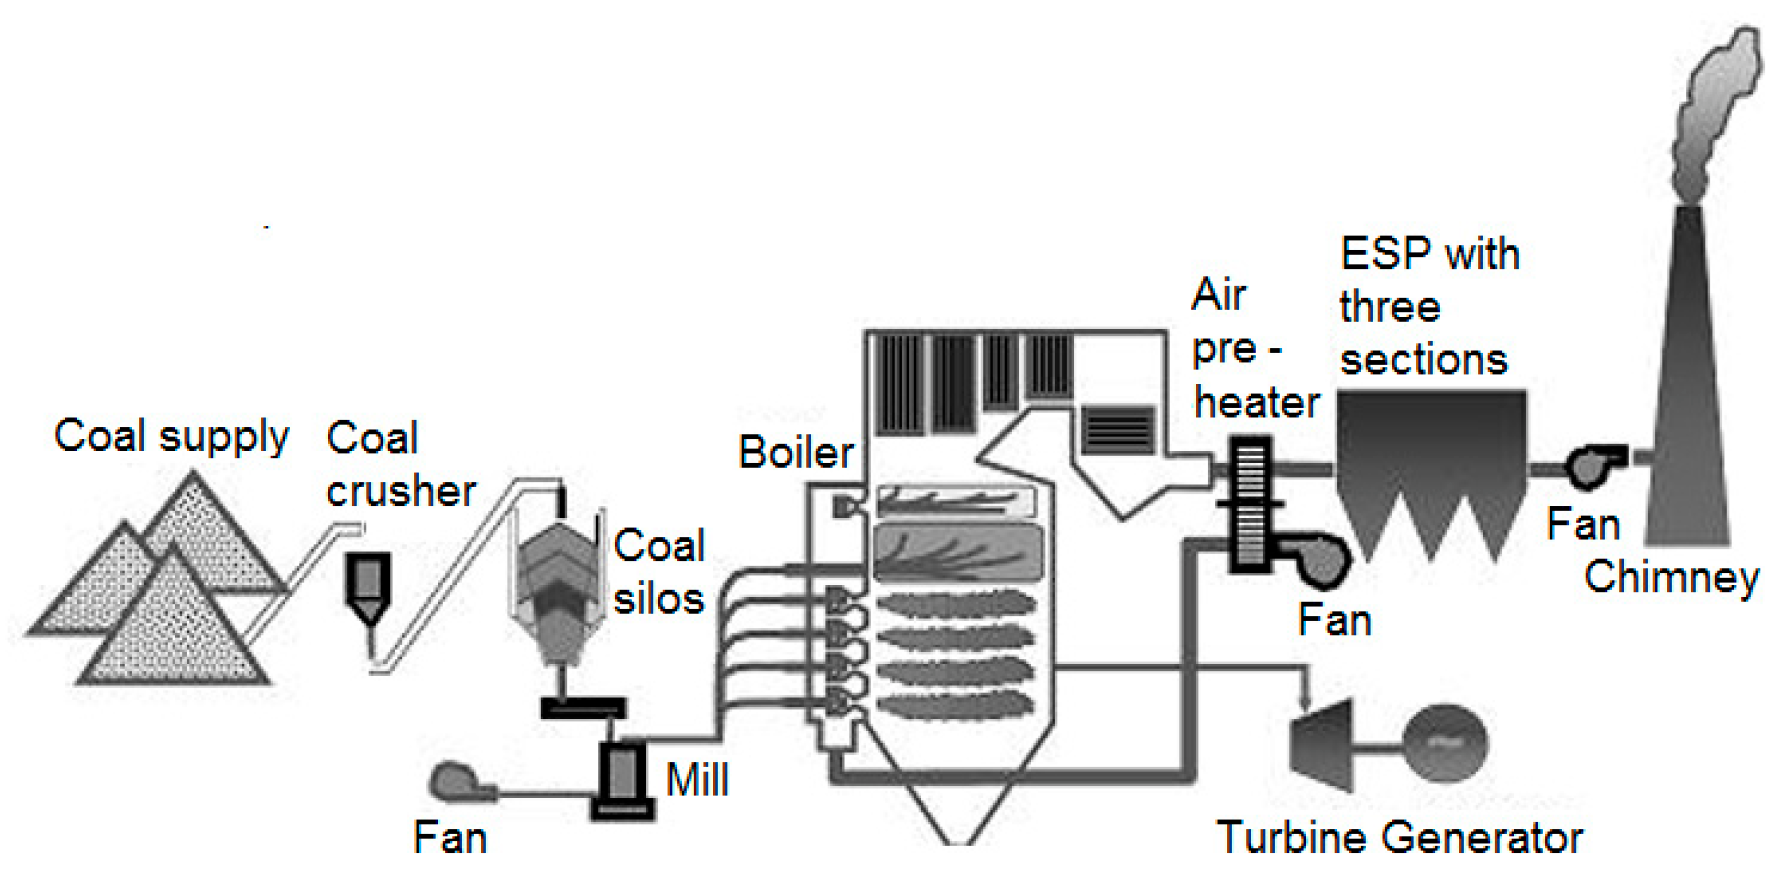
Figure 1 presents the settlement of an ESP, with three sections used in a thermoelectric power plant. ESPs with few sections (for example, two) were used in the past, especially because they required smaller investments; however, most ESPs used in thermal power plants today have three (
Figure 2) or four sections, which, while requiring higher investments, have higher collection efficiency [
8,
10].
Each section has its own power source. Before being applied to the primary side of the high voltage step-up transformer, the line voltage (two-phase, 400 V AC) is controlled by a power supply from a TCR (thyristor control reactor) (via phase control) (
Figure 3). To generate the corona discharge, the transformer has an n-turn ratio that steps up the voltage to a desired level. A high-voltage full-wave silicon bridge rectifier is used to rectify the high alternating voltage. Each precipitator section receives a full-wave rectified high voltage (usually up to 60 kV with loads). The discharge electrodes are negatively polarized, and the collecting plates and the casing are positively polarized and grounded. An automatic voltage controller determines the firing angle of the thyristor for each half-cycle on the low-voltage side [
14,
28].
For high-resistive dusts, an intermittent supply is used, consisting of power sources as shown in
Figure 3, but the thyristor control differs: a voltage pulse is applied, followed by a blockage of an even number of pulses, resulting in a certain degree of intermittentness [
8,
10,
11,
12].
The thermal power plant under consideration comprised 1200 MW of installed electrical power, six boilers (each with 210 MW of installed thermal power), and 12 plate-type ESPs (high capacity) with three (mostly) and four sections. The boilers are powerful and each one is connected to two ESPs (of the same type with three or four sections). There are two branches at the input of each ESP to ensure a more uniform distribution of the gas velocity. Under conditions in which the regulation of the power sources was modernized, ESPs with three (
Table 1) and four (
Figure 3) sections were used over time [
26,
29,
30,
31,
32].
The current study focused solely on plate-type ESPs with three sections employed in a thermal power plant. The typical properties of the fuel used in boilers are [
8]:
The dust particles produced by coal combustion in the boilers of thermal power plants range in size from less than 30 µm to 60 µm, with the majority of particles being the smaller ones (PM 10). If the large-sized particles are significant due to their mass, the small-sized particles are significant due to their number. Small particles, on the other hand, are the most difficult to gather with ESPs and the most dangerous to health. High-resistivity dust with values ranging from 10
11 to 10
13 Ω × cm is produced for gas outlet temperatures ranging from 145 to 165 °C, after burning the coal [
9,
33,
34,
35,
36].
The dust particles with the largest diameters are gathered in the input section (Section 1), the particles with smaller diameters in the intermediate sections (Section 2), and the dust particles with the smallest diameters are collected in the last section (Section 3). The first section collects around 40–50% of the total dust mass accumulated in the ESP bunkers, the intermediate sections collect 30–40% and the last section collects the remaining 10% to 20% [
8,
33,
34,
35,
36].
When the number of dust particles is taken into account, the situation is reversed (the first section collects the fewest dust particles, larger particles, and the last section collects the most dust particles, smaller particles) [
2,
10].
Denote the dust concentration of gases entering the ESP with
qi (g/m
3N) and the dust concentration of gases leaving the ESP with
qo (g/m
3N); the collection efficiency η (%) of the ESP is [
8]:
Table 1 shows the key geometric parameters for plate-type ESPs with three sections that are used in the thermal power plant. These ESPs are labeled 4, 5, and 6, with each two connected to an energy group (labeled A and B) [
27,
28,
29,
30]. Because these ESPs handle extremely high gas flows (hundreds of thousands of m
3/h), even slight improvements in collection efficiency result in a reduction in air pollution. The collection surface of the sections is thousands of m
2, and the sections have classical power sources (with two thyristors connected antiparallel, see
Figure 3).
3. Simulations of Electrical and Technological Parameters for Three-Section Electrostatic Precipitators
The performance of plate-type ESPs can now be calculated using dedicated software. One of them is the ESPVI 4.0.W software. The model predictions agree well with experimental measurements taken at plate-type ESPs (from the Environmental Protection Agency, Washington, D.C., USA). ESPVI 4.0.W software works under a variety of operating conditions, including high-resistivity ashes, the use of rectified current, pulse energization, different particle sizes (up to 70 µm), the detection of the onset of the back corona (through very high current densities), different discharge electrode shapes, and dust and gas characteristics.
The 2007 software, ESPVI 4.0.W (Electrostatic Precipitators U-I Curves and Performance Model), has a Windows interface. The Windows interface includes the following menus: File Options, Data Entry, Calculate V-I, Performance, View Results, Output Results, Graph Results, Utilities, and Exit. A plate-type ESP with three sections was used for simulations in different operating modes [
10,
24].
In the simulation with ESPVI 4.0.W, correction factors like air infiltration, the standard deviation of the gas velocity, the rapping factor, the average diameter of the dust particles that are reentrained in the gas flow, and the turbulence factor can be used.
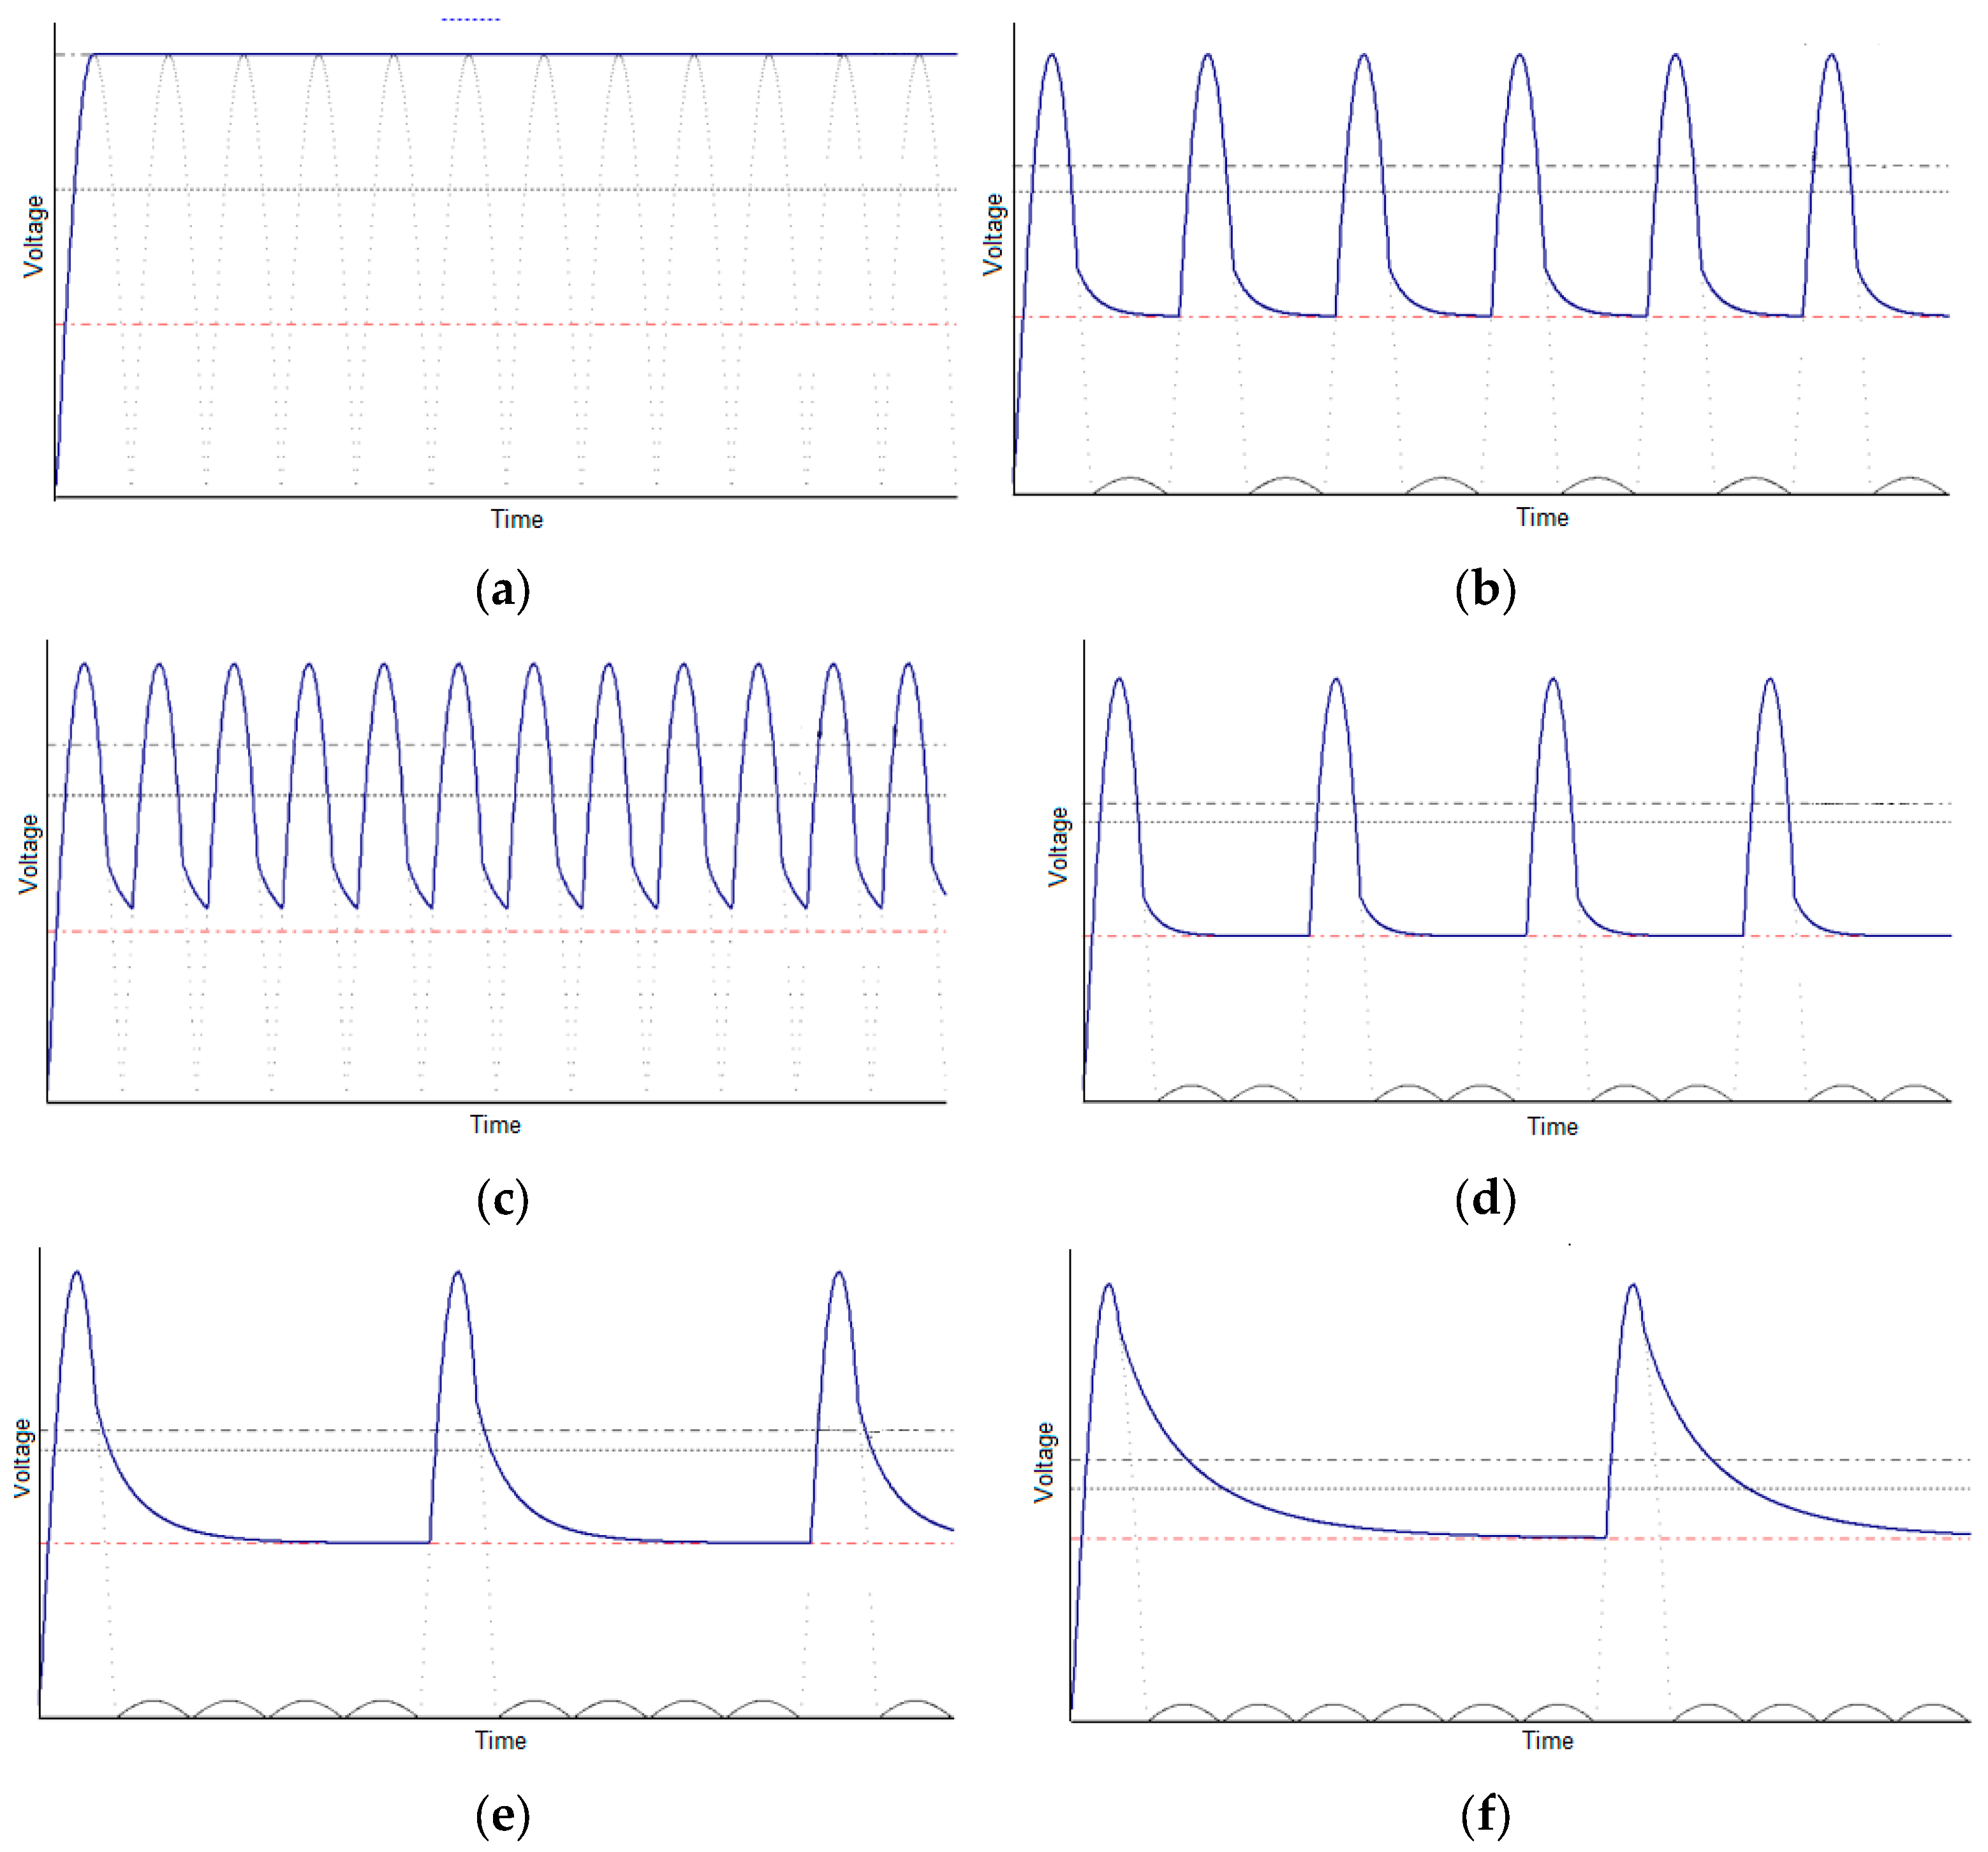
Several simulations were made. Most of the simulations took into account the nature of the high voltage applied to the sections (ideal voltage, half-wave voltage, full-wave voltage, intermittent voltage of third, fifth and seventh order—
Figure 4) [
8,
14].
In
Figure 4 and
Figure 5, the lines in the graphs (parallel to the time axis) from bottom to top represent: Corona onset voltage, minimum voltage, and average voltage.
For the voltages shown in
Figure 4, it is assumed that the electrodes were dust-free, with a dust resistance of 10
12 Ω × cm (highly resistive dust, such ash the ash resulting from the burning of coal). A lower consumption of electricity can be achieved to power each section by employing an intermittent power source (with a decrease in the number of pulses). For all examples, the peak voltage and the corona onset voltage are almost the same. Time is represented on the horizontal axis in
Figure 4 and
Figure 5.
Two form factors are used to analyze the voltages applied to the sections:
where:
Vmax,
Vavg, and
Vmin are the maximum, average, and minimum voltage applied to the ESP section. In
Table 2, V
corona is the corona onset voltage.
In settings where the maximum voltage remains constant (and the corona onset voltage remains constant), the average and minimum voltages decrease in value as the degree of intermittentness increases (
Figure 4). The form factors k
1 and k
2 grow in proportion to the degree of intermittency [
14,
35,
36].
As there is a 2 mm dust layer on the collector surfaces, all types of voltage (maximum, average, and minimum) drop in value (
Figure 5,
Table 3) when compared to a dust-free environment (
Figure 4,
Table 2).
With a dust layer on the sections, the average and minimum voltages decrease, while the corona voltage increases as the resistivity to dust increases (
Table 3). In
Figure 6,
Figure 7 and
Figure 8 and
Table 4,
Table 5,
Table 6 and
Table 7, the voltages in the sections and the currents through the sections are the average values. The current density in a section is defined in
Figure 6,
Figure 7 and
Figure 8 as the ratio of the current flowing through the section to the active collection surface of the respective section.
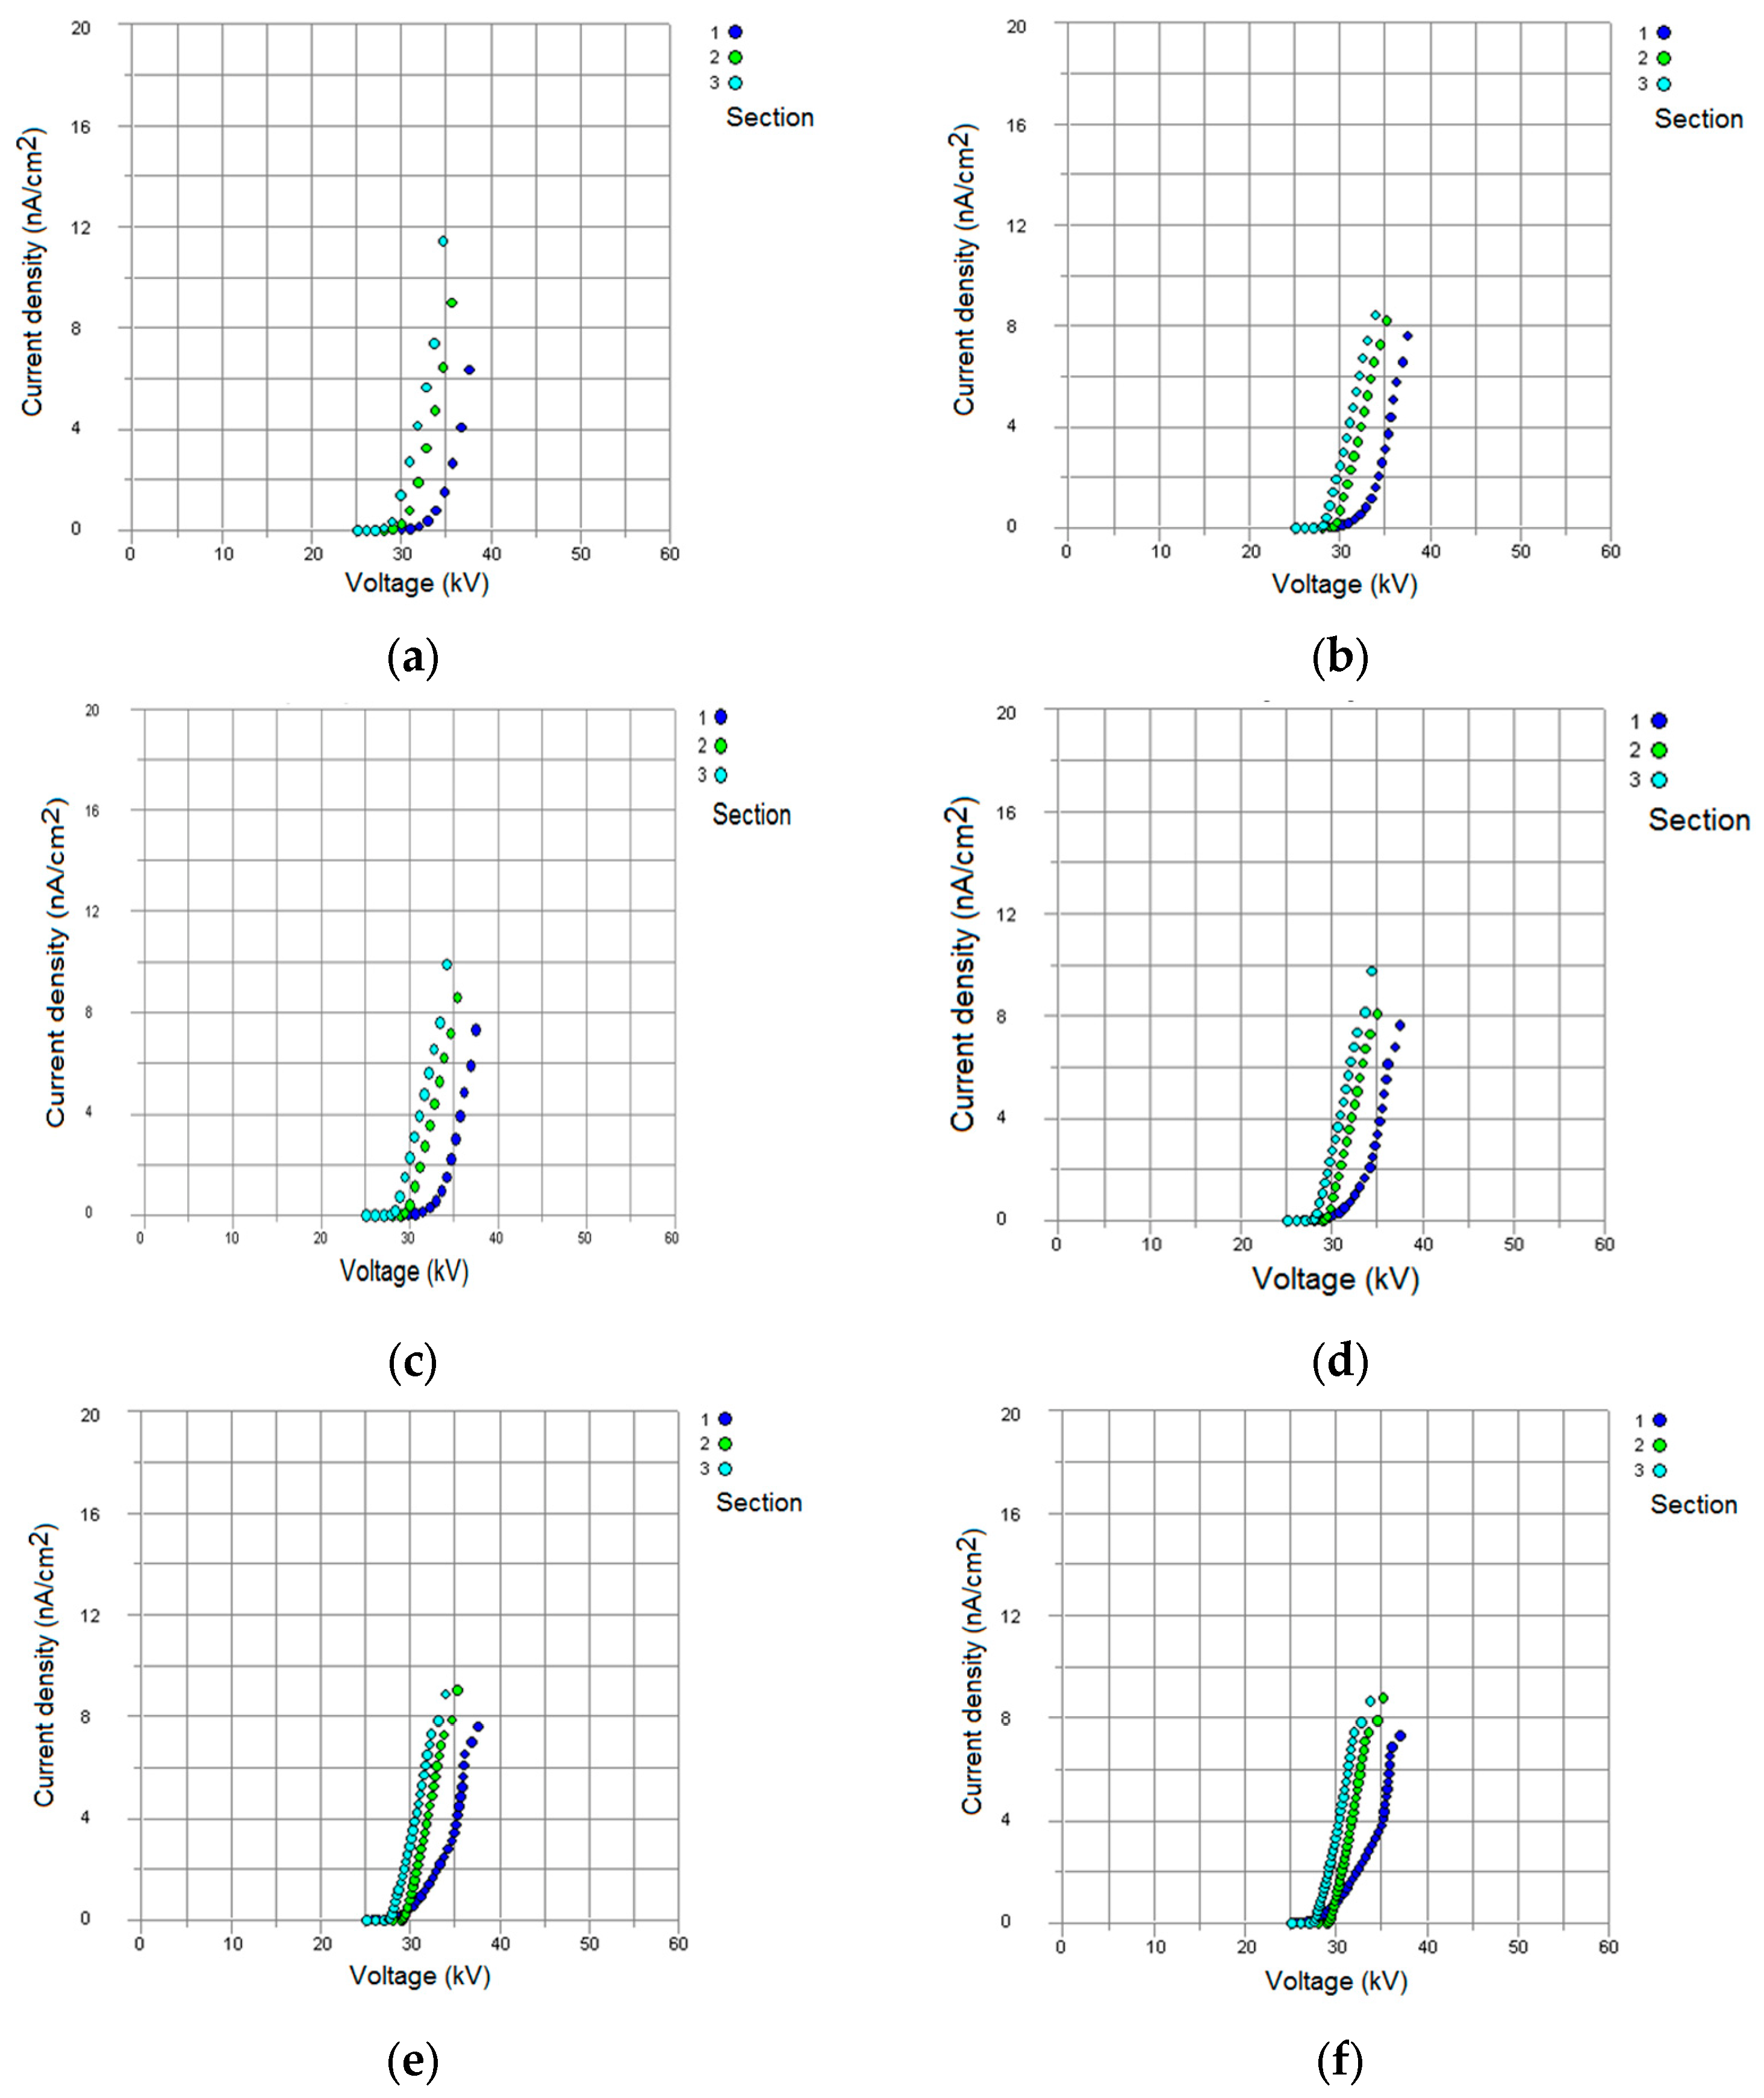
The simulations in
Figure 6 used resistive dust with the same resistivity (10
12 Ω × cm). The current density-voltage characteristics of the three sections are simulated depending on the shape of the voltage supplied to the sections. At the same supply voltage, the density current is larger in the last section than in the intermediate section, and the lowest current density is in the first section. For the same density current, the voltage is low in the last section and then higher in the intermediate section, with the highest value in the first section. The features for the intermediate and last sections are roughly the same shape (
Figure 6). With increasing intermittency, the current density in each section decreases (by 5–15% compared to the classical power supply), resulting in an energy economy. When a fully DC voltage is applied (the ideal case), the highest current density is measured. For higher and higher intermittency orders, the properties become increasingly warped.
When there is a dust layer on the characteristics of the sections, the first section remain unaltered, but the characteristics of sections 2 and 3 change somewhat (the current density is reduced and the voltages increase when there is dust in the sections) (
Figure 6 and
Figure 7). As the dust resistivity increases, the current density and maximum voltages (up to discharge) for each individual section decrease (
Figure 6 and
Figure 8).
For a high-resistive dust (10
12 Ω × cm), the form factor k
1 increases with the degree of intermittency and, at the same time, increases from the input section to the output section (
Table 4). If the dust resistivity increases, the form factor k
1 decreases (
Table 4 and
Table 5).
Table 6 shows the electrical parameters (which the program automatically modifies) for the full-wave voltage (classical supply) at three different resistivities. Although the operating voltages (the average voltage applied between the discharge and collection electrodes) of the sections increase with resistivity, the currents decrease (5–6 times lower).
Table 7 shows the operating voltages in the sections based on the voltage form (dust resistivity, 10
12 Ω × cm). The voltage level decreases as the intermittency order increases. The input section has the lowest voltages, the last section has the highest voltages (as do the currents), and the currents drop as the intermittency grows (the currents are lower in the last section).
The degree of intermittency increses the space charge density, which determines the electric charge of the dust particles (
Table 8, dust resistivity, 10
12 Ω × cm). This demonstrates improved dust collection by using intermittent high voltages. The charge density in the input section is higher than in the last section. As a result, the first section will acquire the most dust. Taking into account space charge density, voltage with a classical supply looks to be one of the weaker solutions for high-resistive dust collection.
The highly resistive dust increases the charge density in the input section and decreases it in the other sections (
Table 8 and
Table 9).
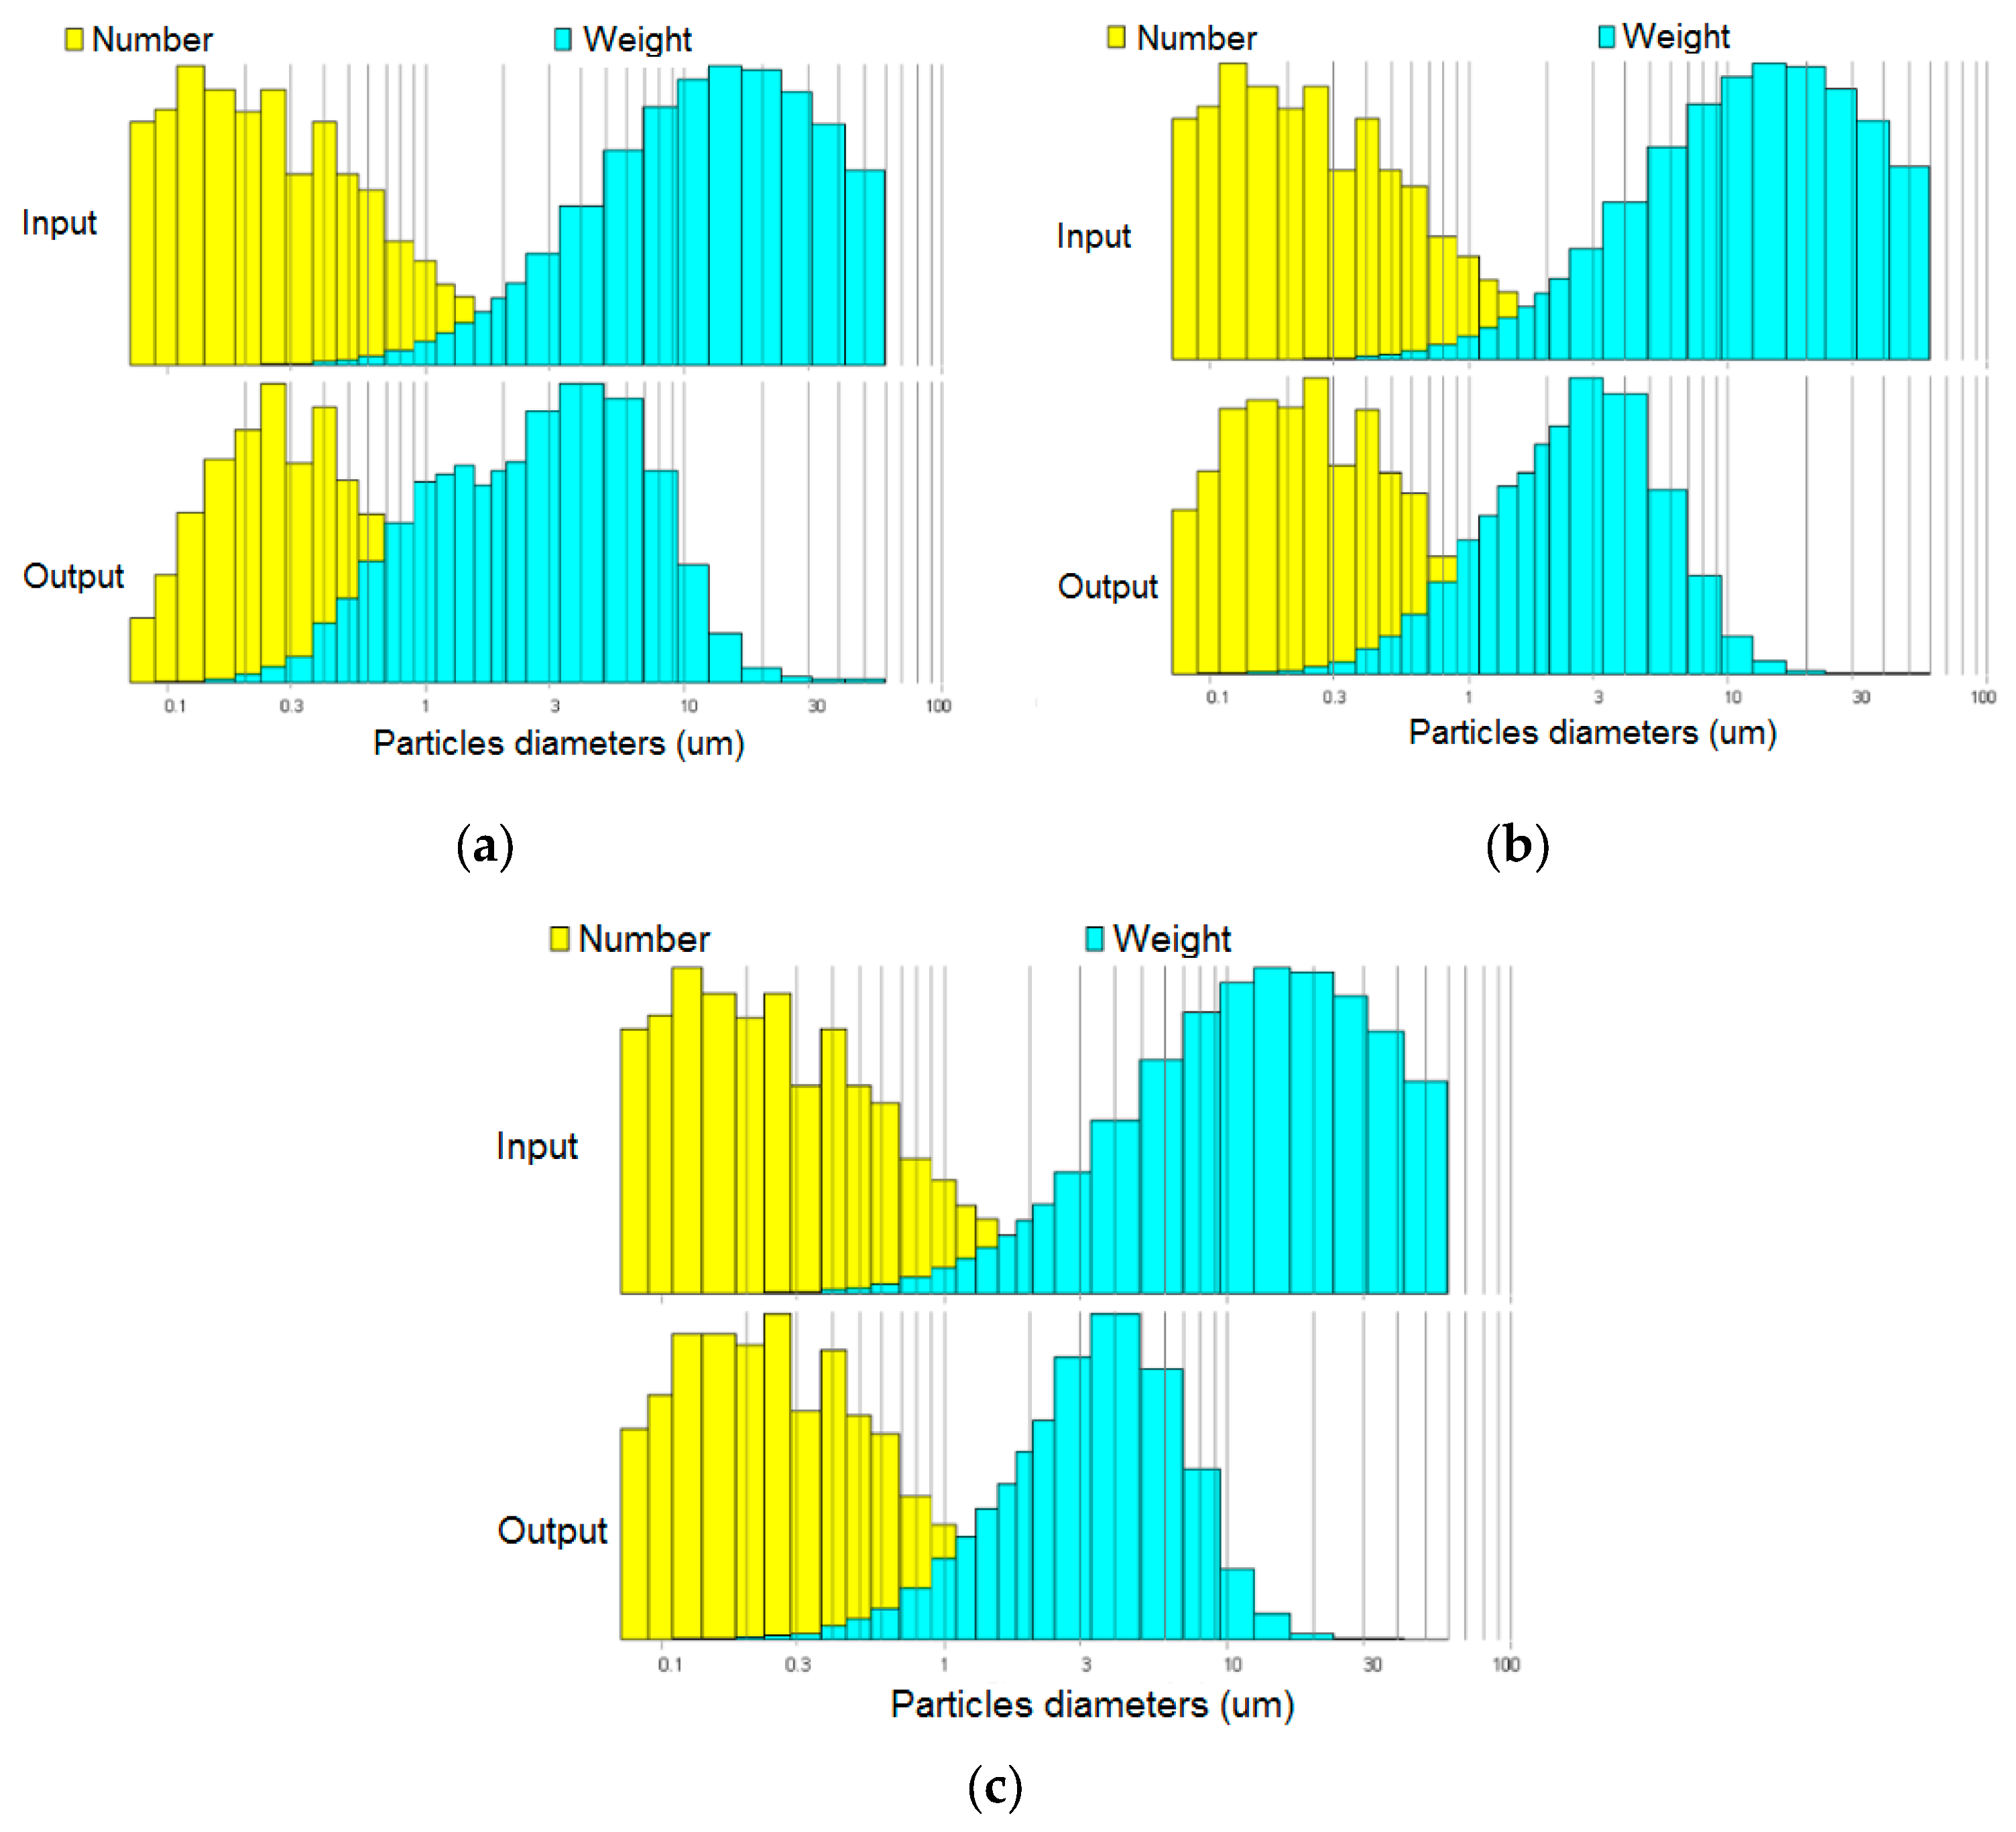
When a classical supply is applied to the sections, the dispersion of dust particles at the input and output of the ESP is simulated on the basis of their number and mass. At the input, particles with small diameters have a higher number, while particles with larger diameters have a higher mass. A dust particle distribution similar to what exists in reality was employed [
10,
24,
25]. The dust distribution at the entry is kept constant in the simulations shown in
Figure 9.
After filtering, there is a shift to the left of the features in all simulations (
Figure 9) (depending on number and mass). Dusts with lower resistivity are easier to gather than dusts with higher resistivity (
Figure 9). At entry, the majority of dust particles have sizes ranging from 3 µm to 60 µm, with the majority have diameters less than 3 µm. The distribution varies once the dust is collected, essentially regardless of the shape of the voltage. The largest masses of dust particles have diameters ranging from 1 to 10 µm, and the most dust particles are PM 1 [
9].
In
Table 10 and
Table 11, the simulations are made with a rectified voltage; ESPCE is the electrostatic precipitator collection efficiency and DD is dust density at the output of the ESP.
In
Table 10 and
Table 11, PM 10 denotes dust particles with sizes less than 10 μm, which are difficult to capture. The European Commission has determined that the average daily dust emission for this type of particle should be less than 50 μg/m
3. This concentration must not be exceeded more than seven times per year [
1,
8].
To make things easier, the dust layers on the collecting surfaces are assigned the same value in each individual section (
Table 10 and
Table 11). A larger layer of dust on the collector surfaces emphasizes the ESP’s growing improvement in collection, with collection efficiency slightly increasing. When the electrodes are constantly rapping, the collection efficiency drops by about 1.1% compared to when the sections are not rapping (due to the dust re-entrainment phenomenon). The dust concentration at the outlet of ESPs that treat flows of hundreds of thousands of m
3/h of gas (
Table 1) appears to be low. The density of dust emissions is reduced as dust layers thicken. The low dust emission density suggests smaller and smaller dust particles. The dust emission density is lower when the electrodes are not disturbed as much as when they are.
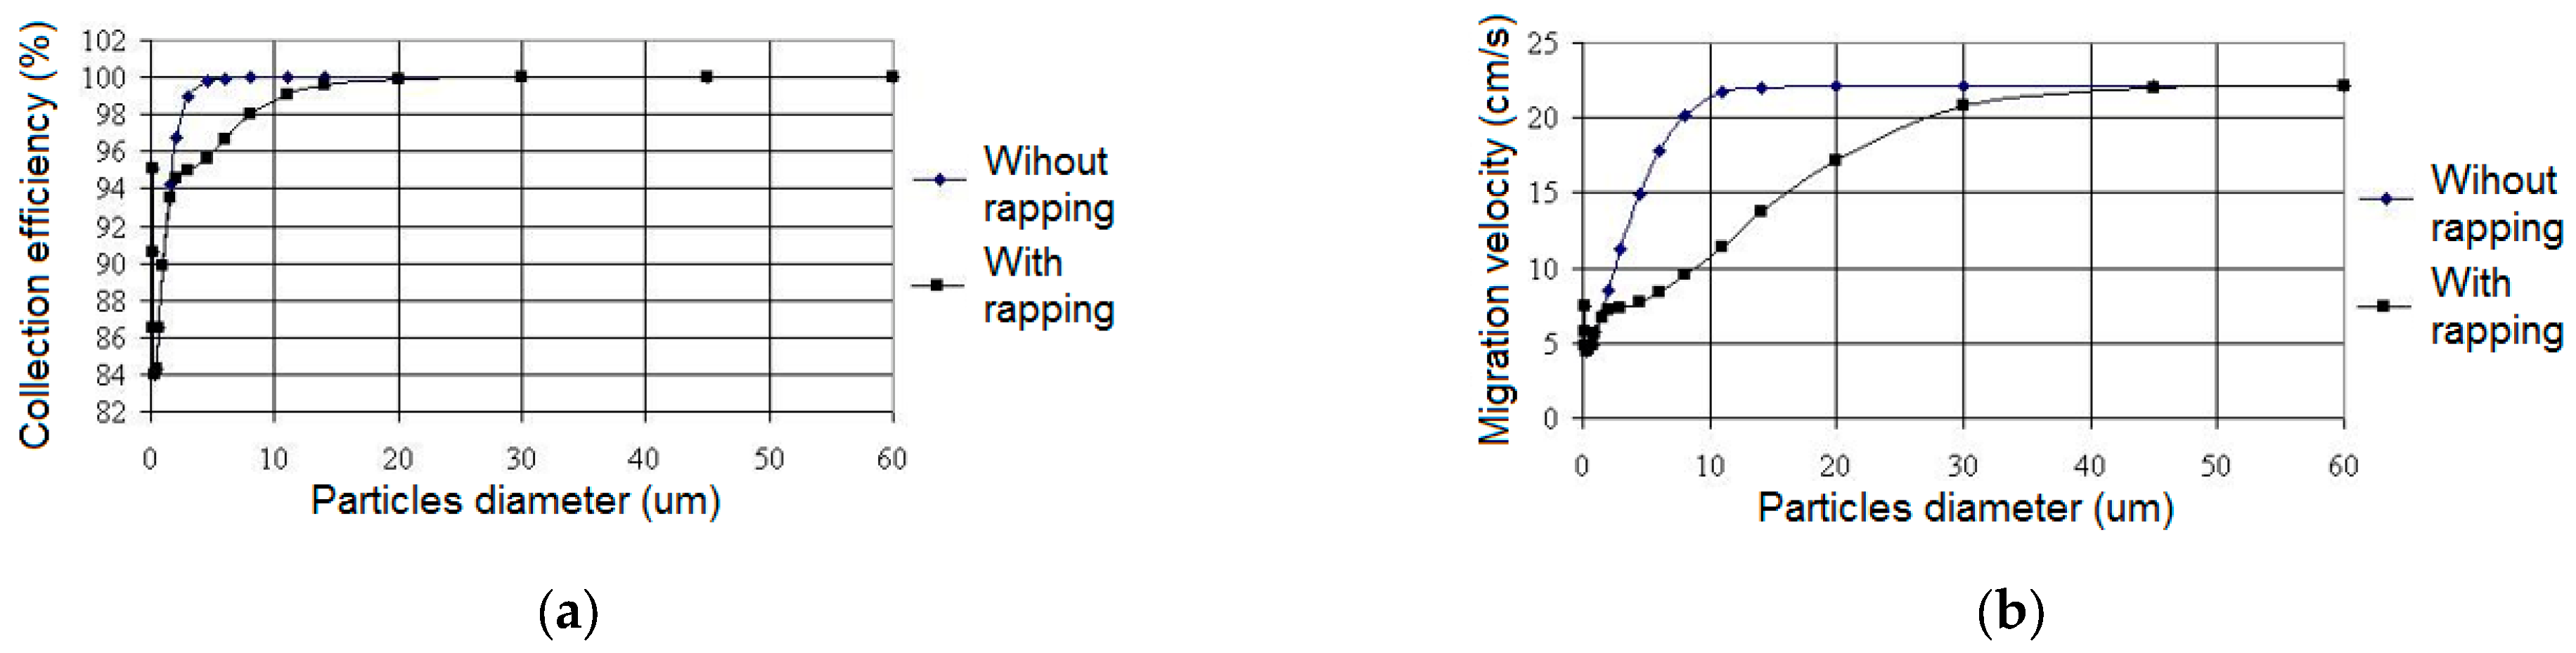
The dust resistivity in
Figure 10 and
Figure 11 is 1.7 × 10
11 Ω × cm, which is high-resistive dust.
Figure 10 and
Figure 11 show the collection efficiency by dust particle class, while the thickness of the dust layer in the sections is constant. The rate of migration is largely proportional to the efficiency with which dust particles are collected. According to the models, dust particles with diameters smaller than 15 μm are more difficult to capture by rapping, while migration speeds for dust particles with diameters smaller than 30 μm are slower.
When section rapping is not employed, the collection efficiency for dust particles with diameters lower than 5 μm reduces significantly. The migration rate decreases for particles with diameters smaller than 10 μm. Essentially, the sections must be rapped (on a regular or permanent basis) to remove the dust layers from the sections, resulting in no voltage drop on the dust layers (which can be several kV) and a lower intensity of the electric section over time. Dust particles with diameters greater than 20 μm are best captured, both when the sections are rapping and when they are not rapping.
Table 12 shows the collection efficiencies for three dust resistivities, with and without rapping, when the sections are energised with a conventional supply and the dust layers on the sections vary. When sections do not rap, the collection efficiencies are higher (0.2 to 1.2% higher), and if the resistivity is lower, the collection efficiencies are higher (1.2 to 2.1% higher). For the same dust resistivity, at different thicknesses of the layers in the sections, the collection efficiency is approximately the same.
The dust layers on the sections are actually of various thicknesses. It is discovered that as dust resistivity increases, collecting efficiency falls. The difference in collection efficiency between rapping and not rapping is greater for dusts with higher resistivities than for dusts with lower resistivities. The resistance of dust has a significant impact on collecting efficiency. Particles with sizes less than 5 µm are more difficult to gather [
25,
34].
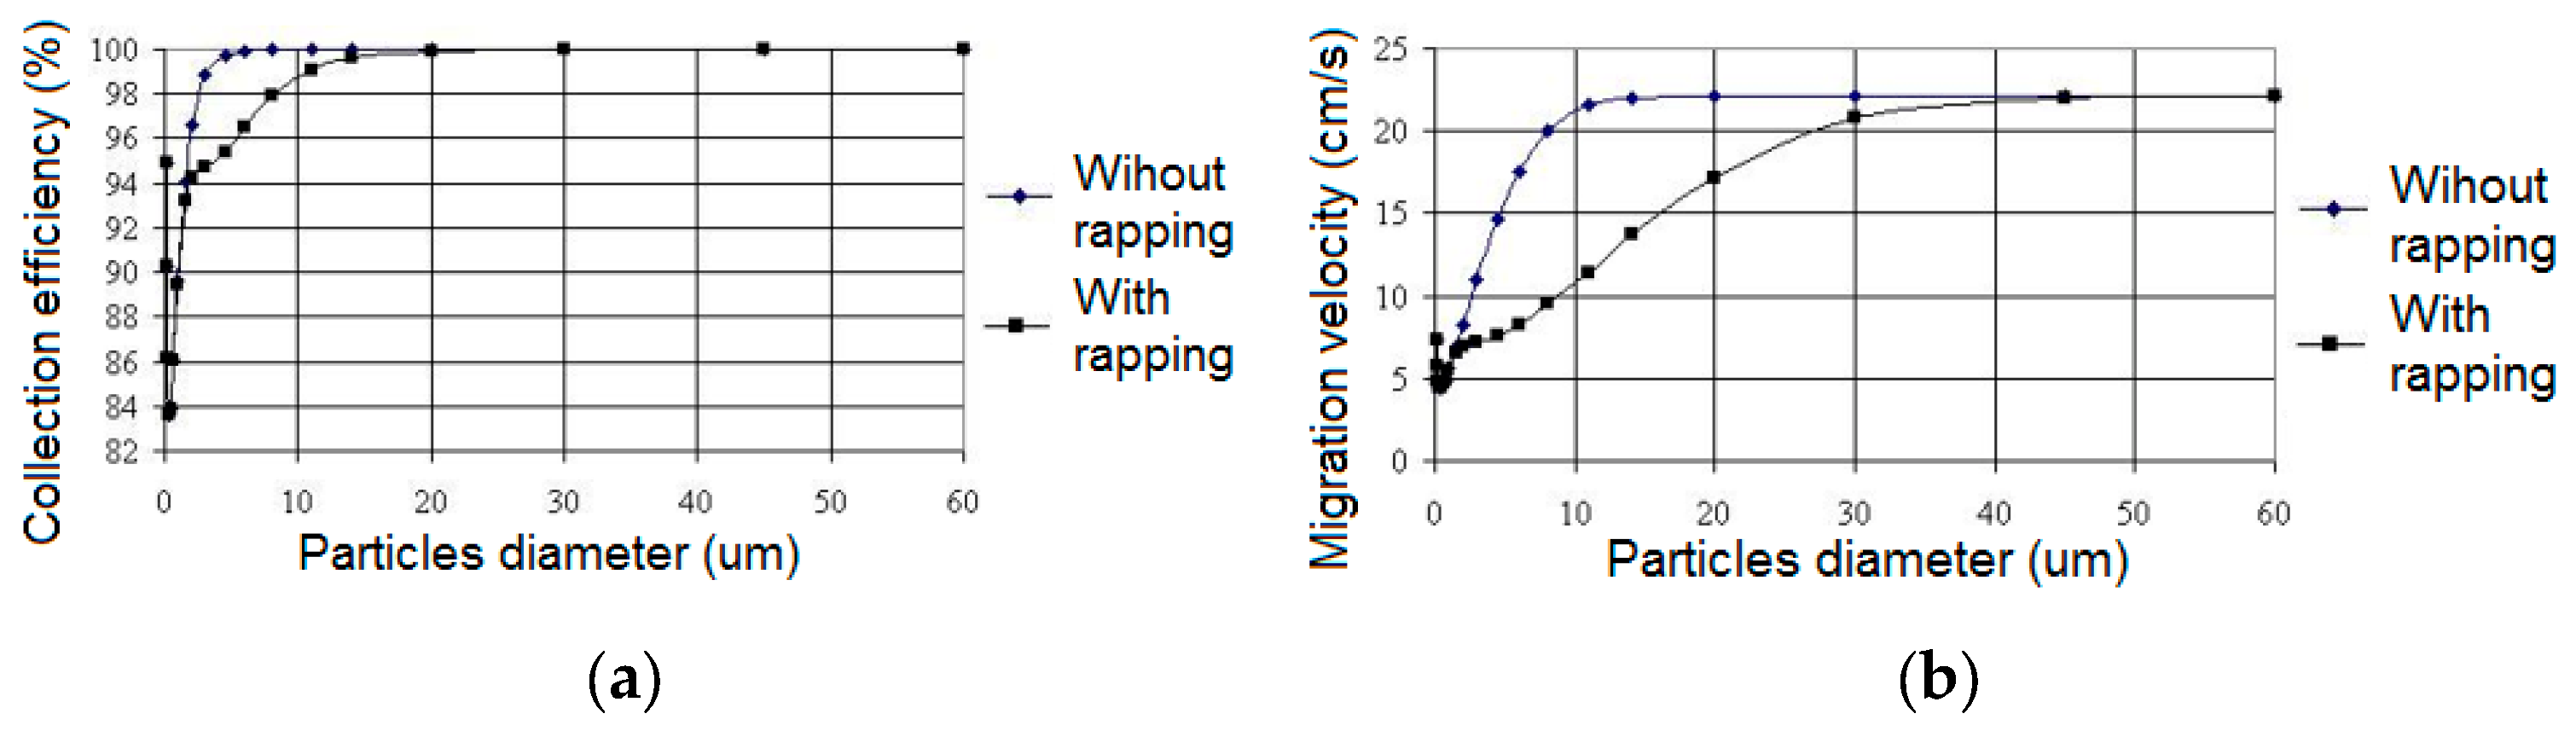
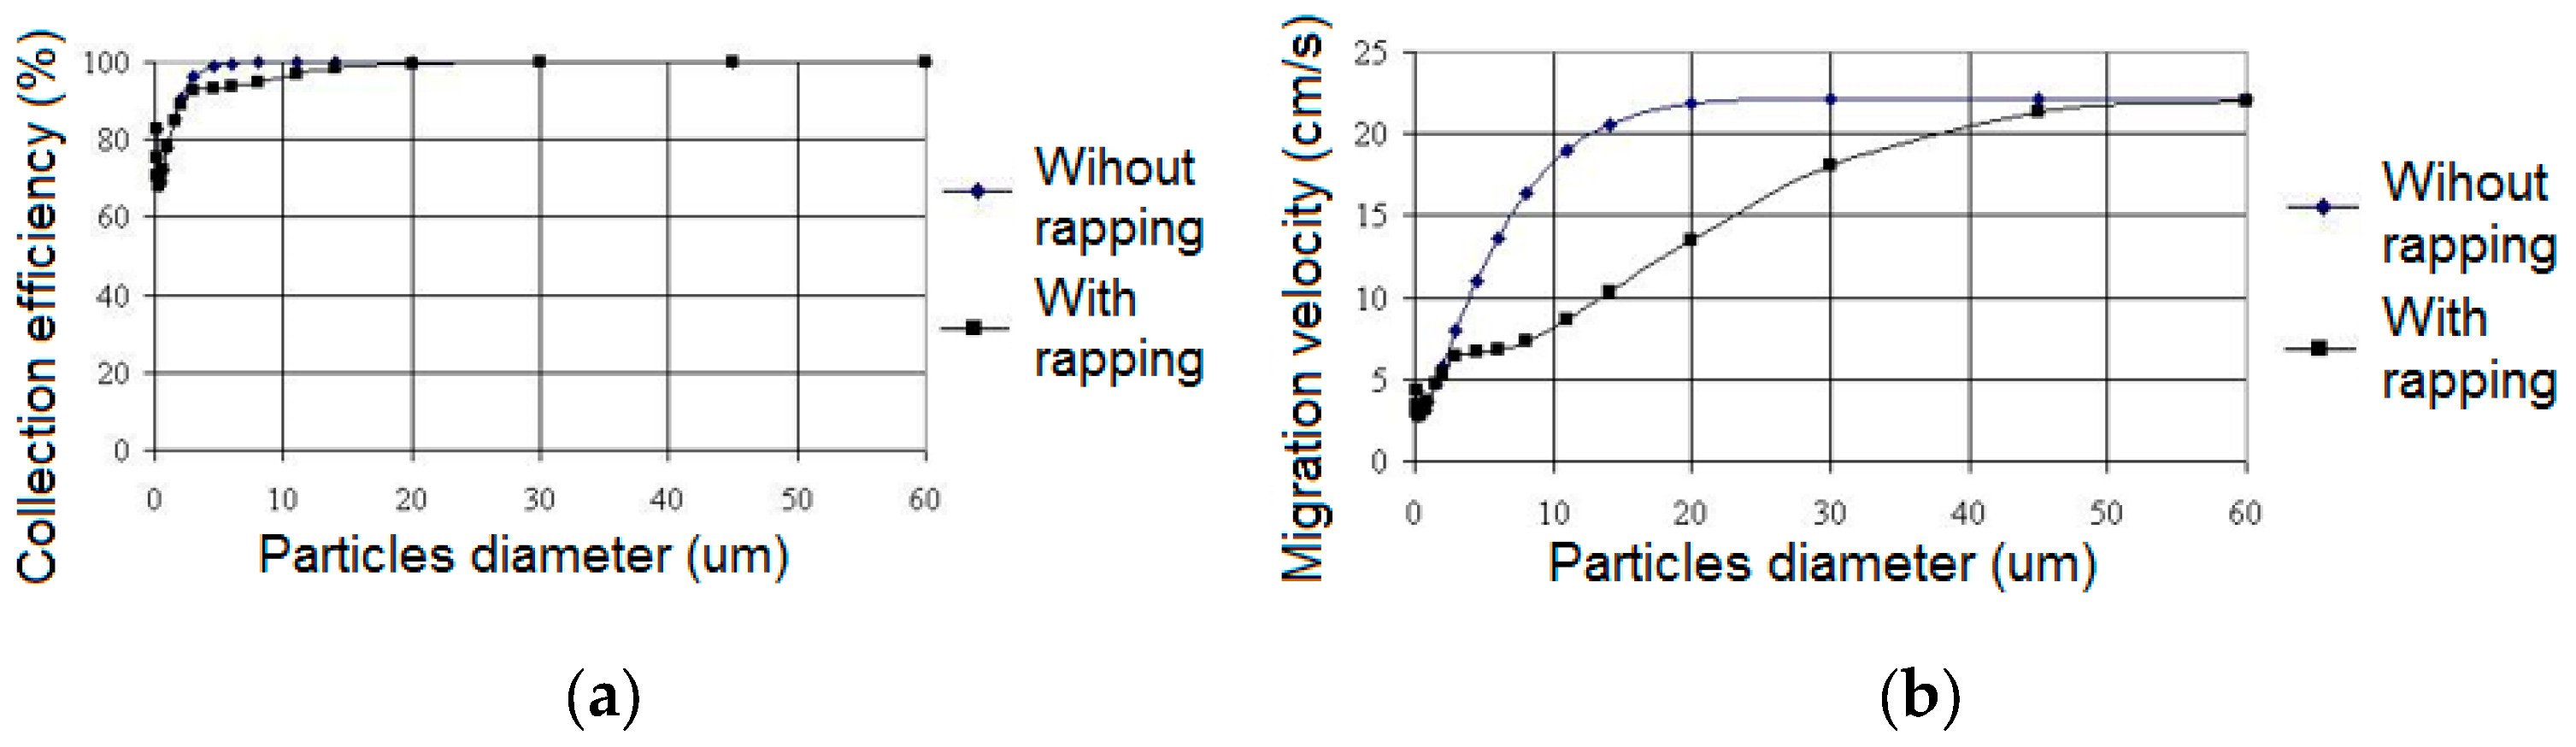
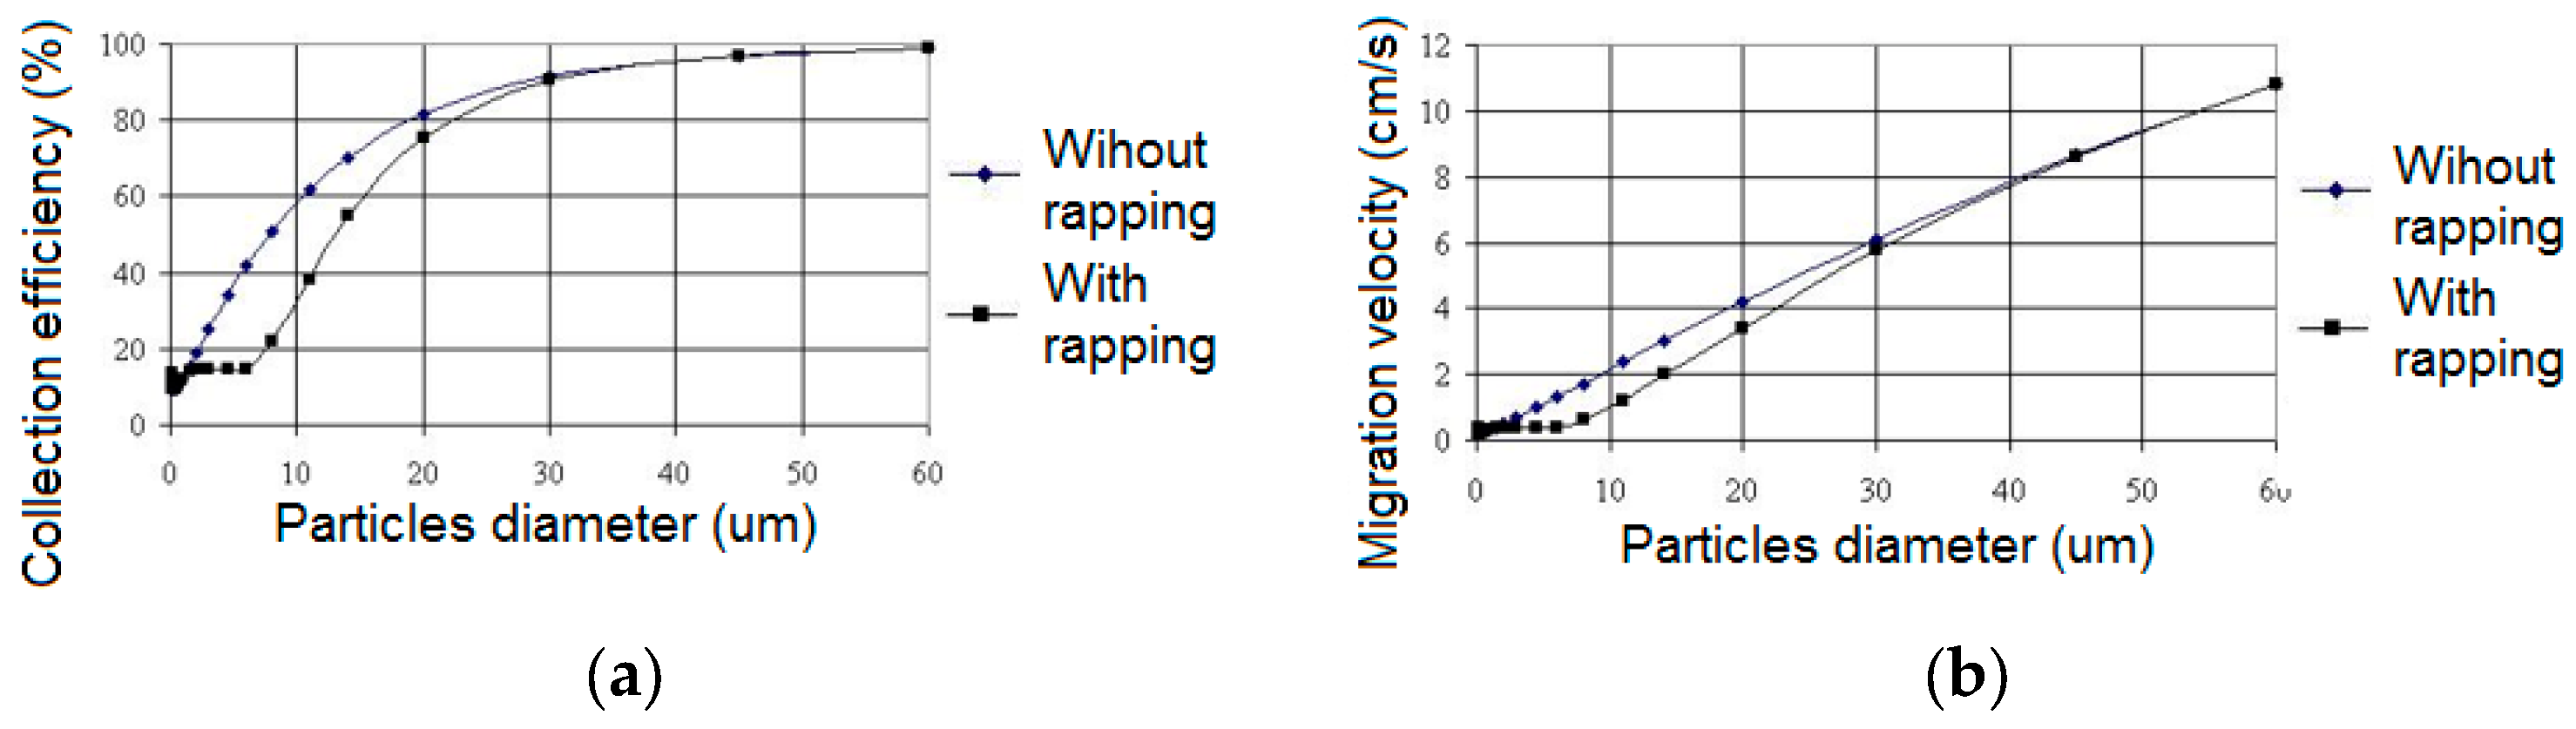
Figure 12,
Figure 13 and
Figure 14 depict the collection efficiency and the migration speed of dust particles under various dust layer conditions in the sections (less and less towards the last section, 5 mm in Section 1, 3 mm in Section 2, and 1 mm in Section 3) for three average diameters of dust particle: 16 μm, 5 μm, and 1 μm. When the sections are repeatedly rapping, the collection efficiency decreases under in all conditions. Collection efficiency is reduced for typical dust particles up to 5 μm, while migration speed is lower for dust particles with sizes less than 15–20 μm.
Collecting efficiency affects a broader class of dust particles with diameters less than 50 μm, and the migration speed is slower (the larger the diameter of the dust particles, the slower the migration speed). Larger dust particles (60 μm in diameter) are also affected. The larger the thickness of the dust layers, the poorer the collection efficiency. Collection efficiency falls as the average diameter of the dust particles decreases.
The average diameter of the combustion dust particles is determined by the type of coal, the grinding procedure, and the type of combustion in the boiler. Dust particle dispersion can be done according to mass (typically the highest concentration in the range of 2.5 μm to 40 μm), number (most with diameters less than 0.15 μm), and electric charge (generally the highest concentration in the range of 0.5 μm to 10 μm) [
19].
The most essential criterion for an ESP is its dust particle collection efficiency. The collecting efficiencies are simulated in
Table 13 and
Table 14, and are found to increase as the intermittence increases. As a result, a higher degree of intermittent supply (up to the 7th order) in theory defines a superior collection efficiency by 1–2% when compared to the classical system. The other sizes in
Table 13 exhibit a reverse progression compared to the collecting efficiency (the last line is the exception). The concentration of PM 10 dust particles at the exit is in the hundreds and the concentration of PM 2.5 dust particles is in the tens of mg/m
3. Because industrial ESPs are so large, collection efficiencies are very high.
ODC is the output dust concentration, SCTE is the rapping contribution to total emission, and RES is the resistivity of dust (
Table 13,
Table 14 and
Table 15).
There are significant differences between when the sections are rapping (0.5–3% lower collection efficiency) and when the sections are not rapping (greater collection efficiency) (
Table 14). High-resistivity dust is more difficult to collect than low-resistivity dust. The rapping of the sections increases the concentrations of PM 10 and PM 2.5 dust in the ESP output.
4. Experimental Measurements with Three-Section ESP and Discussions
The experiments were carried out on plate-type ESPs with three sections of the thermal power plant. INFOSTAR CSI-44 converters (high voltage or section current at input; output 4–20 mA), ISO A4-P3-04 converters (input 4–20 mA; output 0–5 V DC), and a data acquisition card K 8047 type (Velleman Instruments) recorder/logger connected via USB to laptop were used to measure the current density-voltage characteristics and the evolution of voltages and currents over time (
Figure 15 and
Figure 16). At the inputs of K 8047, voltages (in the range of 3, 6, 15, or 30 V) could be measured on four channels with varied time bases (1, 2, 5, 10, 20, 50, 100, 200, 500, and 1000 s/div) [
28].
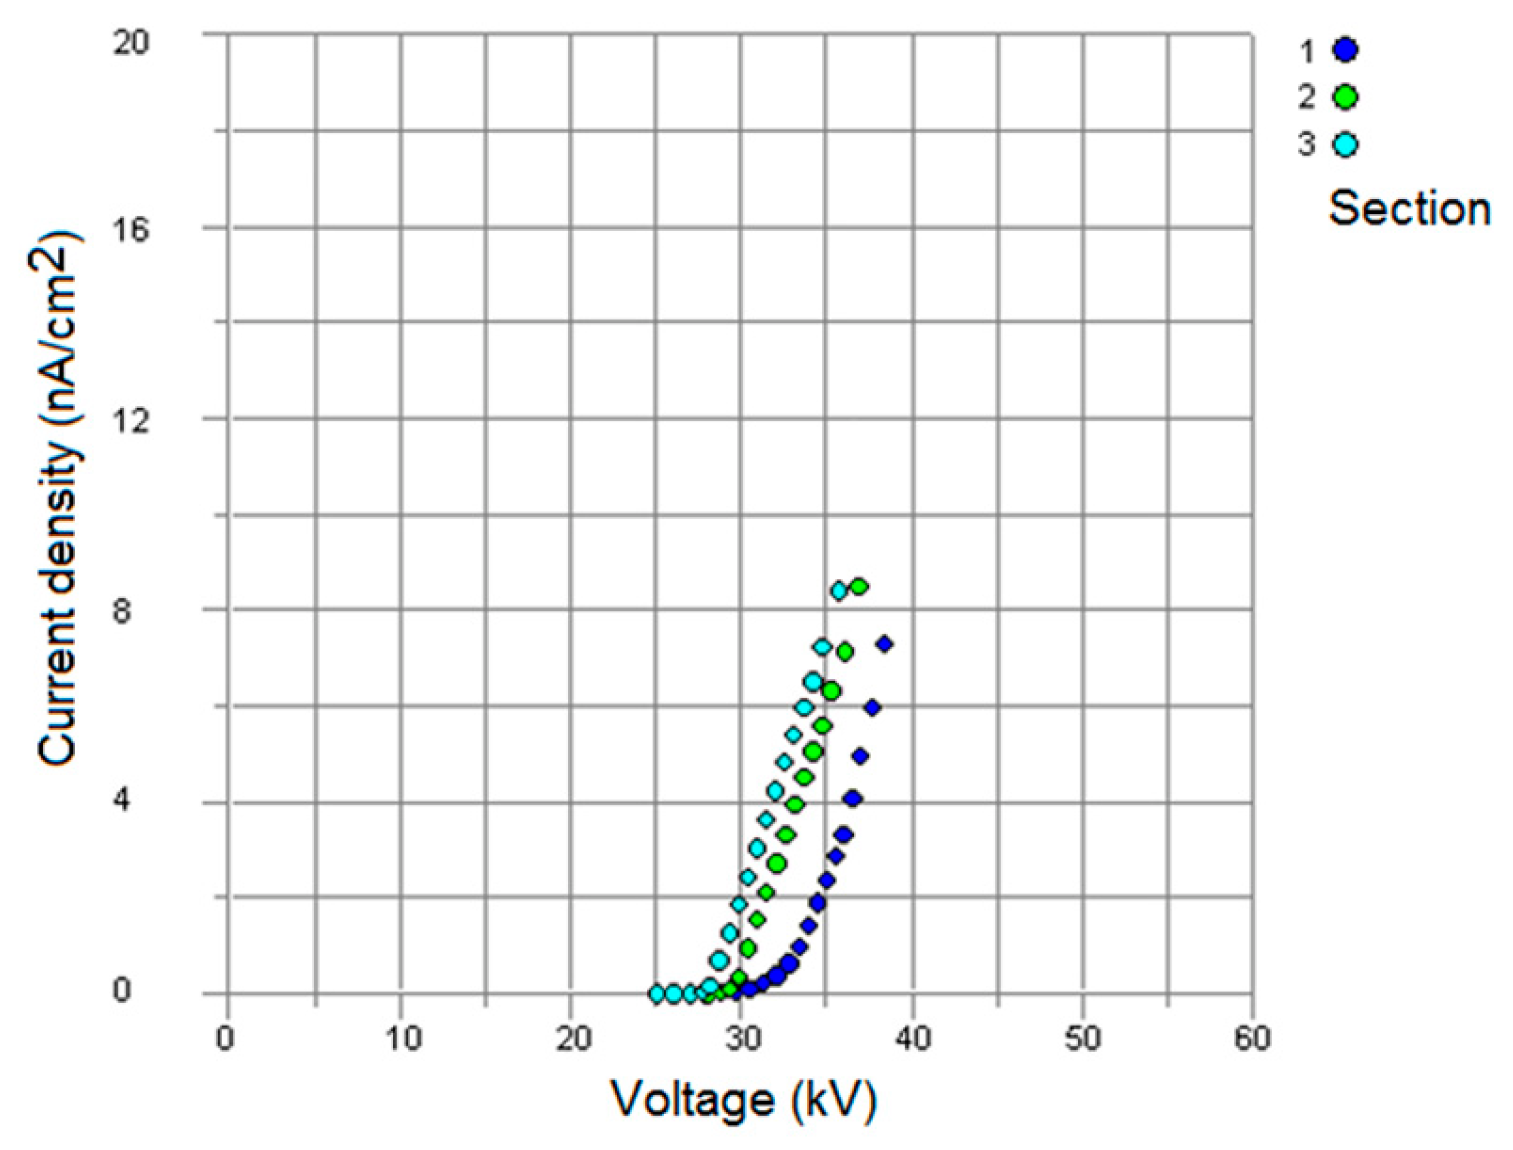
The current density-voltage characteristics of an ESP with three sections were measured (
Figure 15). The experimental data were collected in the section from the corona onset voltage to the discharge voltage. The current density and voltage characteristics show the presence of a highly-resistive dust with estimated values of 10
12–10
13 Ω × cm (as in the simulations in
Figure 6,
Figure 7 and
Figure 8). The voltages are higher in the first section and decrease in the last section, whereas the current is smaller in the first section and grows in the last. The experimental properties evolve similarly to the simulated ones (
Figure 6,
Figure 7 and
Figure 8).
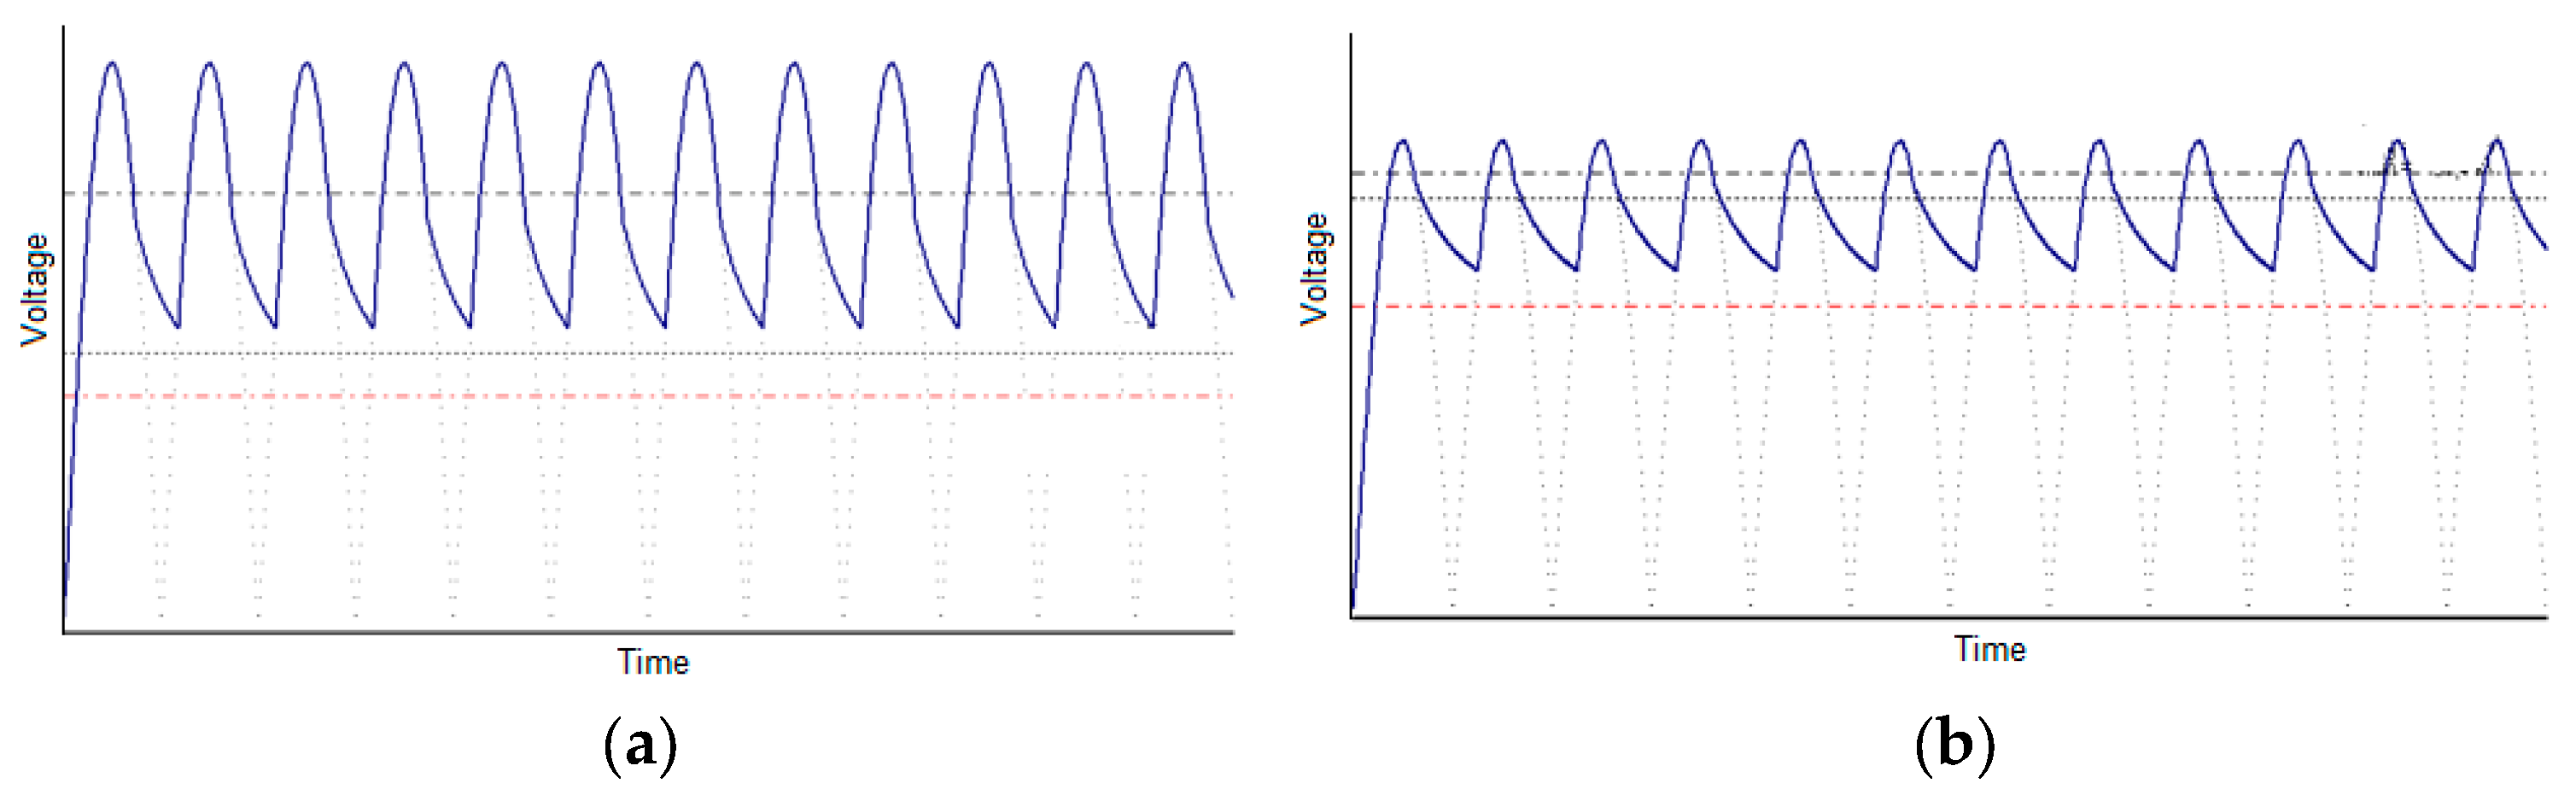
The power sources of ESP sections have a control (analog or digital) that ensures a constant increase in voltage until discharges occur (
Figure 16), at which point the voltage is reduced (to the corona onset voltage) and increased for a few seconds. Light electrical discharges (
Figure 16a) can occur during section operation (when the voltage can be increased immediately) or be more severe (when the voltage is reduced to zero and then returned to normal after a few seconds) (
Figure 16b).
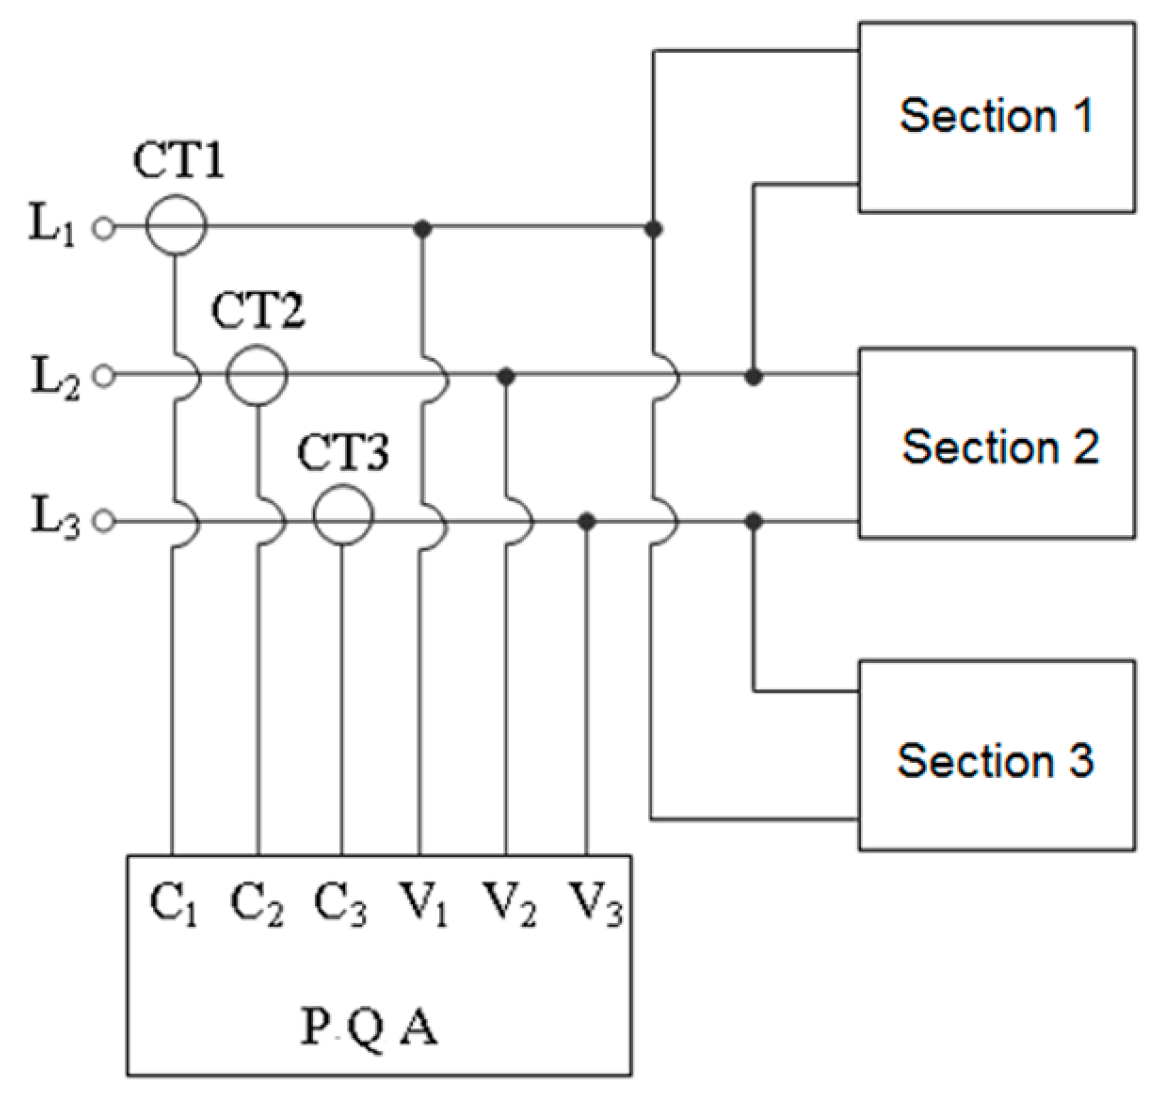
Power sources (high power consumers) supplied at line voltage are employed in ESPs with three sections. To balance the charge of the low-voltage, three-phase network, the three power sources are connected as shown in
Figure 17. A power quality analyzer (PQA; CA 8334 B—Chauvin Arnoux) can be used to measure the electrical properties of the low-voltage section [
28]. This power quality analyzer contains inputs for measuring current transducers (C1, C2, C3; type AmpFlex, max. 3000 A) and voltage probes (V1, V2, V3). PQA has been used to take the measurements in
Figure 18,
Figure 19,
Figure 20,
Figure 21 and
Figure 22.
The waveforms of the phase voltages and currents are shown in
Figure 18, with measurements taken over a period of time at a fixed point using the classical power supply (
Figure 3), adjusting the firing angle of the thyristors (approximately 83°). Due to the mode of operation of the power sources, the voltages approach a sinusoidal shape and the current is heavily distorted (
Figure 3). It is stated that the firing angle of the thyristors varies permanently to ensure voltage management in the ESP section (as in
Figure 16).
Line voltages (RMS values,
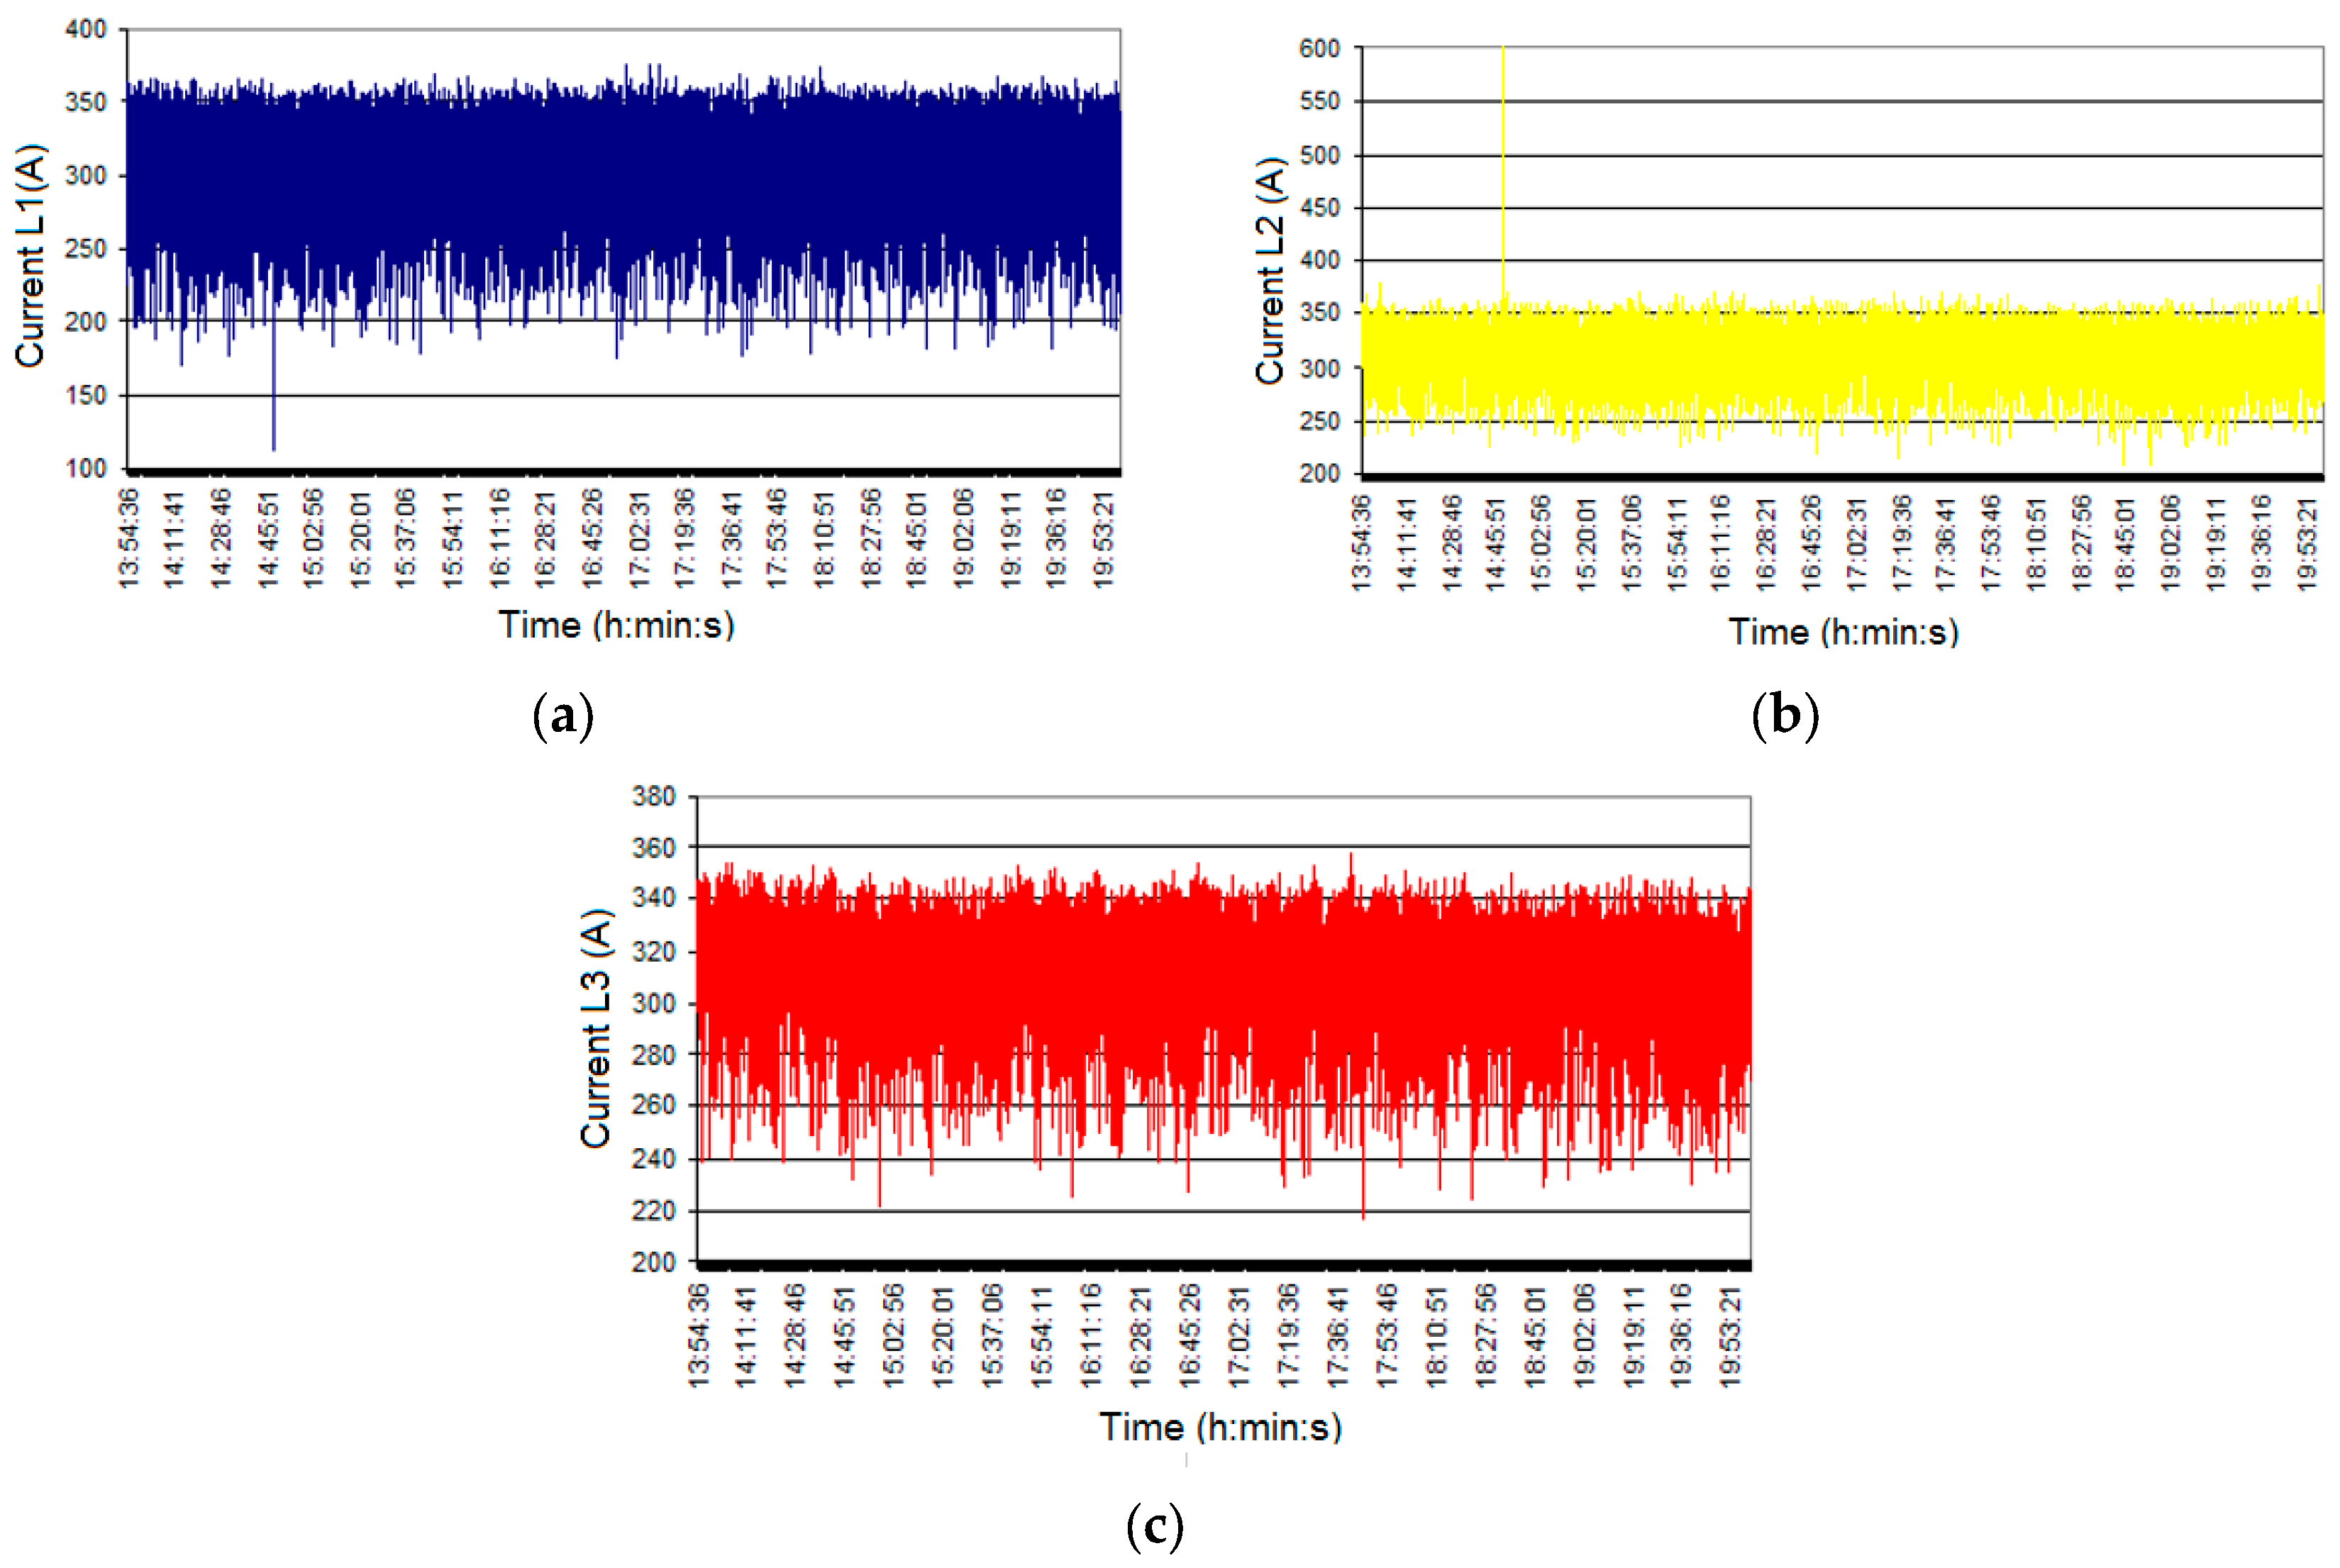
Figure 19) show a similar trend, and the THD is negligible (less than 2.3%). A slight unbalanced load of the three-phase, low-voltage network may be seen from the current measurements (actual values,
Figure 20). Current values range from hundreds of A and are constantly changing. In the case of THD for currents, values between 40–90% are recorded for each phase, indicating the presence of higher harmonics. Because each section has its own operation and control, the THD is always changing. The constant control of the sources guarantees that the voltage level inside the section is as high as possible to produce as many charge carriers as possible. Because of permanent control, the current through the source changes permanently, and a voltage drop occurs at each source depending on the load. Measurements in
Figure 19,
Figure 20,
Figure 21 and
Figure 22 were made with PQA CA 8334B with a sampling period of 1 s.
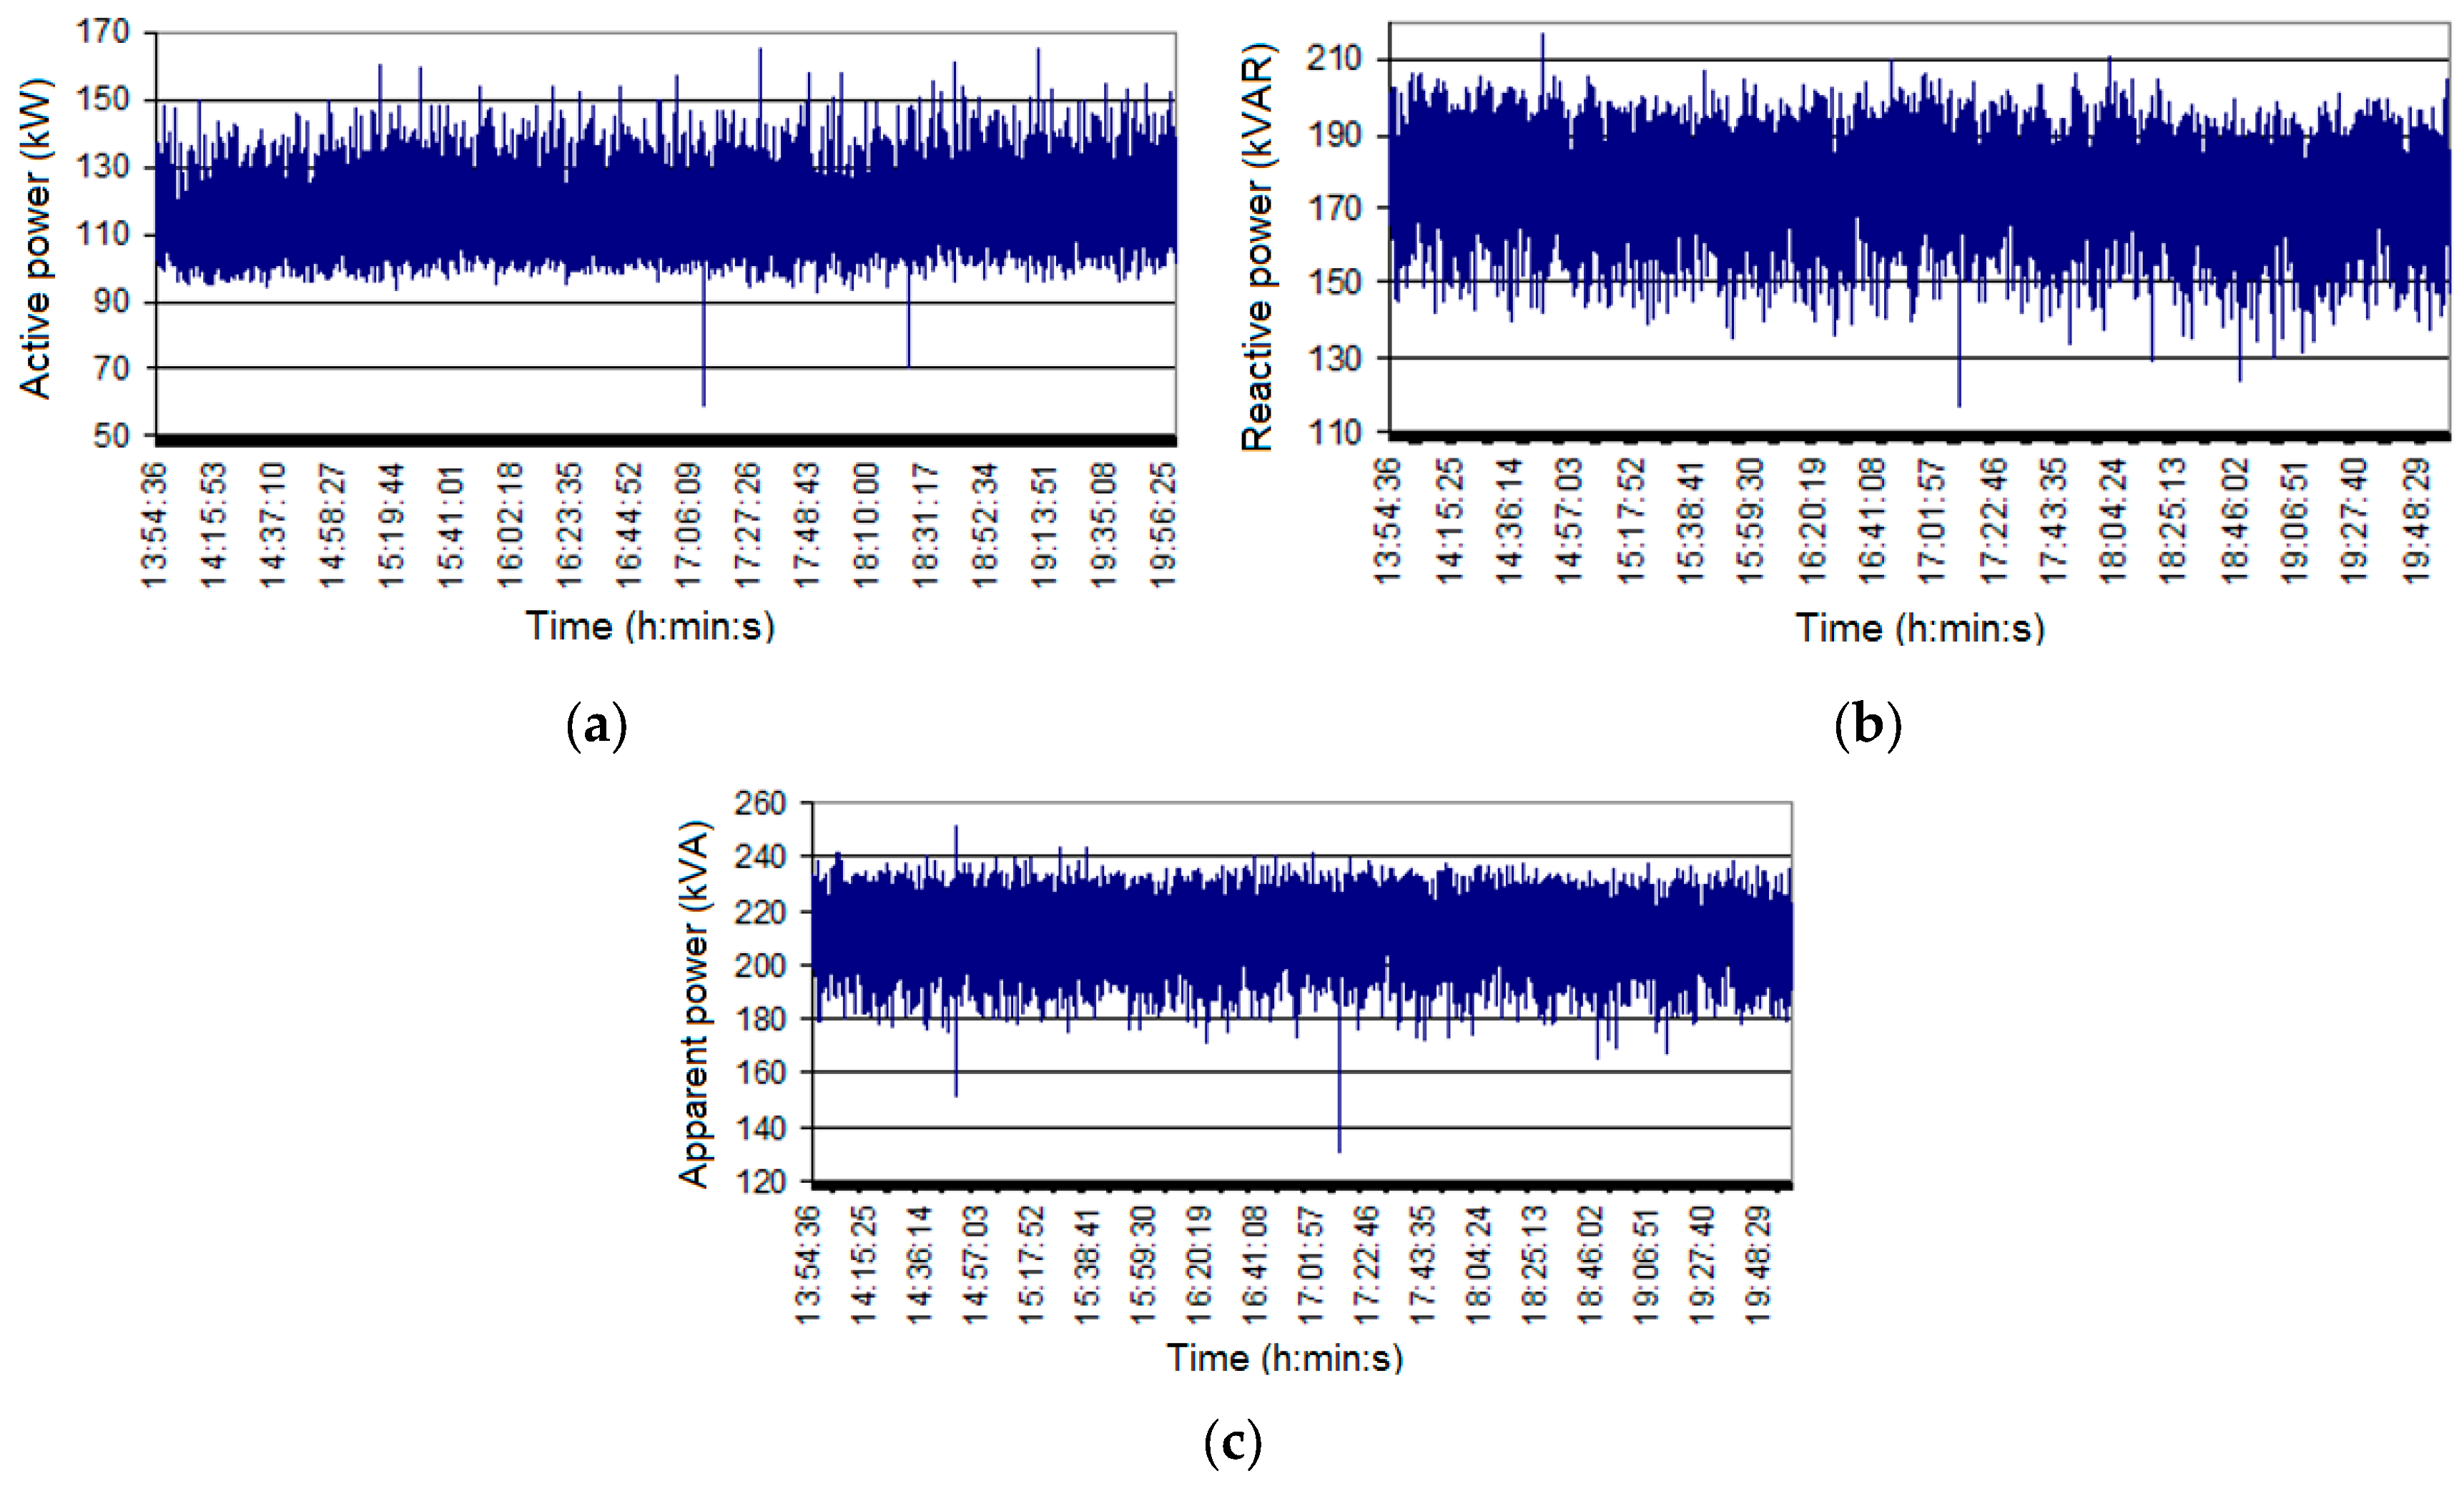
The powers are measured in three phases (total): active (
Figure 21a), reactive (
Figure 21b), and apparent (
Figure 21c). Reactive power (140–200 kVAR) is greater than active power (100–150 kW). The total apparent power ranges from 170 to 235 kVA.
In
Figure 22 are presented the power factor for the fundamental (50 Hz, or displacement power factor) and the real power factor (taking into account the currents and voltage harmonics). The real power factor (0.45–0.7) has higher values than the displacement power factor (0.58–0.8). The different values of the power factors are due to the deformation regimes (currents having the most deformed waveforms,
Figure 18).
The loading of energy groups influences the dust emissions. A light load on the group will result in less dust output. These electrical groups are overburdened, and not all of them are operational (depending on the requirements of the energy system). The reactive power is high (more than the active power), and the power factor is low. It is required to improve the power factor under the conditions of a deforming regime.
Table 16 displays experimental measurements taken at six ESPs with three sections over time and under various operation conditions (e.g., different coals and energizations). The measurements in
Table 16 were made in accordance with VDI 2066 (Particle matter measurement. Dust measurement in flowing gases. Gravimetric determination of dust load). In
Table 16, P
e represents the electrical power of a synchronous generator turbine-driven, q
i represents the dust concentration at the intake (tens of g per m
3), q
f represents the dust concentration at the exit (hundreds of mg per m
3), and Q represents the gas flow from the inlet. The measurements have been classified into groups according to the increasing electric power group [
29,
30,
31,
32].
Following measurements, the collecting efficiency is usually greater than 99% (of course, there are measurement errors) and is determined by the thermal power of the boiler, the type of control, and the concentration of dust at the entrance. The gas flow rate has little effect on the collection efficiency. In
Table 16, the classical power supply refers to the automatic current regulation up to the discharge limit in the sections to maximize the corona effect. Intermittent supplying (up to the 7th order) can result in collection efficiency comparable to a classical supply. The collection efficiency begins to decline after the 9th order (
Table 16), as demonstrated by the simulations. The intermittent supply has lower voltages and currents than the classical supply, resulting in a reduction in electrical energy consumption. When there is a high dust concentration at the entrance, collecting efficiency can decrease by 2–4%. It should be stressed that, in practice, operational conditions are constantly changing, making it impossible to compare simulated and measured outcomes.
ESPs with many sections have been used to filter enormous gas flows (hundreds of thousands of m3/h). Each section is powered by a different source. Usually, there are collecting surfaces in the sections.
The calculations revealed that the discharge voltages are higher on the first sections than on the last. The current densities of the electric sections drop in the second half of the ESP as the intermittency increases. The actual current density-voltage characteristics show about the same values for the corona onset voltages, discharge voltages, and currents for each individual section. All of these simulations, as well as their comparison with measurements on real ESPs, demonstrate that the ESPVI 4.0.W tool can be used to analyze plate-type ESPs. Simulations were run for three levels of intermittency: 3, 5, and 7, which are commonly used in practice. As the degree of intermittency increases (and thus the power used decreases), the currents absorbed by the sections decrease. However, the same behavior is observed for the currents absorbed by each section, with the larger currents in the intermediate and last sections. ESP electrical energy consumption will be reduced as a result of the low current consumption of the intermittent power supply.
Regardless of the voltage supply mode, the voltage at which the corona effect occurs (corona onset voltage) remains roughly within the same limits for each individual section, and the corona onset voltage is higher in Section 1 and lower in Section 3. With the change in the supply voltage waveform, the voltage discharge is no longer constant for each individual section. Section 1 has higher discharge voltages, while Section 3 has lower discharge voltages. For supply voltages (direct current, full-wave rectified voltage), current densities are higher at the input section and lower at the output section.
To improve the efficiency of ESPs, the following technological parameters must be considered: how fuel is crushed, the quality of the fuel, how combustion is carried out in the boilers, the resistivity of the dust and, last but not least, the constructive way of the ESP [
23,
31]. Using low-quality coal with a high ash content increases the amount of dust in combustion emissions. Incomplete combustion is caused by increased fuel moisture.
Inadequate rapping will result in the re-entrainment of dust particles with very small diameters. It is assumed that the dust layer is of the same thickness across the entire collector surface. The re-entrainment of dust particles when the sections are rapping is usually related to the distribution of gas velocities in the ESP cross section and the uniformity of the electric section in the area of the discharge electrodes. The times chosen for rapping the sections are critical factors in decreasing dust particle re-entrainment in the gas flow.
According to the experimental measurements, the apparent power is in the tens of kVA (
Figure 21c), the current is deforming (
Figure 18), and the power factor is small (
Figure 22b). In the case of ESPs, the conventional power sources are two-phase (on the principle of alternating voltage variator,
Figure 3). The maximum voltage on the ESP is higher with intermittent power, the minimum voltage is lower, and because this concept is based on the suppression of current pulses, the RMS and average value of the currents are lower. A three-phase supply can be balanced in terms of current by using ESPs with three sections (each section being supplied with a power source between two phases). Dust resistance is the most essential factor in determining improved dust collection. A decrease in resistivity (by an order of magnitude, for example) results in a 2% improvement in collecting efficiency. Temperature has an effect on dust resistivity, with a maximum in the region of 145–165 °C. Heat exchangers can be utilized entrance of the ESP’s entry to reduce the temperature of the gases and the resistivity of the dust.
The experimental data in
Table 16 have been collected at various ESPs with three sections and at various time points. Various types of coal were used in the studies (which implied that different dust resistivities were determined). This is another (perhaps the most important) cause of the 1–2% disparity between measured and simulated outcomes.
Because of irreversible changes in the properties of the gas during the ESP transition, the amount of dust emitted is not constant; it changes over time and in a wide range. Dust emissions from ESPs depend, from a technological standpoint, on the type of coal, the grinding method (including the number of mills used for mechanization), and the intake (flow rate) of gas brought for combustion.
When upgrading ESPs with three sections, two options must be taken: the first is to add a new section while using the same types of power source as before the upgrade; the second is to replace the power sources with ones that produce pulsed high voltage. While the first option is a traditional solution with large investments (often hundreds of thousands of euros) and a lengthy execution period, the second solution is a less expensive solution that can be deployed quickly and has long-term benefits.


