Abstract
Daylight penetration significantly affects building thermal-daylighting performance, and serve a dual function of permitting sunlight and creating a pleasant indoor environment. More recent attention has focused on the provision of daylight in the rear part of indoor spaces in designing sustainable buildings. Passive Anidolic Daylighting Systems (ADS) are effective tools for daylight collection and redistribution of sunlight towards the back of the room. As affordable and low-maintenance systems, they can provide indoor daylight and alleviate the problem of daylight over-provision near the window and under-provision in the rear part of the room. Much of the current literature on the ADS pays particular attention to visual comfort and rarely to thermal comfort. Therefore, a reasonable compromise between visual and thermal comfort as well as energy consumption becomes the main issue for energy-optimized aperture design in the tropics and subtropics, in cities such as Sydney, Australia. The objective of the current study was to devise a system that could act as a double-performance of shade and reflective tool. The central aim of this paper is to find the optimum curve that can optimize daylight admission without an expensive active tracking system. A combination of in-detail simulation (considering every possible sky condition throughout a year) and multi-objective optimization (considering indoor visual and thermal comfort as well as the view to the outside), which was validated by field measurement, resulted in the optimum ADS for the local dwellings in Sydney, Australia. An approximate 62% increase in Daylight Factor, 5% decrease in yearly average heating load, 17% savings in annual artificial lighting energy, and 30% decrease in Predicted Percentage Dissatisfied (PPD) were achieved through optimizing the ADS curve.
1. Introduction
Nowadays, people spend a considerable amount of time inside buildings, living and working [1], especially after the COVID-19 pandemic, which has made indoor home spaces a working environment [2]. Therefore, it is crucial to provide suitable indoor environment quality by following methodical parameters and design practices concerning thermal and lighting attributes, as well as ventilation and cleanness [1].
Daylight penetration significantly affects building thermal-daylighting performance [3] since daylighting and heat are highly correlated [4]. Daylighting is an invaluable tool that provides a natural, pleasant environment in terms of the quality and source of energy saving in buildings which does not need deteriorating natural resources without energy conversion loss. Therefore, penetration serves a dual function of permitting sunlight and creating a pleasant indoor environment [4,5], which positively affects occupants’ health [6,7]. Fixed shading devices need a complex design for the given site to avoid excessive blocking of daylight which could consequently increase artificial lighting [8].
Almost 20% of global electricity and 40% of annual building energy consumption is consumed for lighting [4]. Daylighting can reduce artificial lighting energy by 50–80% annually [9]. Regarding the global crisis and residential buildings interventions, Campisi et al. (2018) estimated a 73.44% reduction in residential CO2 emission per square meter (kg CO2/m2) after intervention through a multi-criteria analysis [10].
More recent attention has focused on the provision of daylight in the rear part of indoor spaces (i.e., core daylighting) in designing sustainable buildings [6]. Especially during the cooling season, when the sun is high, deep rooms experience uneven daylight distribution that identifies additional artificial lighting which leads to the overuse of electricity [11]. Passive daylighting systems which are affordable and require minimum maintenance can provide indoor daylight and ventilation simultaneously [4] and increase daylight homogeneity. A compound shading–redistributing system can alleviate the problem of daylight over-provision near the window and under-provision in the rear part of the room. However, extending window dimensions can mitigate the illumination problem but activate the glare problem, which often results in close internal shadings and turning lights on [12].
Non-imaging optics including mirrors and light guides are used for solar concentrators in daylighting systems for the purpose of efficient collection and redistribution of the diffuse sunlight [13]. Light pipes and anidolic integrated ceilings are the most frequently used systems in buildings [11]. Anidolic collectors, which are effective for daylight collection and redistribution [13], by redirecting sunlight towards the back of the room by reflecting the sun rays from the ceiling underside [4,14], can increase daylight illuminance level. At the same time, the reflection can cause glare [15]. The Compound Parabolic Concentrator (CPC) has received researchers’ and industry practitioners’ attention [16]. This façade-mounted system is usually oriented toward the equator to harness daylight and pass it to a horizontal mirrored element [17] to distribute more balanced daylight over a wider indoor area [14]. An Anidolic Daylighting System (ADS) comprises an entry and exit aperture and a parabolic reflector in between. “Symmetrizing the parabola, relative to its axis in case of a symmetrical bi-dimensional optical system” makes the optical system complete [13]. As Scartezzini and Courret said, an integrated anidolic device should be integrated into a building façade as an architectural element and be constructed simply [13].
Much of the current literature on the ADS pays particular attention to visual comfort but rarely thermal comfort. Therefore, a reasonable compromise between visual and thermal comfort, as well as energy consumption, becomes the main issue for energy-optimized aperture design in the tropics and subtropics [18].
The application of the ADS in the southern hemisphere improves daylighting performance significantly without any influence on the air temperature [19], since in tropical and subtropical regions, the highest sky luminances are usually within the sky zenithal area [6]. Sydney, NSW, is located in latitudes where natural luminous conditions throughout the year are of high solar radiation. Because of the dominant contribution of the cooling load to energy usage in the Sydney climate, which receives high-intensity solar radiation, studying the effect of the ADS on space cooling is essential.
The objective of the current study is to devise a system device that could act as a double-performance of shade and reflective tool. The central aim of this paper is to find the optimum curve that can optimize daylight admission without an expensive active tracking system. Indoor visual comfort has been overlooked in the Australian residential context to date [2].
2. Literature Review
Rightly installed on a window top part, most daylighting systems have demonstrated a great potential “to capture sunlight under clear and/or intermediate sky conditions and redirect the direct component of daylight toward the room ceiling fraction closer to the window” [13] and be a promising daylighting solution [18]. In an analysis of the impacts of light shelves in office spaces in Toronto, Canada, Berardi and Anaraki (2015) concluded that a constant increase in Window-to-Wall Ratio (WWR) reduces Useful Daylight Illuminance (UDI) of the near window area and increases UDI for the back part of the room [20].
Anidolic systems are one of 16 daylighting systems tested and confirmed in the International Energy Agency (IEA), Task21 [21]. Compared to active daylight systems, stationery passive illumination systems are affordable, easy to install, and architecturally attractive [4]. With the same idea as the light shelf [22], an Anidolic Daylighting System (ADS) uses a perfect non-imaging [23] parabolic mirror using a white or reflective metal [4] and acts as a solar concentrator [13]. As a good option for tropical regions [6,19,23,24,25], the ADS captures light flux and then distributes the diffuse component of daylight [23] over a wider indoor area and “creates a more balanced daylight distribution throughout the space” [14] as a universal passive solution to improve deep indoor spaces’ daylight illuminance and energy efficiency [11,12,22,24,25,26]; it brought occupants’ high satisfaction with the lighting environment [6] and “confirmed the superior services” [13].
Notably, the ADS is an effective solution when there is some external obstruction in daylight admission [24]. Kontadakis et al. (2017) considered this system as an easily mounted and various shape daylight-controlling system for side-lit spaces [27]. The ADS can enhance indoor visual comfort under a high luminous sky by providing a congenial luminous environment, keeping a more homogeneous daylight distribution, and reducing discomfort glare probability [28]. The ADS does not provide indoors with excessive indirect sunlight, which causes glare and overheating under a sunny sky [11], while an integrated ADS can improve indoor luminous performance by a higher Daylight Factor (DF) and work plan illuminances (at the rear part of the room) and improve Daylight Autonomy (DA), not at the expense of visual comfort [13]. Anidolic shelves used in urban districts can increase DF compared to conventional double glazing, even up to 1.7 times in the deeper parts of the room; this increase was the value of the reference case [13,27].
Garcia-Fernandez and Omar (2023) discussed the light-related energy efficiency of a public library. They suggested three solutions, including an anidolic lighting system composed of a truncated and double compound parabolic collector. They attempted to simulate integrated solar systems (PV), nanomaterial, and anidolic lighting systems to capture sunlight optimizing energy consumption in a public library in Alexandria, Egypt [1]. Saadi et al. (2022) analyzed passive daylighting using Anidolic Integrated Ceiling (AIC), enhancing interior luminance and energy saving in offices located in a hot, arid climate. They reported a 2–4% increase in Daylight Factor, 88% saving in lighting electricity, and 67% lighting satisfaction [11]. Wittkopf et al. (2006) simulated AIC and achieved 21% and 26% savings in building energy for Singapore and Sheffield, respectively, as well as more than 20% savings in lighting energy [12]. Daylight collection, transportation, and distribution are the main components of such systems [11]. Scartezzini and Courret (2002) examined three anidolic systems in a 6.55 m deep-plan room and concluded that Daylight Autonomy was improved without sacrificing indoor comfort [13]. Roshan et al. (2013) investigated the performance of AIC with respect to office orientation and reported a high potential daylight performance in deep rooms in Malaysia [23]. Using EnergyPlus and RADIANCE simulations, Binarti and Satwiko (2018) examined the anidolic system effect on energy savings in the tropics offices and found DF ≥ 3%, horizontal distribution of 51–70%, and higher solar heat gains (44–437%). Their experiment showed the best performance for a 1 m-wide collector with an entry aperture of 90° [18]. The same researchers conducted a study on a residential building using a stainless-steel reflector covered with clear glass [24]. By using a questionnaire survey, a quantitative study was performed by Daich et al. (2017) for an office room in Biskra, Algeria, and reported 64.51% participants’ satisfaction with daylighting [28]. Linhart and Scartezzini (2010) evaluated the effect of an ADS on the south-oriented windows of an office in Lausanne, Switzerland, which decreased lighting power density by up to 40% without a noticeable impact on visual comfort [6].
A well-designed anidolic system minimizes the number of light rays’ reflections, as well as attaining high angular selectivity. It also needs to collect diffuse light rays from sharp angular selectivity in order to alleviate glare probability [13,29]. Onubogu et al. (2021) stated that improper design of a passive daylighting system could lead to glare from reflected sunlight from home appliances’ surfaces such as television screens, computer screens, refrigerators, etc. [4,30].
Using RADIANCE, Ochoa and Capeluto (2006) simulated deep-plan side-lit office spaces in highly luminous climates. They concluded that an anidolic system promises to enhance illuminance levels for all orientations (1.5–2 times higher), while requiring elaborate design due to the possibility of undesired glare [15].
Gordon and Rabl (1992) decreased the system width by 48% to integrate well with the building envelope [31]. Experiments have shown that the ideal angle is between −37° and +10° relative to the horizontal line for the reflected (exiting) light rays [13,32]. Using the PHOTOPIA software package and forward raytracing, Wittkopf et al. (2010) quantified and optimized the performance of an ADS. They introduced 2D flux, angular spread, and horizontal offset as new photometric measures to assess the performance and reported that parabolic reflectors could capture more light the larger openings they had. Moreover, such collectors keep the diffuse character of the incident sunlight [33]. Figure 1 summarizes similar research on using ADS in different spaces.
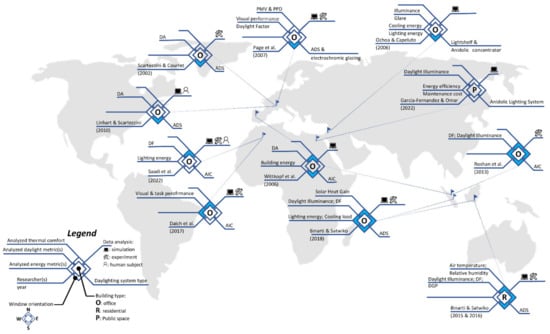
Figure 1.
Previous research on ADS.
Together, the mentioned studies provide important insights into utilizing ADS to enhance indoor daylight illuminance. However, there are certain drawbacks associated with the use of ADS; optimizing the amount of admitted sunlight can moderate indoor comfort and energy usage. Almost every paper written on the ADS assumed a predefined reflector section and the climate-based mathematical curve optimization has not been performed yet.
What we know about employing an ADS is largely based upon empirical studies that investigate how this system improves indoor daylighting, especially for offices in climates other than Australia. Besides the shading effect of the ADS, its blocking view has also not been analyzed. The generalizability of much published research on applying the ADS on the north-oriented windows in Australian dwellings is problematic since the suggested reflective surfaces are not necessarily suitable for the local Australian climate conditions and construction. A combination of in-detail simulation (considering every possible sky condition throughout a year), multi-objective optimization, and experimental validation could result in the optimum daylighting system for the local conditions.
3. Methodology
In this study, all the parametric modeling was generated by Rhinoceros 3D [34], a computer graphics and computer-aided design application, and an algorithmic modeling plugin Grasshopper [35] used to develop parametric models. To simulate the building daylight and energy performance, the most advanced and widely accepted plugin ClimateStudio, developed by Solemma®, was used as the climate-based daylight modeling (CBDM) [36] tool using the EnergyPlus engine for energy-related simulation and a modified progressive path-tracing RADIANCE engine for daylight simulation [3,36,37]. Evaluation and simulation of the virtual model’s luminous performance were performed using the raytracing method of RADIANCE, a four-component dynamic climate-based model that analyses daylighting through raytracing calculation [38]. The thermal performance and energy-related parameters analysis, i.e., lighting, heating, cooling and Predicted Percentage Dissatisfied (PPD), was conducted by EnergyPlus™ engine Ver-22.1.0, developed by the U.S. Department of Energy [39]. Having a realistic and sophisticated simulation, a fine-detailed model was set in for four natural daylight components: direct sunlight, indirect sunlight, direct skylight, and indirect skylight, which RADIANCE takes into the calculation. To overcome the problem of realistic simulation of intense daylight on curved surfaces under diffuse skies [18,22,40], the authors modeled the surface in an array of narrow 10 mm-width segments.
A single dwelling space of 7.00 m × 6.00 m × 3.00 m with a typical north-facing window was chosen as the case room (Figure 2) in Sydney (33°51′ S, 151°12′ E), NSW (south-eastern part of Australia), in a temperate climate. To perform a vigorous analysis and generalize the results, the authors conducted a detailed study on local construction and climate conditions. Only the north-facing façade (the dominant orientation in the southern hemisphere) is exposed to the sunlight, and a window-to-wall ratio (WWR) of 14% was assumed since it is the typical local WWR [3]. The window-to-floor ratio (WFR) is 10% as utilizing ADS In hot climates requires WFR ≤ 10% [18,19]. Despite the local inclination of wider windows, a WWR of greater than 35% is never profitable in terms of daylighting quality [20]. As Ochoa and Capeluto advised, in side-lit rooms with one window located in high solar radiation climates, the depth of the room should not be beyond 7 m, even when using daylighting devices [15]. Binarti and Satwiko have demonstrated that the application of ADS rooms wider than 6 m necessitates more extensive fenestration that probably increases the solar heat gain [18]. The areas farther from the window are more subordinated to reflected light from the surfaces around. Although the reflectance factor of indoor surfaces and furniture is low, the rear part of the room looks dim [12].
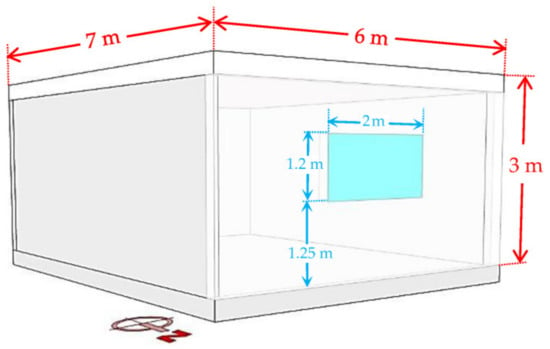
Figure 2.
The case room and window dimensions.
Regarding local mean temperature, cloud cover, solar radiation, etc., the data were gathered from the Australian Government Bureau of Meteorology database. The applied construction detail, material properties, and climate data are shown in Table 1.

Table 1.
Construction, material, thermal, and lighting setting of the room. Material properties data were obtained from ASHRAE HOF 2005, Commonwealth Scientific and Industrial Research Organisation (CSIRO), Australian Fenestration Rating Council (AFRC), and Australian National Construction Code (NCC).
A network of 1.0 m × 1.0 m on the floor and working plane level were assumed to assess daylight metrics both in the computer model and real case room. The internal design loads and lighting of the zone, as well as the operating schedule, are shown in Table 2. Figure 3 demonstrates the research block diagram.

Table 2.
Parameters in EnergyPlus engine simulation.
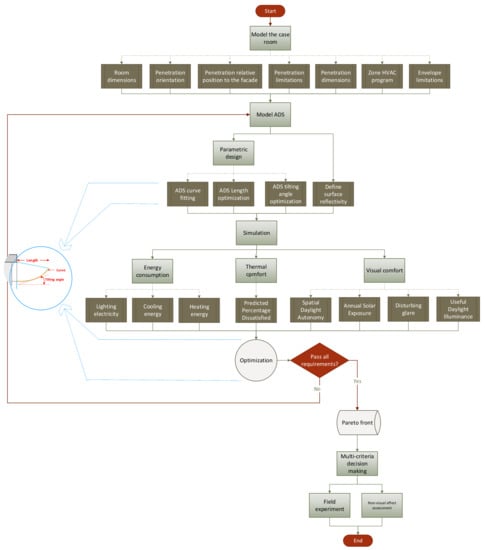
Figure 3.
The block diagram for the current study.
In the present study, the ADS was modeled according to the Sydney local daylight climate using a reference model developed by Wittkopf et al. (2010) [33]. The material for AIC systems has the properties of up to 99% reflectance [11]. The interior surfaces (i.e., ceiling, floor, walls) were presumed to diffuse sunlight across the room [12]. As Scartezzini and Courret suggested, the reflector’s inner surface was covered with very reflective optical material of 0.5 mm anodized aluminum foil (ρr = 0.9) typically used for luminaires [13], while the outer surface was covered with non-reflective rendering paint (Table 3). Moderating the thermal performance of the system, lowE double glazing covered the entry aperture (Figure 4a). The base structure for supporting optic components is low-conductive material that avoids creating a thermal break. The ADS components were built of plywood [23]. Since the ceiling plays an essential role in reflecting diffused light from the ADS downward, the ceiling paint was SW 7757High Reflective White by Sherwin-Williams™.

Table 3.
Optical properties of the space and ADS elements.
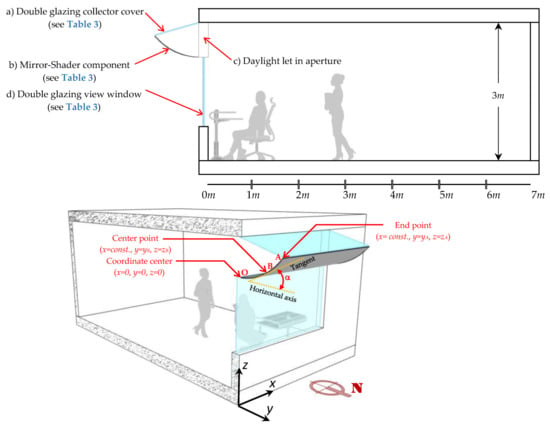
Figure 4.
ADS components, elements, and parameters to be optimized.
Initially, solar radiation comes to a flat double-glazing cover with an anti-reflective surface (see Table 3), then sunlight falls upon a reflective surface with a reflective specular surface and finally enters the indoor space. In the numerical simulation, for each configuration gradual values of ±1 mm for the coordination of A and B points (Figure 4) to the reference value and regarding the tilt angle of the reflector (α) (Figure 4), an increment of ±1′ were considered.
During the standard working time (8 a.m. to 6 p.m.), Sydney experiences an average of 38.3% cloud coverage a year, which means that during working time, 61.7% of the sky is not covered by clouds or obscured (Figure 5). However, the ADS is useful “to improve daylighting performance of wide rooms in temperate climates under overcast sky conditions.” [24] Hence, to comply with a realistic design using RADIANCE, which uses the backward optical raytracing method that includes all four sky luminance models, i.e., clear, intermediate, overcast, and uniform [18], the authors conducted a tridimensional simulation.

Figure 5.
Yearly total cloud cover (10th) for Sydney, NSW. Analyzed and illustrated by the Ladybug tool based on a weather data file containing weather data that are used for running energy-usage simulations in the standard EnergyPlus format.
Among the variety of methods used to optimize multi-objective problems, Non-dominated Sorting Particle Swarm Optimization (NSPSO), which is a modified PSO that offers high-speed convergence [41] and relative simplicity [42], enhances the effectiveness of non-domination comparisons [43]. NSPSO is “fast, more reliable, and often converging to the true Pareto-optimal front … effective in providing an appropriate selection pressure to propel the swarm population towards the Pareto-optimal front” [43] which is sufficiently accurate [44]. NSPSO is very competitive with existing evolutionary algorithms such as NSGA-II and SPEA [41,43], as it associates the advantages of MOGA (Multi-Objective Genetic Algorithm) and NSGA-II (Non-dominated Sorting Genetic Algorithm) [44]. In this research, the optimization engine Opossum3.0.2 developed by Worthmann et al. at the University of Stuttgart was used to conduct the optimization process.
3.1. Employed Formulae and Metrics
3.1.1. Spatial Daylight Autonomy (sDA)
According to the Illuminating Engineering Society (IES), sDA is a daylight metric assessing daylight access annually. This measure specifies that the occupied area fraction exceeds the target of 300(Lux) for at least 50% of annual occupied hours [45]. sDA is a universal metric approved in LEED-v4 and IES-Lighting Measurement-83 standard [46] and methodically formulated as [47]:
where for a given point i;
- pi is the j-th sensor node on a horizontal plane;
- ti is the i-th working hour;
- xi,j is a binary function “to account for a double summation over both the temporal and spatial domains being these metrics defined as a spatial average.” [47];
- τ denotes the transitory fraction threshold; and
- ty is the annual date-time count [48].
According to LEED-Ver.4.1, an sDA greater than 75% receives 3 credits [49].
3.1.2. Annual Solar Exposure (ASE)
According to IES, Annual Solar Exposure (ASE) quantifies the fraction of the horizontal work plane that exceeds 1000(Lux) for more than 250(h) yearly which results in overlighting and excessive solar heat gain. This metric assesses the area over a working schedule with all operable shading devices retracted. ASE was designed to complement sDA which demonstrates high glare risk [45]. ASE is expressed as:
where xi at point i describes the incident number exceeding the ASE illuminance threshold (1000(Lux)), and Ti is the annual absolute hour threshold [3,48].
3.1.3. Daylight Glare Probability (DGP)—Disturbing Glare
DGP evaluates indoor glare possibility. Whereas other glare indexes assess the subjects’ perception of glare, DGP expresses a probability that could result in occupants being disturbed by the glare [50]. DGP is formulated as [2,50,51]:
where EV is vertical eye illuminance(Lux);
- Ls,i is the luminance of i-th window(cd/m2);
- ωs,i is the solid angle (angular size of the window seen) of the i-th window(sr);
- Pi is the position index of the i-th window.
DGP is divided into four bands: imperceptible, perceptible, disturbing, and intolerable glare when its value is less than 34%, 34–38%, 38–45%, and greater than 45%, respectively. In this study, the authors analyzed glare probability for both seated and standing positions and considered the “disturbing” band in the optimization process.
3.1.4. Useful Daylight Illuminance (UDI)
As a modification to Daylight Autonomy, Useful Daylight Illuminance (UDI) developed by Nabil and Mardaljevic (2005) attempts to separate too bright situations that might result in visual discomfort. Opposed to the Daylight Factor, “UDI is founded on an annual time series of absolute values for illuminance predicted under realistic skies generated from standard meteorological datasets.” [52].
The daylight availability metric of UDI divided hourly time into three main categories of failing for illuminance of 0–100(Lux); useful oracceptable for illuminance of 100–2000(Lux), which (100–300(Lux): supplementary may need additional artificial lighting; 300–3000[Lux]: autonomous), and excessive, for illuminance of greater than 3000(Lux), respectively [53,54]. In this study, the “useful” range was considered in the optimization.
The formula used for calculating UDI is as follows [47]:
where xi is a binary function;
- ti is the i-th working hour; and
- Eavg is the mean illuminance.
3.1.5. Daylight Factor (DF)
Daylight Factor (DF) is a static model that shows the ratio of the indoor received light level to the simultaneous light level outdoor [18] received from the sky as a percentage, and was introduced by Trotter in 1911. This metric counts out direct sunlight. Ayoub (2019) mentioned that this model has undoubtedly been used since 1911 hereafter [38]. According to the Chartered Institution of Building Services Engineers (CIBSE) Daylighting and Window Design, other than early morning, late afternoon, or on heavily overcast days, an average Daylight Factor equal to or greater than 5% will ensure that indoor spaces are very daylit [8]. An average Daylight Factor below 2% results in the interior looking gloomy (for work including reading and writing), so to perform some tasks, frequent use of artificial lighting is expected [8,18]. The average DF is directly proportional to window dimension and other properties (Equation (1)) [8,47].
where DF is the average Daylight Factor;
- θ is the vertical angle delimited by the visible sky from the center of the window;
- T is the diffuse transmittance of the glazing material. For clear single glazing windows, T ≈ 0.8;
- Aw is the effective area of a window. In this paper, window bars are ignored;
- R is the area-weighted average reflectance. For light walls and floor cavity, R ≈ 0.6 [8];
- M is the maintenance factor. As the case window in this project is a vertical window located in a suburban area and subjected to heavy rains, M ≈ 0.98 [8].
Generally, the average Daylight Factor suggests a measure of light level altogether inside a room that emphasizes the importance of light distribution. Although the overall average Daylight Factor around the room is greater than the lower threshold, areas may seem dull in cases not receiving direct skylight or areas too far from the fenestrations [8].
Since the room is designed to perform tasks, the target illuminance is considered to be 500(Lux).
3.1.6. Predicted Percentage Dissatisfied (PPD)
According to BREEAM, Predicted Percentage Dissatisfied (PPD) is a quantitative prediction indicator that evaluates an indoor space in terms of the percentage of occupants finding the interior thermal conditions dissatisfactory (i.e., feeling too warm or too cold) [55,56]. It is dissimilar to PMV (Predicted Mean Vote), which shows occupants’ thermal sensation, while PPD demonstrates the fulfilled purpose degree of thermal comfort. According to ASHRAE 55, PPD is required to be kept below 20%.
3.1.7. Electric Power Consumption
The formula used to calculate electricity is the simple formula suggested by Hong et al. (2021) [57].
where ET is the total energy consumption;
- Qc, Qh, and Ql are cooling, heating, and lighting energy consumption, respectively; and
- COPc and COPh, are the coefficients of performance of the standard facility, respectively.
3.1.8. Reflective Surface Optimizing ADS Geometry (Curve Fitting) Formula
The collector curvature ensures that direct sunrays will be captured (from lowest to highest altitude) [58]. The reflector surface shape is defined by a parabola (which could be found in diverse natural forms [59]) through edge ray principles and “can de designed by the mapping of edge rays from the source to the edge of the target” [60]. In this research, we followed the Type 1 section that was proposed by Tian et al. (2018), namely, a single-curve truncated parabolic surface [16].
Since the reflector curve was defined by three points (O, A, and B, as shown in Figure 4) and the ADS uses a parabolic mirror [4], the authors assumed a parabolic nominal function to optimize the fitting curve. The computational formula adopted for the ADS optic performance, when the sunlight rays reach the ADS vertically, is assumed in the simulation as follows [61]:
where r is the surface reflectance (reflection coefficient);
- ns is the reflective index of the inner surface of the ADS curve; and
- ng is the medium which the daylight comes from. In this study, the authors assumed ng = 1 since the sunlight beams come from the air.
The optical parameters calculations followed the formulae below:
where α is the absorbance, K is the extinction coefficient, and L is the thickness.
where τ is the transmittance.
where ρ is the surface reflectance. The results of the calculations are shown in Table 3.
Apart from the optical properties of surfaces, the mathematical formula was coded in the simulation and the optimization process was a nonlinear function, a standard exponential decay curve, as follows:
where y(t) is the response at time t, with φ and λ the parameters to fit. To achieve the fitting curve requires finding values of φ and λ that minimize the sum of squared errors (the objective function):
where the times are ti and the responses are yi,i [62].
Since the ADS collector component comprises a truncated parabola, the curvature formula used for the truncated parabolic collector is [63]:
where θi is the i-th ray incident angle.
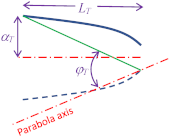
Finally, after properties and curve optimization, the authors evaluated the system efficiency for each Pareto front solution. The transmission efficiency of a daylight system is formulated as [1,58]:
where ηcollector is the collector efficiency and φi and φo are the flux received by the collector and the reflected flux, respectively. In this study, we measured the flux on the top flat glazing (see Figure 4d) and daylight let-in aperture (see Figure 4c) to calculate the efficiency. After finding the optimum configuration for the daylight system, the authors measured the system efficiency for the morning, midday, and late afternoon yearlong.
3.2. Multi-Objective Optimization
A variety of methods are used to optimize objective functions. Multi-objective optimization has been extensively employed in Multiple-Criteria Decision-Making (MCDM) to meet several involving objectives concurrently, which are usually competing. The answer range defines the best tradeoff between conflicting objectives in which the dominance of a solution determines its rightness [64].
where F(X) = fk(x) is the objective function vector, x is the decision variable vector, gi(x) and hm(x) are the inequality constraints, and p is the number of equality constraints [57]. X = [x1, x2, …, xn] is an n-dimensional decision variable, where xi changes in the range of its maximum and minimum (if it exists) [41]. F(X) = fk(x) consists of eight objective functions satisfying six inequality constraints and p equality constraints, while Y is the set of alternatives eligible [10,41]. The objective functions of this study are shown in Table 4.

Table 4.
The visual, thermal, and energy metrics to be optimized.
It is worth noting that the authors considered no threshold for the energy consumption-related metrics, a minimum for sDA, a maximum for ASE, a maximum for DGP, a maximum for PPD, and both minimum and maximum thresholds (gi(x)) for UDI.
The pseudocode of the multi-objective optimization algorithm is as follows [65]:
Initializing swarm positions and velocities randomly.
| for i ∈ [1−N] which N is the number of population size: | ||||
| X0(i,j)=round(LB(j)+rand()*(UB(j)-LB(j))) which LB, and UB are the lower and upper bounds; | ||||
| end | ||||
| for iteration from 1 to M which M is the maximum number of iterations: | ||||
| for each i∈[N,1]: | ||||
| for each j∈[V,1] which V is the number of variables: | ||||
| update velocity of swarm by | ||||
| update swarm positions by | ||||
| Amend the | ||||
| end | ||||
| evaluate the fitness of swarm | ||||
| end | ||||
| update global best | ||||
| end | ||||
| end | ||||
4. Results and Discussion
The optimized curve of the ADS for the Sydney dwelling is illustrated in Figure 6. A detailed comparison of the case room without an ADS with an optimized ADS-installed room is drawn in this section.
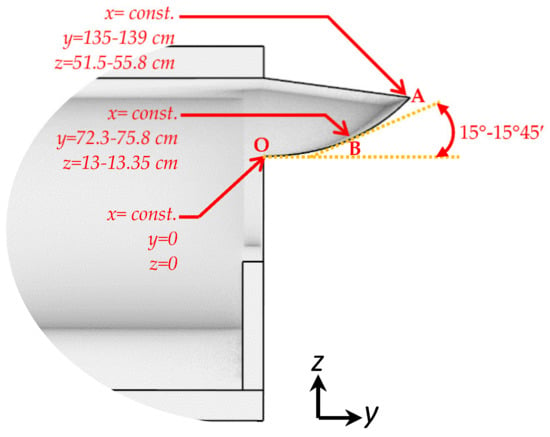
Figure 6.
The optimum range curve for the reflector of the ADS.
4.1. Visual Comfort
Respecting daylight sufficiency, in the reference room without the ADS, 23.81% of the room area receives acceptable DF, while after installing the ADS, this area increases by 61.90% (Figure 7a). On average, utilizing the ADS increases average DF from 1.92% to 2.93% for the reference room and ADS installed, respectively. As shown in Figure 7, without the ADS, the DF is less than 2% for the distance over 2.3 m from the window (Figure 7b), which is not sufficient for performing tasks without the aid of additional electric lighting. For the room equipped with the ADS, the area farther than 5 m from the window shows below threshold DF (Figure 7c).
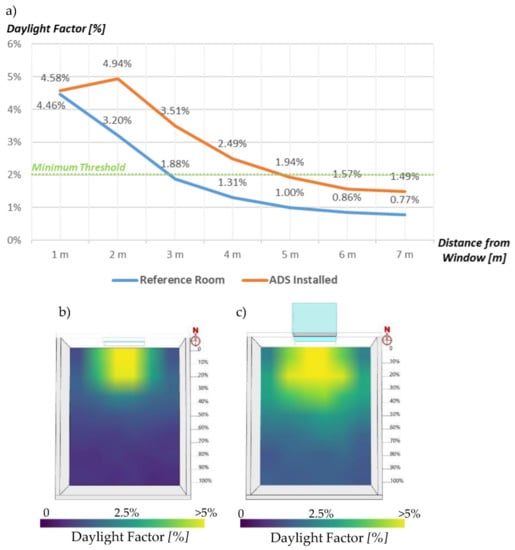
Figure 7.
The effect of the ADS on Daylight Factor: (a) Comparison; (b) Annual DF for the reference room; and (c) Annual DF for the ADS-installed room.
Concerning daylight glare, as Figure 8 shows, there is a negative correlation between installing ADS and disturbing glare (when DGP > 38%). An increase of 3.73% in average disturbing glare (around the room) was a negative effect of the ADS which makes disturbing glare worse for almost all points within the room. Some vertical fins that can alleviate the glare probability [2] without sacrificing daylight illuminance could be helpful.
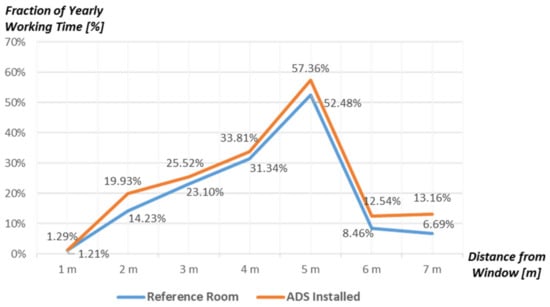
Figure 8.
The effect of the ADS on annual disturbing glare (when DGP > 38%) based on a yearly fraction of time.
To discover the overall impact of installing an ADS on the window, the authors performed a yearly measurement of glare probability by HDR camera, false-color imaging, and human subjects’ assessment (Figure 9). This field measurement was conducted for each hour of the year (Figure 10).
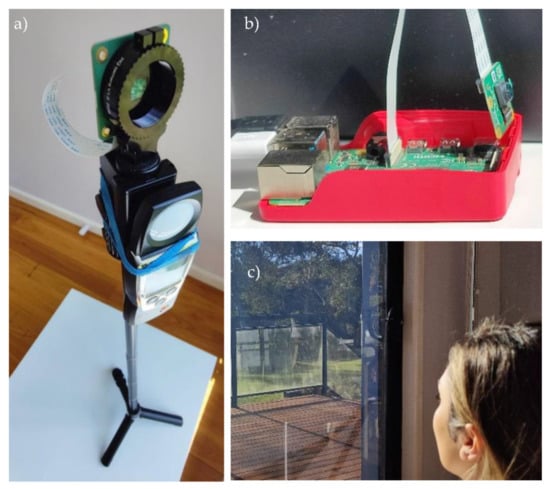
Figure 9.
DGP field measurement: (a) HDR camera; (b) False-color imaging; and (c) Human subjects’ assessment.
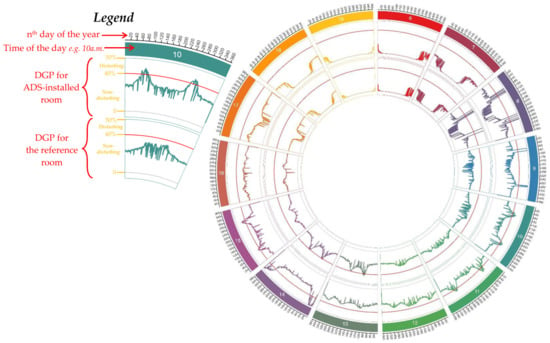
Figure 10.
A yearly measurement and comparison between the reference room and ADS-installed daylight glare probability on an hourly basis.
In relation to sunlight exposure, overall, applying an ADS did not affect overheating positively since an annual 4.76% increase in ASE (fraction of room area) was observed. A calculated 12.61% of total yearly hours room was overheated and was a consequence of utilizing an ADS. Since the ADS diffused sunlight towards the back of the room, the overheating (overlighting) of the first 31% of the room is mitigated while this problem is raised in the mid-area of the room.
Due to the close correlation between daylighting and heat, admitting sunlight during the summertime in the subtropical climate of Sydney increases air-conditioning energy demand [4]. The room without an ADS undergoes overheating between 18.5–30% of the room depth from the window, but as ADS distributes sunlight deeper in the room, the overheating-prone area extends to 28–32% of the room depth from the window (Figure 11).
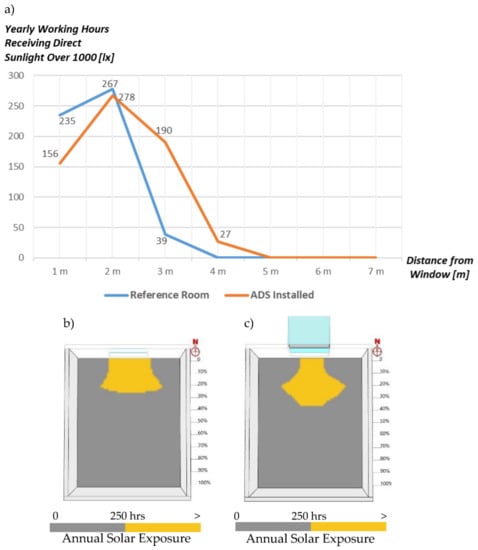
Figure 11.
The effect of the ADS on ASE: (a) Comparison; (b) Reference room; and (c) ADS-installed room.
The shading effect of an ADS can moderate daylight illuminance. Interestingly, there were also differences in UDI. Utilizing an ADS increases mean acceptable daylight by 2.45% and increases excessive daylight by 9.13% relative to all yearly hours. This analysis also confirms ADS results (Figure 12). The supplementary daylight which requires artificial lighting also decreases by 5.07% of yearly hours. Under clear sky conditions, except for April and September, the daylight illuminance increases due to receiving more indirect daylight.
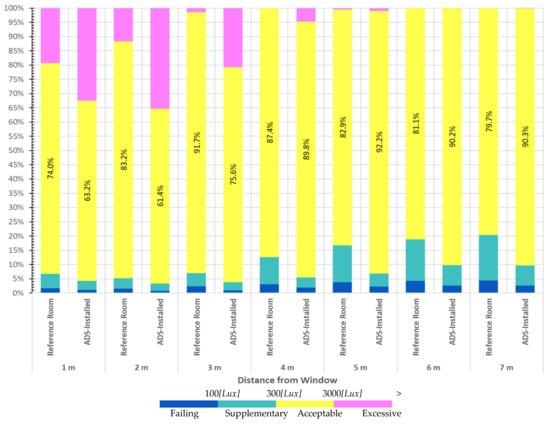
Figure 12.
Yearly UDI analysis.
During summertime, a yearly average of 19%, 29%, 9%, 32%, and 22% increase in daylight illuminance for early morning, morning, noon, afternoon, and late afternoon, respectively, was the consequence of using an ADS. For wintertime, no change for early morning and late afternoon was observed, while there was a yearly average decrease of 3% and increases of 20% and 23% for morning, noon, and afternoon, respectively (Figure 13).
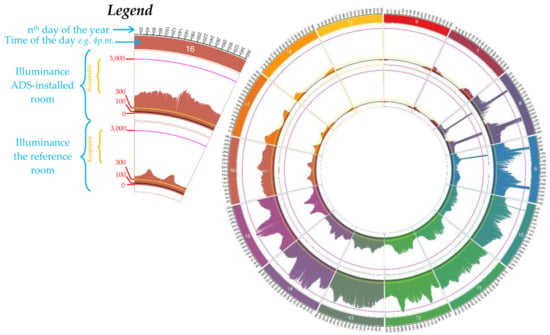
Figure 13.
A yearly measurement and comparison between the reference room and ADS-installed daylight illuminance on an hourly basis.
4.2. System Efficiency
Using Equation (14), the authors calculated the system efficiency for different sky conditions and different times of the year. For overcast conditions, no marked efficiency was achieved since the total amount of incident useful sunlight is not considerable. Under other sky conditions, the highest efficiency was measured for the midday time, followed by early morning (Figure 14). In addition to the efficiency, a detailed comparison for the critical times of year was performed showing the ADS effectiveness (Figure 15).
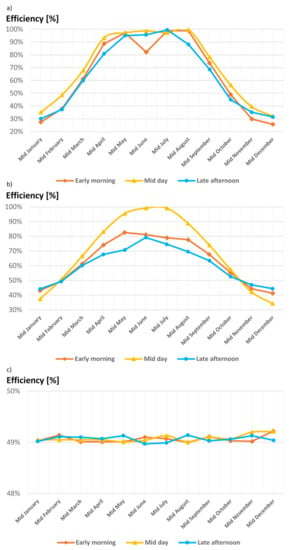
Figure 14.
The efficiency of the daylight system for different times of the day during a year under different sky conditions: (a) CIE clear sky; (b) CIE intermediate sky; and (c) CIE overcast sky.
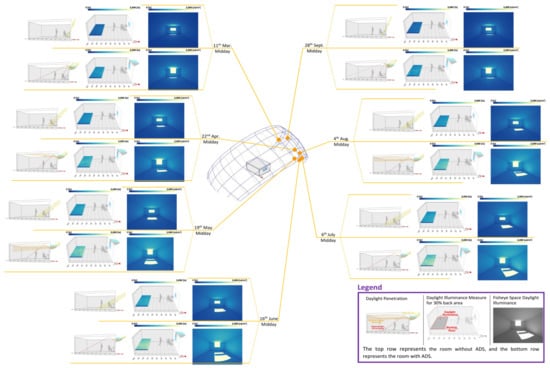
Figure 15.
A careful comparison of the ADS’ effectiveness in diffusing sunlight towards the back of the room.
4.3. Radiation
Using an ADS increased the ceiling yearly indirect solar exposure by 71.42%. The indirect radiation on the unpenetrated walls also increased, by 75.77%, 80.17%, and 66.30% for the eastern, western, and opposite (southern) walls, respectively. No significant change was observed for the eastern wall. Due to the shading effect of the ADS on the window surface, a decrease of 61.56% in radiation was measured on the window surface (Figure 16) since it decreases the heat entering the room through the window [4].
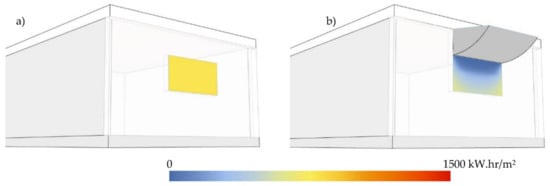
Figure 16.
Yearly direct sunlight exposure for the window: (a) Reference room and (b) ADS-installed room.
4.4. Energy Consumption and Thermal Comfort
Assessing energy consumption for lighting, heating, and cooling, the Energy Use Intensity (EUI) represents annual energy use per square meter and was calculated for the case room with and without the ADS. An average of 4.94% in yearly average heating demand demonstrates that redirecting sunlight deep into the room can increase ambient thermal comfort during the heating season. An 8.47% increase in the annual average cooling demand shows the overheating probability of utilizing an ADS, assuming that the savings in the lighting electricity well compensate for cooling-related energy usage (Figure 17). Regarding indoor spatial thermal comfort, adding an ADS on the window changes the PPD from 21.81% to 15.59%.
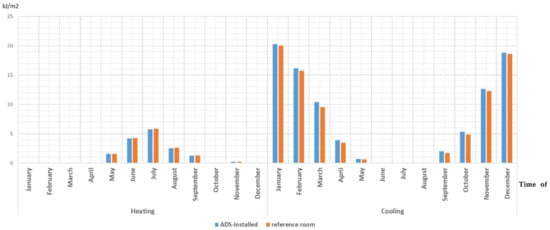
Figure 17.
Comparison of yearly heating and cooling load for the reference room and the room equipped with an ADS.
Since the primary purpose of employing an ADS is daylighting, an in-depth hourly basis analysis of lighting electricity was conducted for each hour of the year (Figure 18). The results show that a saving of 17.4% in lighting energy was achieved by using an ADS.
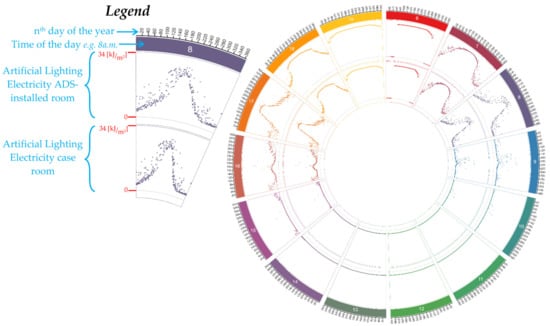
Figure 18.
A yearly measurement and comparison between the reference room and ADS-installed lighting electricity consumption on an hourly basis.
4.5. View to the Outside
With regard to visual connection to the outside, due to the installation point which is on the head edge of the window, the ADS does not interrupt the view greatly. Analysis has shown that 5.2% of the view area is blocked by the ADS underside, while there was an 18.33% and 37.40% decrease in mean EN17037-View Level and Distance View Level, respectively (Figure 19).
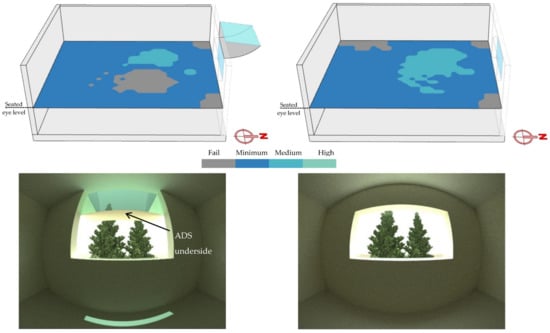
Figure 19.
Mean EN17037-View Level (top) and comparison of view to the outside with and without the ADS (bottom).
4.6. Non-Visual Effect of Admitted Daylight
Through spectral raytracing by ALFA (Adaptive Lighting for Alertness) version 0.6.0.0 developed by Solemma® adopting RADIANCE lighting engine [66], the authors studied the amount of light absorbed by humans’ non-visual photoreceptors (photosensitive retinal ganglion cells, or ipRCGs). “Since these receptors absorb light using the pigment melanopsin, the quantity is referred to as equivalent melanopic lux (EML) … ALFA deploys spectral calculations using the best-in-class radiative transfer library, libRadtran.” [66,67,68].
The Melanopic Lux (EML) is measured vertically 1.2 m above the floor (seated occupants’ eye level). EML is highly dependent on light admission through the window, as well as reflected light from walls and ceilings [69], and is readily translatable to the CIE-recognized melanopic EDI [68].
Throughout the daytime, the recommended minimum EML at the 1.2 m eye level is 275(Lux) [70], but the WELL Standard recommendation is 200(Lux) [71].
Photopic Lux is an average response of the three-color vision receptors. To evaluate the appropriateness of a light spectrum, M/P ratio “compares that melanopic (ipRGC) potential to the light source’s ability to produce light for daytime detail vision (photopic vision)” and shows lighting consistency [72].
To predict the non-visual effect of the incoming light, using ALFA, we simulated the incoming sunlight for the beforementioned critical time depicted in Figure 20. The results show that using an ADS makes no big difference to the M/P ratio; a general 1% increase in M/P was observed (Table 5).
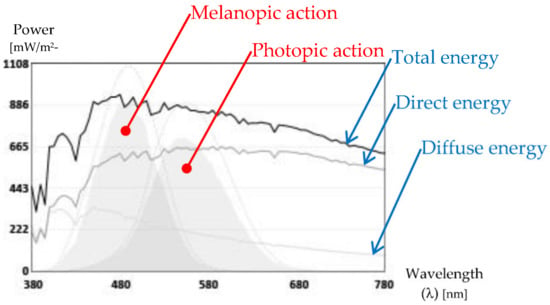
Figure 20.
Incoming daylight spectrum for Sydney, NSW, under clear sky conditions.

Table 5.
Melanopic and photopic lux study for the case room.
5. Validation
To validate the simulation results, the authors set up a network of sensors/meters in the exact location as the simulation assessing daylight metrics (Figure 21c–g), temperature (Figure 21h), and radiation (Figure 21i), as well as images to evaluate glare and view (Figure 21a,b).
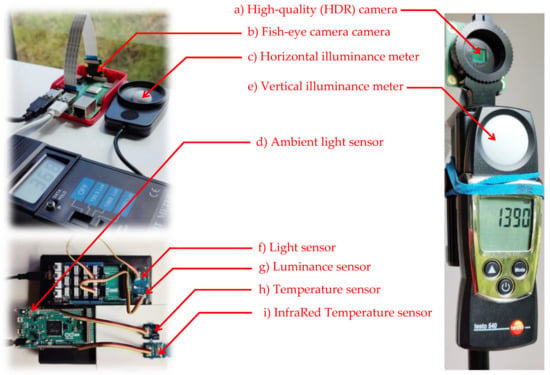
Figure 21.
Field measurement validating the simulation results. The measurements were performed on a network that conforms to the sensors placed in the simulation. Illuminance meters and light sensors feed the sDA, ASE, UDI, and DF analysis; cameras provide images to analyze DGP and view to the outside.
The differences between simulation and field measurement are presented in Figure 22. A 2.09% decrease, 1.87% increase, 2.08% increase, and 3.96% decrease were observed in DF, DGP, ASE, and UDI, respectively. To add to the analysis’s reliability, the authors also compared the reference case simulation and field measurement. An absolute 3.5% variation between simulation and field measurement proves the measurement tools and techniques’ credibility.
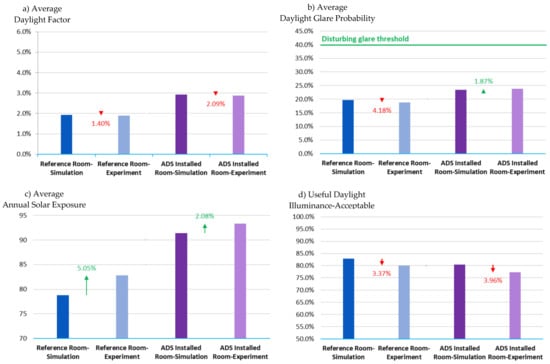
Figure 22.
Daylight metrics experiments results compared with simulation for: (a) average DF; (b) average DGP; (c) average ASE. (d) The red and green figures show the variations.
6. Conclusions
Optimizing the amount of admitted sunlight to moderate indoor comfort and energy usage through optimization of the ADS curve was the objective of the current study in order to devise a system that could act as a double-performance of shade and reflective tool. The optimized ADS can enhance indoor visual comfort under a high luminous sky by providing a congenial luminous environment, keeping a more homogeneous daylight distribution. The application of an ADS in the southern hemisphere improves daylighting performance significantly without a significant influence on the air temperature.
An in-detail simulation followed by field measurement showed that an average decrease of 4.94% in yearly average heating demand due to redirecting sunlight deep in the room can increase ambient thermal comfort during the heating season and changed the PPD from 21.81% to 15.59%.
Since the ADS diffused sunlight towards the back of the room, the overheating (overlighting) of the first third of the room is mitigated while this problem is raised in the mid-area of the room. Regarding the shading effect of the ADS underside, a decrease of approximately 61.56% in annual radiation on the north-oriented window surface was measured. This shading effect can also moderate daylight illuminance. The supplementary daylight which requires artificial lighting also decreased by 5.07% of yearly hours. Interestingly, a saving of 17.4% in annual lighting energy was achieved. With the highest efficiency during midday time, analyzing the non-visual effect of the incoming light has shown installing an ADS on the north-facing window brings no big difference to the M/P ratio.
The drawbacks of the optimized ADS are an increase of 3.73% in average disturbing glare and an increase in the ceiling yearly indirect solar exposure by 71.42%. An 8.47% increase in the annual average cooling demand shows the overheating probability of utilizing an ADS and blocking 5.2% of the visual connection to the outside.
Finally, a number of important limitations need to be considered. It is beyond the scope of this study to examine the shading cast from neighboring facilities and the seasonal floral shading of the surrounding vegetation. However, more research on this topic needs to be undertaken before the association between floral shading in a region surrounded by green landscapes such as Sydney and providing indoors with sunlight is more clearly understood.
There is abundant room for further progress in determining the interaction between the ADS and window construction and penetration size. Future research should also concentrate on investigating dynamic ADS systems for offices in Sydney, NSW.
Author Contributions
Conceptualization, M.R. and P.R.; methodology, E.S. and M.S.; software, E.S.; validation, E.S. and M.S.; formal analysis, M.R. and E.S.; investigation, P.R. and E.S.; data curation, B.S. and M.S.; writing—original draft preparation, M.R. and E.S.; writing—review and editing, P.R. and B.S.; visualization, E.S.; supervision, B.S.; project administration, M.R. and P.R. All authors have read and agreed to the published version of the manuscript.
Funding
This project has been jointly funded by Western Sydney University and Commonwealth Scientific Research Organization (CSIRO), Energy Business Unit.
Data Availability Statement
Not applicable.
Acknowledgments
We would like to thank Advanced Architecture Lab for granting a license to the Opposum engine. Special thanks to Faezeh Shateri for field measurement and Fariborz Moshfeghinejad for facilitating the experiment. Thanks also to Solemma for providing an educational license for ClimateStudio.
Conflicts of Interest
The authors declare no conflict of interest.
Nomenclature
| ADS | Anidolic Daylighting System | EUI | Energy Use Intensity |
| AIC | Anidolic Integrated Ceiling | IEA | International Energy Agency |
| ALFA | Adaptive Lighting for Alertness | IES | Illuminating Engineering Society |
| ASE | Annual Solar Exposure | LEED | Leadership in Energy and Environmental Design |
| ASHRAE | American Society of Heating, Refrigerating and Air-Conditioning Engineers | MCDM | Multiple-Criteria Decision-Making |
| BREEAM | Building Research Establishment Environmental Assessment Method | MOGA | Multi-Objective Genetic Algorithm |
| CBDM | Climate-Based Daylight Modeling | NSPSO | Non-dominated Sorting Particle Swarm Optimization |
| CPC | Compound Parabolic Concentrator | PPD | Predicted Percentage Dissatisfied |
| DA | Daylight Autonomy | sDA | Spatial Daylight Autonomy |
| DF | Daylight Factor | UDI | Useful Daylight Illuminance |
| DGP | Daylight Glare Probability | WFR | Window-to-Floor Ratio |
| EML | Equivalent Melanopic Lux | WWR | Window-to-Wall Ratio |
Appendix A

Figure A1.
Space Occupations Schedule.
References
- Garcia-Fernandez, B.; Omar, O. Integrated innovative solar lighting system for optimization of daylight utilization for public library in Alexandria, Egypt. Ain Shams Eng. J. 2023, 14, 101819. [Google Scholar] [CrossRef]
- Sorooshnia, E.; Rashidi, M.; Rahnamayiezekavat, P.; Rezaei, F.; Samali, B. Optimum external shading system for counterbalancing glare probability and daylight illuminance in Sydney’s residential buildings. Eng. Constr. Archit. Manag. 2021; ahead of print. [Google Scholar] [CrossRef]
- Sorooshnia, E.; Rashidi, M.; Rahnamayiezekavat, P.; Samali, B. Optimizing Window Configuration Counterbalancing Energy Saving and Indoor Visual Comfort for Sydney Dwellings. Buildings 2022, 12, 1823. [Google Scholar] [CrossRef]
- Onubogu, N.O.; Chong, K.K.; Tan, M.H. Review of Active and Passive Daylighting Technologies for Sustainable Building. Int. J. Photoenergy 2021, 2021, 8802691. [Google Scholar] [CrossRef]
- Ponmalar, V.; Ramesh, B. Energy efficient building design and estimation of energy savings from daylighting in Chennai. Energy Eng. 2014, 111, 59–80. [Google Scholar] [CrossRef]
- Linhart, F.; Scartezzini, J.-L. Minimizing lighting power density in office rooms equipped with Anidolic Daylighting Systems. Sol. Energy 2010, 84, 587–595. [Google Scholar] [CrossRef]
- Veitch, J.A. Lighting for High-Quality Workplaces. In Creating the Productive Workplace; Taylor & Francis: New York, NY, USA, 2006; pp. 234–250. [Google Scholar]
- CIBSE. Daylighting and Window Design-Lighting Guide LG; Chartered Institution of Building Services Engineers: London, UK, 1999. [Google Scholar]
- Bodart, M.; De Herde, A. Global energy savings in offices buildings by the use of daylighting. Energy Build. 2002, 34, 421–429. [Google Scholar] [CrossRef]
- Campisi, D.; Gitto, S.; Morea, D. An Evaluation of Energy and Economic Efficiency in Residential Buildings Sector: A Multi-criteria Analisys on an Italian Case Study. 2018. Available online: https://hdl.handle.net/11584/317289 (accessed on 1 October 2022).
- Saadi, M.Y.; Daich, S.; Daiche, A.M. Design and Analysis of a Passive Lighting Device for a Sustainable Office Environment in Hot-Arid Climate Conditions. Int. J. Sustain. Constr. Eng. Technol. 2022, 13, 25–38. [Google Scholar] [CrossRef]
- Wittkopf, S.K.; Yuniarti, E.; Soon, L.K. Prediction of energy savings with anidolic integrated ceiling across different daylight climates. Energy Build. 2006, 38, 1120–1129. [Google Scholar] [CrossRef]
- Scartezzini, J.-L.; Courret, G. Anidolic daylighting systems. Sol. Energy 2002, 73, 123–135. [Google Scholar] [CrossRef]
- Boubekri, M. Daylighting, Architecture and Health; Routledge: Oxfordshire, UK, 2008. [Google Scholar]
- Ochoa, C.E.; Capeluto, I.G. Evaluating visual comfort and performance of three natural lighting systems for deep office buildings in highly luminous climates. Build. Environ. 2006, 41, 1128–1135. [Google Scholar] [CrossRef]
- Tian, M.; Su, Y.; Zheng, H.; Pei, G.; Li, G.; Riffat, S. A review on the recent research progress in the compound parabolic concentrator (CPC) for solar energy applications. Renew. Sustain. Energy Rev. 2017, 82, 1272–1296. [Google Scholar] [CrossRef]
- Verso, V.R.L.; Pellegrino, A.; Serra, V. Light transmission efficiency of daylight guidance systems: An assessment approach based on simulations and measurements in a sun/sky simulator. Sol. Energy 2011, 85, 2789–2801. [Google Scholar] [CrossRef]
- Binarti, F.; Satwiko, P. Assessing the energy saving potential of anidolic system in the tropics. Energy Effic. 2018, 11, 955–974. [Google Scholar] [CrossRef]
- Binarti, F.; Satwiko, P. An east-facing anidolic daylighting system on a tropical urban house. Indoor Built Environ. 2015, 25, 691–702. [Google Scholar] [CrossRef]
- Berardi, U.; Anaraki, H.K. Analysis of the Impacts of Light Shelves on the Useful Daylight Illuminance in Office Buildings in Toronto. Energy Procedia 2015, 78, 1793–1798. [Google Scholar] [CrossRef]
- Johnsen, K. Daylight in buildings, collaborative research in the International Energy Agency (IEA Task 21). Renew. Energy 1998, 15, 142–150. [Google Scholar] [CrossRef]
- Kleindienst, S.A. Improving the Daylighting Conditions of Existing Buildings: The Benefits and Limitations of Integrating Anidolic Daylighting Systems Using the American Classroom as a Model; Massachusetts Institute of Technology: Cambridge, MA, USA, 2006. [Google Scholar]
- Roshan, M.; Kandar, M.Z.B.; Nikpur, M.; Mohammadi, M.P.; Ghasemi, M. Investigating the performance of anidolic daylighting system with respect to building orientation in tropical area. Eng. Sci. Technol. 2013, 3. [Google Scholar]
- Binarti, F.; Satwiko, P. Long-term Monitoring and Simulations of the Daylighting and Thermal Performance of an Anidolic Daylighting System on a Tropical Urban House. Energy Procedia 2015, 78, 1787–1792. [Google Scholar] [CrossRef]
- Praditwattanakit, R.; Chaiwiwatworakul, P.; Chirarattananon, S. Anidolic concentrator to enhance the daylight use in tropical buildings. In Proceedings of the International Conference on Alternative Energy in Developing Countries and Emerging Economies, Bangkok, Thailand, 30–31 May 2013. [Google Scholar]
- Wittkopf, S. Daylight performance of anidolic ceiling under different sky conditions. Sol. Energy 2007, 81, 151–161. [Google Scholar] [CrossRef]
- Kontadakis, A.; Tsangrassoulis, A.; Doulos, L.; Zerefos, S. A Review of Light Shelf Designs for Daylit Environments. Sustainability 2018, 10, 71. [Google Scholar] [CrossRef]
- Daich, S.; Zemmouri, N.; Morello, E.; Piga, B.E.; Saadi, M.Y.; Daiche, A.M. Assessment of Anidolic Integrated Ceiling effects in interior daylight quality under real sky conditions. Energy Procedia 2017, 122, 811–816. [Google Scholar] [CrossRef]
- Compagnon, R. Numerical Simulations of Daylighting Systems for Side-Lighting; Simulations Numeriques de Systemes Declairage Naturel a Penetration Laterale; Ecole Polytechnique Federale: Lausanne, Switzerland, 1994. [Google Scholar]
- Darling, D. Passive Solar Design. Available online: https://www.daviddarling.info/encyclopedia/P/AE_passive_solar_design.html (accessed on 7 November 2022).
- Gordon, J.M.; Rabl, A. Nonimaging compound parabolic concentrator-type reflectors with variable extreme direction. Appl. Opt. 1992, 31, 7332–7338. [Google Scholar] [CrossRef] [PubMed]
- Courret, G. Anidolic Daylighting Systems. In Department of Architecture; EPFL: Lausanne, Switzerland, 1999. [Google Scholar]
- Wittkopf, S.; Grobe, L.O.; Geisler-Moroder, D.; Compagnon, R.; Kämpf, J.; Linhart, F.; Scartezzini, J.-L. Ray tracing study for non-imaging daylight collectors. Sol. Energy 2010, 84, 986–996. [Google Scholar] [CrossRef]
- Rhino3D, Rhinoceros Features. 2022. Available online: https://www.rhino3d.com/features/ (accessed on 1 November 2022).
- McNeel Europe Grasshopper—Algorithmic Modeling for Rhino. Available online: https://www.grasshopper3d.com/ (accessed on 1 November 2022).
- Costanzo, V.; Nocera, F.; Evola, G.; Buratti, C.; Faro, A.L.; Marletta, L.; Domenighini, P. Optical characterization of historical coloured stained glasses in winter gardens and their modelling in daylight availability simulations. Sol. Energy 2022, 243, 22–34. [Google Scholar] [CrossRef]
- Xiang, C.; Lobaccaro, G.; Matusiak, B.S. Tailored Architectural Design Method for Coloured Façade Integrated Photovoltaics: An Example from the Nordic Built Environment. In Proceedings of the Solar World Congress, Virtual Conference, 25–29 October 2021. [Google Scholar] [CrossRef]
- Ayoub, M. 100 Years of daylighting: A chronological review of daylight prediction and calculation methods. Sol. Energy 2019, 194, 360–390. Available online: https://www.sciencedirect.com/science/article/abs/pii/S0038092X19310692?via%3Dihub (accessed on 8 December 2022). [CrossRef]
- EnergyPlus Simulation Software. 2022. Available online: https://energyplus.net (accessed on 1 July 2022).
- Compagnon, R. Simulations Numériques de systèmes D’éclairage Naturel à Pénétration Latérale. In Department of Architecture; EPFL: Lausanne, Switzerland, 1994. [Google Scholar]
- Feng, Y.; Zheng, B.; Li, Z. Exploratory study of sorting particle swarm optimizer for multiobjective design optimization. Math. Comput. Model. 2010, 52, 1966–1975. [Google Scholar] [CrossRef]
- Zhao, S.Z.; Suganthan, P.N.; Qu, B. Multiobjective Particle Swarm Optimizer with DYNAMIC epsilon-Dominance Sorting. In Proceedings of the 2010 Second World Congress on Nature and Biologically Inspired Computing (NaBIC), Kitakyushu, Japan, 15–17 December 2010. [Google Scholar]
- Li, X. A Non-dominated Sorting Particle Swarm Optimizer for Multiobjective Optimization. In Proceedings of the Genetic and Evolutionary Computation Conference, Chicago, IL, USA, 12–16 July 2003; Springer: Berlin/Heidelberg, Germany; pp. 37–48. [Google Scholar] [CrossRef]
- Liu, Y. A Fast and Elitist Multi-Objective Particle Swarm Algorithm: NSPSO. In Proceedings of the 2008 IEEE International Conference on Granular Computing, Hangzhou, China, 26–28 August 2008; pp. 470–475. [Google Scholar] [CrossRef]
- ANSI/IES RP-16-17; Addendum 2. Illuminating-Engineering-Society: New York, NY, USA, 2019.
- USGBC. LEED BD+ C: New Construction; v4-LEED v4: Daylight; USGBC: Washington, DC, USA, 2014. [Google Scholar]
- Costanzo, V.; Evola, G.; Marletta, L.; Pistone Nascone, F. Application of Climate Based Daylight Modelling to the Refurbishment of a School Building in Sicily. Sustainability 2018, 10, 2653. [Google Scholar] [CrossRef]
- Pilechiha, P.; Mahdavinejad, M.; Pour Rahimian, F.; Carnemolla, P.; Seyedzadeh, S. Multi-objective optimisation framework for designing office windows: Quality of view, daylight and energy efficiency. Appl. Energy 2020, 261, 114356. [Google Scholar] [CrossRef]
- Council, U.G.B. LEED-v4.1 for Building Design and Construction; USGBC Inc.: Washington, DC, USA, 2019. [Google Scholar]
- Pierson, C.; Wienold, J.; Bodart, M. Review of Factors Influencing Discomfort Glare Perception from Daylight. Leukos 2017, 14, 111–148. [Google Scholar] [CrossRef]
- Nazzal, A.A. A new evaluation method for daylight discomfort glare. Int. J. Ind. Ergon. 2005, 35, 295–306. [Google Scholar] [CrossRef]
- Nabil, A.; Mardaljevic, J. Useful daylight illuminance: A new paradigm for assessing daylight in buildings. Light. Res. Technol. 2005, 37, 41–57. [Google Scholar] [CrossRef]
- Nabil, A.; Mardaljevic, J. Useful daylight illuminances: A replacement for daylight factors. Energy Build. 2006, 38, 905–913. [Google Scholar] [CrossRef]
- Mardaljevic, J. Climate-Based Daylight Modelling and its Discontents. In Proceedings of the CIBSE Technical Symposium, London, UK, 16–17 April 2015. [Google Scholar]
- BREEAM. BREEAM New Construction, Non Domestic Building; Global BRE: Watford, UK, 2012. [Google Scholar]
- Cruse, A. Improving the Weather: On Architectural Comforts and Climates, in Examining the Environmental Impacts of Materials and Buildings; IGI Global: Hershey, PA, USA, 2020; pp. 251–281. [Google Scholar]
- Hong, X.; Shi, F.; Wang, S.; Yang, X.; Yang, Y. Multi-objective optimization of thermochromic glazing based on daylight and energy performance evaluation. Build. Simul. 2021, 14, 1685–1695. [Google Scholar] [CrossRef]
- Obradovic, B.; Matusiak, B. A customised method for estimating light transmission efficiency of the horizontal light pipe via a temporal parameter with an example application using laser-cut panels as a collector. Methodsx 2021, 8, 101339. [Google Scholar] [CrossRef]
- Rashidi, M.; Sorooshnia, E. Heuristic Catenary-based Rule of Thumbs to Find Bending Moment Diagrams. Civ. Eng. Arch. 2020, 8, 557–570. [Google Scholar] [CrossRef]
- Ries, H.; Rabl, A. Edge-ray principle of nonimaging optics. J. Opt. Soc. Am. A 1994, 11, 2627–2632. [Google Scholar] [CrossRef]
- Chen, F.; Li, M.; Zhang, P. Distribution of Energy Density and Optimization on the Surface of the Receiver for Parabolic Trough Solar Concentrator. Int. J. Photoenergy 2015, 2015, 120917. [Google Scholar] [CrossRef]
- MathWorks, Curve Fitting via Optimization. 2020. Available online: https://www.mathworks.com/help/matlab/math/example-curve-fitting-via-optimization.html (accessed on 1 October 2022).
- Winston, R.; Miñano, J.; Benitez, P. Nonimaging Optics; Elsevier: Amsterdam, The Netherlands, 2005. [Google Scholar]
- Deb, K.J.I. Multi-Objective Optimization Using Evolutionary Algorithms; John Wiley & Sons: New York, NY, USA, 2001; ISBN 978-0-471-87339-6. [Google Scholar]
- Roslan, M.F.; Al-Shetwi, A.Q.; Hannan, M.A.; Ker, P.J.; Zuhdi, A.W.M. The pseudocode of the proposed PSO algorithm. PLoS ONE 2020, 15, e0243581. [Google Scholar] [CrossRef]
- Solemma. ALFA. Adaptive Lighting for Alertness. A new Circadian Lighting Design Software. 2022. Available online: https://www.solemma.com/alfa (accessed on 1 October 2022).
- Institute, I.W.B. LIGHT. Feature Visual Lighting Design, in WELL Building Standard. 2020. Available online: https://standard.wellcertified.com/well (accessed on 1 September 2022).
- Ravn, M.; Mach, G.; Hansen, E.K.; Triantafyllidis, G. Simulating Physiological Potentials of Daylight Variables in Lighting Design. Sustainability 2022, 14, 881. [Google Scholar] [CrossRef]
- Bullock, J. Explainer: Melanopic Lux. The Light Review 2019. Available online: https://www.thelightreviewonline.com/explainer-melanopic-lux/ (accessed on 1 November 2022).
- Brown, T.M.; Brainard, G.C.; Cajochen, C.; Czeisler, C.A.; Hanifin, J.P.; Lockley, S.W.; Lucas, R.J.; Münch, M.; O’Hagan, J.B.; Peirson, S.N.; et al. Recommendations for daytime, evening, and nighttime indoor light exposure. PLoS Biol. 2022, 20, e3001571. [Google Scholar] [CrossRef] [PubMed]
- Sánchez-Cano, A.; Aporta, J. Optimization of Lighting Projects Including Photopic and Circadian Criteria: A Simplified Action Protocol. Appl. Sci. 2020, 10, 8068. [Google Scholar] [CrossRef]
- Miller, N.J.; Irvin, A.L. M/P Ratios—A Call for Consistency. LD+A Mag. 2020, 50, PNNL-SA-152939. [Google Scholar]
Disclaimer/Publisher’s Note: The statements, opinions and data contained in all publications are solely those of the individual author(s) and contributor(s) and not of MDPI and/or the editor(s). MDPI and/or the editor(s) disclaim responsibility for any injury to people or property resulting from any ideas, methods, instructions or products referred to in the content. |
© 2023 by the authors. Licensee MDPI, Basel, Switzerland. This article is an open access article distributed under the terms and conditions of the Creative Commons Attribution (CC BY) license (https://creativecommons.org/licenses/by/4.0/).