Abstract
Overheating of photovoltaic (PV) panels decreases their efficiency and lifetime, and subsequently increases the levelized cost of energy (LCOE). Passive PV cooling would enhance the PV operational stability and durability. The cooling tower (CT) technology offers an attractive approach for zero-cost capability. In this work, we developed and customized a CT specific for passive PV cooling. Since the dense downdrafted cooled air gained high velocity, a turbine was installed at the bottom of the CT for power production. At the height’s ambient temperature, the CT cooled the air from 50 °C down to 30 °C. The cooled air at 30 °C has enough capacity to cool the PV panels. This cooling capacity improved the average annual efficiency of the PV panels by 6.83%. The design specifications of the CT have the highest performance, with the maximum radius of PV area of panels that can be cooled at 50 m. Furthermore, the current design could operate during the night for power production with minimum operational cost.
1. Introduction
A growing number of countries are focusing their emphasis on lowering conventional fuel usage and carbon emissions as a result of fast economic and population growth around the globe [1]. Solar-energy-generating systems are described as being one of the most effective ways of managing energy-related and environmental challenges [2,3].
In recent years, the efficiency of solar photovoltaic (PV) technology has risen dramatically because of the ongoing production of solar PV modules. While some solar PV modules have achieved laboratory efficiencies of over 40%, this has not been the case for all of these modules [4]; the efficiencies of economic and commercial modules are far lower. Even when using the same PV modules, the commercial efficiency is much lower than the laboratory efficiency. Conversely, thermal fluctuations can have a great effect on solar cells; changes in temperature would have an impact on the output power of the cells. During solar exposure, a PV module only converts around 31% of the direct sunlight into usable energy, with a larger portion shifting to heat energy, which causes the module’s temperature to rise, resulting in a decrease of electricity production. Increasing the module’s temperature as a result of this wasted energy might damage the materials used to create the PV module, resulting in a decrease in cell lifespan and efficiency [5,6]. The voltage is also highly dependent on temperature, and as the temperature increases, the voltage drops [7,8].
Enhancing the efficiency of solar energy is the main focus of different research, as it is the most frequently utilized renewable energy source for power generation and water heating [9]. Peng et al. [10] conducted research to determine how much efficiency may be increased by using cooling conditions on PV modules. Considering that test findings show that cooling solar PV systems may improve their efficiency by 47%, a cooling system is being considered for use in a residential solar PV installation. It is predicted that annual PV electric production efficiency would increase by up to 35% because of the dimensional correctness and life cycle analysis. To validate this theory, Teo et al. [11] performed a hybrid solar/thermal system to lower the temperature of PV modules. In this experiment, the back of the PV module was equipped with air channels, and the efficiency was increased by approximately 14%. Additionally, Alami et al. [12] made an additional effort to remove heat from the back of the PV module, in which a sheet of clay was placed to the back of the panel, and a space was created for a little amount of water to evaporate, resulting in a 19.4% increase in power production.
Another recent research work by Rahimi et al. [13] includes the development of a wind-collecting-apparatus-based cooling system for the purpose of reducing the temperature of PV cells in a hybrid wind/PV system. The cooling system serves two purposes: it lowers the temperature of the PV cells, while also generating electricity. According to the results of the experiment, both the wind turbine and the PV module produced an increase in power of 36%.
In a similar approach, Qi et al. [14] has carried out a new analysis of the energy and economic advantages derived from the installation of PV systems on cooling towers over the whole territory of mainland China. Adjusting solar panels on cooling towers is possible in terms of macro-technological and economic effectiveness, according to this study.
A large amount of technological and economic potential exists for PV systems mounted on cooling towers. They may be utilized as an additional power production system for thermal power plants in order to minimize coal usage as well as greenhouse gas emission [15].
In this research, the integration of PV technology into cooling towers (CT) in order to maximize the utilization of solar irradiation was investigated. Many aspects have been taken into consideration in order to examine a novel cooling approach for PV modules that utilizes the air departing from the CT’s outlet in order to determine its impact on the PV modules’ efficiency and power production. The CT’s activity in this study is predicated on a water mist at the top of the tower, which is where the hot and dry air is located; this causes the CT to become activated. After absorbing the vapor from the mist, the air becomes colder and heavier. Gravity forces the air to descend through the bottom surface of the tower. Furthermore, the air rushes towards a turbine at the bottom of the tower, forcing the turbine to create electricity and creating a temperature difference between the inside and outside of the CT. Numerous factors have been examined to determine the effect of the novel cooling technology on the efficiency and power output of the PV panels. The arrangement of this work begins with the operation of the CT and continues with the integration of the CT with PV panels in Section Two. The suggested integration is then mathematically modelled. The discussion part includes an evaluation of the weather data, the CT’s performance, and the impact of various parameters on this integration.
The output of this research contributes to the improvements of traditional thermal power plants that can be turned into the next generation of renewable energy facilities, which represents a promising application for more efficient energy use [16].
2. Materials and Methods
2.1. CT Integrated with PV Panels
Overheating caused by too much solar radiation and high climatic conditions is one of the most significant challenges to the functioning of solar panels (PV). Overheating drastically affects the efficiency of the panels. As with any given polycrystalline panel, as the temperature increases, the rated output power decreases, with the P-V curve peak decreasing and shifting to the left. In accordance with Hybrid Photovoltaic/Thermal (PV/T) solar system cooling mechanism, this work integrates cooling of PV panels with the daily operation of electricity-generating cooling towers.
The 200 m-high CT has a radius of 5 m. The top base circumference of the CT is surrounded by sprinklers that are connected to a water reservoir. The turbine is positioned at the bottom of the CT. The 2 × 1 m PV modules are placed on the lower base of the CT in a circular pattern with a radius of the same length as the PV panel. Figure 1a outlines the components’ dimensions and air flow mechanism. Figure 1b illustrates a three-dimensional view of the proposed cooling mechanism.
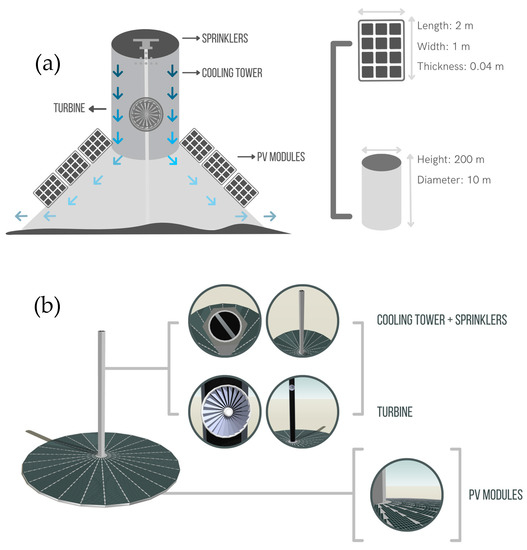
Figure 1.
Proposed PV integration with the CT showing (a) the structure and physical dimensions of the system and (b) a 3D view of the system with PV panel arrangement.
As hot and dry air passes through the top of the CT, water mist is sprayed by sprinklers. As the air gets humid from the mist, it gets heavier due to the increase of H2O concentration. The humid air is then pulled down the CT by gravity, getting cooler nearer to the CT base. Then, the PV modules placed on the base are cooled by the cold air exiting from the CT by convection, which increases the overall module efficiency, thus, increasing the output power of each PV module.
2.2. Mathematical Model
To evaluate the performance of the new system, a mathematical model was developed. A set of equations based on the mass balance for air over the entire system and the energy balance for each section of the PV panels with CT were developed. Moreover, several assumptions were made and evaluated including steady-state operation, and symmetrical airflow. Therefore, Equations (1)–(10) were developed to illustrate the integration of the PV panels with CT. The code for the mathematical model was built in MATLAB to simulate and solve the equations numerically. The code reads an input file that contains records of the weather conditions, including solar irradiance, wind speed, temperature, and relative humidity. The code also reads the physical dimensions and properties of the PV panels and CT. The code processes the data and calculates the results on an hourly basis. The arrangement and dimensions of the system are shown in Figure 1. The system was divided into two major sections: the PV panels section and the CT section. The next section presents the development of the mathematical equations used in the model.
2.2.1. PV Panels Section
To calculate the temperature of the PV panels, the model first calculates the glass cover temperature of the PV panels.
where APV is the PV module area; α is the absorptivity; G is the solar irradiance (W·m−2); hc is the conductive heat transfer coefficient (W·m−2K−1); hr is the radiative heat transfer coefficient (W·m−2K−1); hv is the convective heat transfer coefficient (W·m−2K−1); Vw is the wind speed (m/s); and Ta is the ambient temperature (k). Then, the PV panel temperature was determined using Equation (2), given as [17]:
The radiative heat transfer coefficient between the glass cover of PV module and the sky temperature can be given by the following formula:
where the convective heat coefficient with wind effect is described by the following formula:
* Note: When the CT is not operating, or in the case of PV standalone mode, the is considered the ambient temperature. However, when the CT is operating, is considered the temperature (of the air exiting from the CT; see Equation (8). Similarly, this is also the case for .
The temperature gradient of the air under the PV panels was determined by solving Equation (6), given as:
where is the temperature gradient of the air under the PV panels. Am is the PV panel area. is the temperature of the air under the PV panels. is the packing factor. is the absorptivity of the PV panels. is the transmissivity of the PV panels. is the emissivity of the PV cell. is the absorptivity of the PV cell. is the efficiency of the PV cell. is the emissivity of the PV panels glass. The efficiency η () of solar panels in the field also, as shown in Equation (7), depends on the real-time operating temperature, which was determined using Equation (4).
where β is the temperature coefficient equal to −0.280/°C, η (STC) is the solar panels’ efficiency, and STC stands for Standard Test Condition. The power output of the solar panels was determined using Equation (4).
2.2.2. Cooling Tower Section
When water is sprayed at the hot air at the top of the chimney, it evaporates instantly to produce a vapor. The enthalpy of the vapor was calculated as follow:
where is the enthalpy of the vapor; is the enthalpy of the air; is the enthalpy of the water spray; is the specific heat capacity (J·kg−1·K−1); and is the outside temperature (K). Similarly, to calculate the enthalpy of the water, the following equation was used:
where is the specific heat capacity of the water spray (J·kg−1·K−1).
To calculate the change in the vapor temperature, the following equation was used:
where is the relative humidity of the ambient air; is the relative humidity of the vapor; and is the temperature of the vapor (K). As the air descends the tower and exits at the base, the velocity of the air was calculated as follows:
where is the air velocity inside the cooling tower (m/s); is the gravity acceleration (m·s−2); is the height of the cooling tower (m); and is the temperature of the air exiting the cooling tower (K). As the air exits the tower, it interacts with the turbine to produce electricity. The power generated was calculated as follows:
where is the electrical power (W); is the density of the air exiting the cooling tower (kg·m−3); is the turbine efficiency, 0.42; and is the cross-sectional area of the cooling tower (m2).
3. Results and Discussion
As weather conditions are essential for the operation of the PV panels and CT, this section begins with an analysis of the weather profile. After that, an analysis of the CT’s performance is presented. The research also examines the effect of ambient temperature and humidity on the CT’s electrical power output. The performance of the CT, in particular the cooled air leaving the CT, will be established in relation to the performance of the PV panels as a result. The following section discusses the thermal properties of the PV panels and the impact of the temperature and velocity of the cooled air from the CT on performance. Consequently, the electrical power output of the PV as a stand-alone system and when integrated with the CT is provided. Lastly, the improvement in PV panel efficiency is addressed and analyzed.
3.1. Weather Profile
Doha, Qatar (25°17′9.9816″ North, 51°32′5.3412″ East) was chosen as the location for the collection of annual weather data. Several environmental variables, including air temperature, relative humidity, wind speed, and solar irradiance, were measured every hour. The profile of the day’s weather data is presented in Figure 2, which was taken on 21 June. This day’s data has been incorporated into all 24 h results shown in the following section. The solar irradiation increases from 54 W/m2 at 05:00 to peak (845 W/m2) at noon, then declines to 118 W/m2 at 17:00, according to the profile. The profile also showed that daytime temperatures ranged from 28.0 to 38.0 °C, and nighttime temperatures ranged from 30.2 to 34.4 °C. In addition, Figure 2 also presents the wind profile for the research area, which demonstrates that the lowest recorded wind speed was 2.1 m/s, and the highest recorded wind speed was 4.6 m/s. The velocity of the wind has a direct impact on the rate at which the photovoltaic panels are cooled, and therefore, the amount of power that is generated. Additionally, the performance of CT is significantly impacted by the relative humidity in the area. The profile indicates that the daytime relative humidity ranged from 19% to 84% and nighttime relative humidity ranged from 24% to 83%.
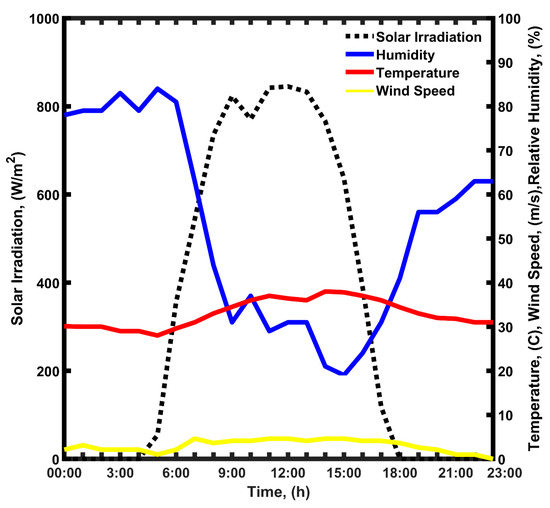
Figure 2.
24 h weather data profile on 21 June at Doha, Qatar.
3.2. CT Performance
Figure 3 is a representation of a 24 h profile of the electrical power output of the CT, along with profiles of the humidity and temperature. Between 00:00 and 06:00, the figure shows that the relative humidity peaked at 79%. The percentage drops to around 20% around 15:00, only to start climbing again and reach 63% by midnight. The humidity changed significantly throughout the duration of a day. The humidity profile shows greater variation than the temperature profile. The temperature starts out at 30 degrees Celsius at midnight and climbs steadily to 38 °C by midday, remaining relatively stable until 15:00. The temperature continues to drop, eventually reaching 30 °C again after midnight. The CT is not operable between 00:00 and 7:00 (OFF). During the rest of the day, it operates with intermittent and varying levels of electricity generation. The performance of the CT is proportional to the ambient temperature and inversely proportional to the relative humidity; the efficiency increases with warmer temperatures and decreases with higher relative humidity levels. Therefore, in order to cool the hot surrounding air, the water temperature must be greater than the ambient temperature. Because of this, the temperature of the resulting vapor decreases as the difference between the water sprayed and the surrounding air grows larger. The air velocity is directly proportional to the difference in temperature between the ambient temperature and the vapor temperature. Thus, the electrical power generated is proportional to the velocity. On the other hand, the amount of electricity generated decreases as the humidity level increases. This is because at high humidity levels, more electricity is required to power the pumps that add water to the already humid air. The result is a negligible or decreased amount of net energy production. The output temperature of the cooled air from the CT is the most valuable CT outcome because it is the primary mechanism by which the PV panels are cooled.
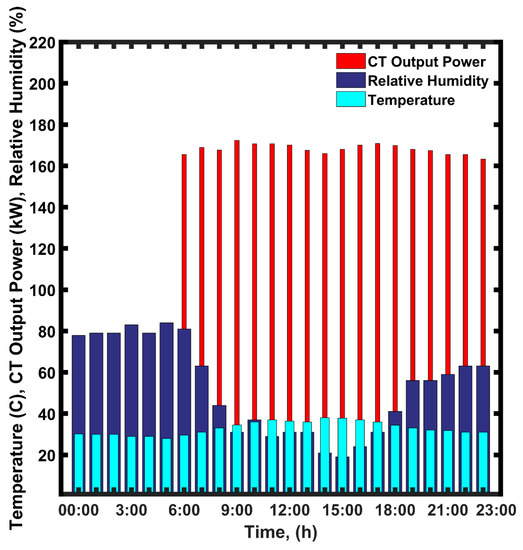
Figure 3.
A 24 h profile of electrical power production for the CT, ambient temperature, and humidity on 21 June.
3.3. Performance of the PV Panels with and without the CT
3.3.1. Impact of the CT Cool Air on the Temperature Profile of the PV Panels
Figure 4 represents the temperature profiles of the PV panels in both standalone (without the CT) and integrated (with the CT) configurations. The profile presented is for a single array of solar panels. The temperature profiles are the same because the PV is not producing heat during the hours of midnight and sunrise, and from sunset to midnight. As shown in the figure, the temperature of the PV panel without the CT begins to rise in the early morning and reaches a maximum of 50 °C about noon. At sunset, the temperature drops till it approaches 32 °C (ambient temperature). This is the average temperature curve of the PV, which is proportional to the ambient temperature and solar radiation. When the PV temperature profile was combined with the CT, however, significantly lower values were obtained. Figure 4 indicates that when the CT started operating in the morning, the cooling effect was negligible due to the minor temperature differential between the water sprayed from the top of the CT and the surrounding temperature. Nonetheless, when the ambient temperature reaches the peak in the middle of the day, the CT produces colder air. Consequently, the best results were obtained when the PV panels were cooled from 50 to 34 °C during noon. Depending on the time of day and weather conditions, the temperature difference between standalone and integrated PV ranged from 5 to 30 °C. As a result, the CT was particularly efficient at cooling the PV panels.
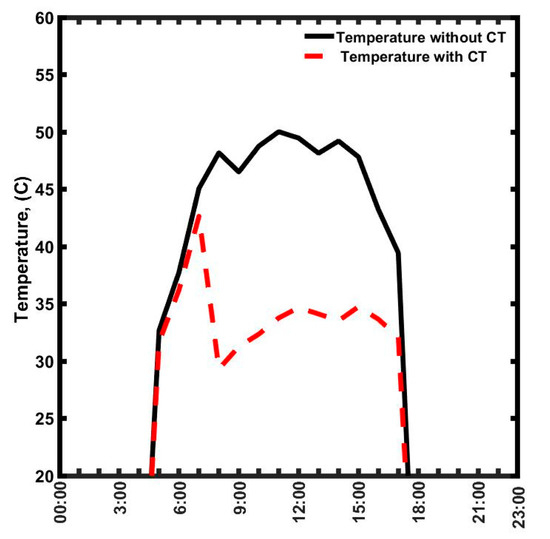
Figure 4.
PV panels’ temperature profiles with and without the CT.
The previous section indicated that the CT effectively decreased the temperature of the PV panels by providing cooler air. This was the result of the cool air’s temperature and velocity. The velocity profile of the air below the PV panels is represented in Figure 5. During a period of 24 h, the wind velocity fluctuates normally between 2 and 5 m/s. As shown in Figure 2, the relevant ambient temperature ranges from 30 °C to 40 °C. These temperatures and wind speeds are inadequate to cool the PV panel. In comparison, the velocity of the cool air produced by the CT is nearly constant at 25 m/s. The graph demonstrates that between midnight and approximately 7:00, the velocity of the ambient air and the velocity of the cool air from the CT are identical. As represented in Figure 2 and described in Section 3.2, the CT was inoperable throughout this time (CT Performance). However, the CT consistently generated cool air from 7:00 until midnight. The PV panels were efficiently cooled by the combination of the high velocity and low temperature of the CT air. Consequently, this will result in increased electricity output.
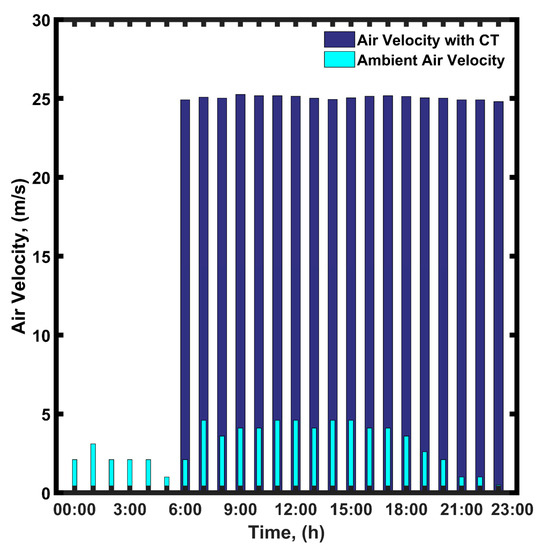
Figure 5.
Profiles of the wind speed of the air under the PV panels with and without the CT.
Figure 6 illustrates a 24 h profile of the electrical power generated by the PV panels and the accompanying solar irradiance. The displayed data applies to one array of PV panels. The solid black line represents solar irradiation. The blue dashed line represents the PV panels’ production with the CT, and the red solid line represents the PV panels’ production without the CT. As expected, the production of power follows the pattern of solar irradiation. It began the day at 6:00 with moderate productivity and peaked at noon with 1.57 kW of electrical production. The output decreases in the late afternoon, at approximately 18:00. Consequently, the production of electricity when PV and CT are integrated follows the same pattern. However, the power output profile has increased in comparison to the profile of PV without CT, showing an improvement. The decrease in sun irradiation, which occurred between 6:00 and 8:00, is the reason for the negligible improvement that was observed during that time. In addition, as shown in Figure 2 and Figure 3, the CT was not operable until about 7:00, and the temperature of the air leaving the CT was the same as the ambient temperature. Therefore, the difference in power generation is negligible. In contrast, the significant increase in PV power generation peaked at noon time, which is the highest solar irradiance. At that time, the maximum power output of the PV panels without CT reached a maximum of 1.47 kW. The power rose from 1.47 kW to 1.57 kW when PV panels were integrated with CT. As presented in Figure 4, this can be attributable to the drop in temperature of the PV panels caused by cooled air from the CT.
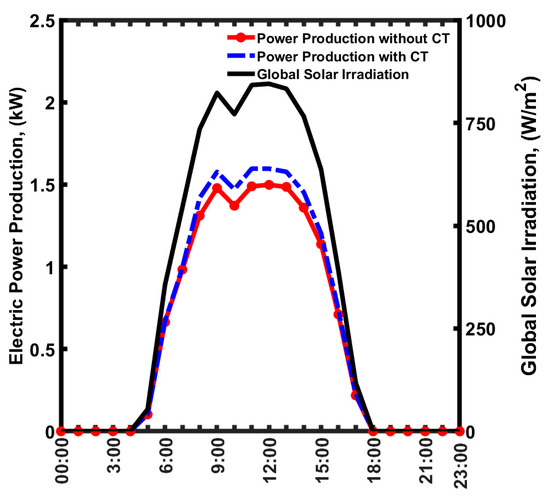
Figure 6.
24-h profile of the PV panels power production with and without the CT on 21 June.
The findings revealed that the CT operates at 7:00, resulting in the production of cool air. After leaving the CT, the air will proceed to pass underneath the PV panels that are situated all around. Figure 5 shows the speed of air at roughly 25 m/s. When air flows over PV panels, it transfers heat to the panels in return for energy, thereby cooling the panels. It is clear from Figure 4 that when the CT is under operation, the temperature of the PV panels drops. Figure 6 shows that this resulted in greater electrical productivity. While the CT was turned off, however, there was no difference between the outcomes of the PV panels’ temperatures and power outputs when using or not using the CT. Accordingly, the increase in PV panels’ power output was due to enhancing its efficiency, which will be covered in the following section.
3.3.2. PV Efficiency Improvement
The scope of the study was broadened so that it could investigate the annual efficiency growth of a greater number of PV panels. According to the findings in Figure 7 and Figure 8, after gradually increasing the number of PV panel arrays from 2 to 24, the largest improvement in productivity was observed using the two-arrays configuration. The PV panels efficiency gradually dropped as the number of the PV arrays increased, as shown in Figure 7. This is because it is anticipated that the speed of air leaving the CT will decrease as one gets further away from its base. Furthermore, the temperature gradient of the air increases due to energy exchange with the PV panels. Figure 7 shows the annual efficiency improvement for the PV arrays. The performance of the proposed integration was assessed over one year’s worth of weather. The monthly efficiency for the entire year is shown in Figure 8. Consistent with the results from Figure 7, the two-PV-panels array achieved the highest total PV system efficiency. The results show that the best efficiency was achieved in the month of September, which correlated with highest solar irradiation and highest temperature values in the year. Furthermore, the lowest system efficiency was observed in November, which is the beginning of winter, when the temperature starts to drop, hence affecting the performance of the CT. Additionally, the PV system efficiency drops to zero from December to March due to temperature drops in winter; hence, the CT is not operational.
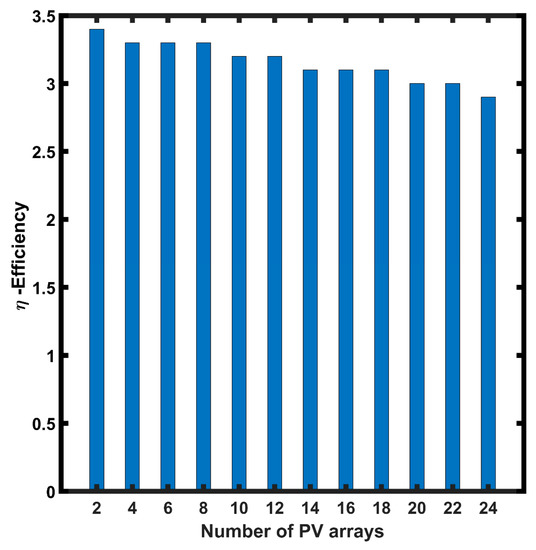
Figure 7.
Annual efficiency improvements of the PV vs. the number of PV panel arrays.
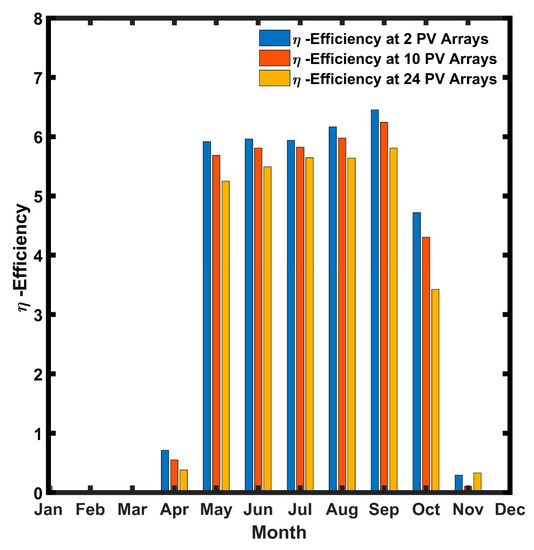
Figure 8.
Average annual efficiency improvements of the PV panels for a year vs. the number of PV panel arrays.
3.4. Comparative Study
Various active and passive cooling techniques were put into practice. Table 1 outlines the suggested cooling strategies in the literature that increase PV panels’ efficiencies by reducing the temperature of modules. Active water cooling with polycrystalline panels had the highest efficiency improvement.

Table 1.
The main cooling techniques investigated to reduce heat from solar panels.
3.5. System Limitations
The efficiency improvement of the PV panels is very dependent on the cooler air generated by the CT, hence very dependent on the performance of the CT. Furthermore, the CT performance is dependent on the weather conditions. For example, in winter, the CT is either not operating or the performance is almost negligible due to low temperature and high humidity. Hence, no improvement or negligible efficiency improvements should be expected. Furthermore, the operation of the CT is dependent on the availability of a nearby water reservoir. Therefore, the best location for the CT would be close to a seawater source. If the system is to be scaled up to cover larger PV areas, the tower height and radius will need to be increased. Although increasing the height of the tower will increase the air velocity of the air in the CT, per Equation (9), there is, however, a practical limitation of the maximum air velocity the turbine can handle. Hence, the air velocity may need to be reduced or capped at 25 m/s which is the rated velocity for most commercial turbines. Hence, increasing the tower height might not be beneficial. Having said that, the proposed system might be best suited for areas with no electricity such as deserts and remote villages.
4. Conclusions
This work introduced a new, never used method for cooling the PV panels using a passive cooling tower. This was achieved by integrating a CT with PV panels arranged in circular layout. The optimal number of PV panels, distributed around the CT, was evaluated for the best utilization of the CT heat exchange capacity. In addition of that, the CT was configured to produce power due from the high velocity of cooled air. Based on the proposed configuration, the annual efficiency improvement of the PV panels reached was ~3% at a radius of 50 m. The CT does not require any fossil fuel for operation, nor does it require any chemical utilization. This makes the present design operate at almost zero cost, and no GHG emission. This design offers an attractive approach for passive cooling and could be applied for various cooling systems. Another advantage is offering an environmentally friendly energy system with a positive impact on sustainable energy production.
Author Contributions
Conceptualization, E.A. and H.A.; methodology, E.A.; software, H.A.; validation, M.J., M.A. and H.A.; formal analysis, M.A.; investigation, A.M.; resources, F.A.; data curation, E.A.; writing—original draft preparation, A.M. and H.A.; writing—review and editing, E.A. and F.A.; visualization, A.M. and M.J.; supervision, E.A. and F.A.; project administration, E.A. All authors have read and agreed to the published version of the manuscript.
Funding
This research received no external funding.
Data Availability Statement
The data presented in this study is contained within the article.
Conflicts of Interest
The authors declare no conflict of interest.
Nomenclature
| A | Area (m2) |
| H | Height (m) |
| Pelc | Electrical power (W) |
| Mass flow rate (kg·sec−1) | |
| g | Gravity acceleration (m·s−2) |
| D | Diameter (m) |
| G | Intensity of solar irradiance (W·m−2) |
| k | Thermal conductivity of air |
| T | Temperature (K) |
| cp | Specific heat capacity (J·kg−1·K−1) |
| r | Radius (m) |
| PV | Photovoltaic |
| i | Enthalpy |
| Vch | Air velocity entering the chimney, (m·s−1) |
| Turbine Efficiency, 0.42. | |
| Greek Symbols | |
| Transmissivity | |
| Absorptivity | |
| Density (kg·m−3) | |
| Relative Humidity | |
| Subscripts | |
| c | Convective heat transfer |
| gls | Glass |
| wtr | Water |
| ch | Chimney |
| out | Outside |
| sky | Sky |
| air | Airflow |
| vap | The humid air resulted from spraying water on the dry air in the case of CT |
References
- Mohsin, M.; Abbas, Q.; Zhang, J.; Ikram, M.; Iqbal, N. Integrated effect of energy consumption, economic development, and population growth on CO 2 based environmental degradation: A case of transport sector. Environ. Sci. Pollut. Res. 2019, 26, 32824–32835. [Google Scholar] [CrossRef] [PubMed]
- Yan, J.; Yang, Y.; Campana, P.E.; He, J. City-level analysis of subsidy-free solar photovoltaic electricity price, profits and grid parity in China. Nat. Energy 2019, 4, 709–717. [Google Scholar] [CrossRef]
- Armaroli, N.; Balzani, V. Towards an electricity-powered world. Energy Environ. Sci. 2011, 4, 3193–3222. [Google Scholar] [CrossRef]
- Wong, J.; Sridharan, R.; Shanmugam, V. Quantifying edge and peripheral recombination losses in industrial silicon solar cells. IEEE Trans. Electron Devices 2015, 62, 3750–3755. [Google Scholar] [CrossRef]
- Koteswararao, B.; Radha, K.; Vijay, P.; Raja, R.S. Experimental Analysis of solar panel efficiency with different modes of cooling. Int. J. Eng. Technol. 2016, 8, 1451–1456. [Google Scholar]
- Idoko, L.; Anaya-Lara, O.; McDonald, A. Enhancing PV modules efficiency and power output using multi-concept cooling technique. Energy Rep. 2018, 4, 357–369. [Google Scholar] [CrossRef]
- Dubey, S.; Sarvaiya, J.N.; Seshadri, B. Temperature Dependent Photovoltaic (PV) Efficiency and Its Effect on PV Production in the World—A Review. Energy Procedia 2013, 33, 311–321. [Google Scholar] [CrossRef]
- Slimani, M.E.-A.; Amirat, M.; Kurucz, I.; Bahria, S.; Hamidat, A.; Chaouch, W.B. A detailed thermal-electrical model of three photovoltaic/thermal (PV/T) hybrid air collectors and photovoltaic (PV) module: Comparative study under Algiers climatic conditions. Energy Convers. Manag. 2017, 133, 458–476. [Google Scholar] [CrossRef]
- Rosa, L.; Chiarelli, D.D.; Rulli, M.C.; Dell’Angelo, J.; D’Odorico, P. Global agricultural economic water scarcity. Sci. Adv. 2020, 6, eaaz6031. [Google Scholar] [CrossRef]
- Peng, Z.; Herfatmanesh, M.R.; Liu, Y. Cooled solar PV panels for output energy efficiency optimisation. Energy Convers. Manag. 2017, 150, 949–955. [Google Scholar] [CrossRef]
- Teo, H.; Lee, P.; Hawlader, M. An active cooling system for photovoltaic modules. Appl. Energy 2012, 90, 309–315. [Google Scholar] [CrossRef]
- Alami, A.H. Effects of evaporative cooling on efficiency of photovoltaic modules. Energy Convers. Manag. 2014, 77, 668–679. [Google Scholar] [CrossRef]
- Rahimi, M.; Valeh-e-Sheyda, P.; Parsamoghadam, M.A.; Masahi, M.M.; Alsairafi, A.A. Design of a self-adjusted jet impingement system for cooling of photovoltaic cells. Energy Convers. Manag. 2014, 83, 48–57. [Google Scholar] [CrossRef]
- Qi, L.; Jiang, M.; Lv, Y.; Zhang, Z.; Yan, J. Techno-economic assessment of photovoltaic power generation mounted on cooling towers. Energy Convers. Manag. 2021, 235, 113907. [Google Scholar] [CrossRef]
- Qi, L.; Jiang, M.; Lv, Y.; Yan, J. A celestial motion-based solar photovoltaics installed on a cooling tower. Energy Convers. Manag. 2020, 216, 112957. [Google Scholar] [CrossRef]
- Abdelsalam, E.; Kafiah, F.; Tawalbeh, M.; Almomani, F.; Azzam, A.; Alzoubi, I.; Alkasrawi, M. Performance analysis of hybrid solar chimney–power plant for power production and seawater desalination: A sustainable approach. Int. J. Energy Res. 2020, 45, 17327–17341. [Google Scholar] [CrossRef]
- Kaplanis, S.; Kaplani, E.; Kaldellis, J. PV temperature and performance prediction in free-standing, BIPV and BAPV incorporating the effect of temperature and inclination on the heat transfer coefficients and the impact of wind, efficiency and ageing. Renew. Energy 2021, 181, 235–249. [Google Scholar] [CrossRef]
- Benato, A.; Stoppato, A.; De Vanna, F.; Schiro, F. Spraying Cooling System for PV Modules: Experimental Measurements for Temperature Trends Assessment and System Design Feasibility. Designs 2021, 5, 25. [Google Scholar] [CrossRef]
- Besheer, A.; Smyth, M.; Zacharopoulos, A.; Mondol, J.; Pugsley, A. Review on recent approaches for hybrid PV/T solar technology. Int. J. Energy Res. 2016, 40, 2038–2053. [Google Scholar] [CrossRef]
- Tan, W.C.; Saw, L.H.; Thiam, H.S.; Yusof, F.; Wang, C.-T.; Yew, M.C. Investigation of water cooled aluminium foam heat sink for concentrated photovoltaic solar cell. IOP Conf. Series: Earth Environ. Sci. 2019, 268, 012007. [Google Scholar] [CrossRef]
- Al-Waeli, A.H.; Sopian, K.; Kazem, H.A.; Chaichan, M.T. Photovoltaic Solar Thermal (PV/T) Collectors Past, Present and Future: A Review. Int. J. Appl. Eng. Res. 2016, 11, 10757–10765. [Google Scholar]
- Elminshawy, N.A.; El-Ghandour, M.; Elhenawy, Y.; Bassyouni, M.; El-Damhogi, D.; Addas, M.F. Experimental investigation of a V-trough PV concentrator integrated with a buried water heat exchanger cooling system. Sol. Energy 2019, 193, 706–714. [Google Scholar] [CrossRef]
Disclaimer/Publisher’s Note: The statements, opinions and data contained in all publications are solely those of the individual author(s) and contributor(s) and not of MDPI and/or the editor(s). MDPI and/or the editor(s) disclaim responsibility for any injury to people or property resulting from any ideas, methods, instructions or products referred to in the content. |
© 2023 by the authors. Licensee MDPI, Basel, Switzerland. This article is an open access article distributed under the terms and conditions of the Creative Commons Attribution (CC BY) license (https://creativecommons.org/licenses/by/4.0/).