Article

A Post-Mortem Study Case of a Dynamically Aged Commercial NMC Cell

MOBI—Electromobility Research Group, Department of Electrical Engineering and Energy Technology, Vrije Universiteit Brussel, Pleinlaan 2, 1050 Brussels, Belgium
*
Author to whom correspondence should be addressed.
Energies 2023, 16(3), 1046; https://doi.org/10.3390/en16031046
Submission received: 30 November 2022 / Revised: 10 January 2023 / Accepted: 16 January 2023 / Published: 17 January 2023

Abstract

:
Lithium-ion batteries are currently the pioneers of green transition in the transportation sector. The nickel-manganese-cobalt (NMC) technology, in particular, has the largest market share in electric vehicles (EVs), offering high specific energy, optimized power performance, and lifetime. The aging of different lithium-ion battery technologies has been a major research topic in the last decade, either to study the degradation behavior, identify the associated aging mechanisms, or to develop health prediction models. However, the lab-scale standard test protocols are mostly utilized for aging characterization, which was deemed not useful since batteries are supposed to age dynamically in real life, leading to aging heterogeneity. In this research, a commercial NMC variation (4-4-2) was aged with a pragmatic standard-drive profile to study aging behavior. The characterized measurable parameters were statistically investigated before performing an autopsy on the aged battery. Harvested samples of negative and positive electrodes were analyzed with Scanning Electron Microscopy (SEM) and the localized volumetric percentile of active materials was reported. Loss of lithium inventory was found to be the main aging mechanism linked to 20% faded capacity due to heavy electrolyte loss. Sparsely distributed fluorine from the lithium salt was found in both electrodes as a result of electrolyte decomposition.

1. Introduction

Lithium-ion batteries (LIBs) have been serving mankind for over 30 years since their first commercial development [1]. The technological varieties of LIBs with diverse electrode compositions (cathode vs. anode) provide the opportunity to design a battery cell as per use case. The nickel-manganese-cobalt, shortly known as NMC, technology was a popular choice among the variations for the e-mobility application because it has higher specific capacity, but can also be tailored for power performance [2]. The aging of NMC/C batteries (graphite as the anode) has been studied extensively in the literature, either to understand the complex degradation behavior or to develop prediction models [3,4,5,6]. Such types of studies are often produced in the lab with specific conditional definitions where operational parameters, such as depth of cycling, temperature, current rates (C-rate), and storage conditions, vary to satisfy the purpose of the study [7]. However, this method of aging characterization is completely opposed to real scenarios in a vehicle where LIBs experience dynamic operating conditions. Thus, the associated degradation mechanism due to the static time-based intercalation and de-intercalation of the ions has little relevance to the same due to dynamic profile aging. The on-road vehicle profile activates a diverse list of parameters that vary with high frequency, leading to an extremely complicated aging scenario that can hardly be mapped [8].
Battery lifetime typically results in the loss of available capacity and increased internal resistance (IR) respective to the operating conditions [7]. The operational cycle and calendar life in lab conditions might accelerate the degradation aspects, triggering one or multiple aging mechanisms [9]. It is an immense challenge to identify the interconnected aging factors that happen on the composite level because of the sensitive manner of the analysis [10]. Researchers have usually identified solid electrolyte interphase (SEI) growth and lithium plating as the main degradation phenomena linked to certain stress parameters [11]. Other aging mechanisms are also proven to be involved in physical degradation, making the whole aging mechanism exceptionally complicated [12]. Thus, the qualitative analysis of the electrode materials and/or electrolytes is the most sensible post-analysis method because the localized studies could only refer to the specific aging history based on operational definitions [13,14]. However, researchers have also demonstrated the possibility of quantifying the loss of lithium inventory and/or active material, SEI layer growth, electrolyte decomposition, electrode particle cracking, etc., performing an autopsy and detailed post-analysis on aged cells [14,15,16]. SEI growth and Li-plating are associated with the negative electrode, whereas particle cracking can occur on both electrodes. Battery degradation can be induced by chemical or physical changes which eventually lead to capacity and power loss. These chemical and physical changes will result in three major degradation modes (DMs): the loss of lithium inventory (LLI), the loss of active material (LAM), and the loss of electrolytes [17,18]. LLI is a result of the reduction of the amount of cyclable lithium for charge and discharge. LAM occurs in both positive and negative electrodes and leads to a reduction in the material available for electrochemical activity [17,19]. The other significant cause of degradation is electrolyte loss; the deposited lithium on the anode interface reacts with the electrolyte, consuming the electrolyte [17,18,19,20].
Though the qualitative or quantitative verification of the degradation mechanisms is optimum, performance studies are mostly static, meaning user defined. Thus, the same analysis should be performed for cells that are aged by realistic profiles. This magnifies the complexity of the study by multiple factors, especially since it is nearly impossible to draw a conclusion from such studies if the cells are from on-road vehicles. This is because of the randomness of driving behavior leading to the involvement of an unknown number of factors contributing to the total degradation. A compromise could be to employ realistic profiles in a continuous manner that enables the control and tracking of performed operations. In this study, a standard vehicle profile formulated as a worldwide harmonized light vehicle test cycle (WLTC) was performed continuously for a couple of years on fresh cells at a high temperature (45 °C). Upon aging of the selected NMC 20 Ah batteries reaching the end of life (EoL) (defined as 80% state of health (SoH) [21]), one cell was selected for the post-analysis. The autopsy of the cell was executed in a controlled environment by extracting the electrode materials safely for detailed analysis. The selected anode and cathode samples were then studied with Scanning Electron Microscopy (SEM) and Energy Dispersive Spectroscopy (EDS) techniques to identify the root cause of the degradation. SEM analysis was compared with fresh material extracted from a new cell to display surface changes at a microscale. The findings were also verified with the conditional aging hypothesis that is available in the literature for NMC/C cell technology. To the best of the authors’ knowledge, this kind of well-defined investigation is rare; it showcases the physical degradation mechanism qualitatively, providing insight into the actual aging phenomena caused by realistic cycling.
The rest of the manuscript is outlined as follows: Section 2 describes the performed electrical tests and results of WLTC cycling; Section 3 includes the post-mortem procedure that was followed to open the commercial cell, describing all the analysis of the samples; and Section 4 concludes with the summary and final remarks.

2. Experimental Background

The studied pouch battery cells of NMC/C technology were manufactured by EIG, had 20 Ah as nominal capacity, nominal voltage of 3.65 V, specific energy of 174 Wh/kg, allow a maximum of 10C discharge pulse, and had a rated 1C charge-discharge lifetime of 1000 cycles at room temperature. The cell composition was 4:4:2, meaning 40% nickel, 40% manganese, and 20% cobalt in the cathode material, while the anode was graphite with additive vapor-grown carbon fibers (VGCF) to improve the electrical conductivity [22]. There were 20 sheets of anode against 19 sheets of cathode stacked in an S-shape with one separator roll [23]. The best compatible electrolyte was found to be BASF LP50 which was a 1 M LiPF6 in 1:1 volume ratio mix of ethylene carbonate (EC) and dimethyl carbonate (DMC) [22].

2.1. Historical Data

For this study, three new battery cells were chosen to conduct the test campaign with a consecutive round of WLTC cycles. The number of cycles was used as a counter that was performed at 45 °C (Cell01 and Cell02) and 10 °C (Cell03) from a start point of 90% SoC after fully charging the cells at C/2-rate within the operating region. A single cycle/test was designed to run for 24 h with two types of WLTC profiles. The stressful suburban profile imitated the high and extra high-speed driving behavior shown in Figure 1 (a single cycle was in the inset). The other cycling type refers to the complete driving behavior (urban and suburban) that was a mix of slow and high-speed driving. Cell01 experienced the more stressful first type while the other two cells performed the second profile, but both the dynamic current profiles had a maximum 1.4C and 2C charge and discharge, respectively. The standard charging rate at the end of every cycle was set to C/2 as per the specification and the same rate was used to check the capacity after every round of dynamic cycling. The hybrid pulse power characterization test (HPPC) was also performed to keep track of the internal resistance of the cells. For detailed information on the test procedures, the readers are encouraged to review the authors’ previous work [24]. The basic equation that was used to identify the SoH of the cells was
SoH   cap / IR = Actual   capacity   or   IR BoL   capacity   or   IR × 100 %
The SoH of the cells was traced periodically considering 80% as the end time for SoHcap and 200% for SoHIR [25]. Table 1 lists the overall performance of the cells until the EoL was reached. Both the SoHcap and SoHIR were triggered at the same time after the last round for Cell01, completing 2184 day-long cycles. For Cell02, the less stressful profile resulted in a longer performance, completing 3468 cycles and 3060 cycles following SoHcap and SoHIR EoL, respectively. In contrast, the dynamic cycling performance was much better at cold temperatures (10 °C) as the cells did not actually experience capacity drop, but instead the IR growth was 42.5%. Such a cold temperature performance was also reported in the authors’ previous work where standard constant charge-discharge profiles were investigated on the same cell type.
All the cells were cycled with PEC-manufactured battery cyclers and the test temperature was ensured by using CTS climate chambers.

2.2. Selected Results

The elevated temperature cycling of the cells produced compelling results that required further analysis to identify the signals associated with the possible aging mechanisms. Thus, the high-temperature (45 °C) cycling was analyzed further as they displayed the most interesting performances. If the capacity and IR evolution are plotted together (as shown in Figure 2), Cell02 presented a better result due to the less stressful profile type. It performed 40% extra cycling compared to Cell01 and considering SoHIR EoL. Here, the Figure 2 axes were plotted in terms of capacity fade (left) that drops from 100%, and IR growth (right) that increases from 0%. In contrast, continuous high-frequent charge-discharge currents at high temperatures degraded Cell01 faster which fell in the last round. After performing 2160 WLTC cycles, Cell01 had an 8.7% drop and 314.3% growth in the SoHcap and SoHIR, respectively, during the last 24 cycles. This result displays a consequent sudden failure in the operation preventing further cycling. For this reason, Cell01 was selected as the preferred battery to have a more detailed look at the cycling results to perform post-mortem and qualitative sample analysis.
The Cell01 overall cycling depth was 42% (from 90% to 48% SoC) after which the battery was always charged to 90% SoC completing one 24 h long cycle. The study temperature was fixed at 45 °C both for cycling and check-up tests which inversely contributed to the remaining capacity. As a result, the cell experienced a 19.2% capacity fade after 15 cycling rounds (=2160 cycles). Figure 3 presents the charge capacity evolution of the cell over time which clearly shows the loss of lithium inventory during the cycling rounds. This figure also displays the descending trend in the capacity fade both during charge and discharge, showing a high coulombic efficiency with the almost overlayed lines. However, the growth in the internal resistance could only be quantified by a physical model or verified through post-mortem, potentially finding high-temperature degradation traces such as electrolyte/SEI/binder decomposition and further SEI formation [26,27]. Moreover, the sudden failure in the last round might have triggered the associated mechanisms harshly, but the impact was not visible in the measured data.

3. Post-Mortem Analysis

The opening of a cell could provide direct insight into the electrochemical system, shading light on surface morphological changes and chemical depositions. However, to identify crucial degradation signs, a proper disassembly strategy should be followed considering safety, material deformation, and environmental concerns [16]. Further in this study, visual inspection, SEM and EDS were selected for the post-analysis of the carefully harvested electrode samples. A new cell was also disassembled to compare the surface micrographs by optical microscopy.

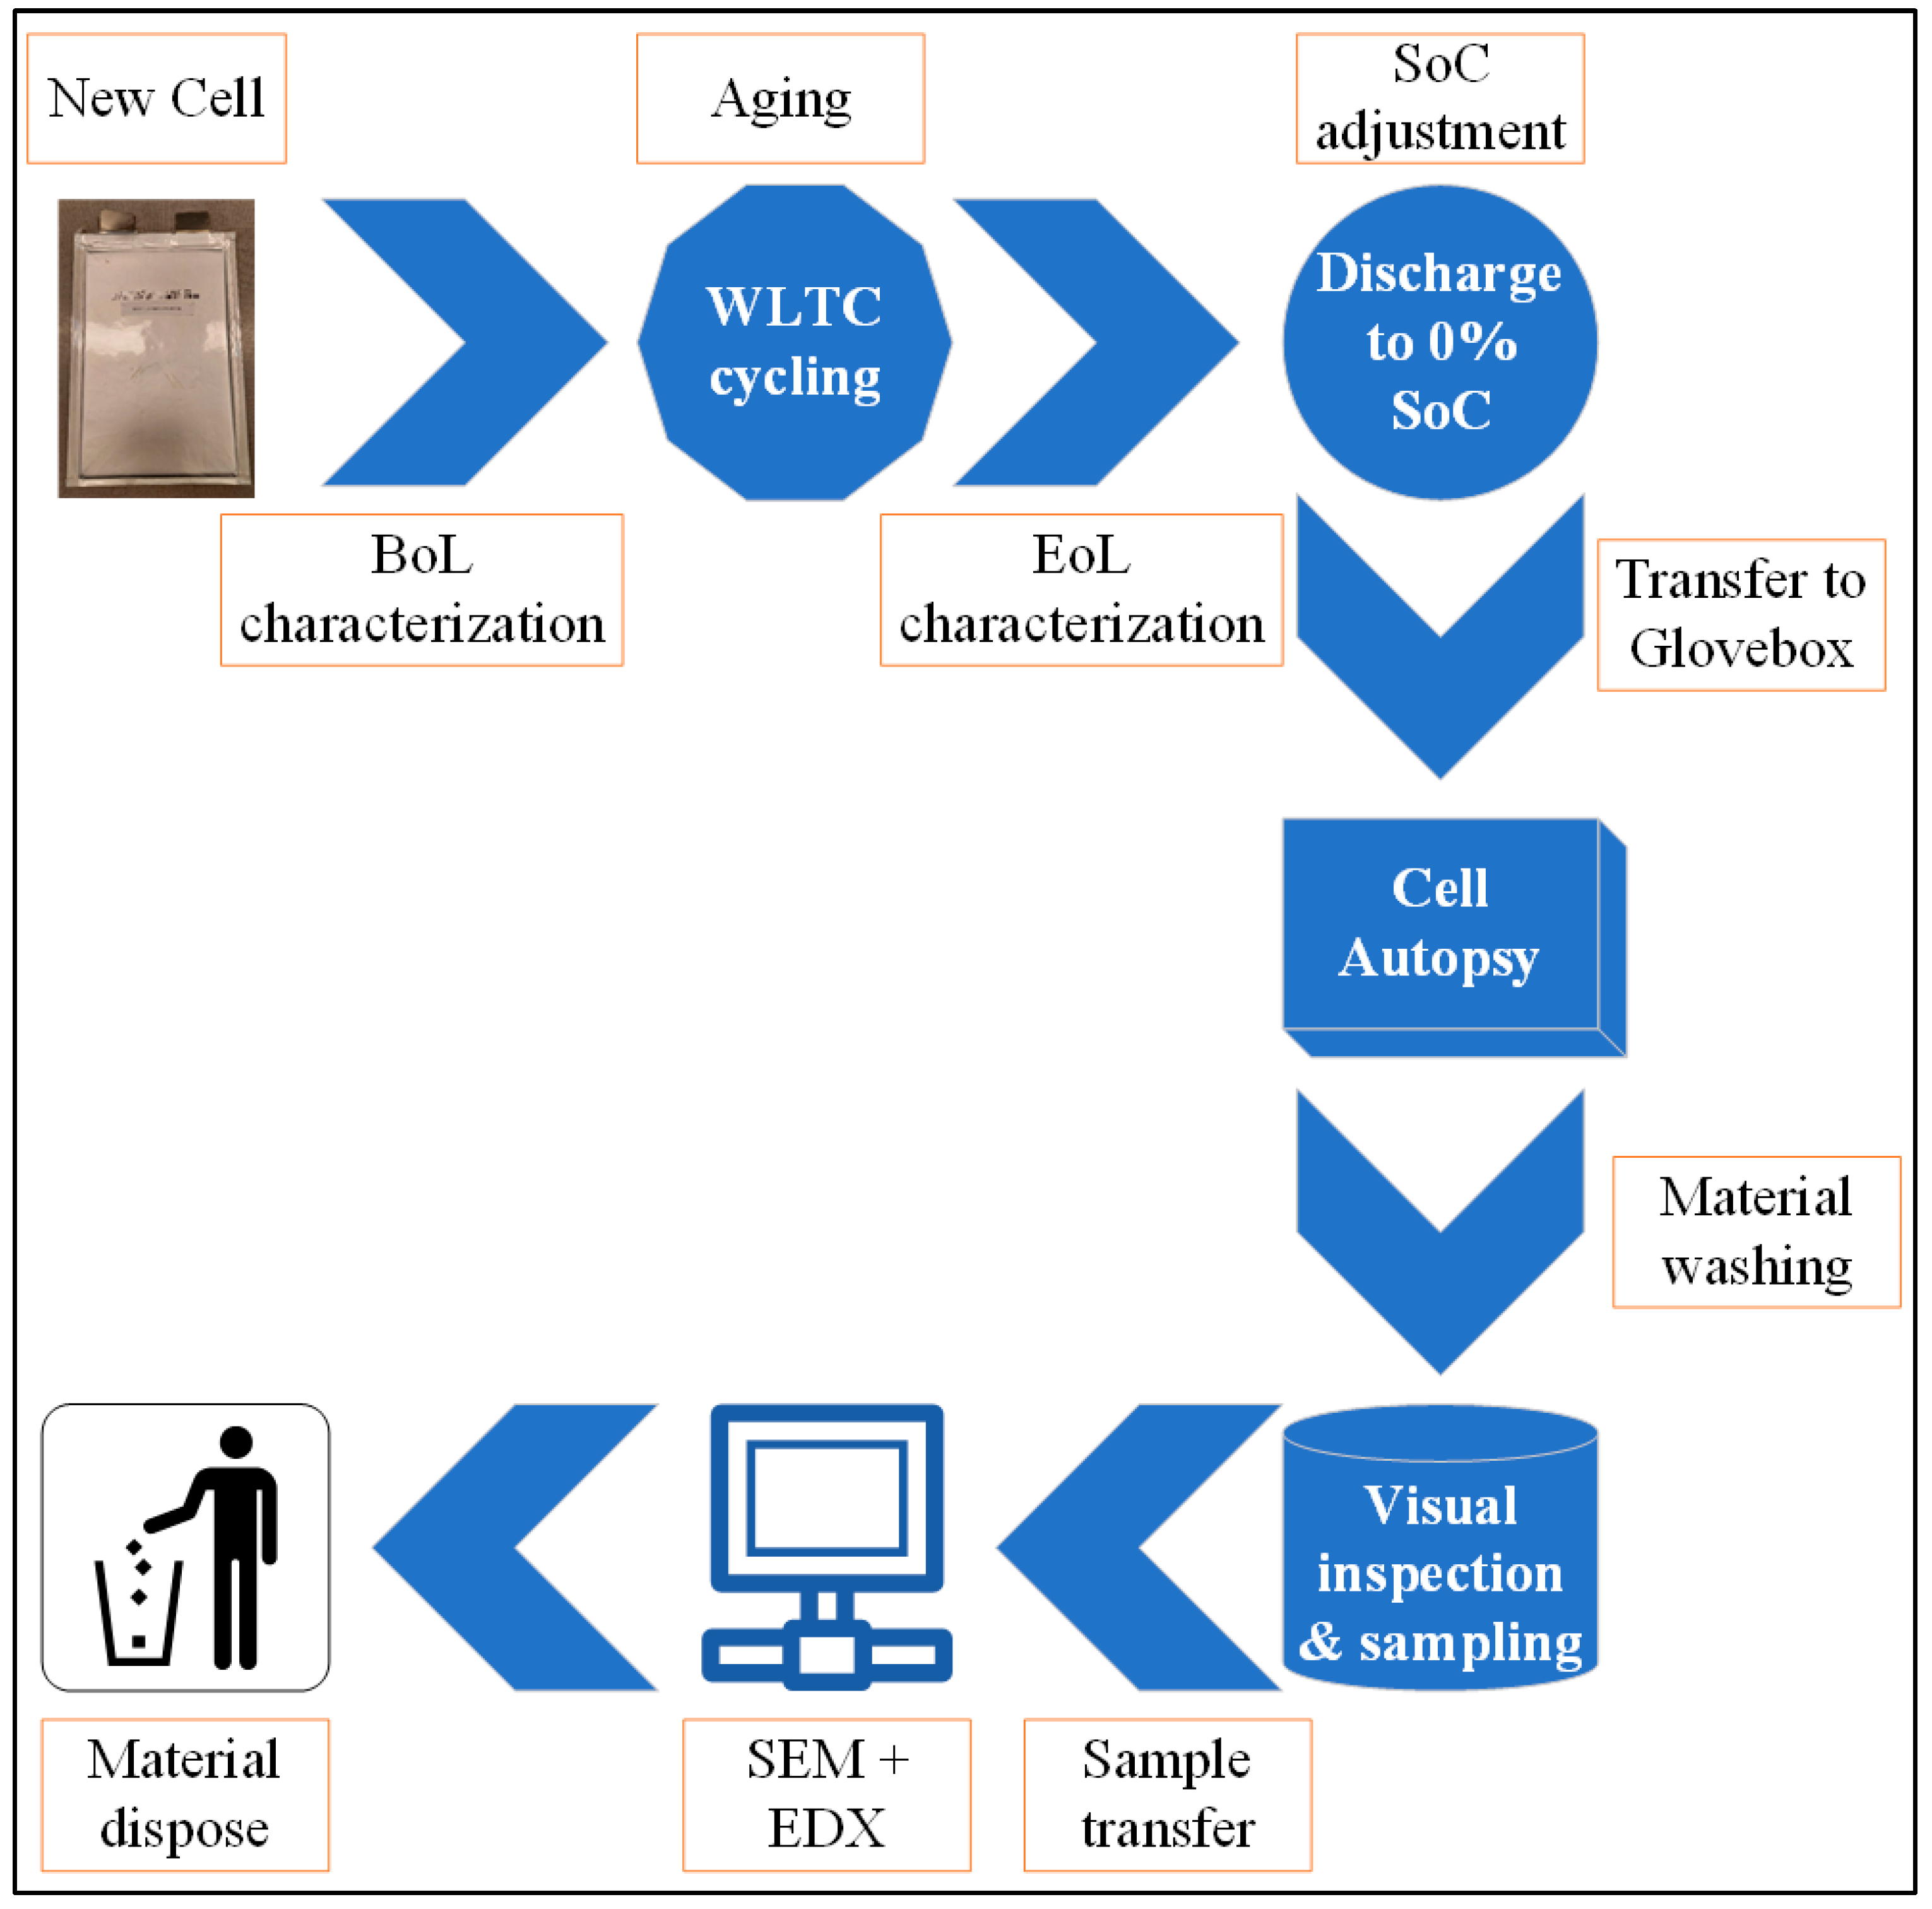
3.1. Autopsy Preparation

In this work, the detailed protocol followed to open the cell and prepare samples is described step-by-step in the following points. The workflow is displayed in Figure 4.
  • Cell01 was first discharged completely as the post-mortem activity of the cell was conducted at 0% SoC. It was discharged with a very slow constant current rate (with C/20) and then the voltage was kept constant at 3 V (with C/200 as the cut-off). The intention was to ensure complete de-lithiation, keeping the voltage stable at around the minimum cut-off of 3.0 V (±0.01). A deep discharge also reduces the risk of any potential thermal runaway.
  • The cell was transferred and disassembled inside a safe and stable environment. An Argon-rich glovebox with controlled environment (O2 < 0.1 ppm, H2O < 0.1 ppm) was used for the cell autopsy. This was because the metallic lithium and some cell components react with moisture content and/or oxygen when exposed. The pouch cells are usually easier to disassemble. In this case, ceramic scissors were used to cut the pouch edges and sides of the cell to avoid short-circuiting.
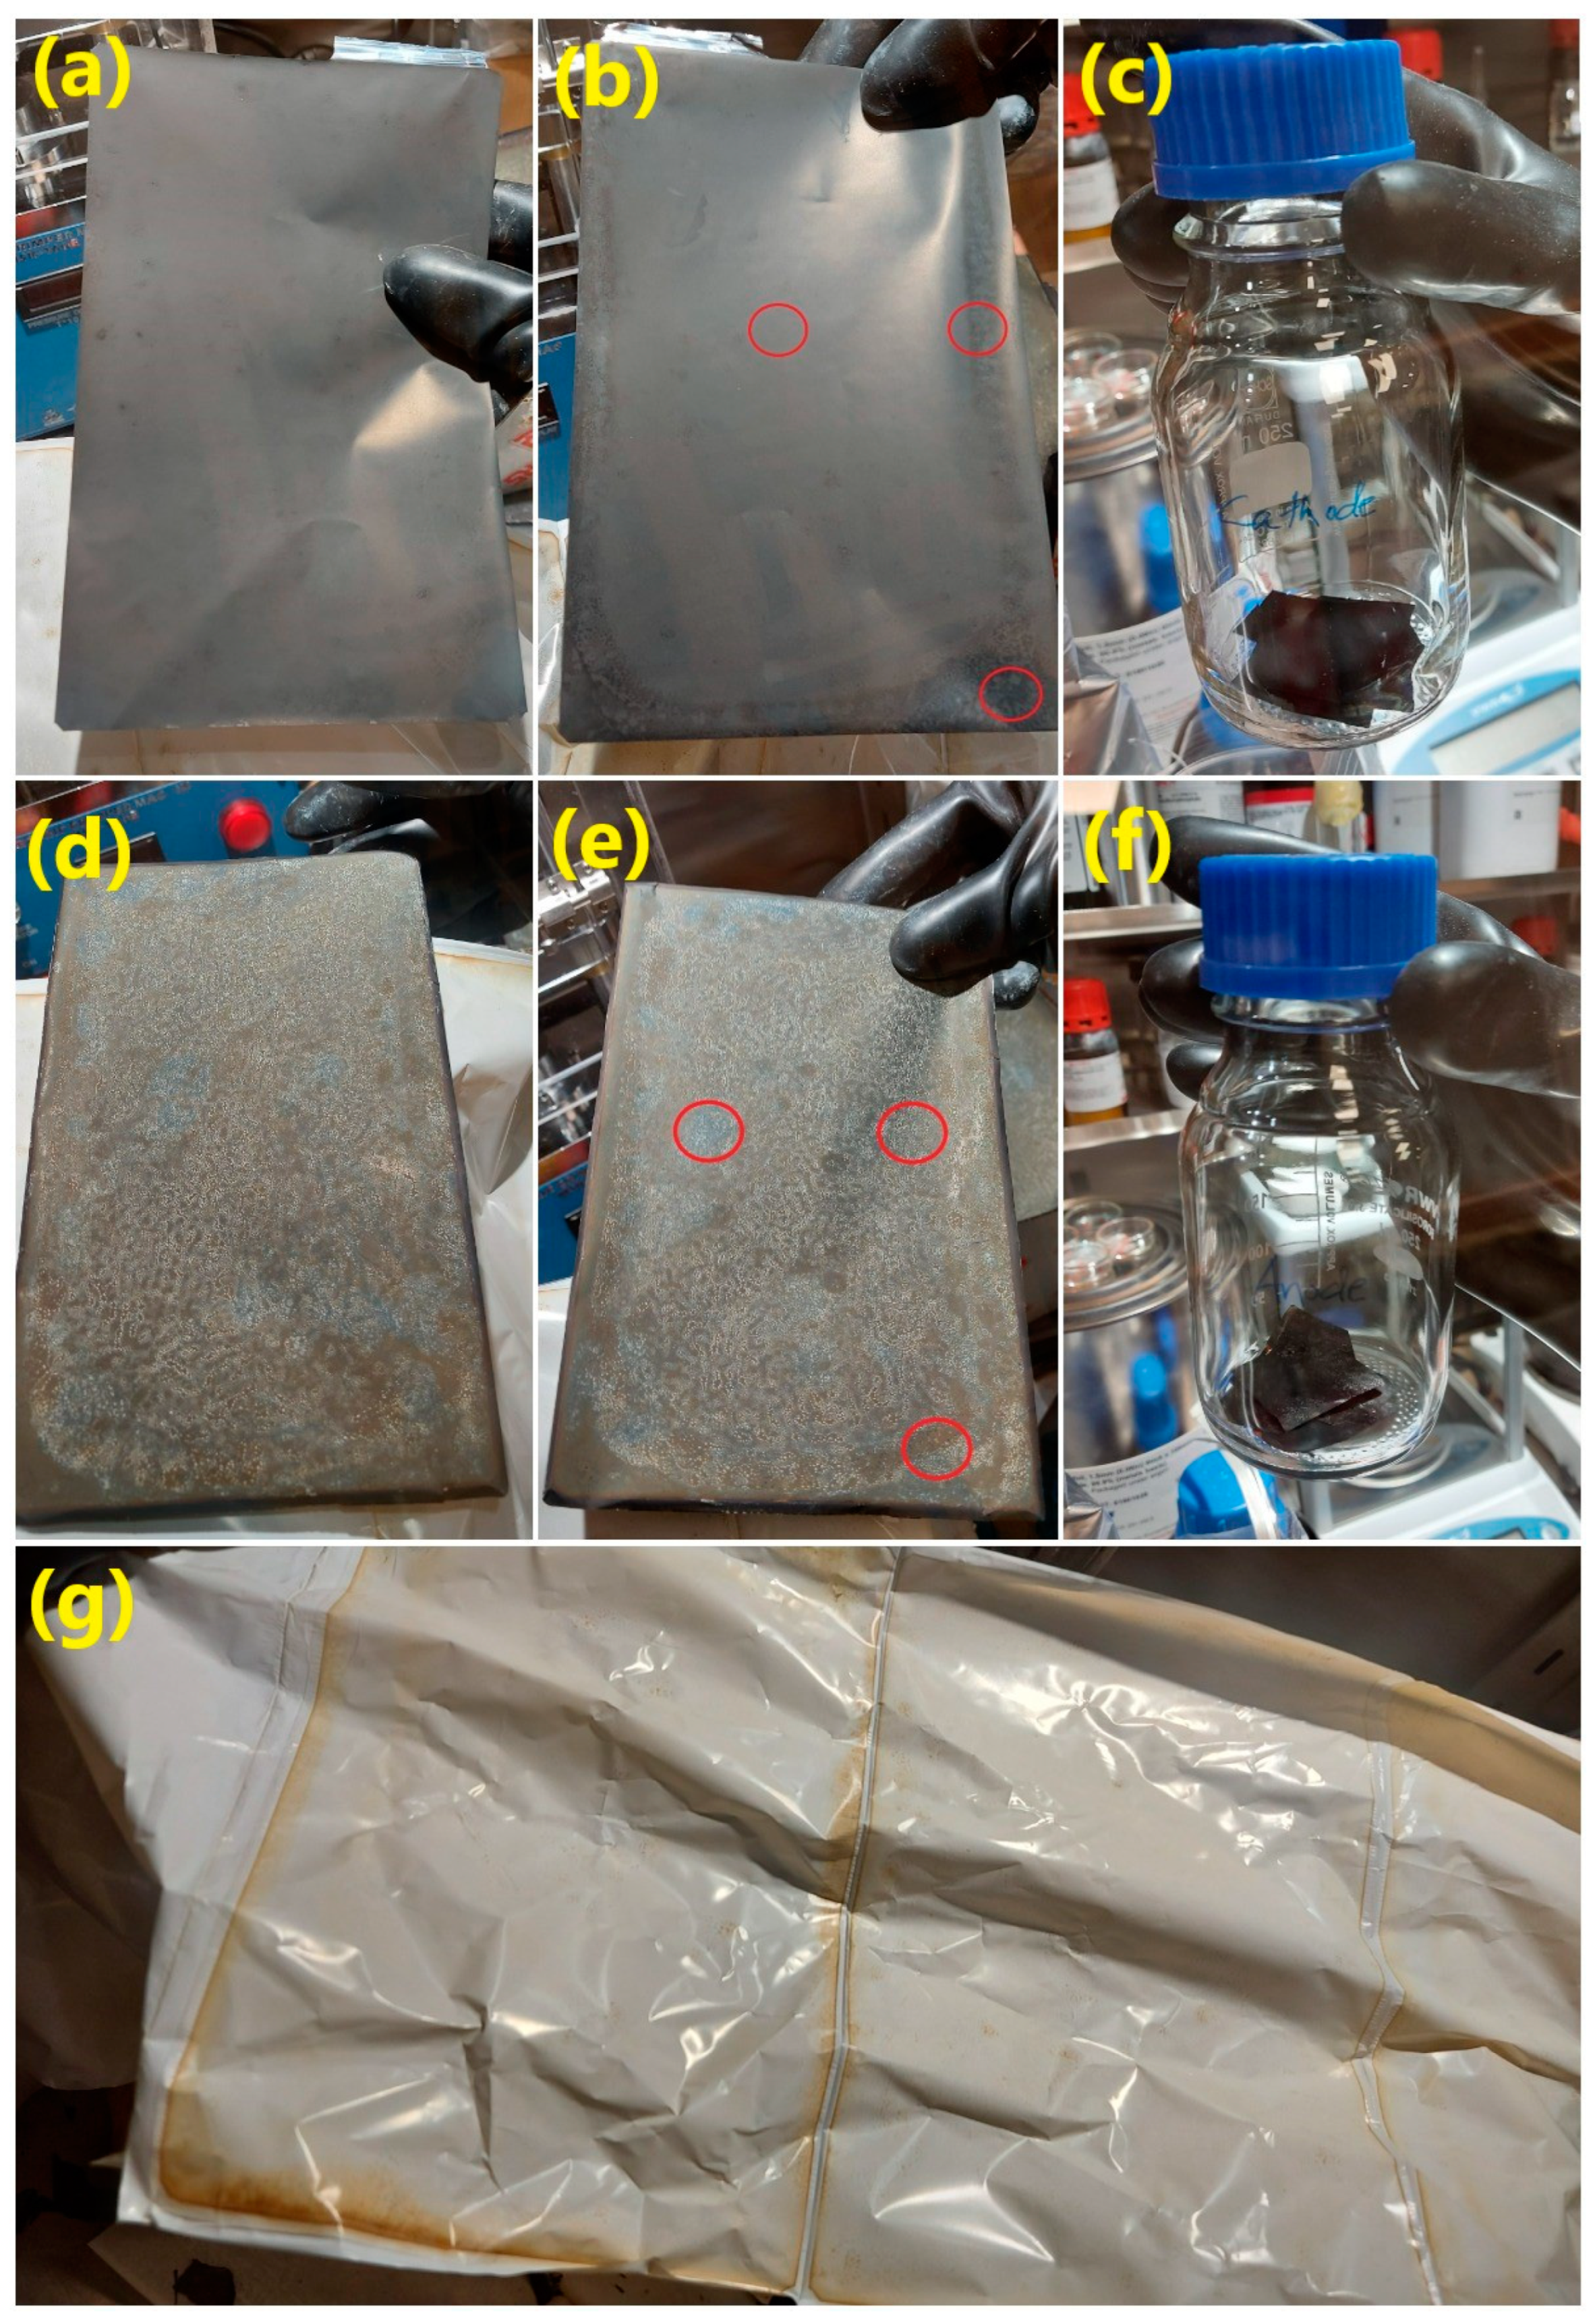
  • After safely rolling the separator out, the anode and cathode sheets were detached from the stacked design for sampling purposes. Due to the long operational life at 45 °C, the electrolyte was found to be mostly dried out or decomposed. Thus, the focus of the study was kept on the negative and positive electrode analysis. Figure 5 displays the extracted anode and cathode sheets from which the samples were harvested, as shown in Figure 5c,f, respectively. The cell had a total of 19 cathodes and 20 anode sheets that were previewed to be degraded inhomogeneously. It was also found that the anode area was 11.6% larger than the coated cathode surface [22].
  • The electrode samples were harvested from the 16th and 17th sheets for anode and cathode, respectively, as they looked visually interesting due to a few colored regions (bluish) or having distinguishable corners. The 15 mm cut samples were rinsed a few times with dimethyl carbonate (DMC) to remove electrolyte residuals and vacuum dried. The samples were left under vacuum in the anti-chamber of the glovebox overnight to dry completely considering the low contamination area.
  • The dried samples were then transferred into bottles for further analysis within air-tight Ziploc bags that necessarily ensured no air contact.

3.2. Physico-Chemical Analysis

The evidence of aging on the collected samples could be investigated through many techniques, such as electromagnetic radiation via X-ray, radio wave, and electron emittance, etc. In this study, visual inspection followed by SEM and EDS were considered to provide a deeper look into the localized samples. The Joel JSM-IT300 SEM device was used for imaging and Oxford Instruments software was used for the EDS analysis.
Before opening the cell, there was no sign of external damage, electrolyte leakage or swelling. Visual inspection of the cell components was done immediately after opening the cell inside the glovebox. Cell components were separated in order to analyze them separately (Figure 5a,d,g). For cathode, darker areas at the edges of the aged cathode sheet were observed (Figure 5a,b), while the center did not show any visual differences in respect to the fresh cell. Similarly, the anode also had a darker area at the edges (Figure 5e). This may have indicated that the area on the edges of both electrodes was not actively participating in the cell cycling. However, other characterization tests need to be performed to make an effective conclusion. The graphite anode sheet had a few, shiny silvery spots in the center which usually refers to an indication of lithium plating [28], but the powder-like layer makes it difficult to prove anything. Further analysis is also required to identify the localized information of the heterogenous, bluish regions’ distribution on the anode sheet.
The separator was found to be mostly dry, meaning a very low amount of electrolyte was found in the cell autopsy. The loss of electrolyte might be the result of continuous cycling and/or long-time storage after EoL. In addition, the separator had dark spots on the edges (Figure 5g) because of electrode sheets that stuck to the separator over time [29].

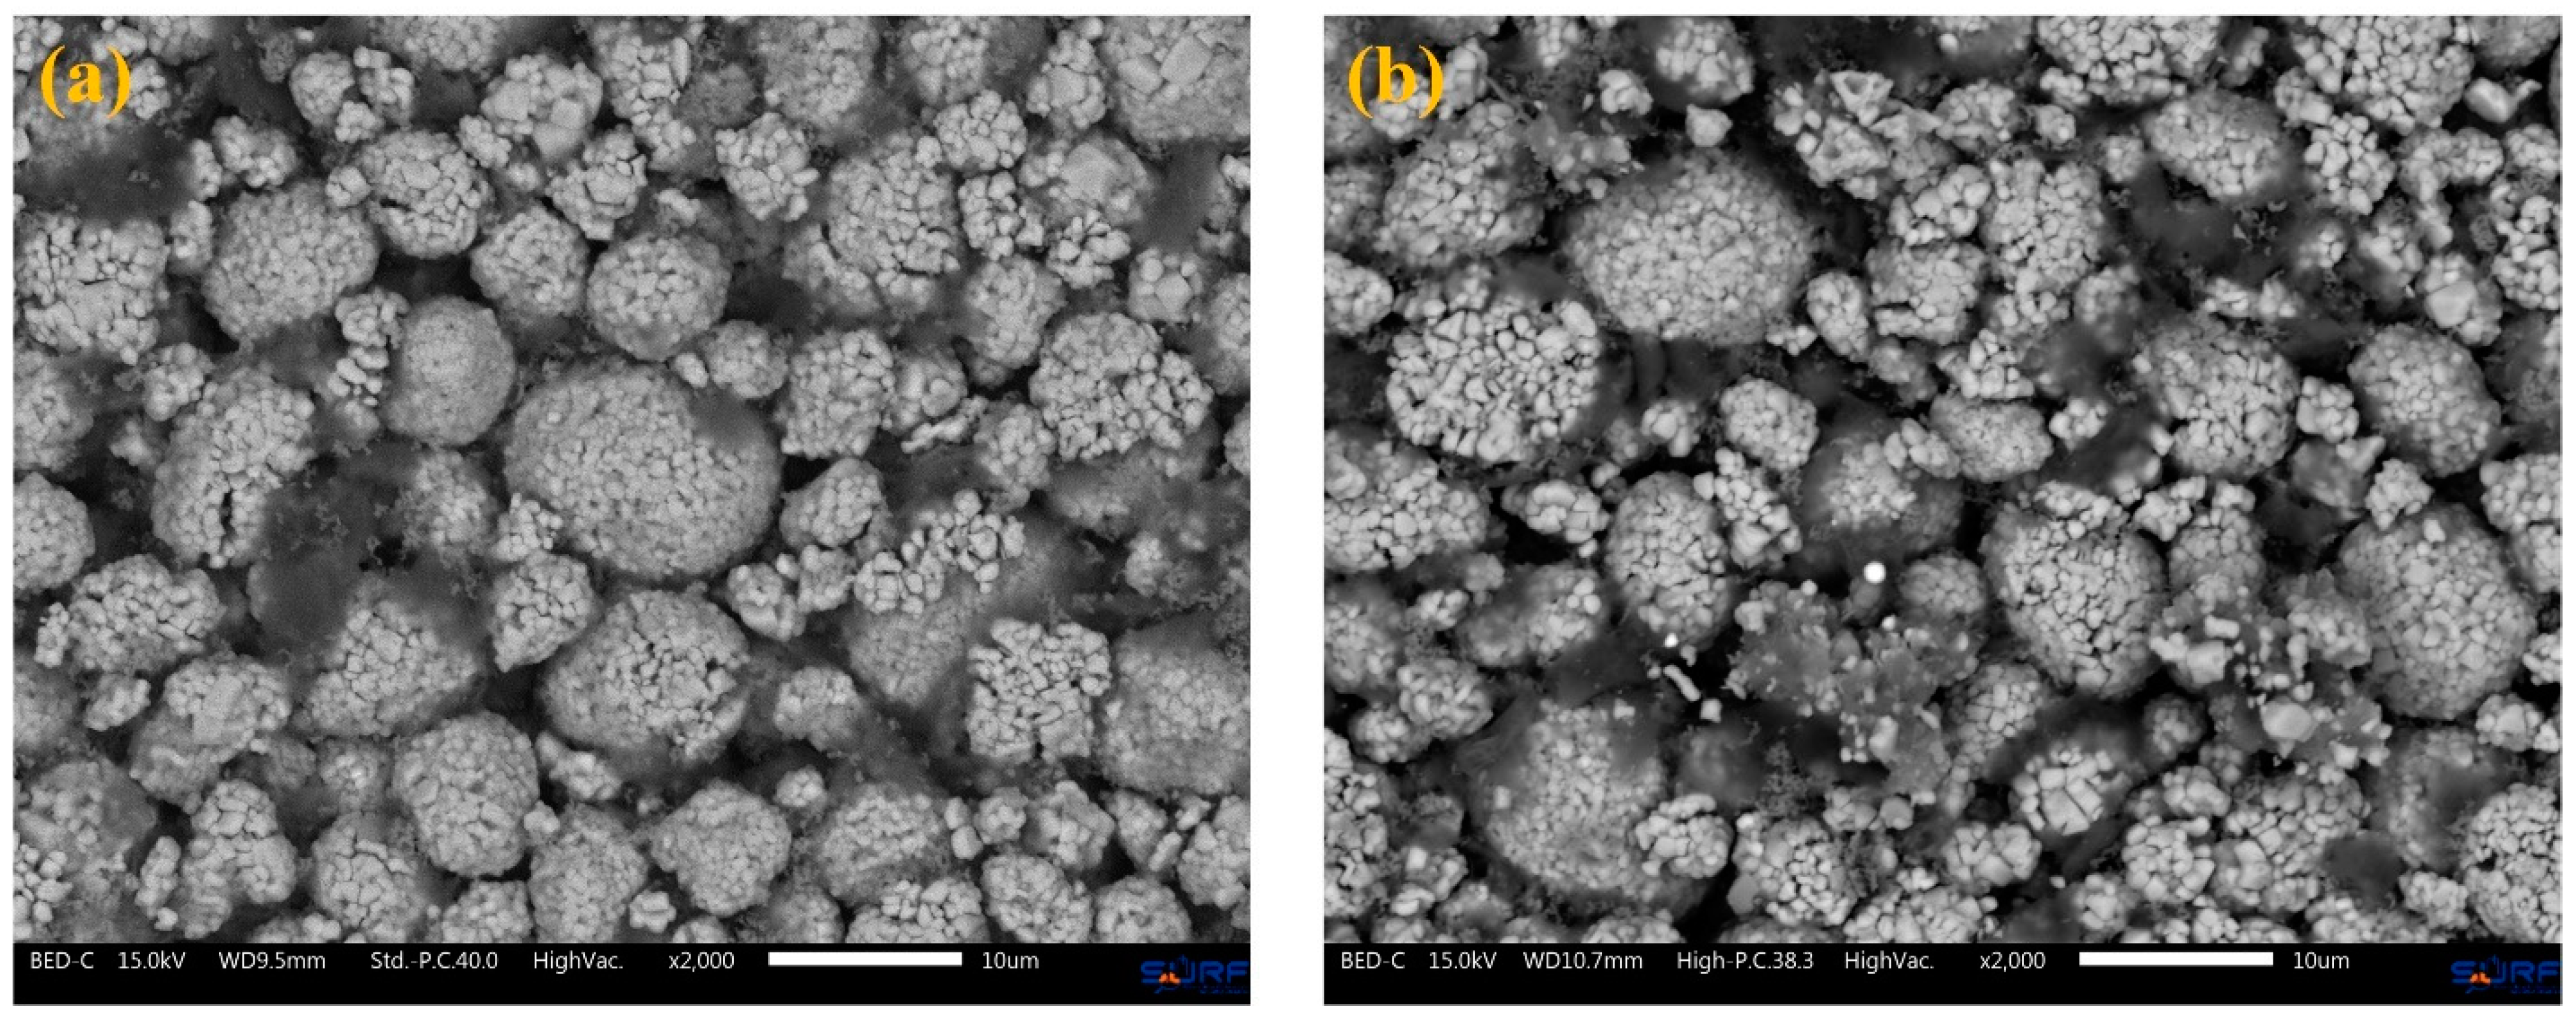
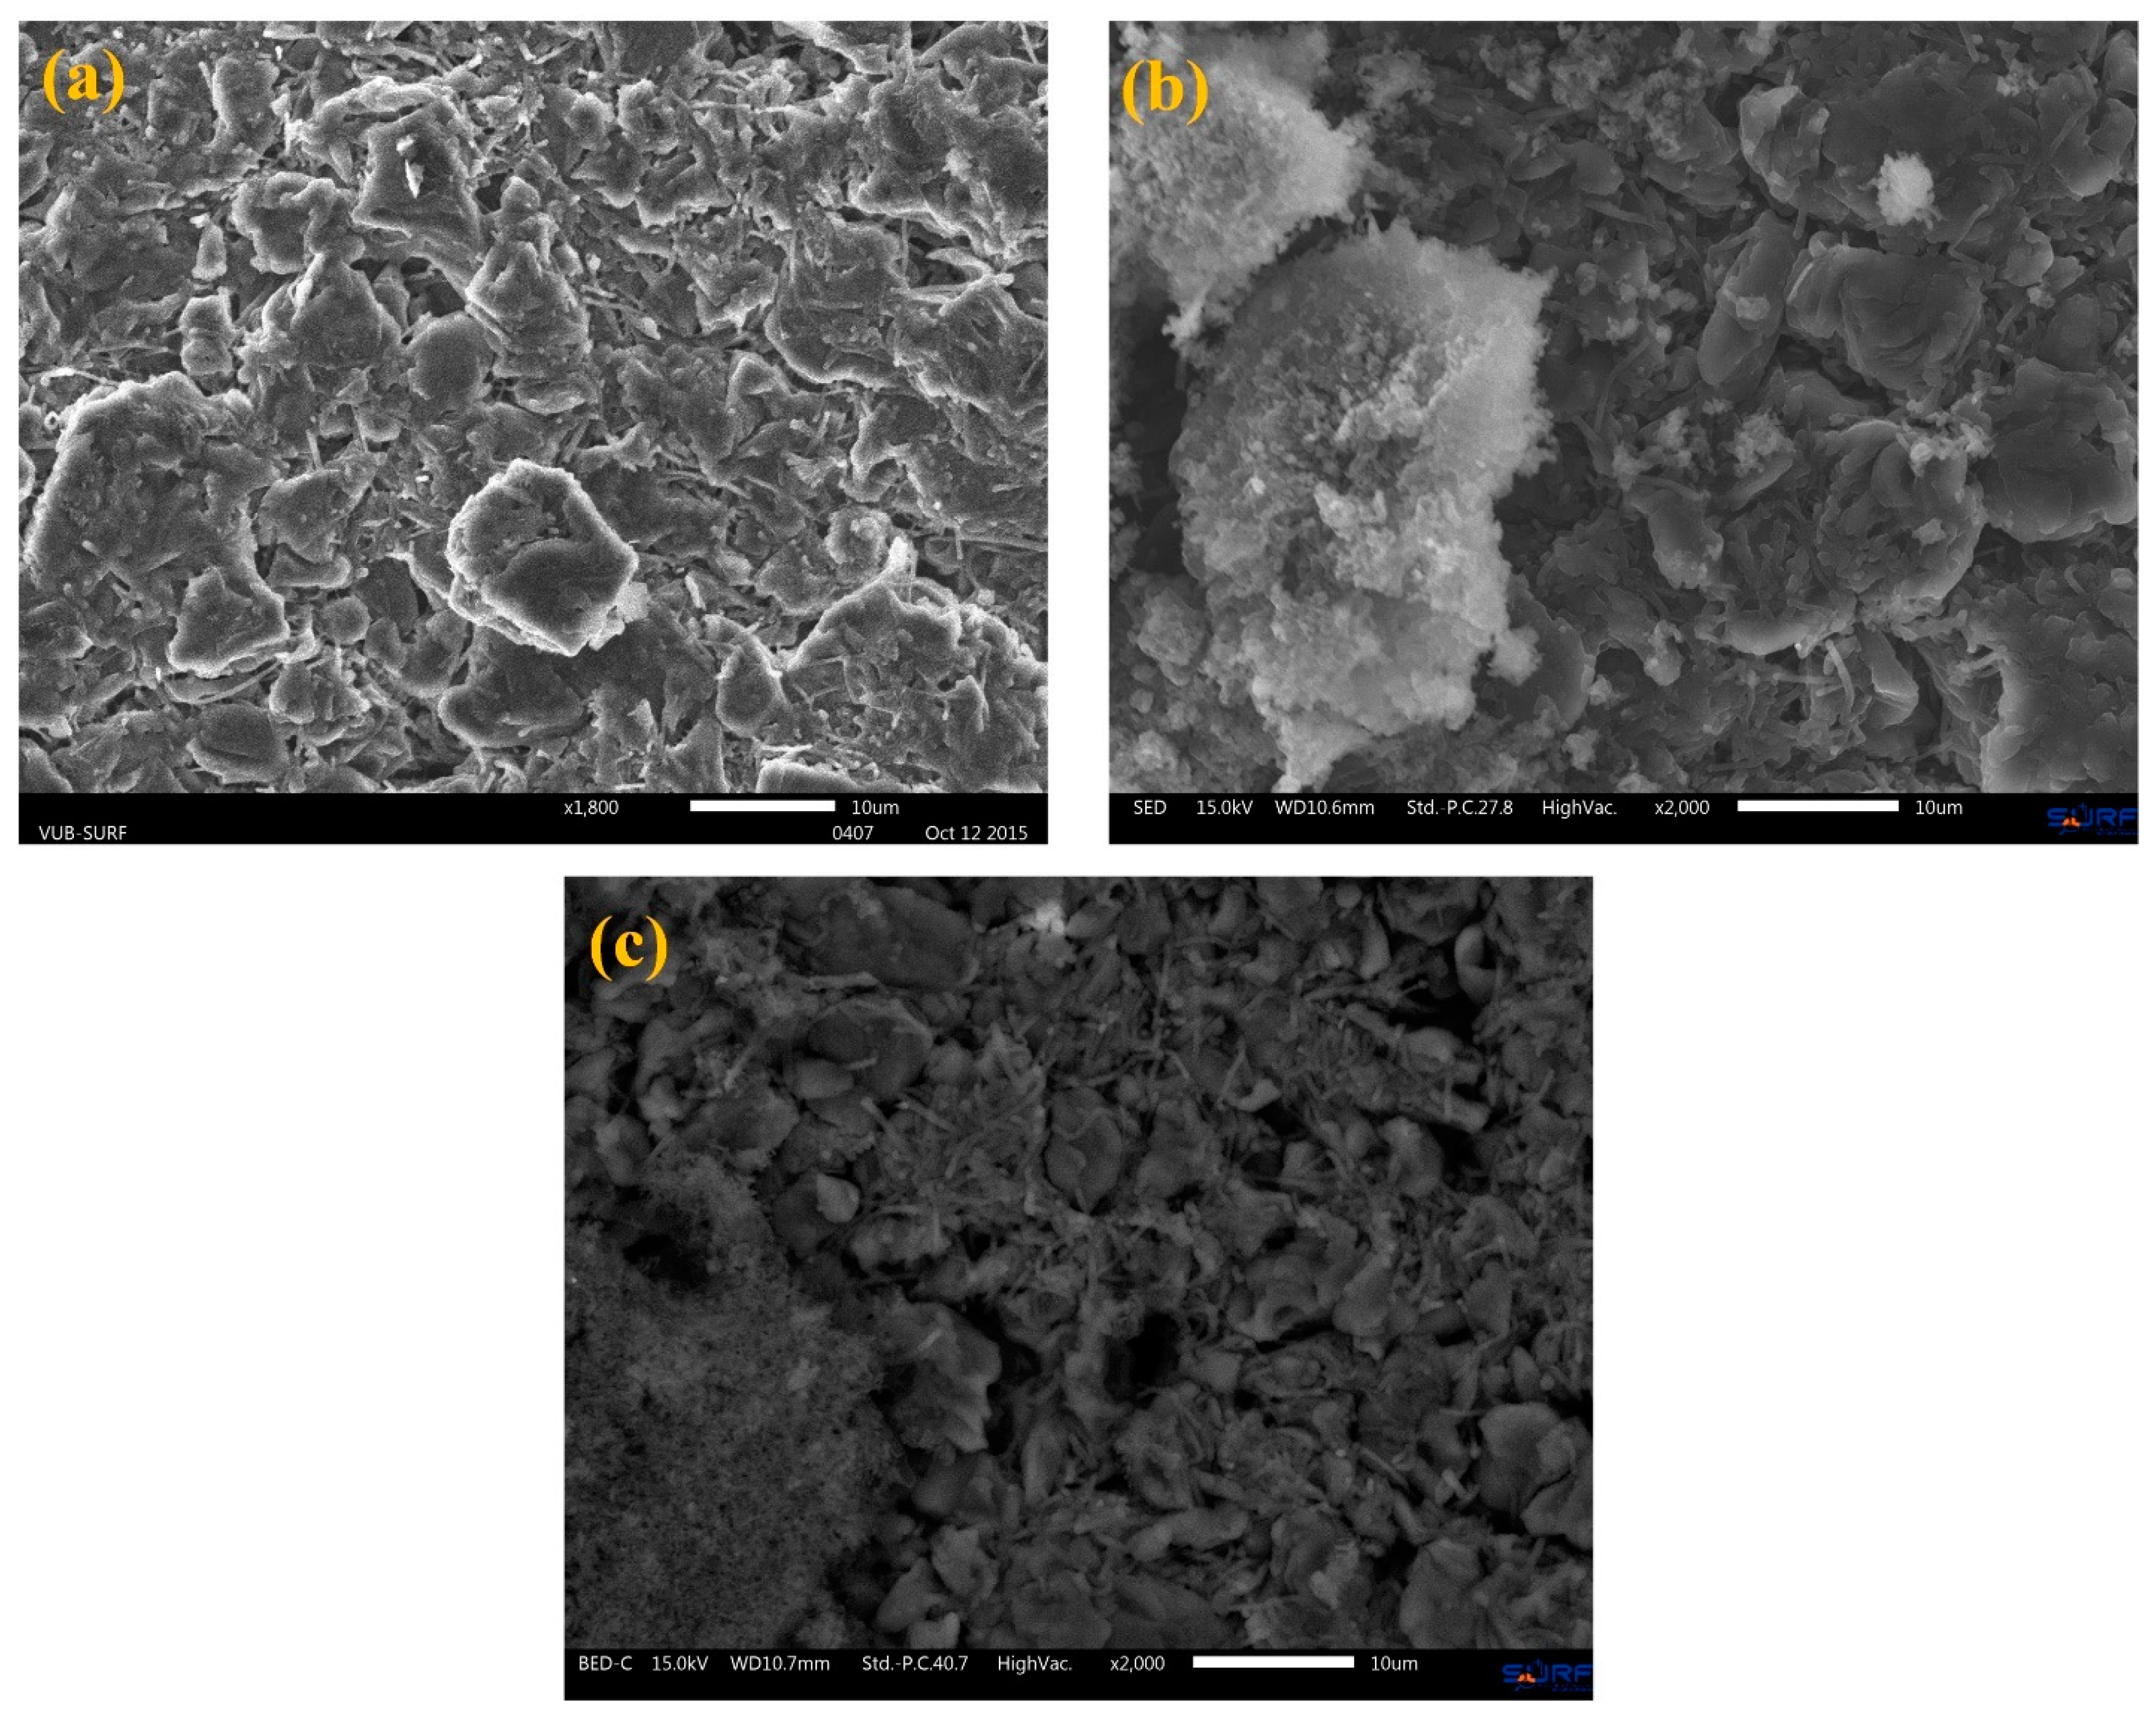
3.2.1. Scanning Electron Microscopy (SEM)

SEM provided high-resolution imaging of the harvested sample surface. For comparison purposes, the new cell’s SEM images were compared with the aged Cell01 images both for negative and positive electrode materials. The new cell refers to a non-aged cell that has experienced no load, and the electrode sampled was collected following the Figure 4 autopsy steps (excluding aging). Figure 6a,b presents the 10 µm images of new and dynamically aged cells, respectively, where cracks in the aged particles seem to be one of the mechanisms that could be visualized in the cathode. Cracking of the cathode particles seemed to be the main reason for loss of active material, which contributed to the drop in charge capacity. These results are in good agreement with the cycling results shown in Figure 3. Though it has been reported that constant current charge-discharge cycling does not significantly change the cathode morphology [5,30], in this case of dynamic aging, the current rates and/or volume changes during the positive electrode lithiation process had a visible impact. The mechanism of electrode particle cracking due to the current load has already been identified by [11] and supported by several studies [31,32,33]. Thus, it is safe to suggest that the performed dynamic cycling might also result in cathode particle cracking as has been supported with this analysis.
Figure 7 shows the changes in the anode images taken from new and aged sheets. The bright new cell anode in Figure 7a was completely in contrast with the aged figure that had evident proof of degradation. The micrograph from the aged cell sample (Figure 7b) presents a darker shed with a pinch of white cloud that could be the result of deposited materials. The composition of such materials was identified by the local EDS analysis described later in this study. The back-scattered image in Figure 7c also shows the presence of unwanted reaction products [34]. Similar events were available for other samples too; however, the obtained images were only capable of visual detection. For example, the carbon fibers were found to be loose in the aged graphite (probably caused by structural disorder), comparatively; undesired products may refer to side reaction results, white components might be deposited from decomposition or corrosion, etc. To further investigate the volumetric presence and chemical composition, EDS was performed with SEM (backscattered electron) images.
The SEI growth and instability at high-temperature cycling and in a graphite-based cell is acknowledged to be the most critical mechanism for cyclable lithium loss, and the consequent electrolyte decomposition results in internal resistance growth [10,13,35]. However, the stable Li2CO3 formation [26] could only be visible at the nanometer scale [36] which could not be verified with the obtained micrographs in this study, making further analysis necessary.

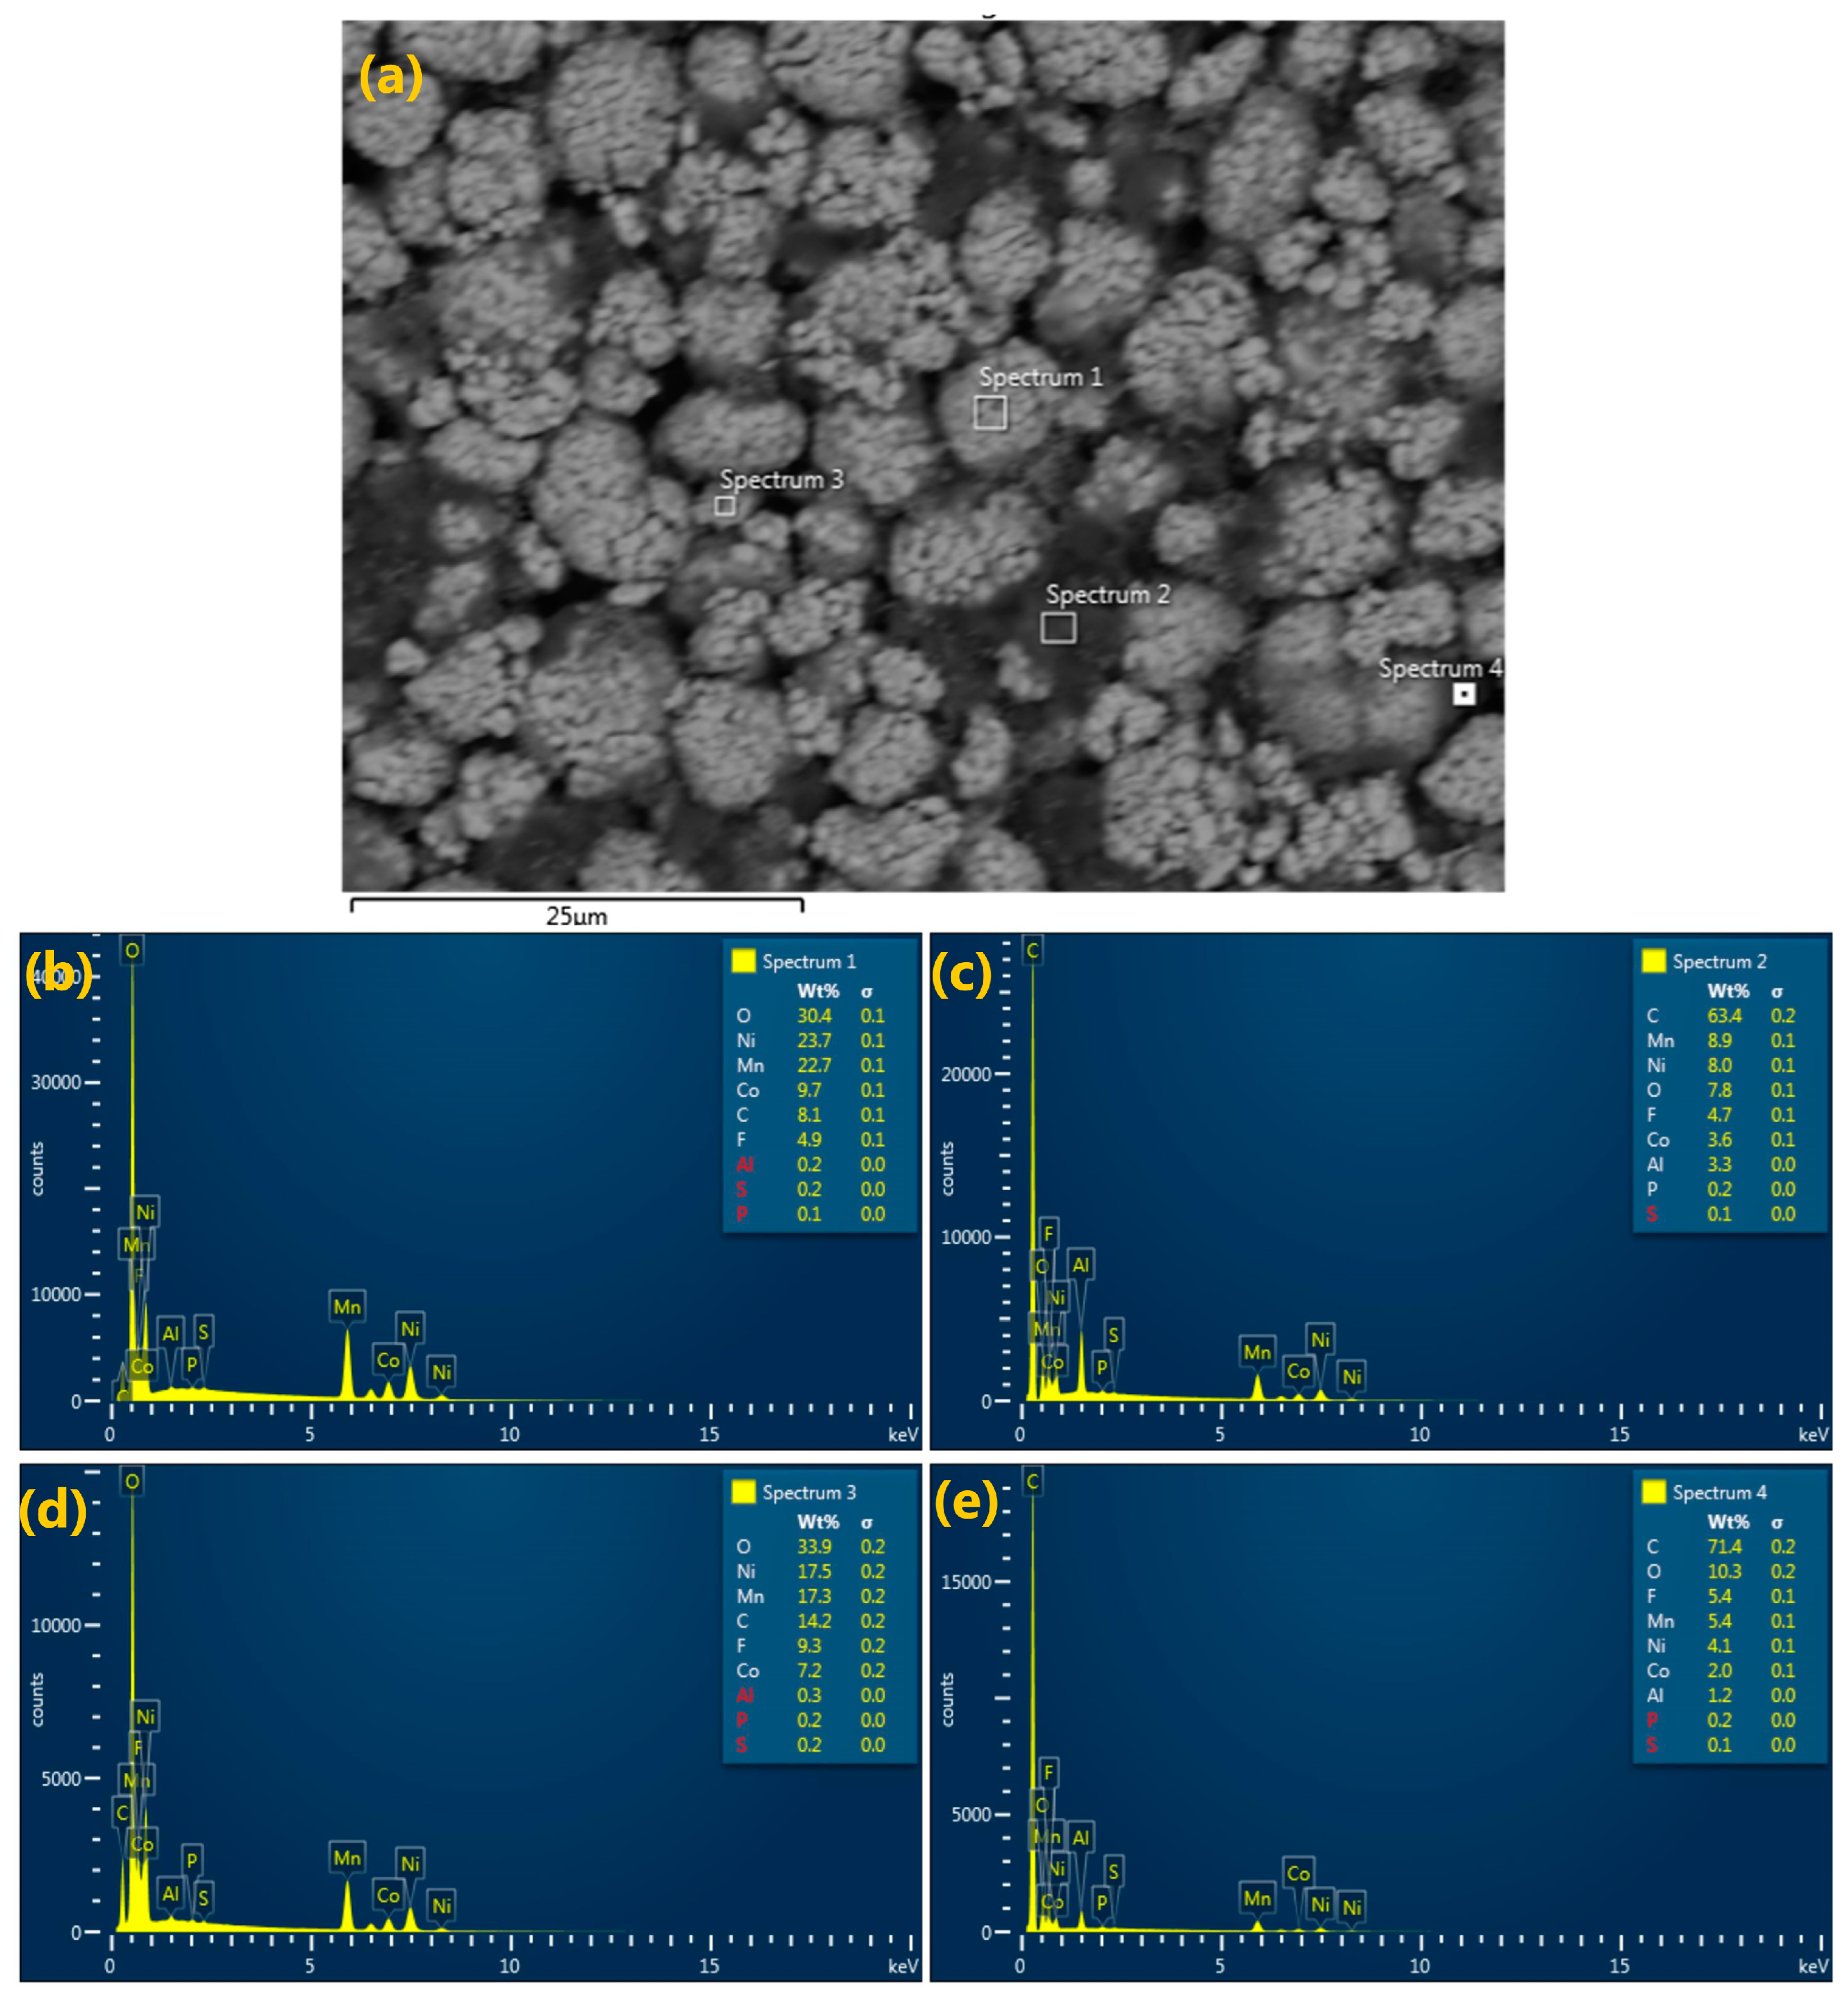
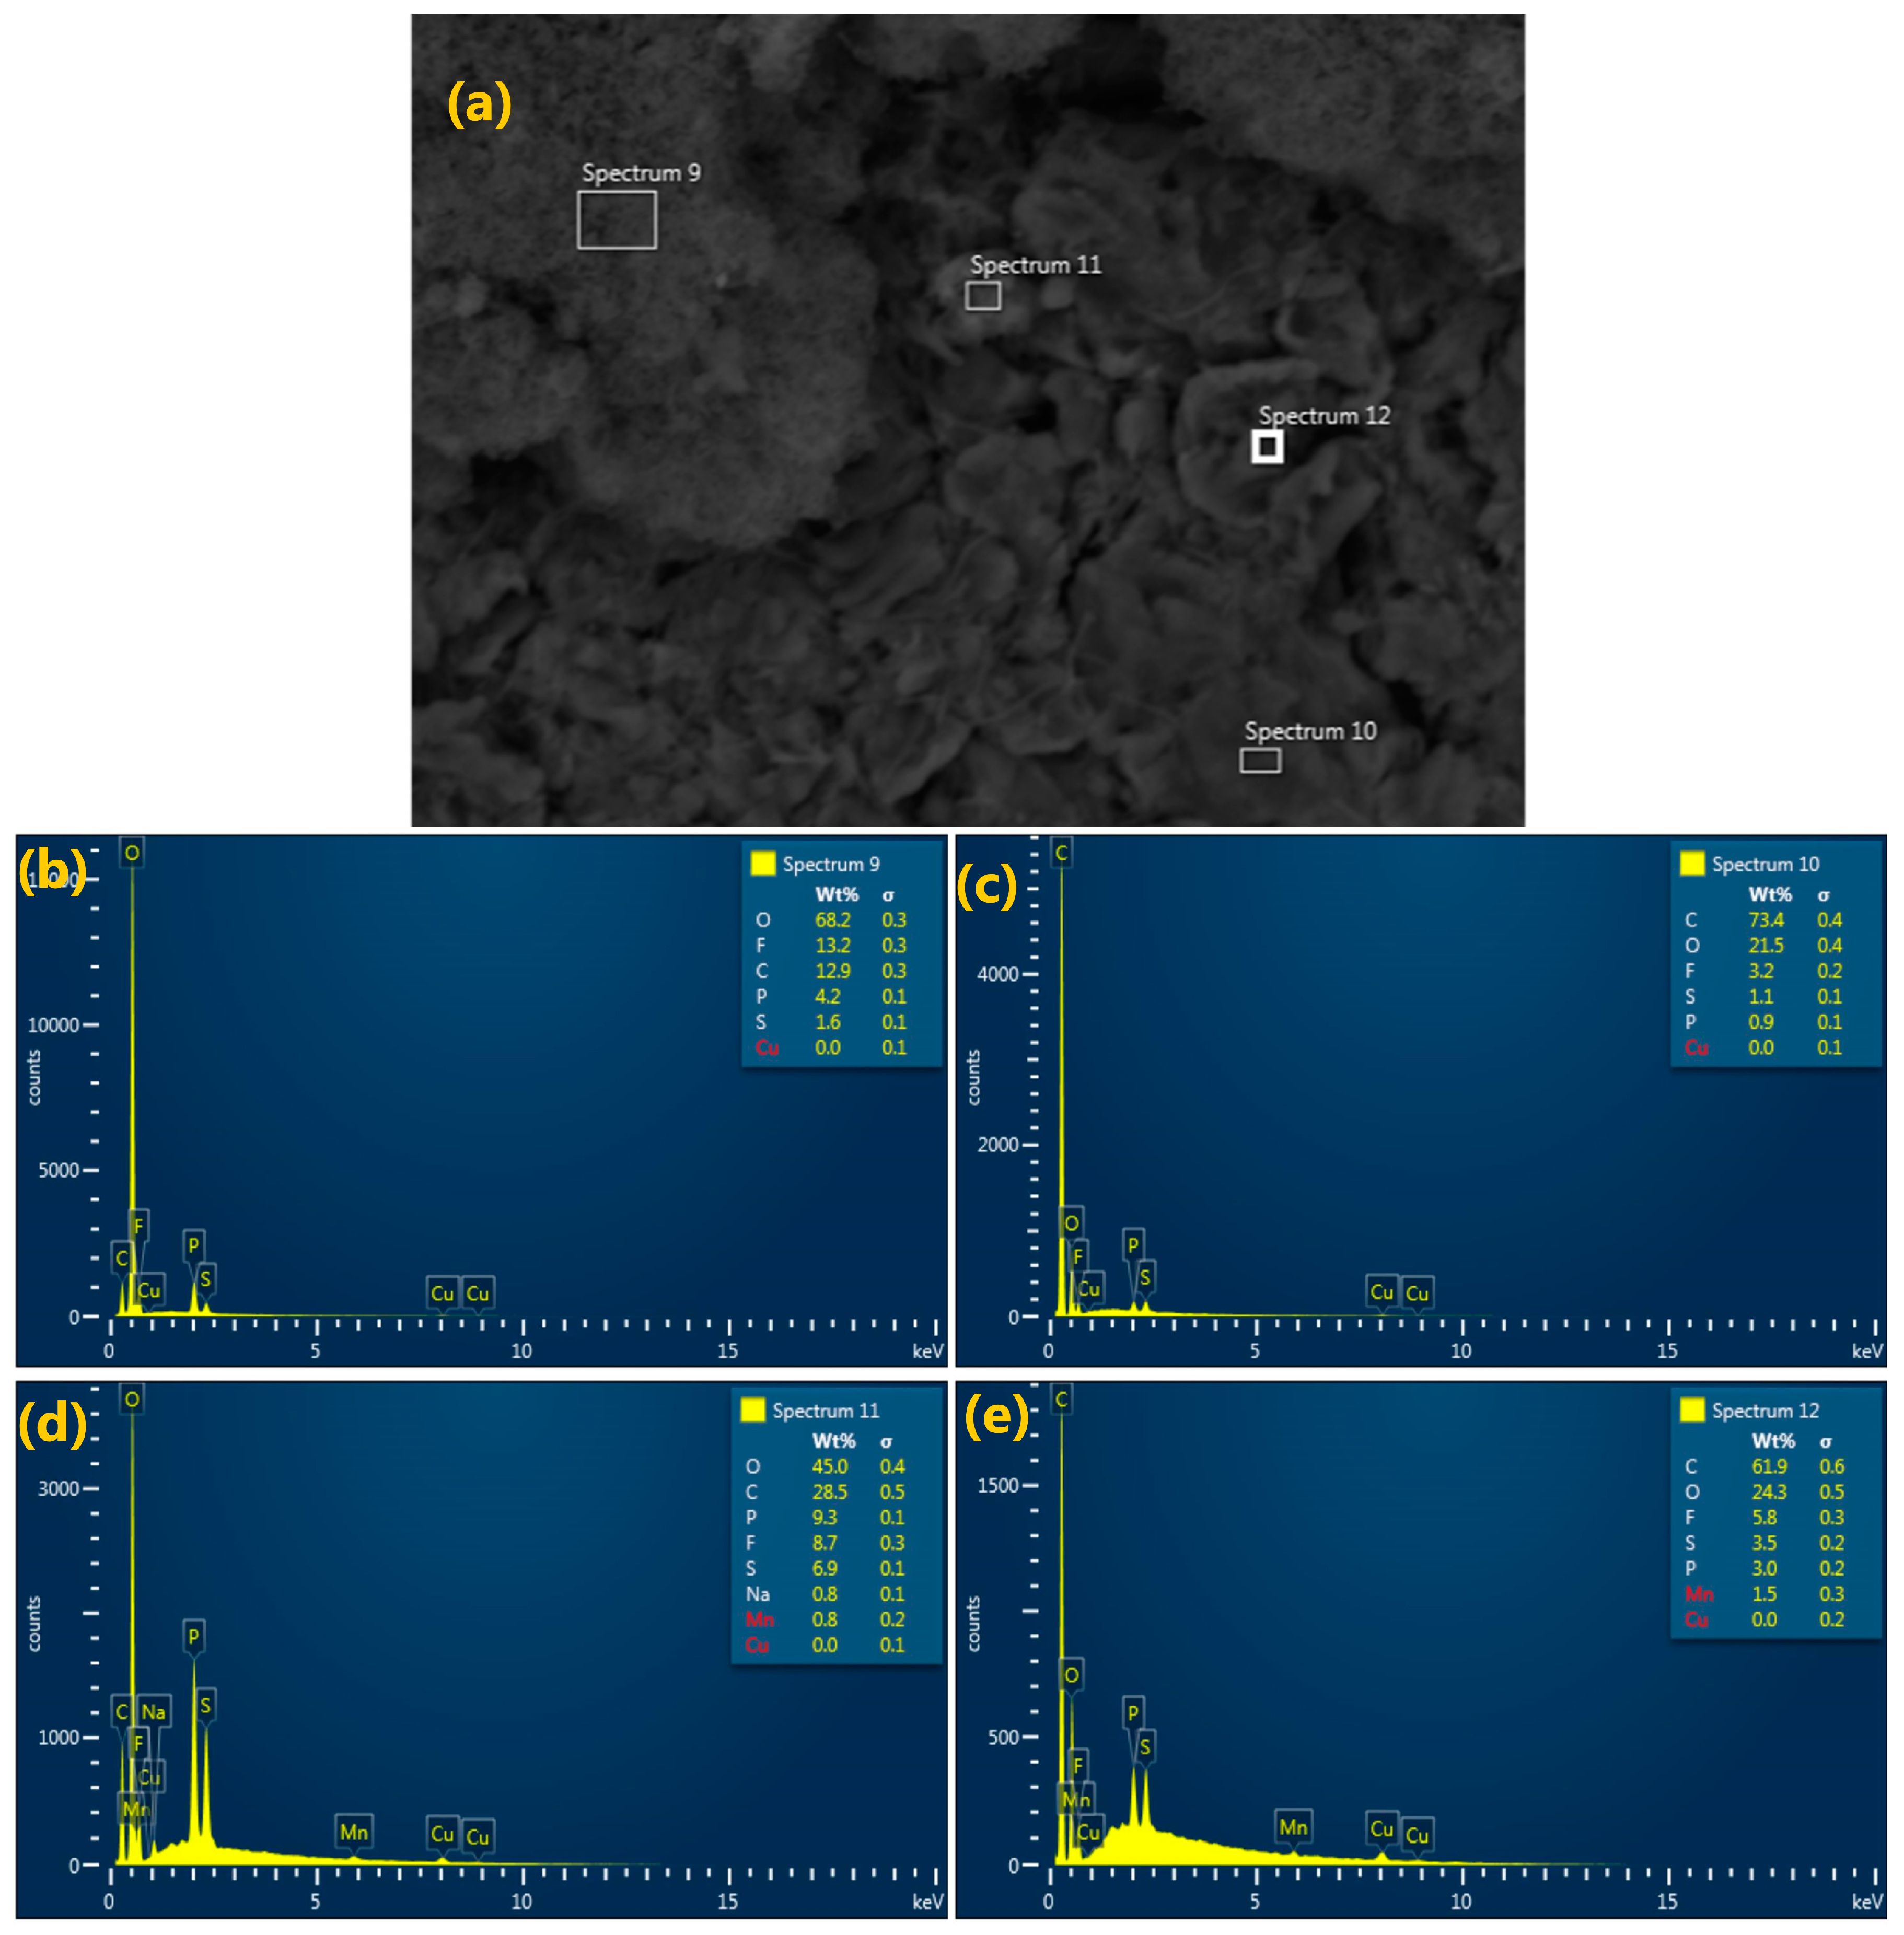
3.2.2. Energy Dispersive Spectroscopy (EDS)

EDS analysis together with SEM reports the chemical composition of a sample location point of interest that can recognize the presence of unexpected materials due to aging. Although EDS analysis is incapable of capturing light materials such as lithium [16], it can potentially confirm the cathode composition, mapping of SEI elements such as carbon (C), oxygen (O), etc. [37], and presence of deposited elements such as fluorine (F), phosphorus (P), etc. [12,14], and the existence of corroded particles from the current collectors. In this study, several spectrums were checked to identify the presence of materials and percentile composition.
Figure 8a displays the harvested cathode sample where four locations were mapped. The spectrums (1 and 3) on particles reported an excessive amount of fluorine besides the active NMC materials (4-4-2 composition), carbon, and oxygen referring to electrolyte degradation leading to contamination, as shown in Figure 8b,d. The other darker areas (spectrum 2 in Figure 8c and 4 in Figure 8e) reflect the presence of aluminum which indicates the corrosion of the Al. However, fluorine could still be found (maximum 9% in Figure 8d) which might refer to electrolyte decomposition or the presence of PVDF (polyvinylidene fluoride) binder.
When the harvested anode sample was analyzed, the backscattered image showed a darker shadow with a hint of interesting spots worth examining. In Figure 9a, the location spectrums illustrate a similar scenario. Fluorine was found in the white chunk area (spectrum 9 shown in Figure 9b) with oxides, carbon, and phosphorus (also from the electrolyte). The presence of these elements indicated the thicker SEI layer resulting in a capacity drop. The other spectrums showed similar compositions, though such localized analysis did not necessarily clarify the complete scenario. The presence of salt components (from LiPF6), especially as high as 13% F, referred to heavy electrolyte decomposition due to cycling that could be another leading cause of aging. Figure 9b–e shows the volumetric percentiles of the elements in all the anode sample spectrums.
Unexpected elements such as Na, S, Cu, Al, etc., were also found, which may be due to several reasons. For example, carboxy-methyl-cellulose sodium salt is commonly used as a binder in water-based slurry formulations for graphite anodes which might explain the presence of Na in the anode. In addition, some electrolyte additives containing sulfur are usually added to improve SEI stability [38]; and the presence of Cu and Al may have been from current collector corrosion. Other reasons include exposure of the material during the sample setup preparation and handling, and/or contamination. The summary of the findings are listed in Table A1 in Appendix A to provide an overall view of all the element compositions.

4. Conclusions

Destructive analysis methods such as post-mortem can open the door for in-depth analysis of degraded materials. In this study, a few batteries were aged dynamically with standard real-life profiles at low and high temperatures to understand the aging behavior. The selected most interesting cell was opened for further analysis after performing 2184 cycles reaching EoL. Visual inspection of the cathode surface did not show any significant differences; however, SEM images pointed to the cracked particle that might have been caused by the dynamic currents from WLTC profile. EDS analysis referred to electrolyte decomposition, too, as one of the aging mechanisms with an average presence of 6% fluorine. Visual inspection of the anode surface and SEM images showed the presence of white cloud in the anode surface which contained up to 13% fluorine (confirmed by EDS). Cathode particle cracking, electrolyte decomposition and SEI growth were identified as the main mechanisms resulting in failure in terms of rapid capacity drop (27.9%) and sharp IR growth (476.2%), labelling the cell unreliable. Further analysis such as XPS, ICP-OES, etc., could illustrate and provide definite information on other possible aging mechanisms.

Author Contributions

Conceptualization, methodology, validation, formal analysis, investigation, and data curation, M.S.H.; writing and original draft preparation, M.S.H.; writing and review and editing, P.Y.; supervision, J.V.M. and M.B. All authors have read and agreed to the published version of the manuscript.

Funding

This research received the cells from the BATTLE project that was funded by the Flemish Agency for Innovation by Science and Technology Directorate (IWT130019).

Data Availability Statement

Not applicable.

Acknowledgments

The authors would like to thank the SURF research group in VUB, especially Priya Laha for supporting the sample analysis and Xinhua Zhu for providing the new cell SEM images.

Conflicts of Interest

The authors declare no conflict of interest.

Appendix A

The EDS analysis of the harvested cathode and anode samples are shown in Table A1. The four selected spectrums are based on the interesting areas of the cathode and anode SEM images, respectively. One should note that the analysis does not refer to a generic composition of the electrode particles, but to the concentrated areas.
Table A1. Localized volume percentiles of the cathode and anode sample areas from the EDS analysis.
Sample TypeSample NumberVolumetric Weight Percentile of the Elements (%)
ONiMnCoCFAlSPNa
CathodeSpectrum 130.423.722.79.78.14.90.20.20.1-
Spectrum 27.88.08.93.663.44.73.30.10.2-
Spectrum 333.917.517.37.214.29.30.30.20.2-
Spectrum 410.34.15.42.071.45.41.20.10.2-
AnodeSpectrum 968.2---12.913.2-1.64.2-
Spectrum 1021.5---73.43.2-1.10.9-
Spectrum 1145.0-0.8-28.58.7-6.99.30.8
Spectrum 1224.3-1.5-61.95.8-3.53-

References

  1. Reddy, M.V.; Mauger, A.; Julien, C.M.; Paolella, A.; Zaghib, K. Brief History of Early Lithium-Battery Development. Materials 2020, 13, 1884. [Google Scholar] [CrossRef] [PubMed] [Green Version]
  2. Xu, C.; Dai, Q.; Gaines, L.; Hu, M.; Tukker, A.; Steubing, B. Future material demand for automotive lithium-based batteries. Commun. Mater. 2020, 1, 99. [Google Scholar] [CrossRef]
  3. Maheshwari, A.; Heck, M.; Santarelli, M. Cycle aging studies of lithium nickel manganese cobalt oxide-based batteries using electrochemical impedance spectroscopy. Electrochim. Acta 2018, 273, 335–348. [Google Scholar] [CrossRef]
  4. Hosen, S.; Jaguemont, J.; Van Mierlo, J.; Berecibar, M. Battery lifetime prediction and performance assessment of different modeling approaches. Iscience 2021, 24, 102060. [Google Scholar] [CrossRef] [PubMed]
  5. Jalkanen, K.; Karppinen, J.; Skogström, L.; Laurila, T.; Nisula, M.; Vuorilehto, K. Cycle aging of commercial NMC/graphite pouch cells at different temperatures. Appl. Energy 2015, 154, 160–172. [Google Scholar] [CrossRef]
  6. Khaleghi, S.; Hosen, S.; Karimi, D.; Behi, H.; Beheshti, S.H.; Van Mierlo, J.; Berecibar, M. Developing an online data-driven approach for prognostics and health management of lithium-ion batteries. Appl. Energy 2022, 308, 118348. [Google Scholar] [CrossRef]
  7. Hosen, S.; Kalogiannis, T.; Youssef, R.; Karimi, D.; Behi, H.; Jin, L.; Van Mierlo, J.; Berecibar, M. Twin-model framework development for a comprehensive battery lifetime prediction validated with a realistic driving profile. Energy Sci. Eng. 2021, 9, 2191–2201. [Google Scholar] [CrossRef]
  8. Sulzer, V.; Mohtat, P.; Aitio, A.; Lee, S.; Yeh, Y.T.; Steinbacher, F.; Khan, M.U.; Lee, J.W.; Siegel, J.B.; Stefanopoulou, A.G.; et al. The challenge and opportunity of battery lifetime prediction from field data. Joule 2021, 5, 1934–1955. [Google Scholar] [CrossRef]
  9. Hosen, S.; Pirooz, A.; Kalogiannis, T.; He, J.; Van Mierlo, J.; Berecibar, M. A Strategic Pathway from Cell to Pack-Level Battery Lifetime Model Development. Appl. Sci. 2022, 12, 4781. [Google Scholar] [CrossRef]
  10. Vetter, J.; Novák, P.; Wagner, M.R.; Veit, C.; Möller, K.-C.; Besenhard, J.O.; Winter, M.; Wohlfahrt-Mehrens, M.; Vogler, C.; Hammouche, A. Ageing mechanisms in lithium-ion batteries. J. Power Sources 2005, 147, 269–281. [Google Scholar] [CrossRef]
  11. Birkl, C.R.; Roberts, M.R.; McTurk, E.; Bruce, P.G.; Howey, D.A. Degradation diagnostics for lithium ion cells. J. Power Sources 2017, 341, 373–386. [Google Scholar] [CrossRef]
  12. Fleischhammer, M.; Waldmann, T.; Bisle, G.; Hogg, B.-I.; Wohlfahrt-Mehrens, M. Interaction of cyclic ageing at high-rate and low temperatures and safety in lithium-ion batteries. J. Power Sources 2015, 274, 432–439. [Google Scholar] [CrossRef]
  13. Waldmann, T.; Wilka, M.; Kasper, M.; Fleischhammer, M.; Wohlfahrt-Mehrens, M. Temperature dependent ageing mechanisms in Lithium-ion batteries—A Post-Mortem study. J. Power Sources 2014, 262, 129–135. [Google Scholar] [CrossRef]
  14. Klett, M.; Eriksson, R.; Groot, J.; Svens, P.; Högström, K.C.; Lindström, R.W.; Berg, H.; Gustafson, T.; Lindbergh, G.; Edström, K. Non-uniform aging of cycled commercial LiFePO4//graphite cylindrical cells revealed by post-mortem analysis. J. Power Sources 2014, 257, 126–137. [Google Scholar] [CrossRef]
  15. Storch, M.; Hahn, S.L.; Stadler, J.; Swaminathan, R.; Vrankovic, D.; Krupp, C.; Riedel, R. Post-mortem analysis of calendar aged large-format lithium-ion cells: Investigation of the solid electrolyte interphase. J. Power Sources 2019, 443, 227243. [Google Scholar] [CrossRef]
  16. Waldmann, T.; Iturrondobeitia, A.; Kasper, M.; Ghanbari, N.; Aguesse, F.; Bekaert, E.; Daniel, L.; Genies, S.; Gordon, I.J.; Löble, M.W.; et al. Review—Post-Mortem Analysis of Aged Lithium-Ion Batteries: Disassembly Methodology and Physico-Chemical Analysis Techniques. J. Electrochem. Soc. 2016, 163, A2149–A2164. [Google Scholar] [CrossRef]
  17. Edge, J.S.; O’Kane, S.; Prosser, R.; Kirkaldy, N.D.; Patel, A.N.; Hales, A.; Ghosh, A.; Ai, W.; Chen, J.; Yang, J.; et al. Lithium ion battery degradation: What you need to know. Phys. Chem. Chem. Phys. 2021, 23, 8200–8221. [Google Scholar] [CrossRef]
  18. Christensen, J.; Newman, J. Cyclable Lithium and Capacity Loss in Li-Ion Cells. J. Electrochem. Soc. 2005, 152, A818–A829. [Google Scholar] [CrossRef]
  19. Lin, X.; Khosravinia, K.; Hu, X.; Li, J.; Lu, W. Lithium Plating Mechanism, Detection, and Mitigation in Lithium-Ion Batteries. Prog. Energy Combust. Sci. 2021, 87, 100953. [Google Scholar] [CrossRef]
  20. Logan, E.; Dahn, J. Electrolyte Design for Fast-Charging Li-Ion Batteries. Trends Chem. 2020, 2, 354–366. [Google Scholar] [CrossRef]
  21. Lu, L.; Han, X.; Li, J.; Hua, J.; Ouyang, M. A review on the key issues for lithium-ion battery management in electric vehicles. J. Power Sources 2013, 226, 272–288. [Google Scholar] [CrossRef]
  22. Warnecke, A.J. Degradation Mechanisms in NMC-Based Lithium-Ion Batteries. Ph.D. Thesis, RWTH Aachen University, Aachen, Germany, 2017. [Google Scholar]
  23. Gopalakrishnan, R.; Li, Y.; Smekens, J.; Barhoum, A.; Van Assche, G.; Omar, N. Electrochemical impedance spectroscopy characterization and parameterization of lithium nickel manganese cobalt oxide pouch cells: Dependency analysis of temperature and state of charge. Ionics 2019, 25, 111–123. [Google Scholar] [CrossRef]
  24. Hosen, S.; Karimi, D.; Kalogiannis, T.; Pirooz, A.; Jaguemont, J.; Berecibar, M.; Van Mierlo, J. Electro-aging model development of nickel-manganese-cobalt lithium-ion technology validated with light and heavy-duty real-life profiles. J. Energy Storage 2020, 28, 101265. [Google Scholar] [CrossRef]
  25. Fermín-Cueto, P.; McTurk, E.; Allerhand, M.; Medina-Lopez, E.; Anjos, M.F.; Sylvester, J.; dos Reis, G. Identification and machine learning prediction of knee-point and knee-onset in capacity degradation curves of lithium-ion cells. Energy AI 2020, 1, 100006. [Google Scholar] [CrossRef]
  26. Verma, P.; Maire, P.; Novák, P. A review of the features and analyses of the solid electrolyte interphase in Li-ion batteries. Electrochim. Acta 2010, 55, 6332–6341. [Google Scholar] [CrossRef]
  27. Pinson, M.B.; Bazant, M.Z.; Chavhan, P.M.; Reddy, V.; Solanki, P.R.; Malhotra, B.D.; Kim, C. Theory of SEI Formation in Rechargeable Batteries: Capacity Fade, Accelerated Aging and Lifetime Prediction. J. Electrochem. Soc. 2012, 160, A243–A250. [Google Scholar] [CrossRef]
  28. Waldmann, T.; Hogg, B.-I.; Wohlfahrt-Mehrens, M. Li plating as unwanted side reaction in commercial Li-ion cells—A review. J. Power Sources 2018, 384, 107–124. [Google Scholar] [CrossRef]
  29. Waldmann, T.; Gorse, S.; Samtleben, T.; Schneider, G.A.; Knoblauch, V.; Wohlfahrtmehrens, M. A Mechanical Aging Mechanism in Lithium-Ion Batteries. J. Electrochem. Soc. 2014, 161, A1742–A1747. [Google Scholar] [CrossRef]
  30. Stiaszny, B.; Ziegler, J.C.; Krauß, E.E.; Schmidt, J.P.; Ivers-Tiffée, E. Electrochemical characterization and post-mortem analysis of aged LiMn2O4–Li(Ni0.5Mn0.3Co0.2)O2/graphite lithium ion batteries. Part I: Cycle aging. J. Power Sources 2014, 251, 439–450. [Google Scholar] [CrossRef]
  31. Liu, M.; Ren, Z.; Wang, D.; Zhang, H.; Bi, Y.; Shen, C.; Guo, B. Addressing Unfavorable Influence of Particle Cracking with a Strengthened Shell Layer in Ni-Rich Cathodes. ACS Appl. Mater. Interfaces 2021, 13, 18954–18960. [Google Scholar] [CrossRef]
  32. Xu, R.; Sun, H.; de Vasconcelos, L.S.; Zhao, K. Mechanical and Structural Degradation of LiNixMnyCozO2Cathode in Li-Ion Batteries: An Experimental Study. J. Electrochem. Soc. 2017, 164, A3333–A3341. [Google Scholar] [CrossRef]
  33. Zhang, Y.; Zhao, C.; Guo, Z. Simulation of crack behavior of secondary particles in Li-ion battery electrodes during lithiation/de-lithiation cycles. Int. J. Mech. Sci. 2019, 155, 178–186. [Google Scholar] [CrossRef]
  34. Burns, J.C.; Kassam, A.; Sinha, N.N.; Downie, L.E.; Solnickova, L.; Way, B.M.; Dahn, J.R. Predicting and Extending the Lifetime of Li-Ion Batteries. J. Electrochem. Soc. 2013, 160, A1451–A1456. [Google Scholar] [CrossRef]
  35. Broussely, M.; Herreyre, S.; Biensan, P.; Kasztejna, P.; Nechev, K.; Staniewicz, R. Aging mechanism in Li ion cells and calendar life predictions. J. Power Sources 2001, 97–98, 13–21. [Google Scholar] [CrossRef]
  36. Bhattacharya, S.; Riahi, A.R.; Alpas, A.T. Thermal cycling induced capacity enhancement of graphite anodes in lithium-ion cells. Carbon 2014, 67, 592–606. [Google Scholar] [CrossRef]
  37. Krämer, Y.; Birkenmaier, C.; Feinauer, J.; Hintennach, A.; Bender, C.L.; Meiler, M.; Schmidt, V.; Dinnebier, R.E.; Schleid, T. A New Method for Quantitative Marking of Deposited Lithium by Chemical Treatment on Graphite Anodes in Lithium-Ion Cells. Chem. A Eur. J. 2015, 21, 6062–6065. [Google Scholar] [CrossRef]
  38. Jankowski, P.; Lindahl, N.; Weidow, J.; Wieczorek, W.G.; Johansson, P. Impact of Sulfur-Containing Additives on Lithium-Ion Battery Performance: From Computational Predictions to Full-Cell Assessments. ACS Appl. Energy Mater. 2018, 1, 2582–2591. [Google Scholar] [CrossRef]
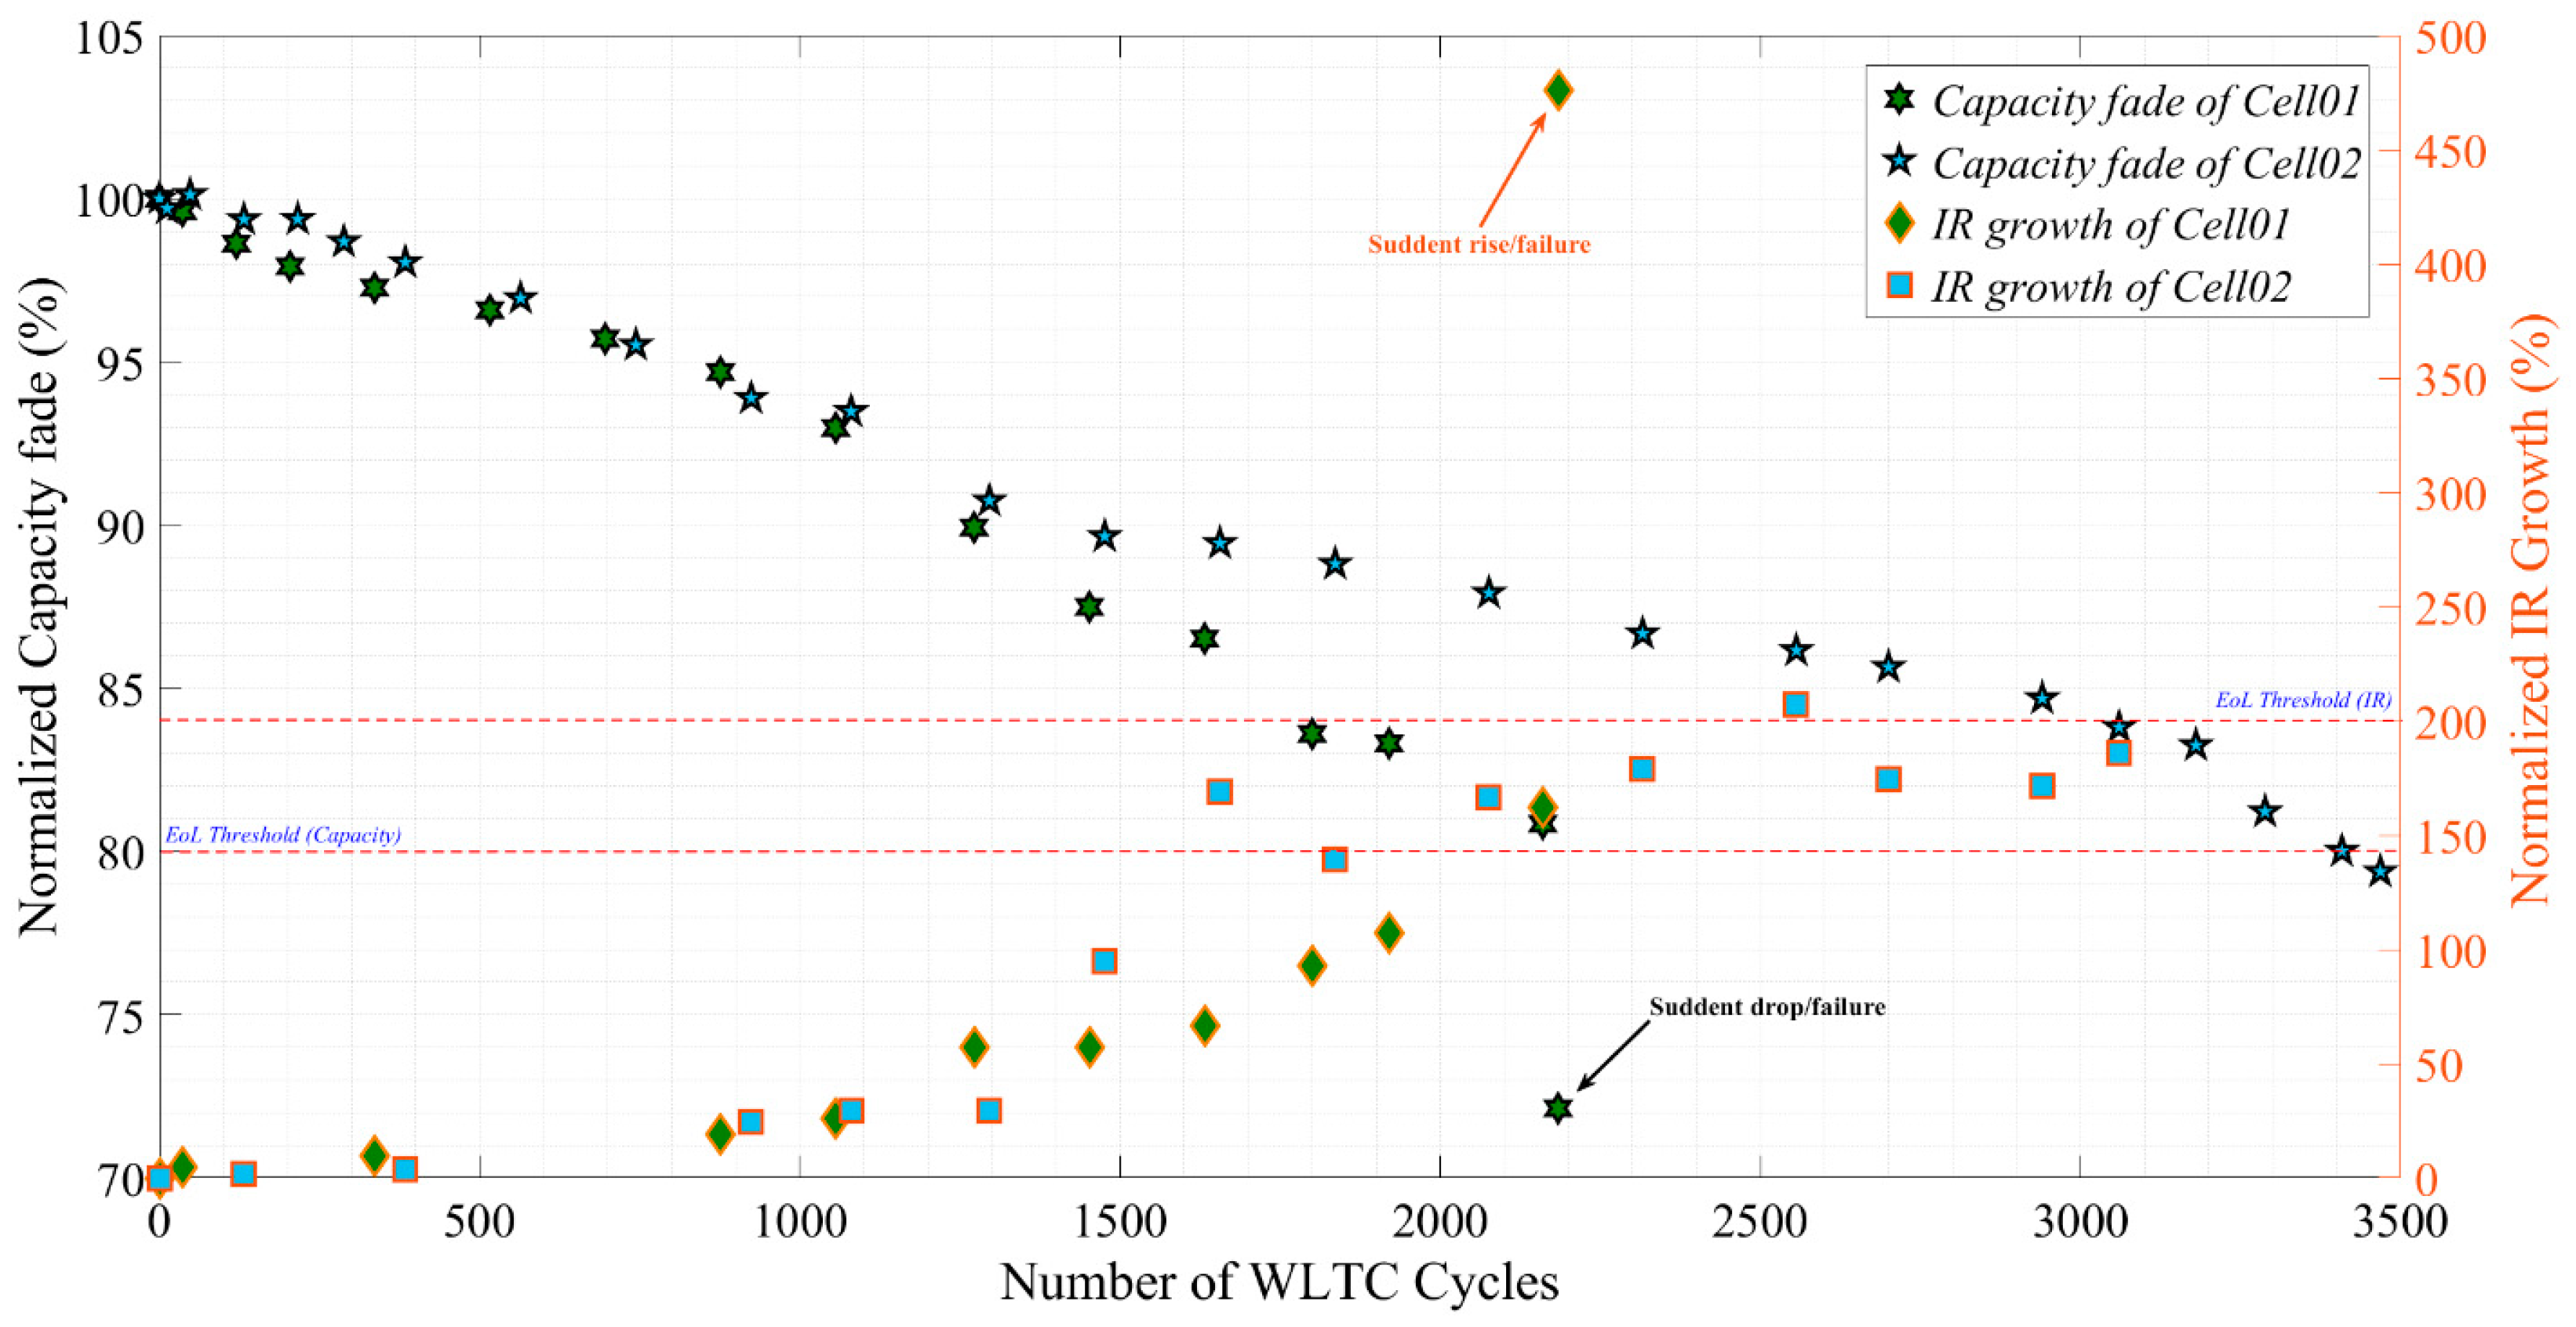
Figure 1. The dynamic and realistic continuous WLTC current profile.
Energies 16 01046 g001
Figure 2. WLTC degradation results with WLTC current profile at 45 °C.
Energies 16 01046 g002
Figure 3. (a) Charge-voltage decrease by time (LLI); (b) Last cycle’s charge-discharge capacity comparison at each round during the lifetime.
Energies 16 01046 g003
Figure 4. Full investigation flowchart including a post-mortem of the studied NMC 20 Ah Cell01.
Energies 16 01046 g004
Figure 5. Disassembled cell components and sampling: (a) cathode sheet, (b) selected cathode sampling areas, (c) collected cathode samples, (d) anode sheet, (e) selected anode sampling areas, (f) collected anode samples, and (g) dried separator.
Energies 16 01046 g005
Figure 6. Local SEM images from harvested samples of (a) new NMC cell, and (b) aged NMC cell.
Energies 16 01046 g006
Figure 7. Local SEM images of (a) new graphite, (b) aged graphite sample, and (c) back-scattered image of aged graphite.
Energies 16 01046 g007
Figure 8. (a) EDS analysis of the chemical composition of the harvested cathode at four locations; (be) the localized volumetric analysis of the spectrum 1, 2, 3 and 4, respectively.
Energies 16 01046 g008
Figure 9. (a) EDS analysis of the chemical composition of the harvested anode at four locations; (be) the localized volumetric analysis of the spectrum 9, 10, 11 and 12, respectively.
Energies 16 01046 g009
Table 1. SoH of the performed cells due to WLTC cycling.
Cycling TemperaturePerformed CyclesSoHcapSoHIR
Cell0145 °C218472.1%476.2%
Cell0245 °C346879.4%256.6%
Cell02 * - 3060 83.8% 200.9%
Cell0310 °C1428101.6%142.5%
* Cell has reached EoL with respect to SoHIR.
Disclaimer/Publisher’s Note: The statements, opinions and data contained in all publications are solely those of the individual author(s) and contributor(s) and not of MDPI and/or the editor(s). MDPI and/or the editor(s) disclaim responsibility for any injury to people or property resulting from any ideas, methods, instructions or products referred to in the content.

