Article

Numerical and Experimental Study on an Anti-Oscillation Device for the DeepCwind Floating Semi-Submersible Turbine Platform

1
School of Naval Architecture Ocean and Civil Engineering, Shanghai Jiaotong University, Shanghai 200240, China
2
Marine Design and Research Institute of China, Shanghai 200011, China
3
School of Naval Architecture and Maritime, Zhejiang Ocean University, Zhoushan 316022, China
4
School of Naval Architecture, Ocean and Energy Power Engineering, Wuhan University of Technology, Wuhan 430063, China
*
Author to whom correspondence should be addressed.
Energies 2023, 16(3), 1034; https://doi.org/10.3390/en16031034
Submission received: 8 December 2022 / Revised: 1 January 2023 / Accepted: 13 January 2023 / Published: 17 January 2023
(This article belongs to the Section A3: Wind, Wave and Tidal Energy)

Abstract

:
The DeepCwind floating wind turbine platform has become one of the most successful structures for accommercial floating wind farms, and the stability of it is crucial for survivability. Hence, this paper studies an anti-oscillation device with the purpose of reducing the heave and surge effects of the platform. The influence of various chamfered perforations at different sizes of the anti-heave device on the floating platform was further studied by numerical and experimental methods. Furthermore, through an analysis of the surge and heave of the pedestal with anti-heave devices with different chamfered perforations under different wave heights and wave periods, the effects on the hydrodynamic performance of the pedestal were studied. Physical experiments were conducted on a pedestal with anti-heave devices with chamfered perforations under the working conditions of different wave heights and wave periods to verify the reliability of the numerical simulation. The results show that the anti-heave effect of the anti-oscillation device is obvious under the small wave period and large wave height. Under the working conditions of different wave heights and wave periods, different perforated chamfers have different effects on reducing the oscillation of the pedestal, and its effect does not change linearly with an increasing chamfer. Under most working conditions, the anti-heave effect of the 35° chamfered perforated model was found to be the most obvious.

1. Introduction

The semi-submersible platform has become one of the most successful structures of floating wind turbines because they show merits on the applicable water depth from 50 m to 200 m. Besides, due to convenient assembly and maintenance, it has become the first choice for countries with geographical location limitations and marine environment limitations. The application depths of semi-submersible platforms have a large span, and their different applicable depths are adjusted by the underwater catenary part [1]. The main part of the platform near the marine-free surface mainly maintains the position and stability of offshore wind turbines through the balance of gravity, buoyancy and catenary tension. Therefore, the research on the hydrodynamic performance of its platform is a more direct research method for offshore wind turbine platforms.
Many scholars have studied the hydrodynamic performance of platforms. Nagan et al. [2] applied the concept of both hydrodynamic added mass and separated-flow damping intelligently in the design of a large floating vessel on a column-stabilized principle. Simon et al. [3] used the NREL 5 MW turbine and the Dogger Bank site as input, and seven preliminary floating support structure concepts were investigated and compared through a preliminary techno-economic analysis. Thereafter, the optimum concept among the seven, the tri-floater configuration, was further developed and refined through hydrostatic, hydrodynamic, and structural analyses. Borg et al. [4] conducted a preliminary investigation into the dynamics of a vertical axis wind turbine coupled with three generic floating support structures originally intended for horizontal-axis wind turbines. Duarte et al. [5] focused on the analysis of a floating wind turbine under multidirectional wave loading. Preliminary results on the influence of these wave loads on a floating wind turbine showed significant additional roll and sway motions of the platform. Ashraf et al. [6] investigated the dynamic behaviour of triangular, square, and pentagon TLP configurations under multidirectional regular and random waves. Barrera et al. [7] explored the role of wave spectral characteristics and wave time history on the estimation of extreme mooring loads on floating offshore wind turbines. Alkarem et al. [8] investigated the effect of wave irregularity on the hydrodynamic responses of floating offshore wind turbines.
To reduce the motion and improve the stability of the platform, the addition of anti-heave devices has become the mainstream method. Many scholars have studied the perforations of heave plates as mainstream anti-heave devices. Downie et al. [9] used an experimental method to examine the influence of plate perforations and the size of the heave plate on the hydrodynamic performance. They observed that the heave motion amplitude of the spar platform model with a solid heave plate was lower than that of the model with a heave plate with perforations. Chua et al. [10] examined the hydrodynamic characteristics of heave plates with large central perforations and solid heave plates. They observed that as the perforation ratio increased, the damping coefficient increased, and the additional mass coefficient decreased. Tao and Dray [11] examined the hydrodynamic characteristics of solid and porous heave plates and analysed the effects of the heave amplitude, frequency, and perforation ratio. Li et al. [12] investigated the hydrodynamic coefficients of heave plates using forced oscillation model tests. The effects of variables, such as the Keulegan-Carpenter Number (KC), frequency of oscillation, plate depth, thickness-to-width ratio, shape of the edge, perforation ratio, and hole size on the hydrodynamic coefficients were analysed. Mentzoni et al. [13] conducted a numerical simulation of a porous plate and concluded that the hydrodynamic coefficient of the porous plate was highly dependent on the amplitude, and the advantage of the damping force increased with an increase in the perforation ratio. Hydrodynamic numerical simulations were performed on perforated heave plates with different subtype characteristics [14]. The results showed the corresponding relations between the different damping coefficients and additional mass coefficients of the heave plates and KC number. Thiagarajan [15] studied the effect of adding a disk-type heave plate on a TLP. The model test of the disk in the heave state shows that the heave damping caused by the disk is linear with the vibration amplitude, and the heave damping ratio increases linearly with the water velocity.
The influence of the perforated chamfer on the hydrodynamic performance of the heave plate was studied through physical experiments and numerical simulations [16]. In this study, we consider the pedestal of a DeepCwind floating semi-submersible turbine platform as the research object to explore the influence of chamfer perforations on the anti-oscillation device on the pedestal on its hydrodynamic performance, especially on heave performance; the effects of different wave heights and wave periods on the hydrodynamic performance of the pedestal were studied through a numerical simulation and model test.

2. Experimental Works

2.1. Design of Experimental Device for Hydrodynamic Characteristics of Perforated Anti-Heave Device for the Pedestal

The motion studied in this paper is the flow of fluid around the object. The physical model of the DeepCwind floating platform refers to a simple rigid body, that is, it does not produce obvious deformation in the process of motion.
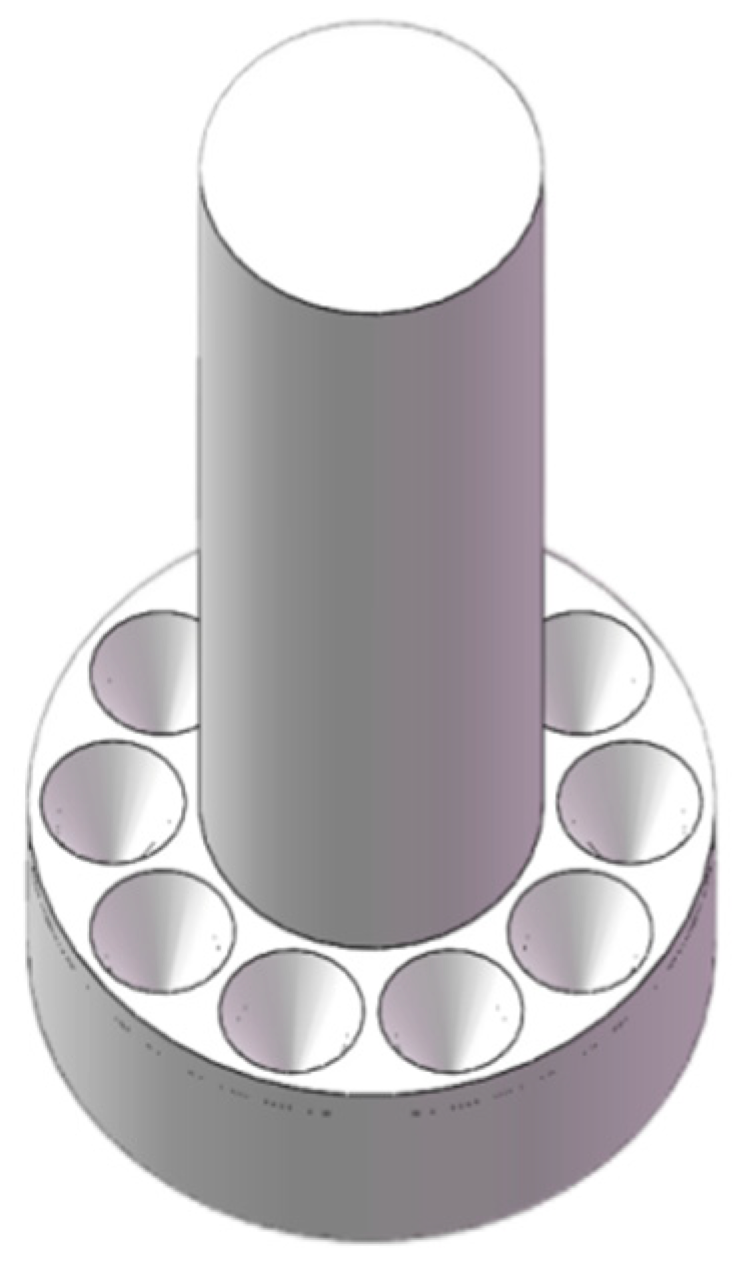
The model is composed of three float parts and central connecting parts. The specific parameters of three identical pontoons and connecting parts are listed in Table 1 below. The single pontoon model, cross-section of the anti-heave device and model of the platform with an anti-heave device is shown in Figure 1, Figure 2 and Figure 3.
Model tests were conducted on a pedestal with a perforated anti-heave device under different wave periods and wave heights. Referring to the size of the actual platform and the test environment, the final scale ratio of the model is 1:60.
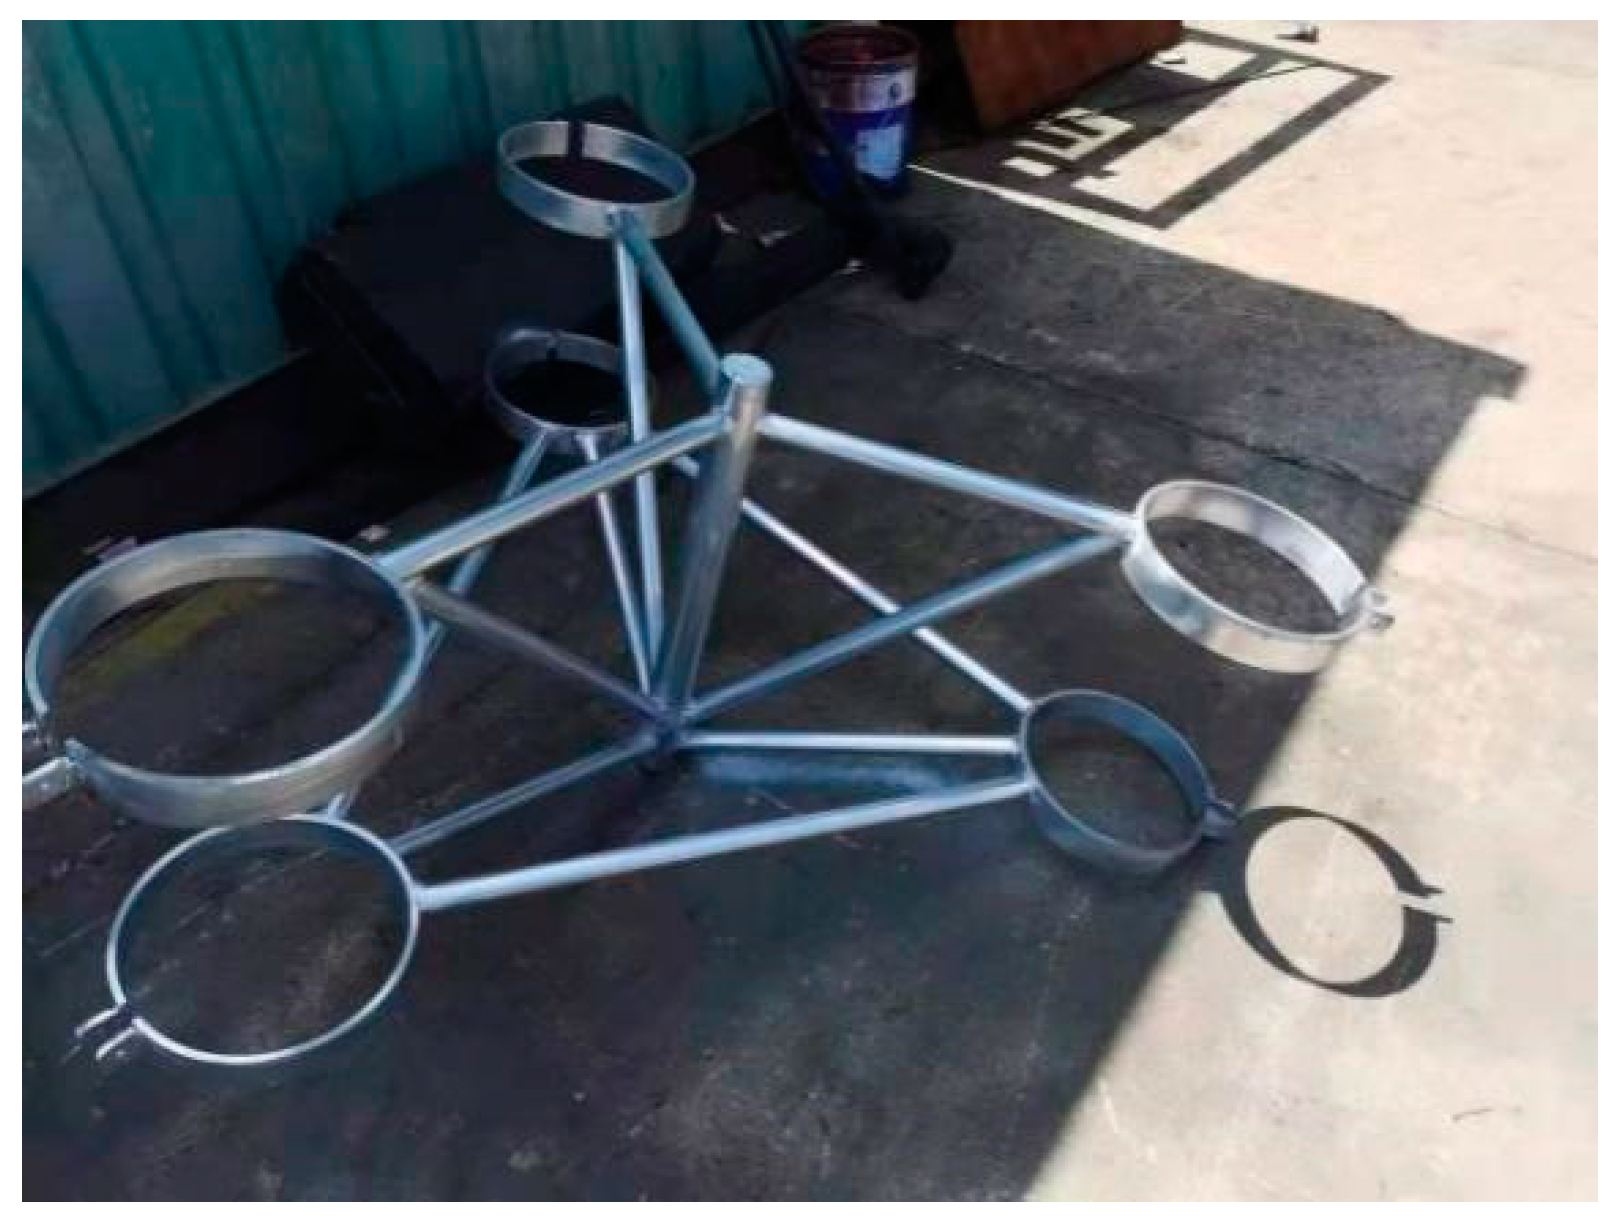
The model of the pedestal was obtained by 3D printing, which ensured smoothness and watertightness. A model of the pedestal with 35° chamfered perforations was prepared. The model is shown in Figure 4 and Figure 5.
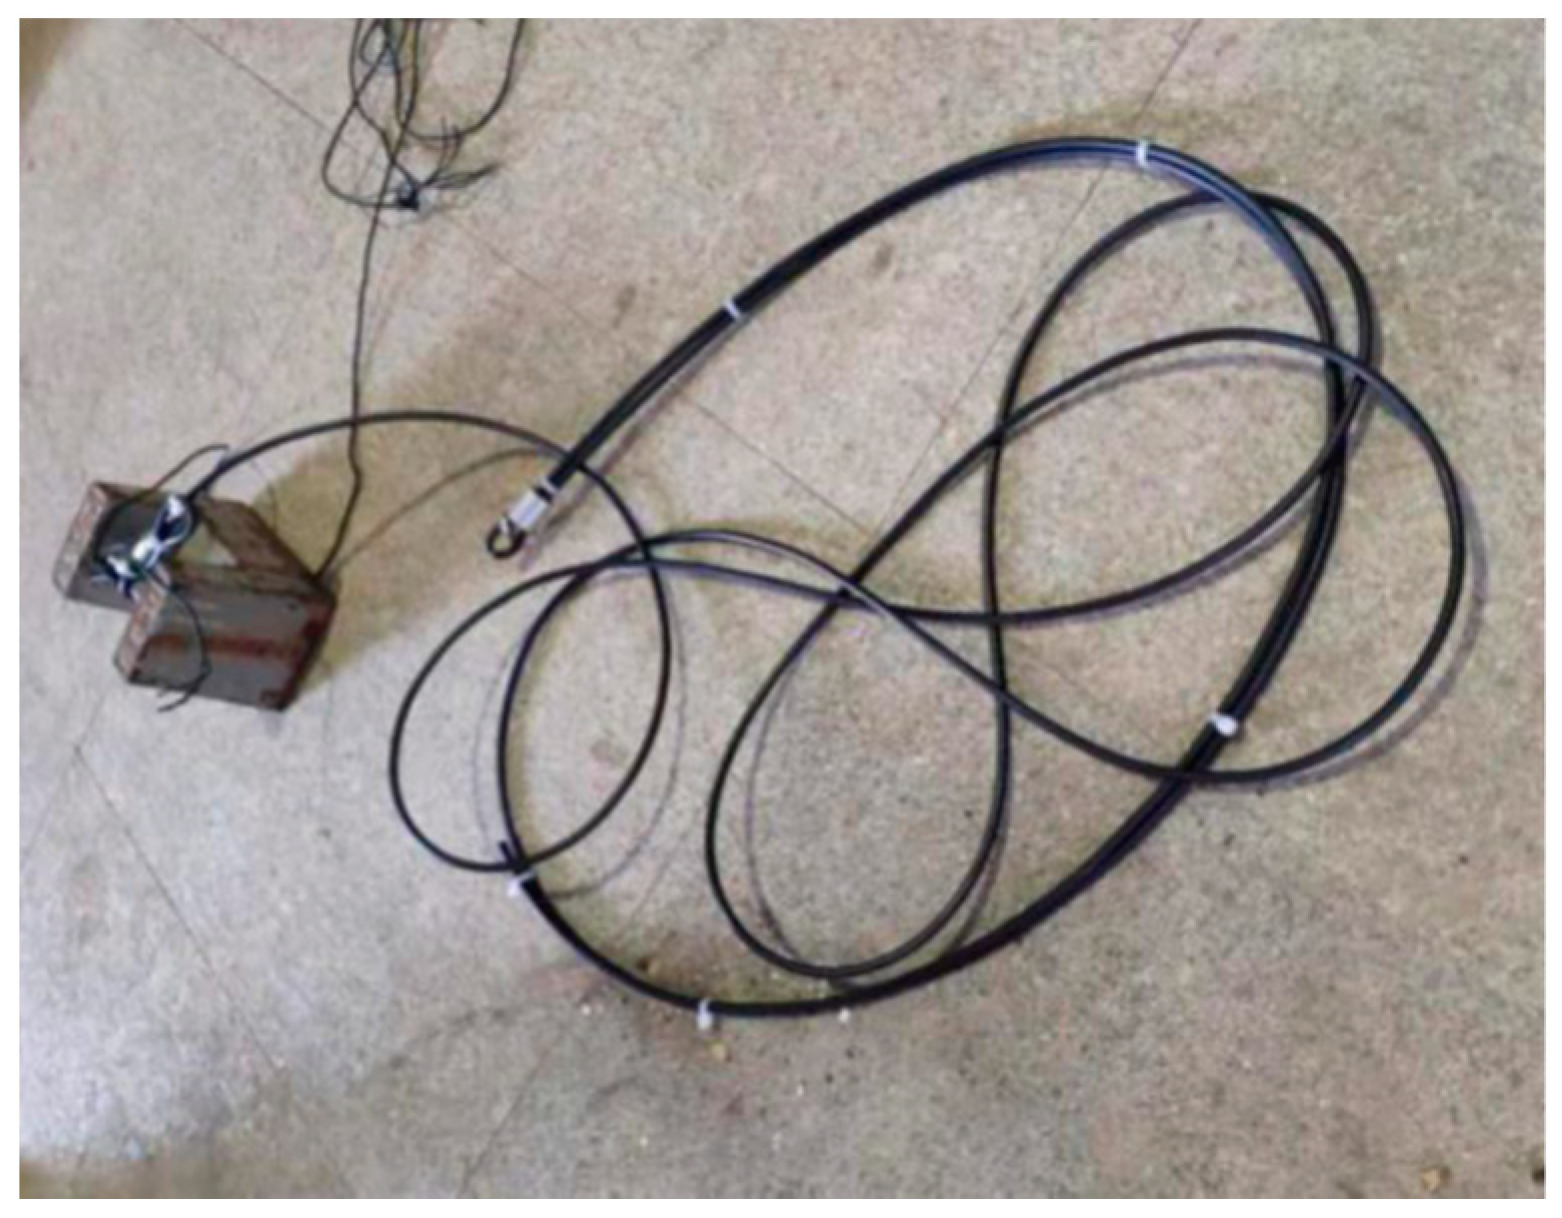
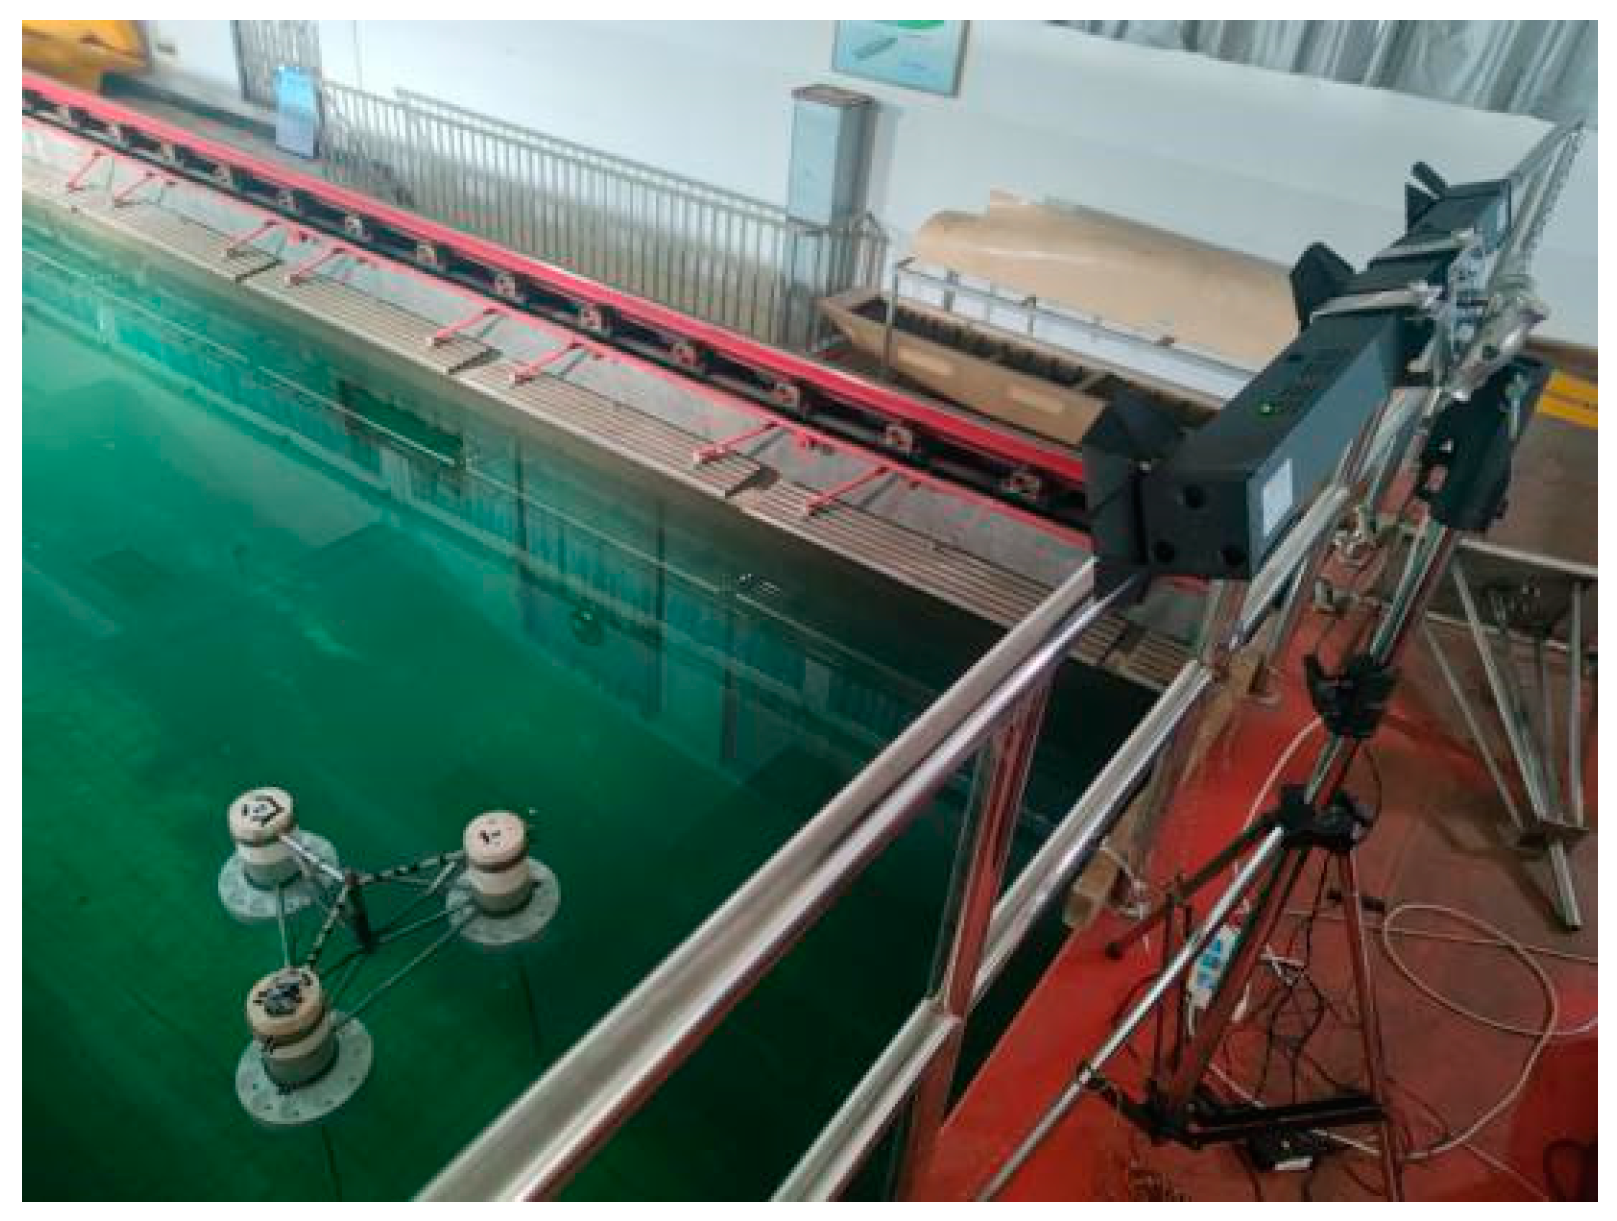
The wave maker was used to collect and analyse the motion of the model under different wave heights and wave periods. The instruments used in the experiment were a PTI 3D motion capture system, wave altimeter, and wave maker. The original mass of the catenary cable per unit length is 113.4 kg/m, which is converted from a 1:60 scale ratio to approximately 0.121 kg/m per unit length. A plastic-clad wire rope with 6.2 mm diameter is selected, which is similar to its density.
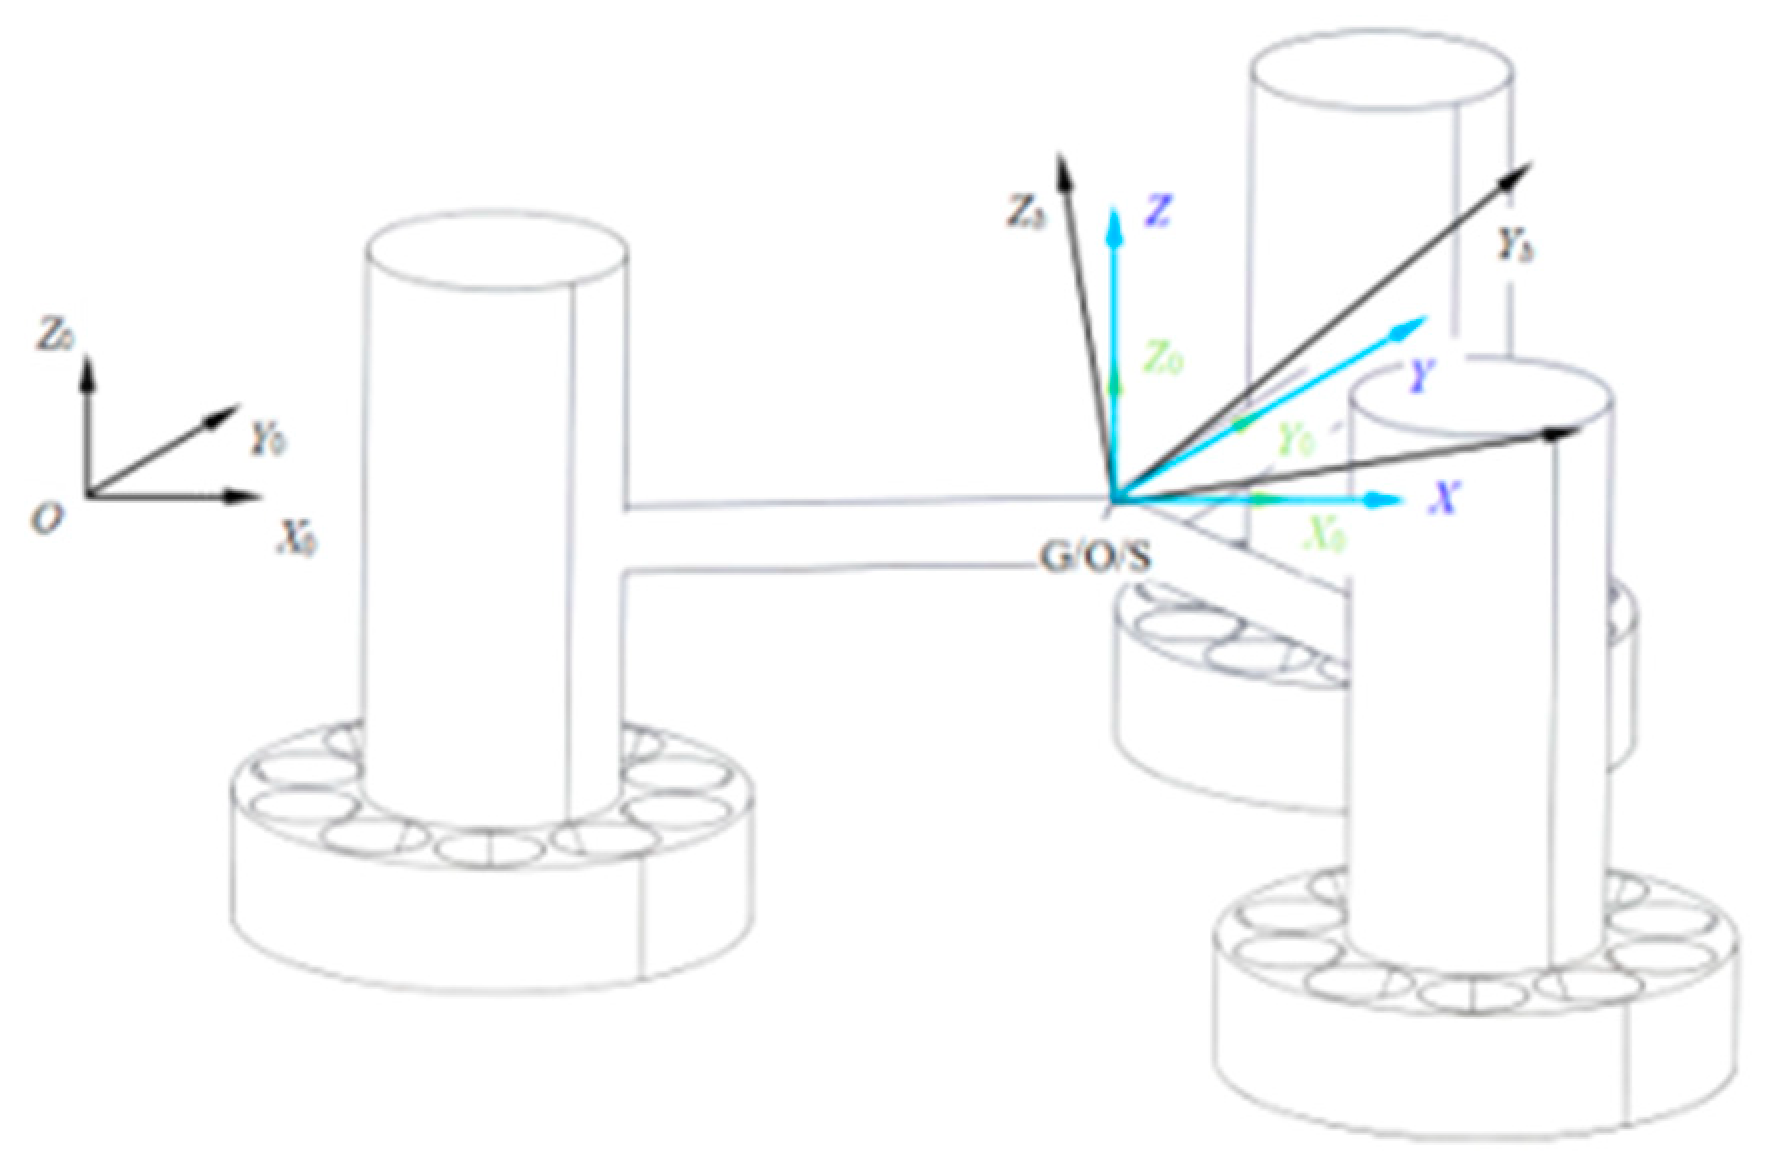
In physical experiments, the geodetic coordinate system S-X0Y0Z0 is set on the trailer of the towing tank, the body-fixed coordinate system G-XbYbZb is fixed with the three-floating-body wind turbine platform anti-heave device, the origin G is at the centre of gravity of the floating body, and the translational coordinate system S-XYZ passes through the G [17]. Refer to Figure 6 for details.
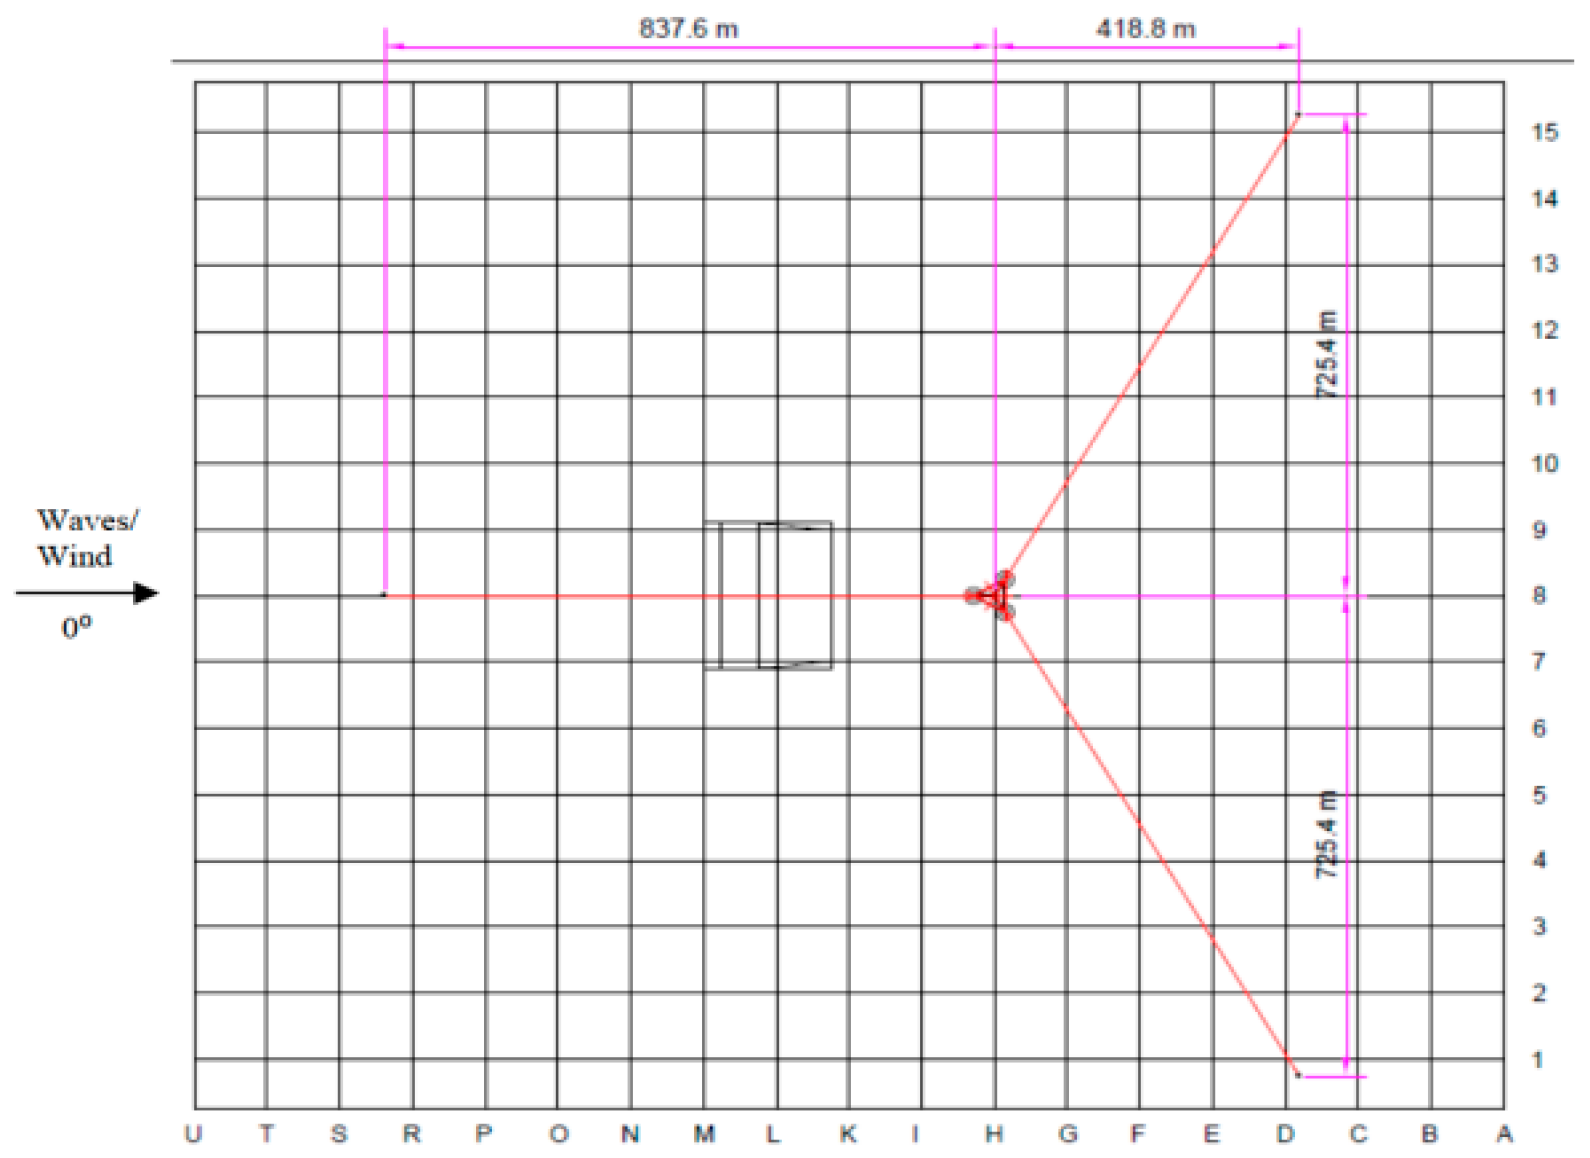
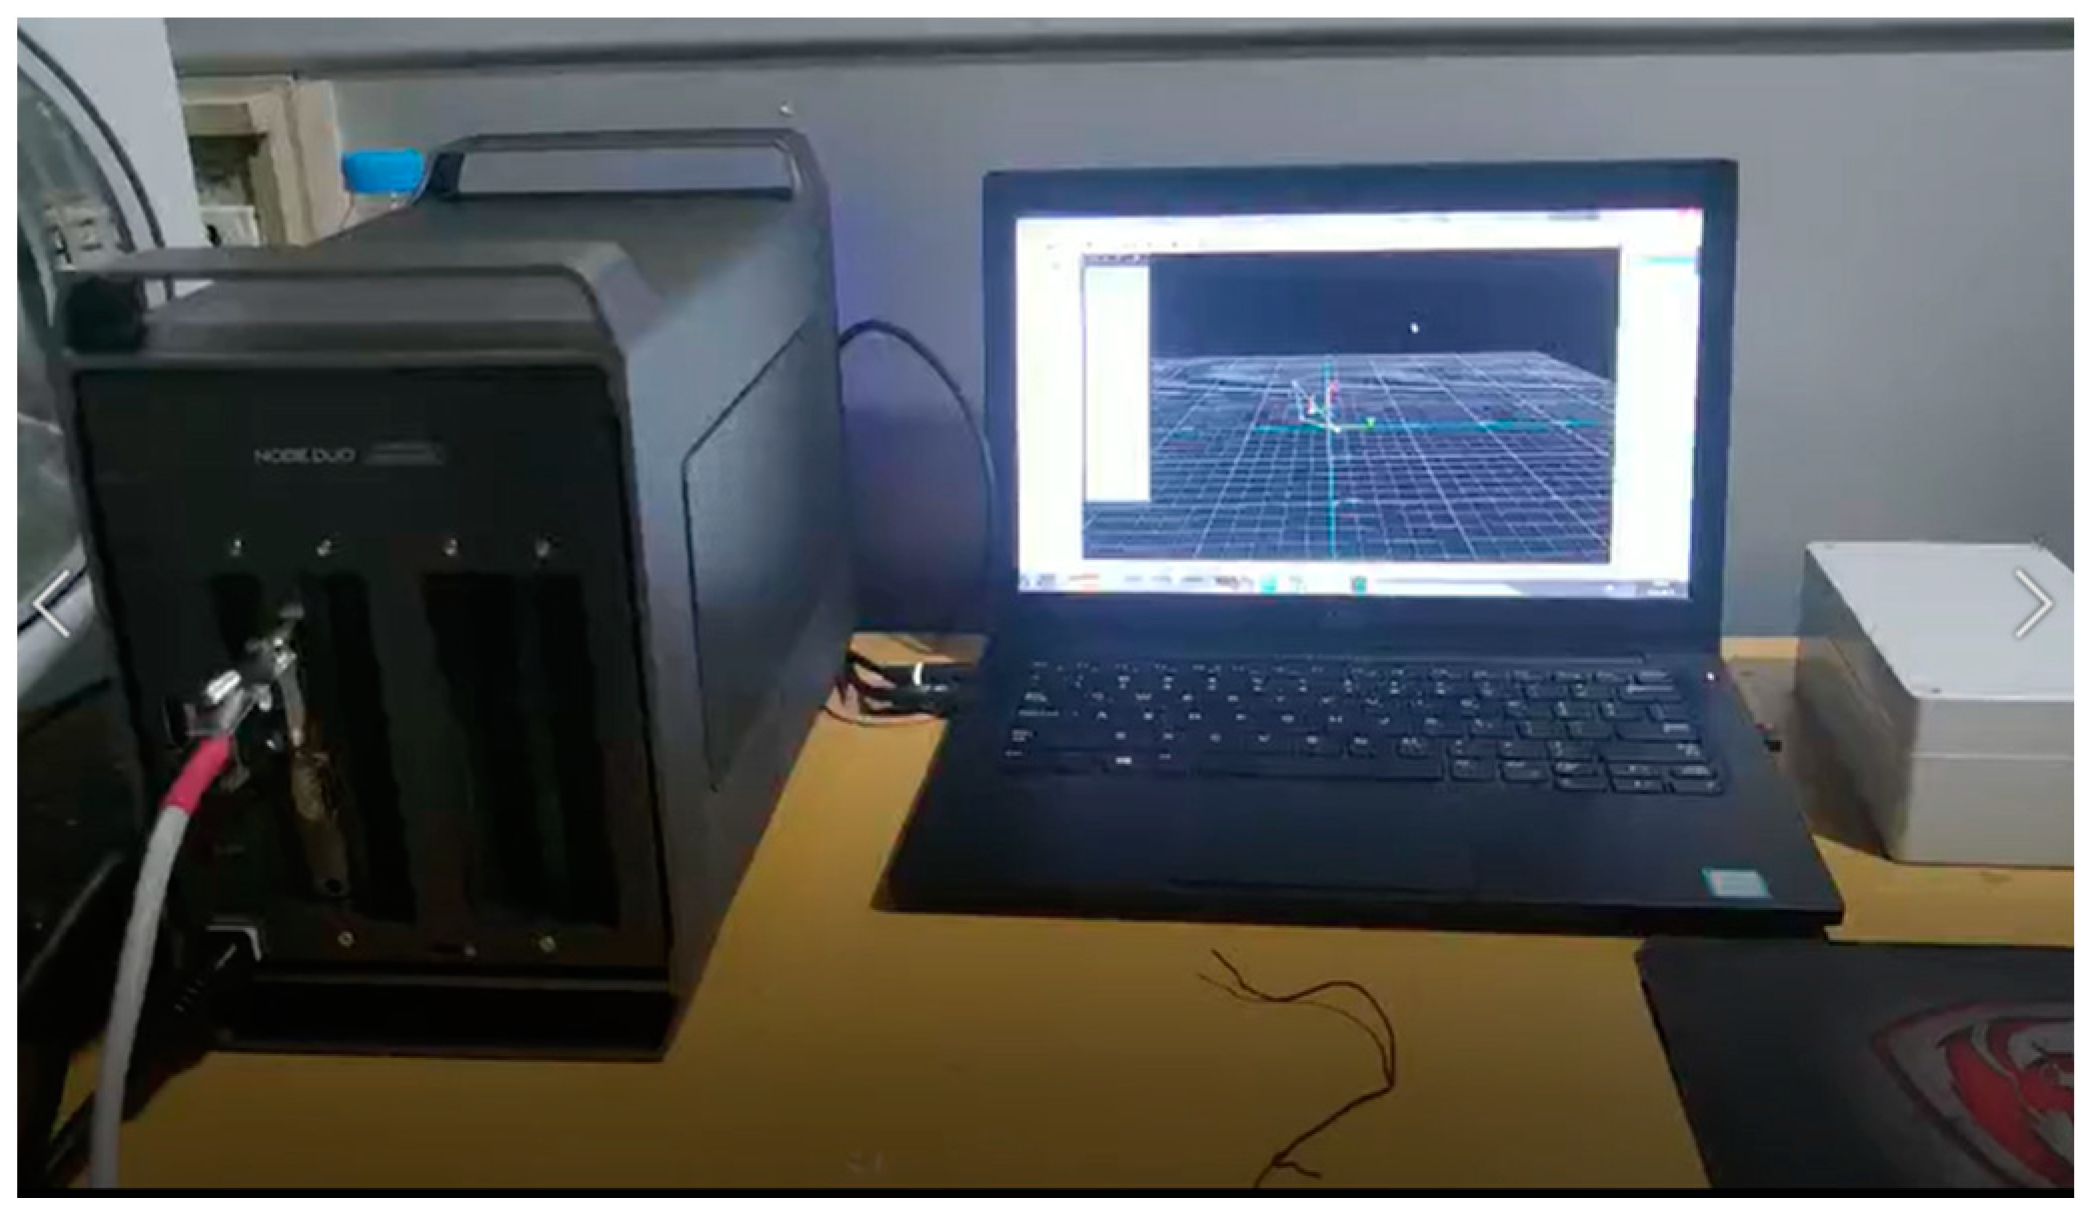
Figure 7 shows the wave altimeter used during the experiment, and Figure 8 shows the mooring rope and mooring block used for the floating body during the experiment. The relevant coordinates correspond to the later PTI optical sensor coordinate setting, the monitoring sensor corresponds to the geodetic coordinate system, and the observation point corresponds to the floating body-fixed coordinate system, which is convenient for subsequent coordinate conversion to obtain the actual movement of the center of gravity position of the floating body. The installation of PTI 3D motion capture system in the experiment is shown in Figure 9 and Figure 10. Figure 11 is the mooring layout for reference during the experiment, which is arranged according to the scale ratio. Figure 12 shows the interface of the data acquisition system during the experiment.
According to the working conditions and the actual sea conditions in China’s coastal areas. The selected working conditions of the wave maker are shown in Table 2.
The coordinate transformation method is introduced to transform the parameters of the six degrees of freedom of the measuring point into the motion of the centroid position of the pedestal, and the surge and heave responses under different working conditions were analysed.

2.2. Data Processing

2.2.1. Coordinate Transformation

If the motion of the centre of gravity of the floating body is obtained, according to the superposition theorem of motion, the motion of any point on the floating body can be obtained [18]. Assuming that the three rotational displacements of the floating body are small, the floating body is linearised and retained to the first-order term. After derivation, the coordinate transformation relationship between the body-fixed coordinate system G-xbybzb and the translational coordinate system G-x’y’z’ can be obtained.
{ x y z } = [ c o s θ c o s ψ s i n ϕ s i n θ c o s ψ s i n ψ c o s ϕ c o s ϕ s i n θ c o s ψ + s i n ϕ s i n ψ c o s θ s i n ψ s i n ϕ s i n θ s i n ψ + c o s ϕ c o s ψ c o s ϕ s i n θ s i n ψ s i n ϕ c o s ψ s i n θ s i n ϕ c o s θ c o s ϕ c o s θ ] { x b y b z b }
where θ , ϕ , ψ represents the included angle between the body-fixed coordinate system and the translational coordinate system in the x, y, z directions.
Using the linearisation condition, the coordinate transformation can be reduced to a first-order expression relation.
{ x y z } = ( 1 ψ θ ψ 1 φ θ φ 1 ) { x b y b z b }
It can be seen from the above that the movement of a certain point on the model can be calculated through the model data and the movement of the center of gravity of the model, so the above conversion formula can deduce the movement of the center of gravity of the model under the condition that the movement of a certain point on the model is known. Therefore, through the above coordinate conversion method, this paper obtains the actual motion at the center of gravity of the floating body, which makes the research of this paper more scientific and intuitive.

2.2.2. Comparison between Numerical Simulation and Experiment

This study adopts the method of numerical simulation and experimental comparison, and analyses the effect of chamfered perforations of the anti-heave device on the hydrodynamic performance of a semi-submersible platform under different wave heights and wave periods.
Among them, the actual size of the deepCwind model [19] is used for numerical simulation, and the scale ratio of 1:60 is used for the physical experiment. The specific simulation and experimental data will be shown in the corresponding chapters below.

2.2.3. Fourier Transform

The purpose of the Fourier transform is to transform the signal in the time domain into a signal in the frequency domain. With the difference of the domain, the understanding of the same thing will change, and thus it can be easily processed in the frequency domain where it is difficult to deal with in the time domain [20]. The Fourier transform formula is as follows:
F ( ω ) = F [ f ( t ) ] = f ( t ) e i ω t d t
where ω represents the frequency, rad/s; t denotes time, s.
The Fourier transform holds that a periodic function contains multiple frequency components, and any function f(t) can be synthesised by the addition of multiple periodic functions (basis functions). In this paper, the heave of the deepCwind floating turbine platform is studied and analyzed from multiple angles by Fourier transform of the measurement results.

2.3. Hydrodynamic Performance of the Pedestal with Anti-Heave Device under Different Working Conditions

According to the research of Kebabsa and Kafeel [21,22], the abnormal oscillation in the oscillation spectrum was effectively identified, and the following data were obtained after its elimination, and the subsequent frequency domain curve was drawn.
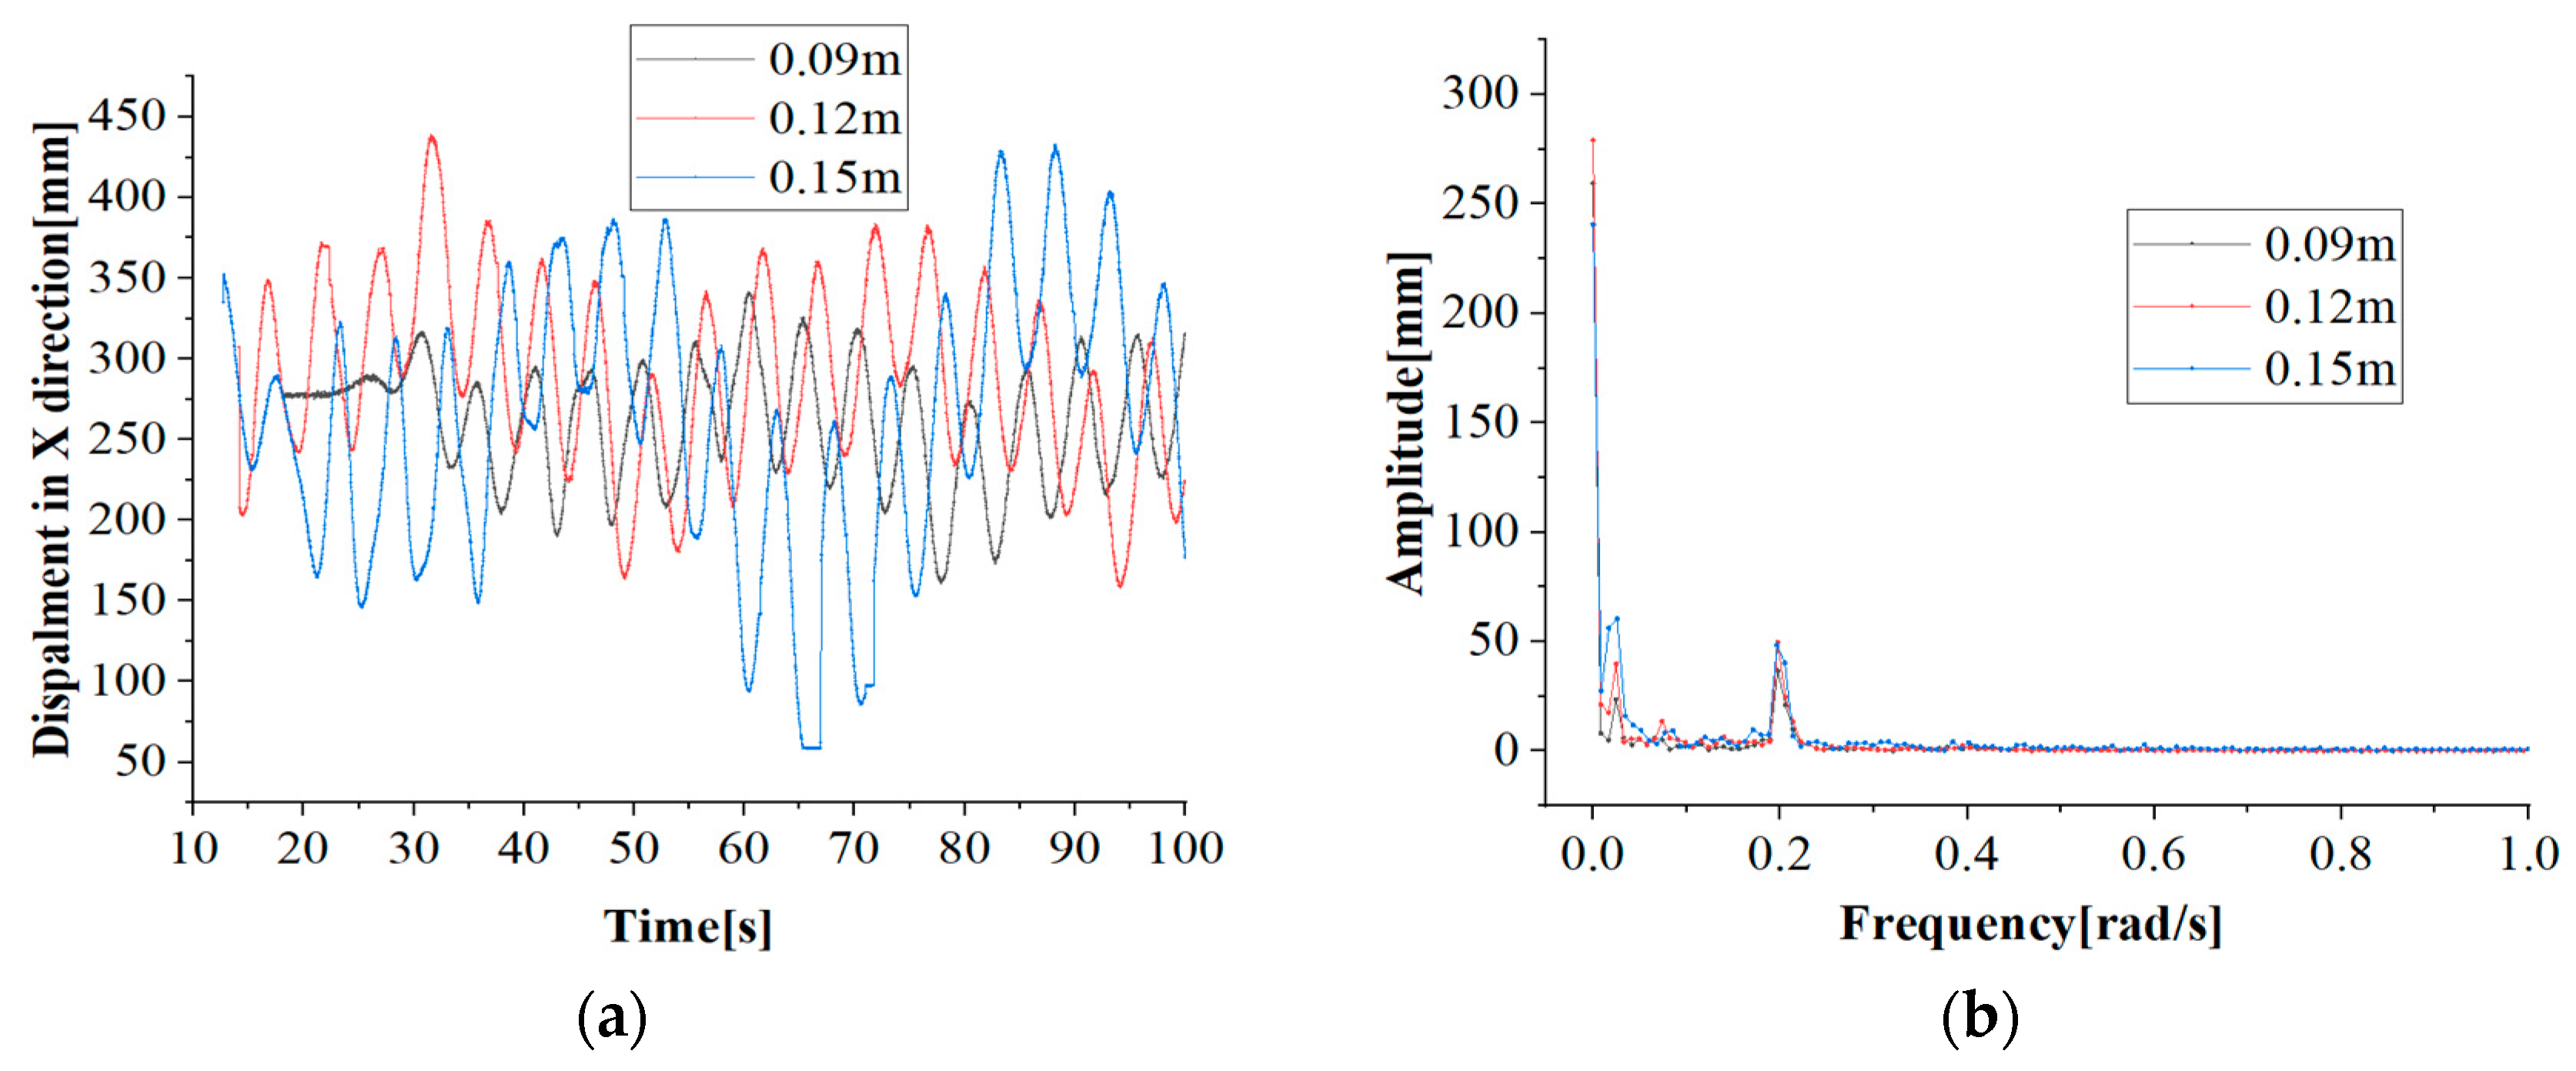
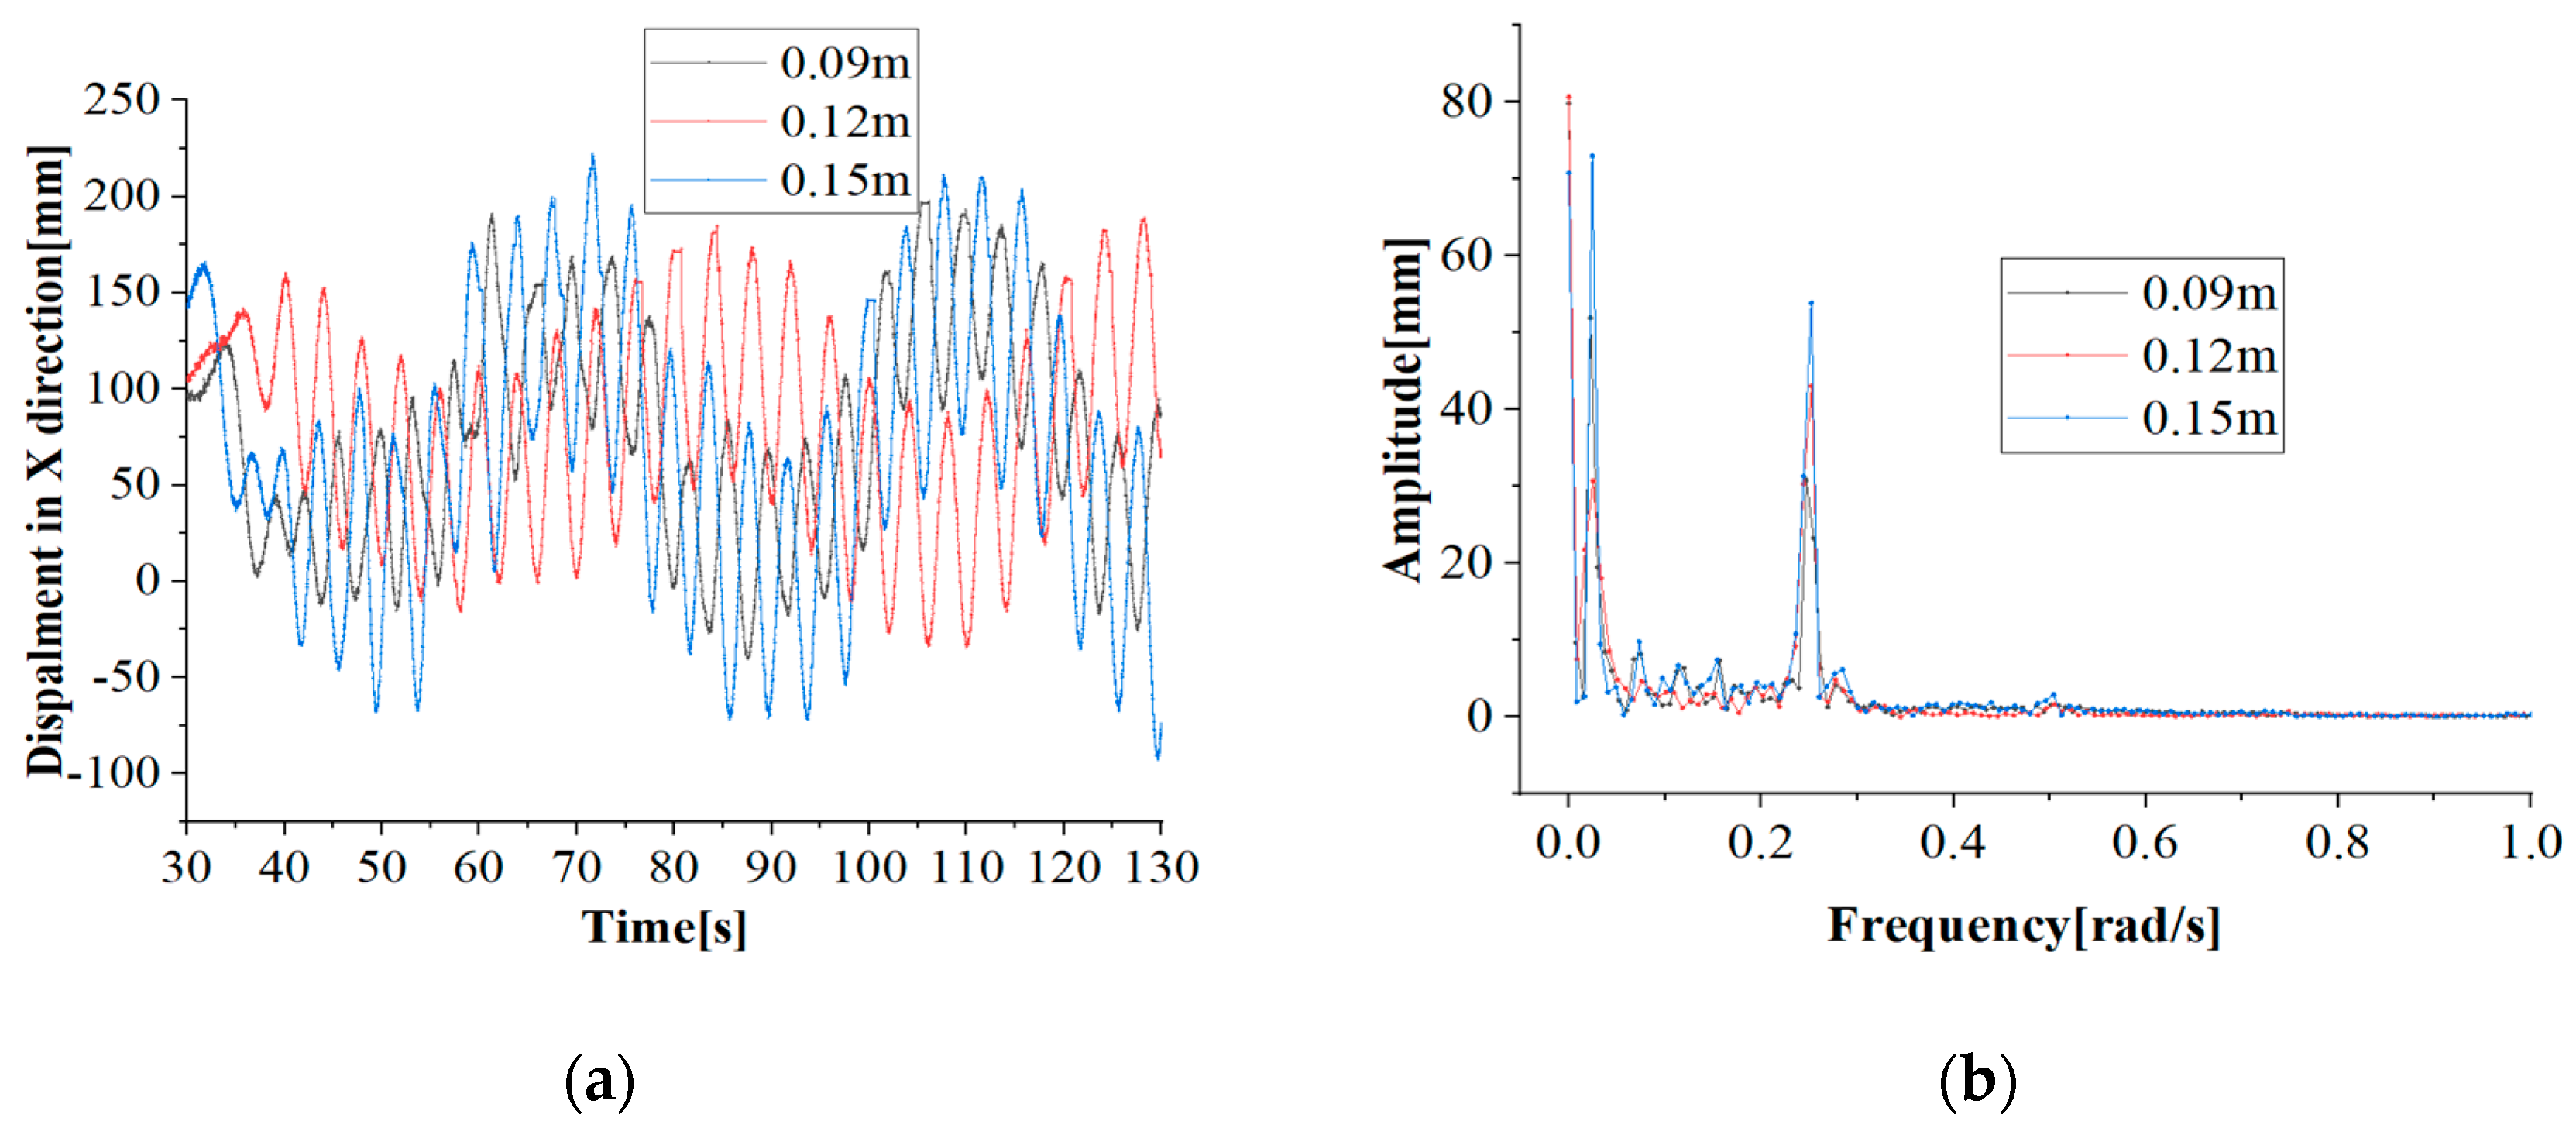
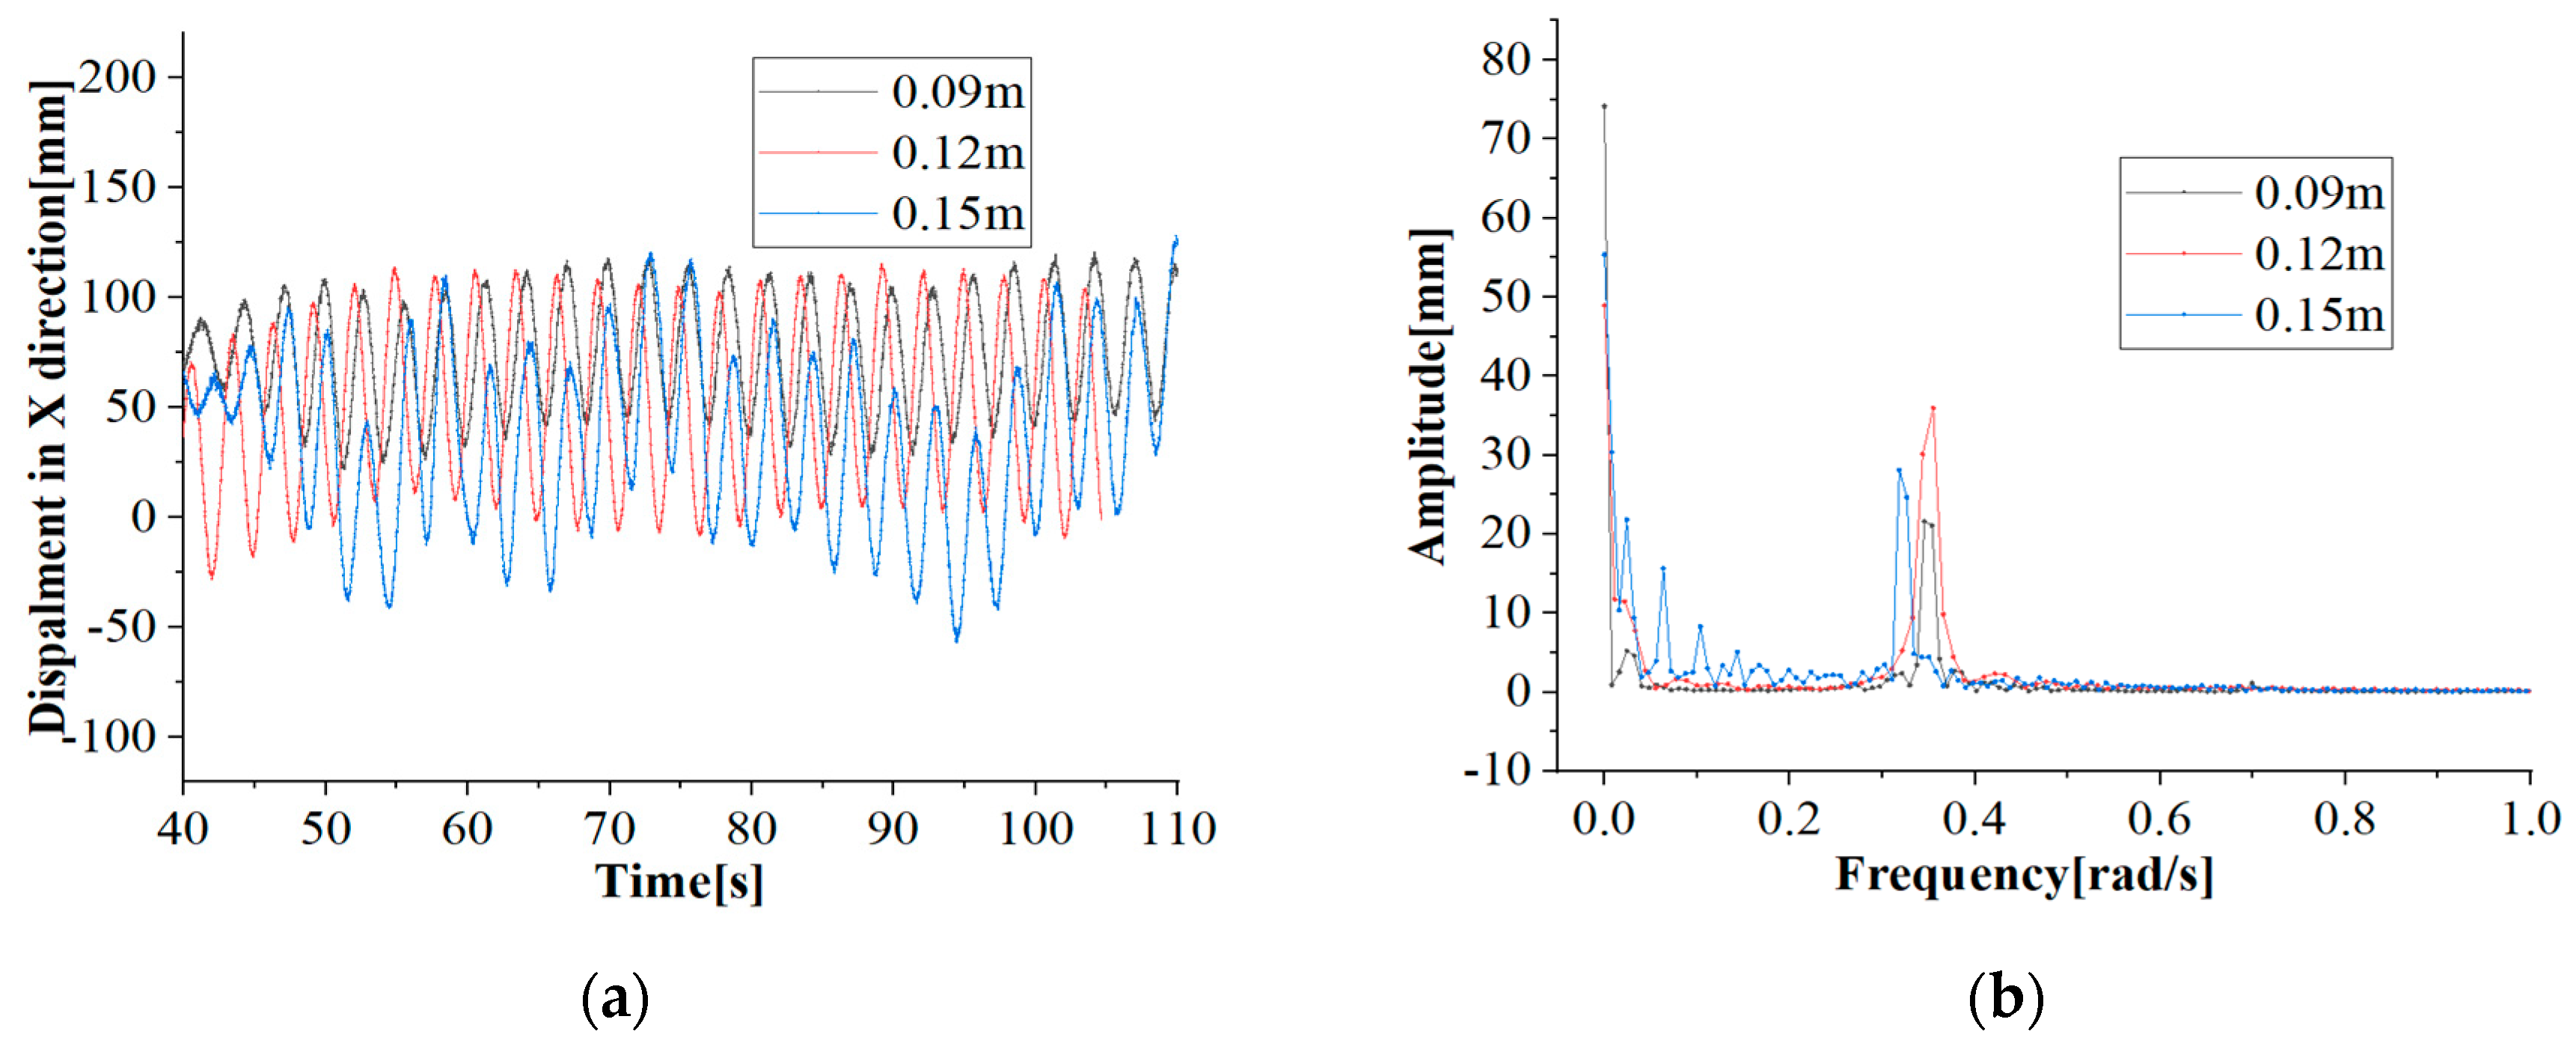
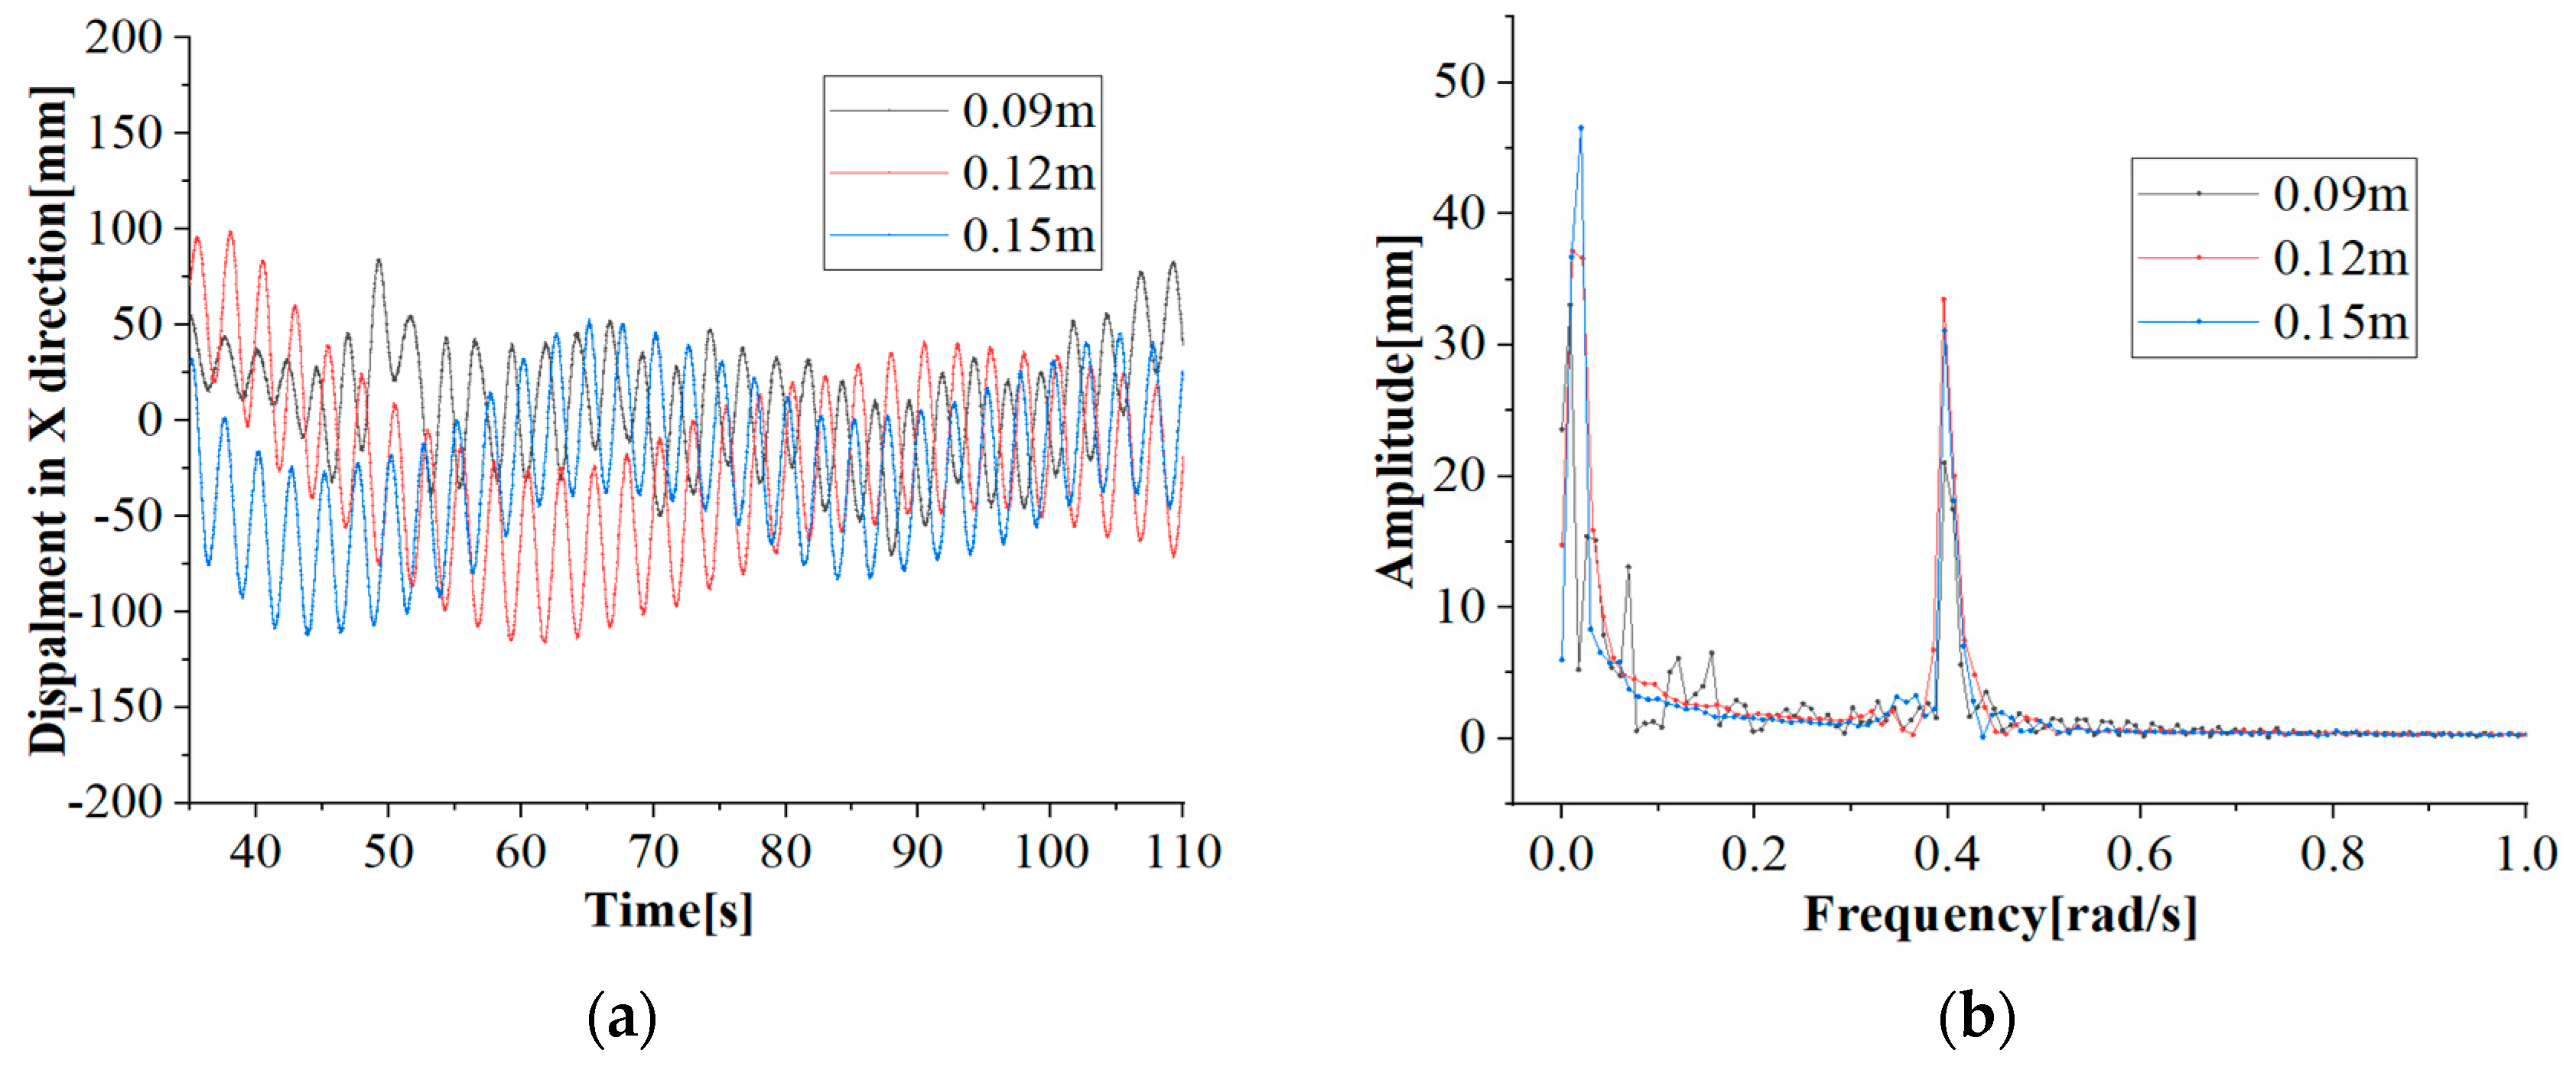
From Figure 13, Figure 14, Figure 15, Figure 16 and Figure 17, it can be observed that the time history curve of the surge of the pedestal shows a certain degree of periodicity, but the amplitude change of the heights is not obvious at the same frequency. In the frequency domain curve, the development trend of the curve for each wave frequency is consistent.
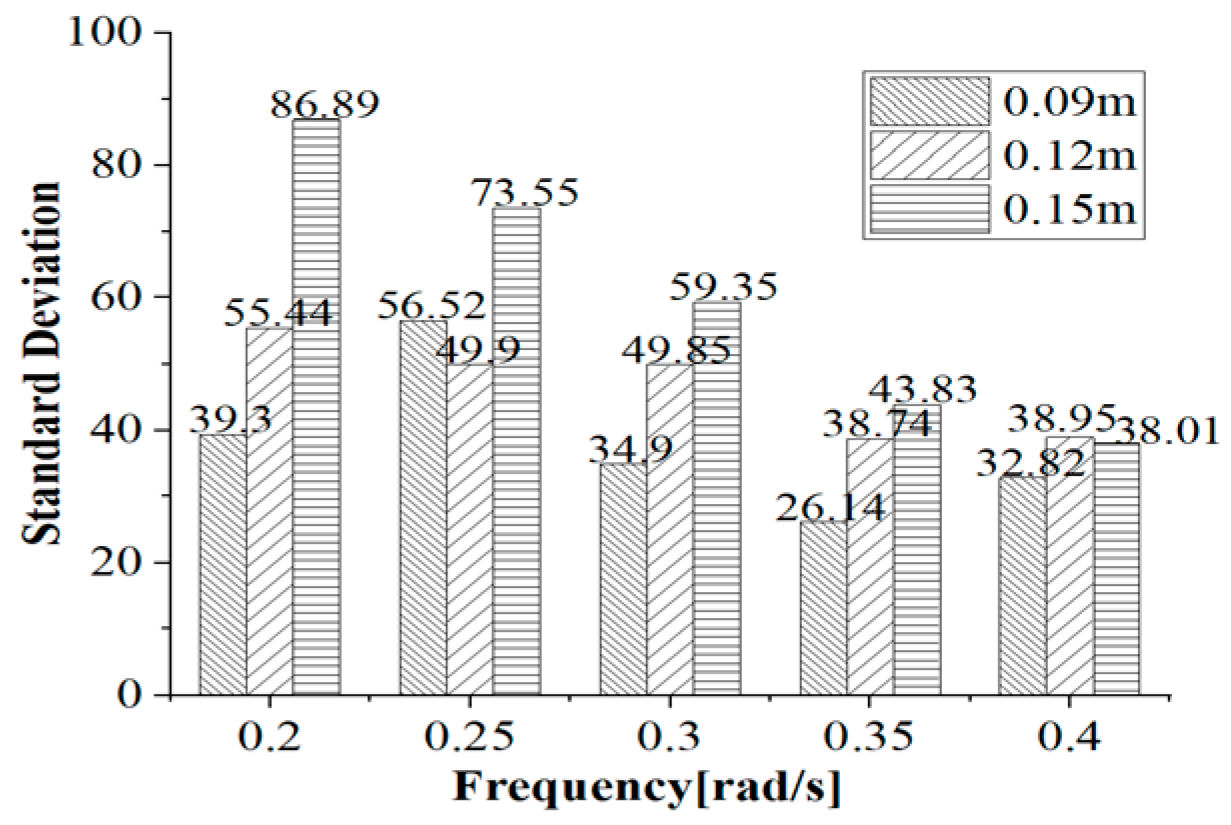
It can be found from Figure 18 that the standard deviation of surge decreases gradually with the increase of frequency when the experimental wave height is 0.12 m and 0.15 m; however, there is no obvious rule when the wave height is 0.09 m. At the same frequency, the standard deviation of the surge increases with the increase in wave height.
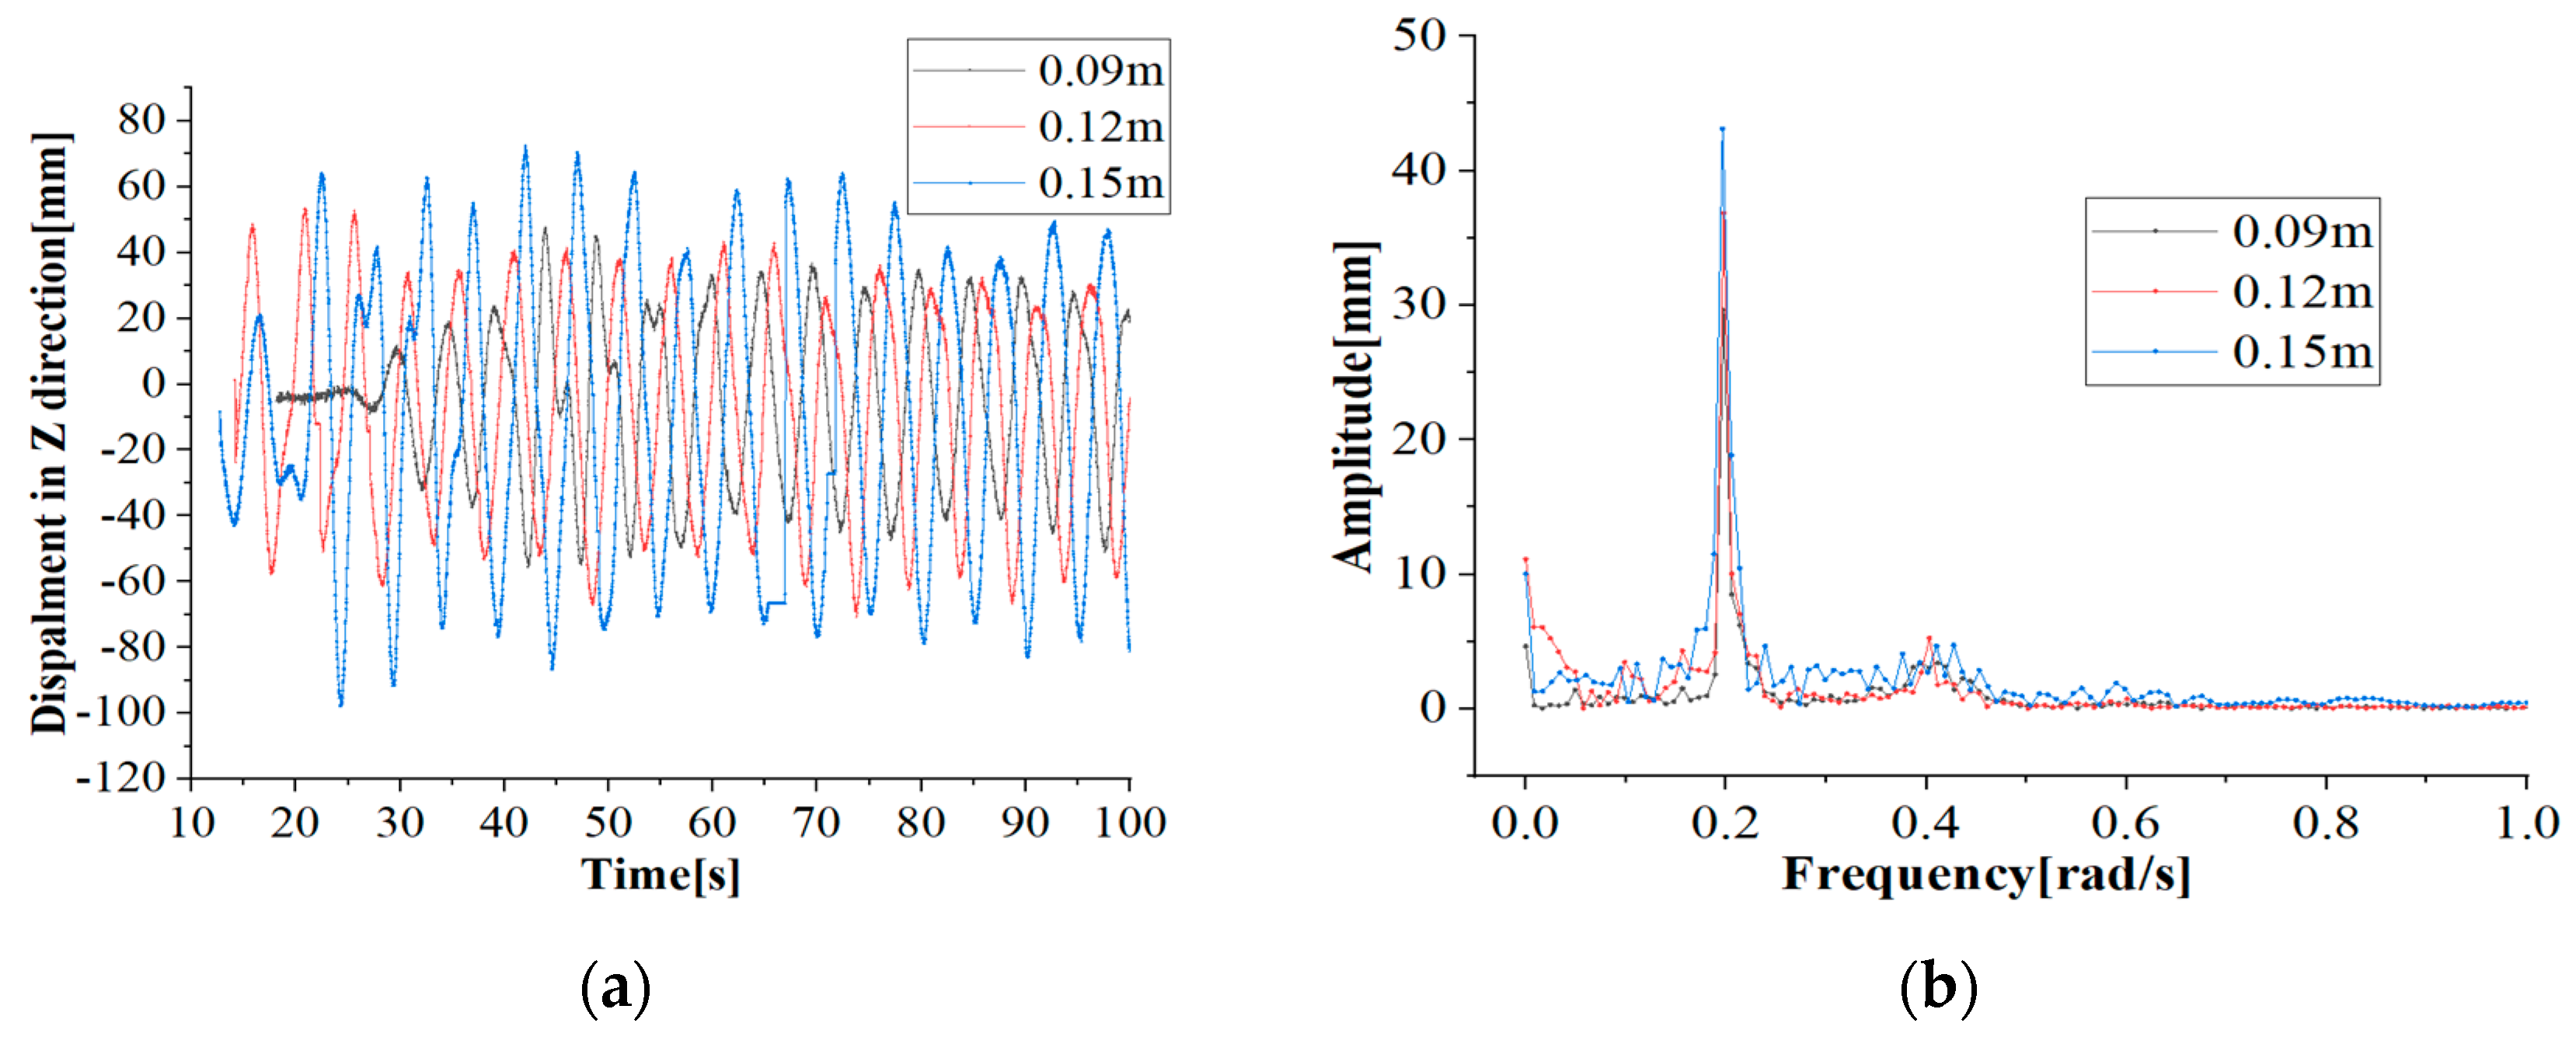
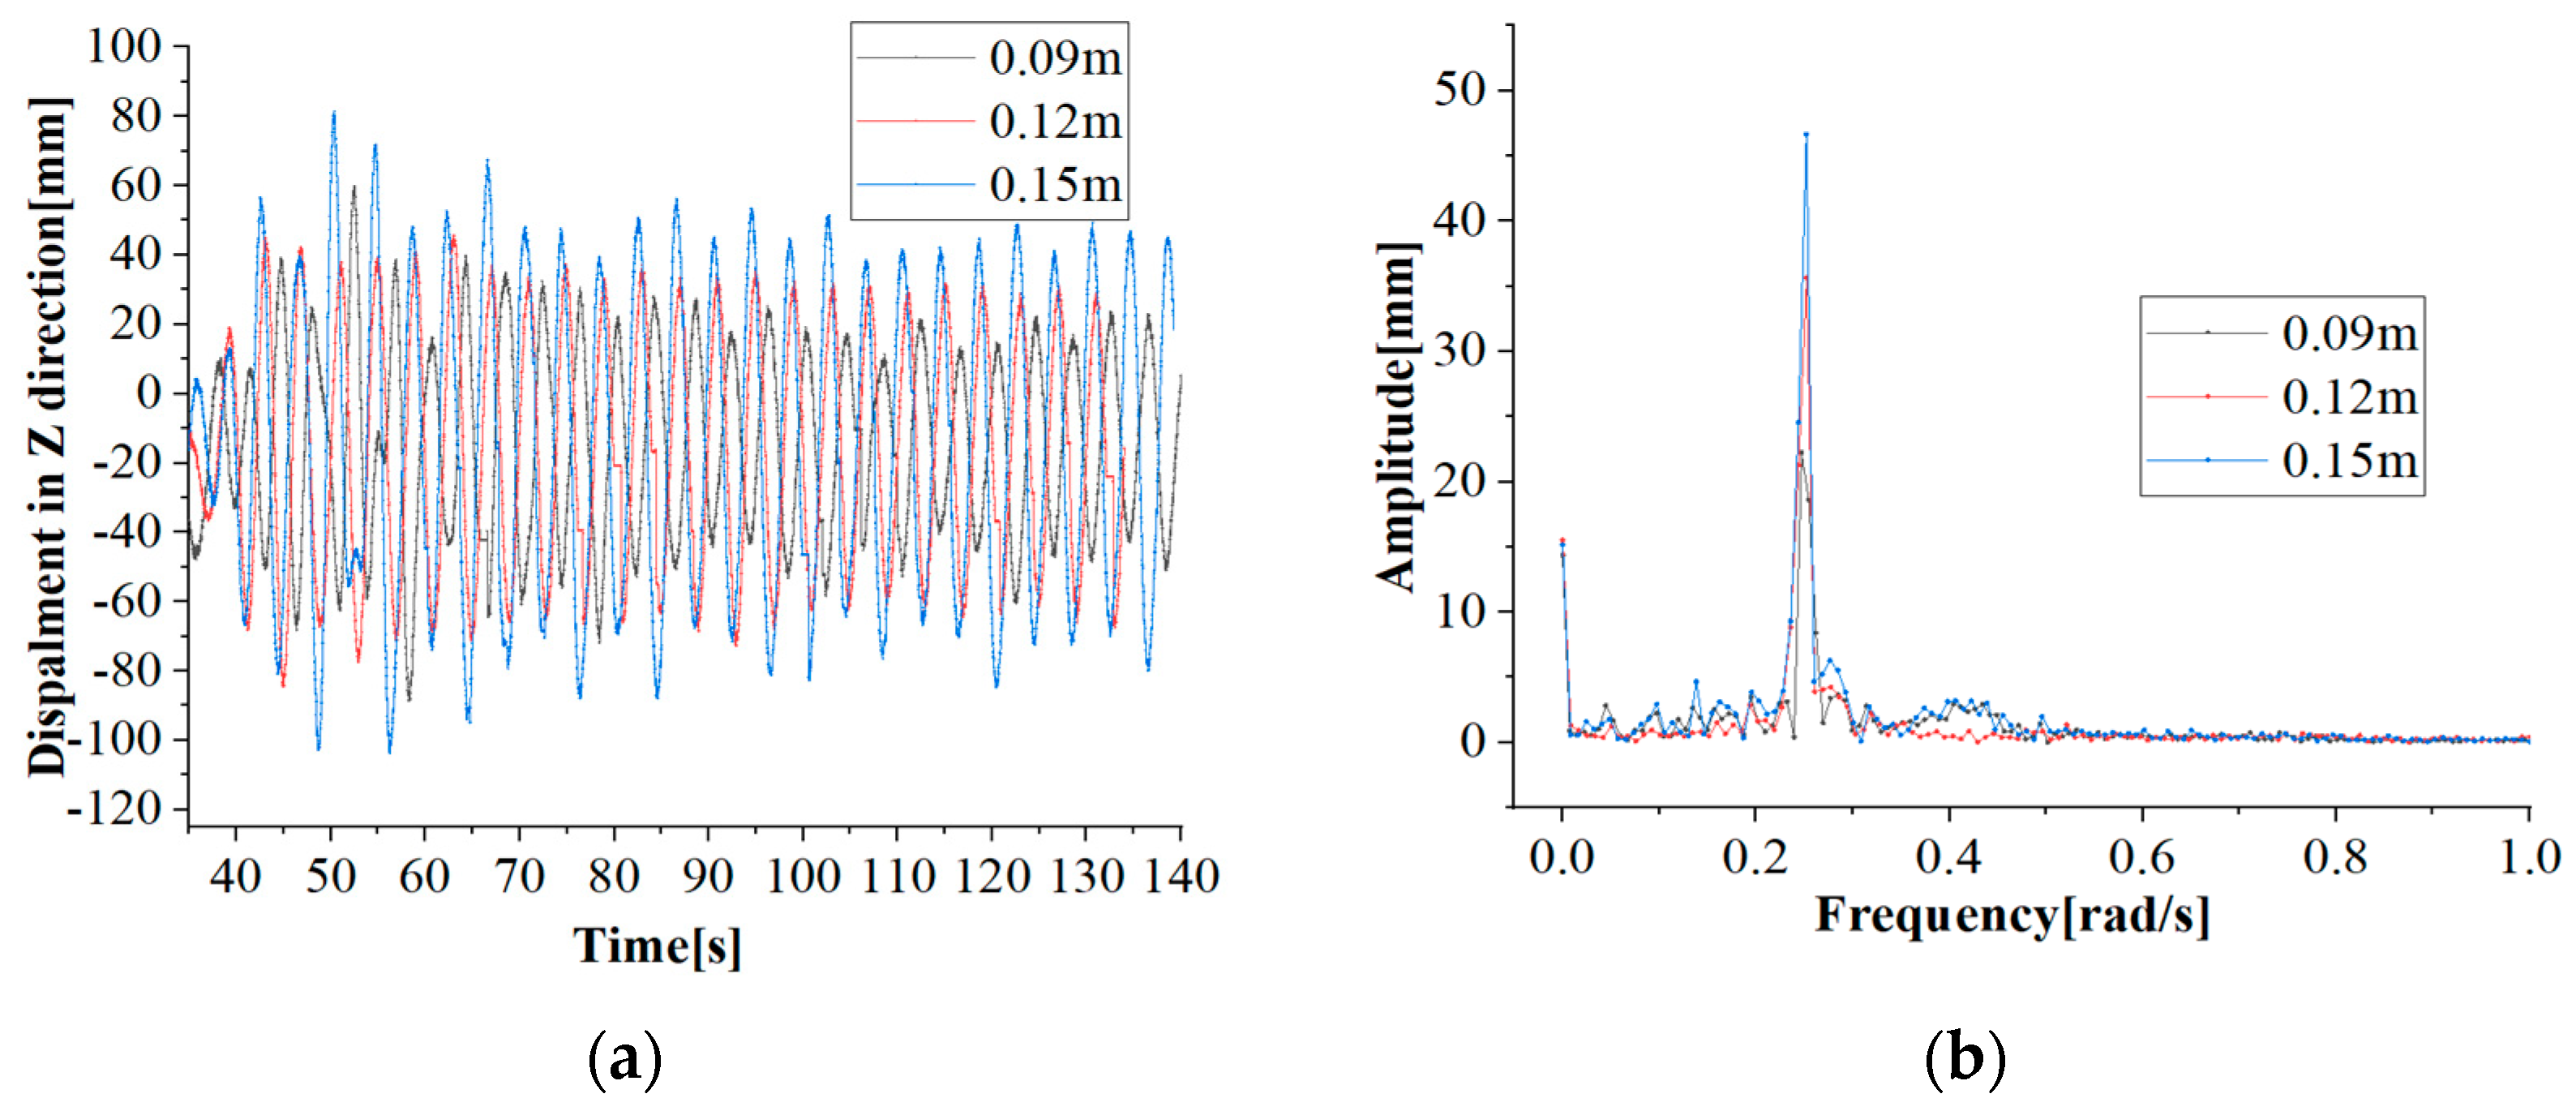
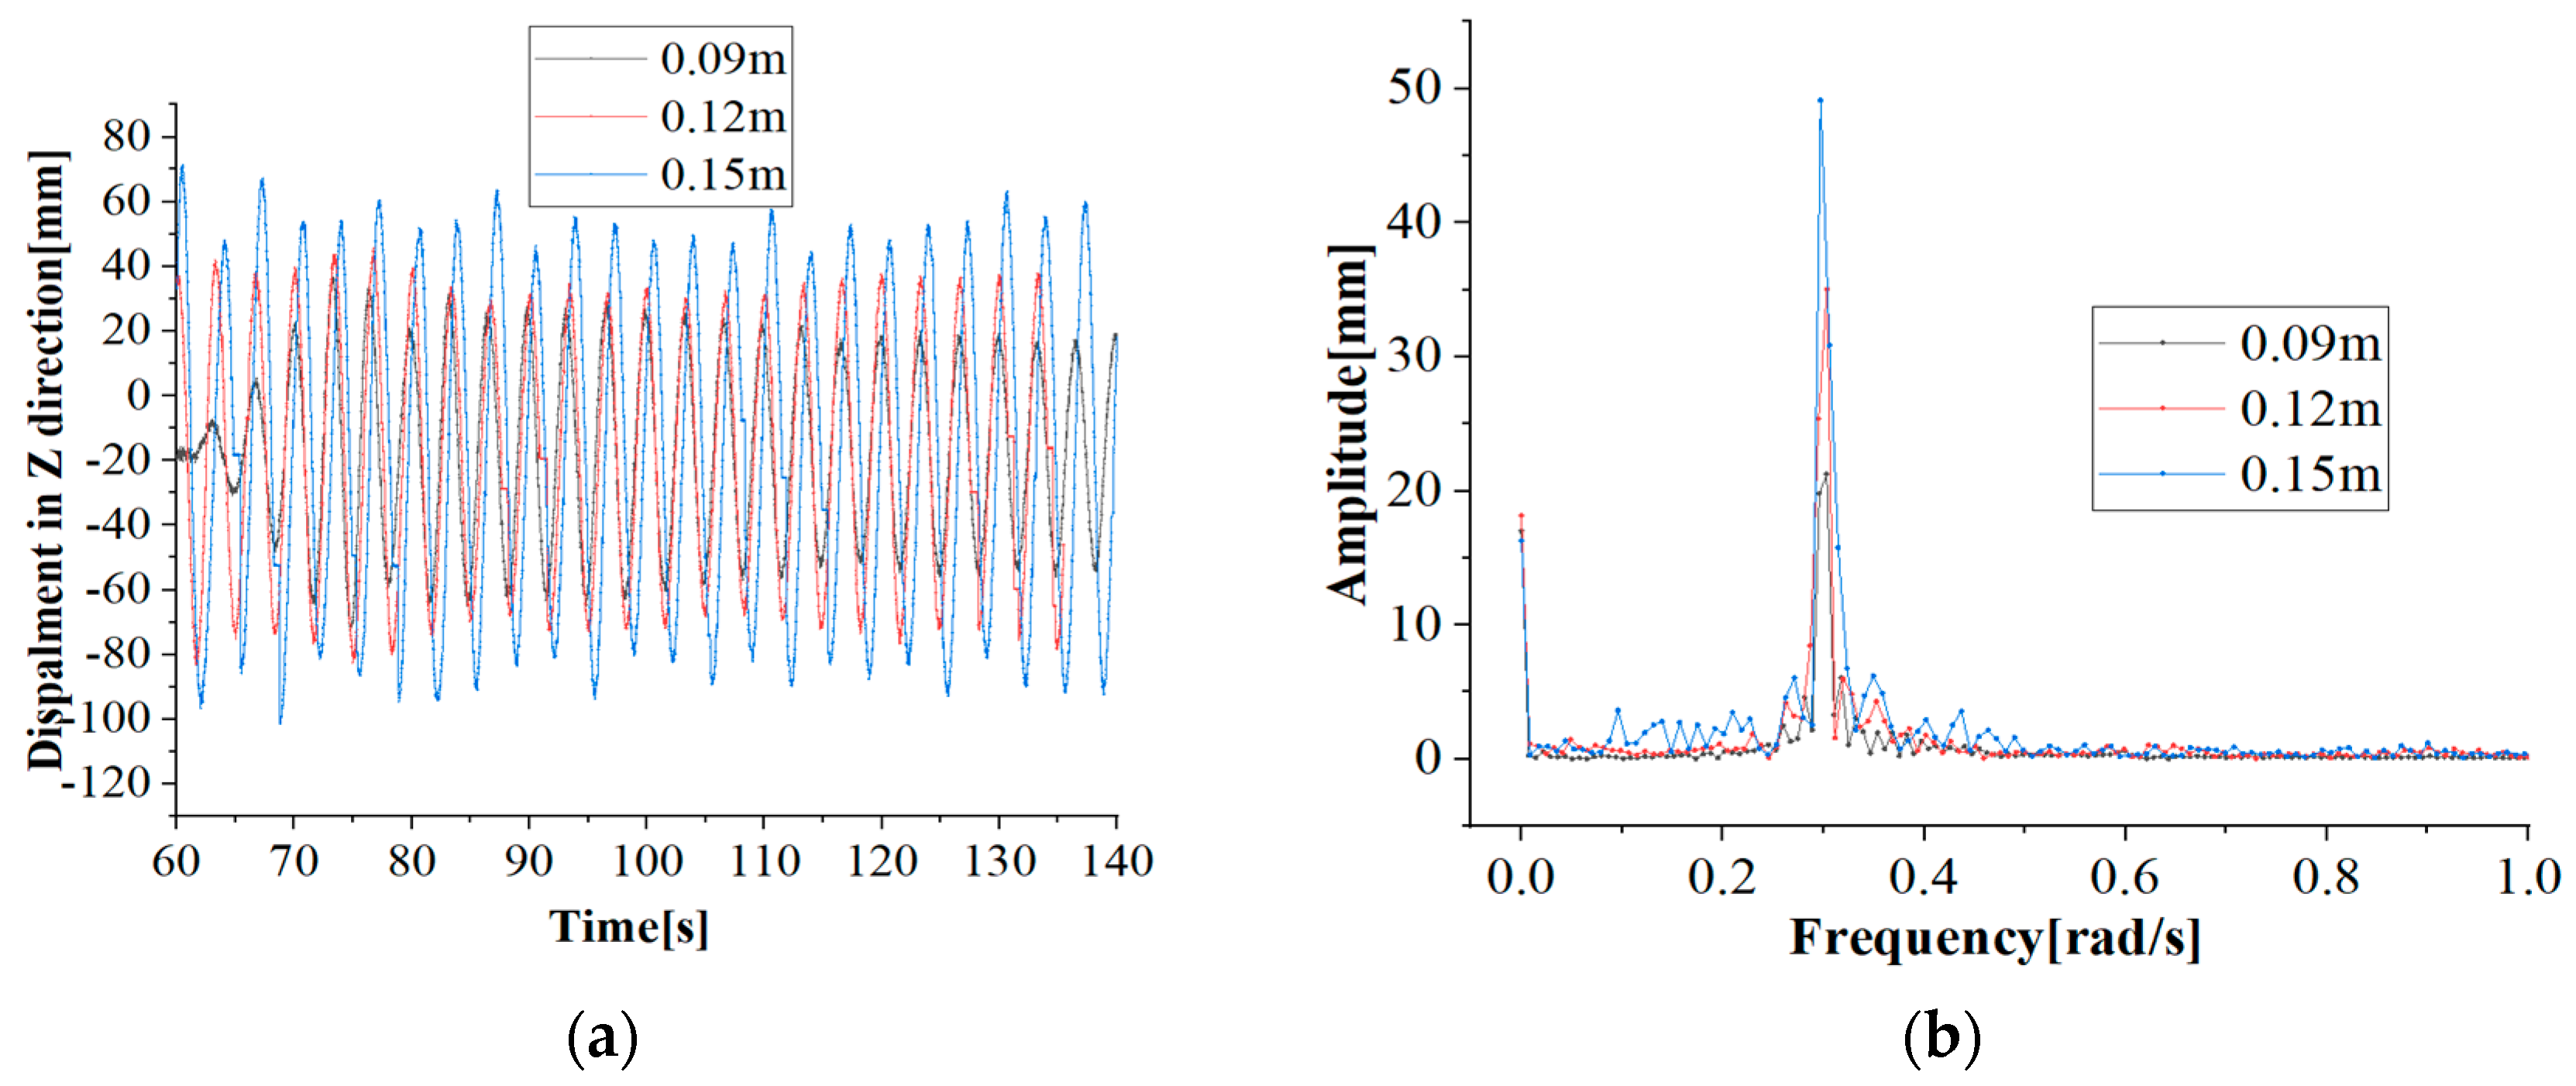
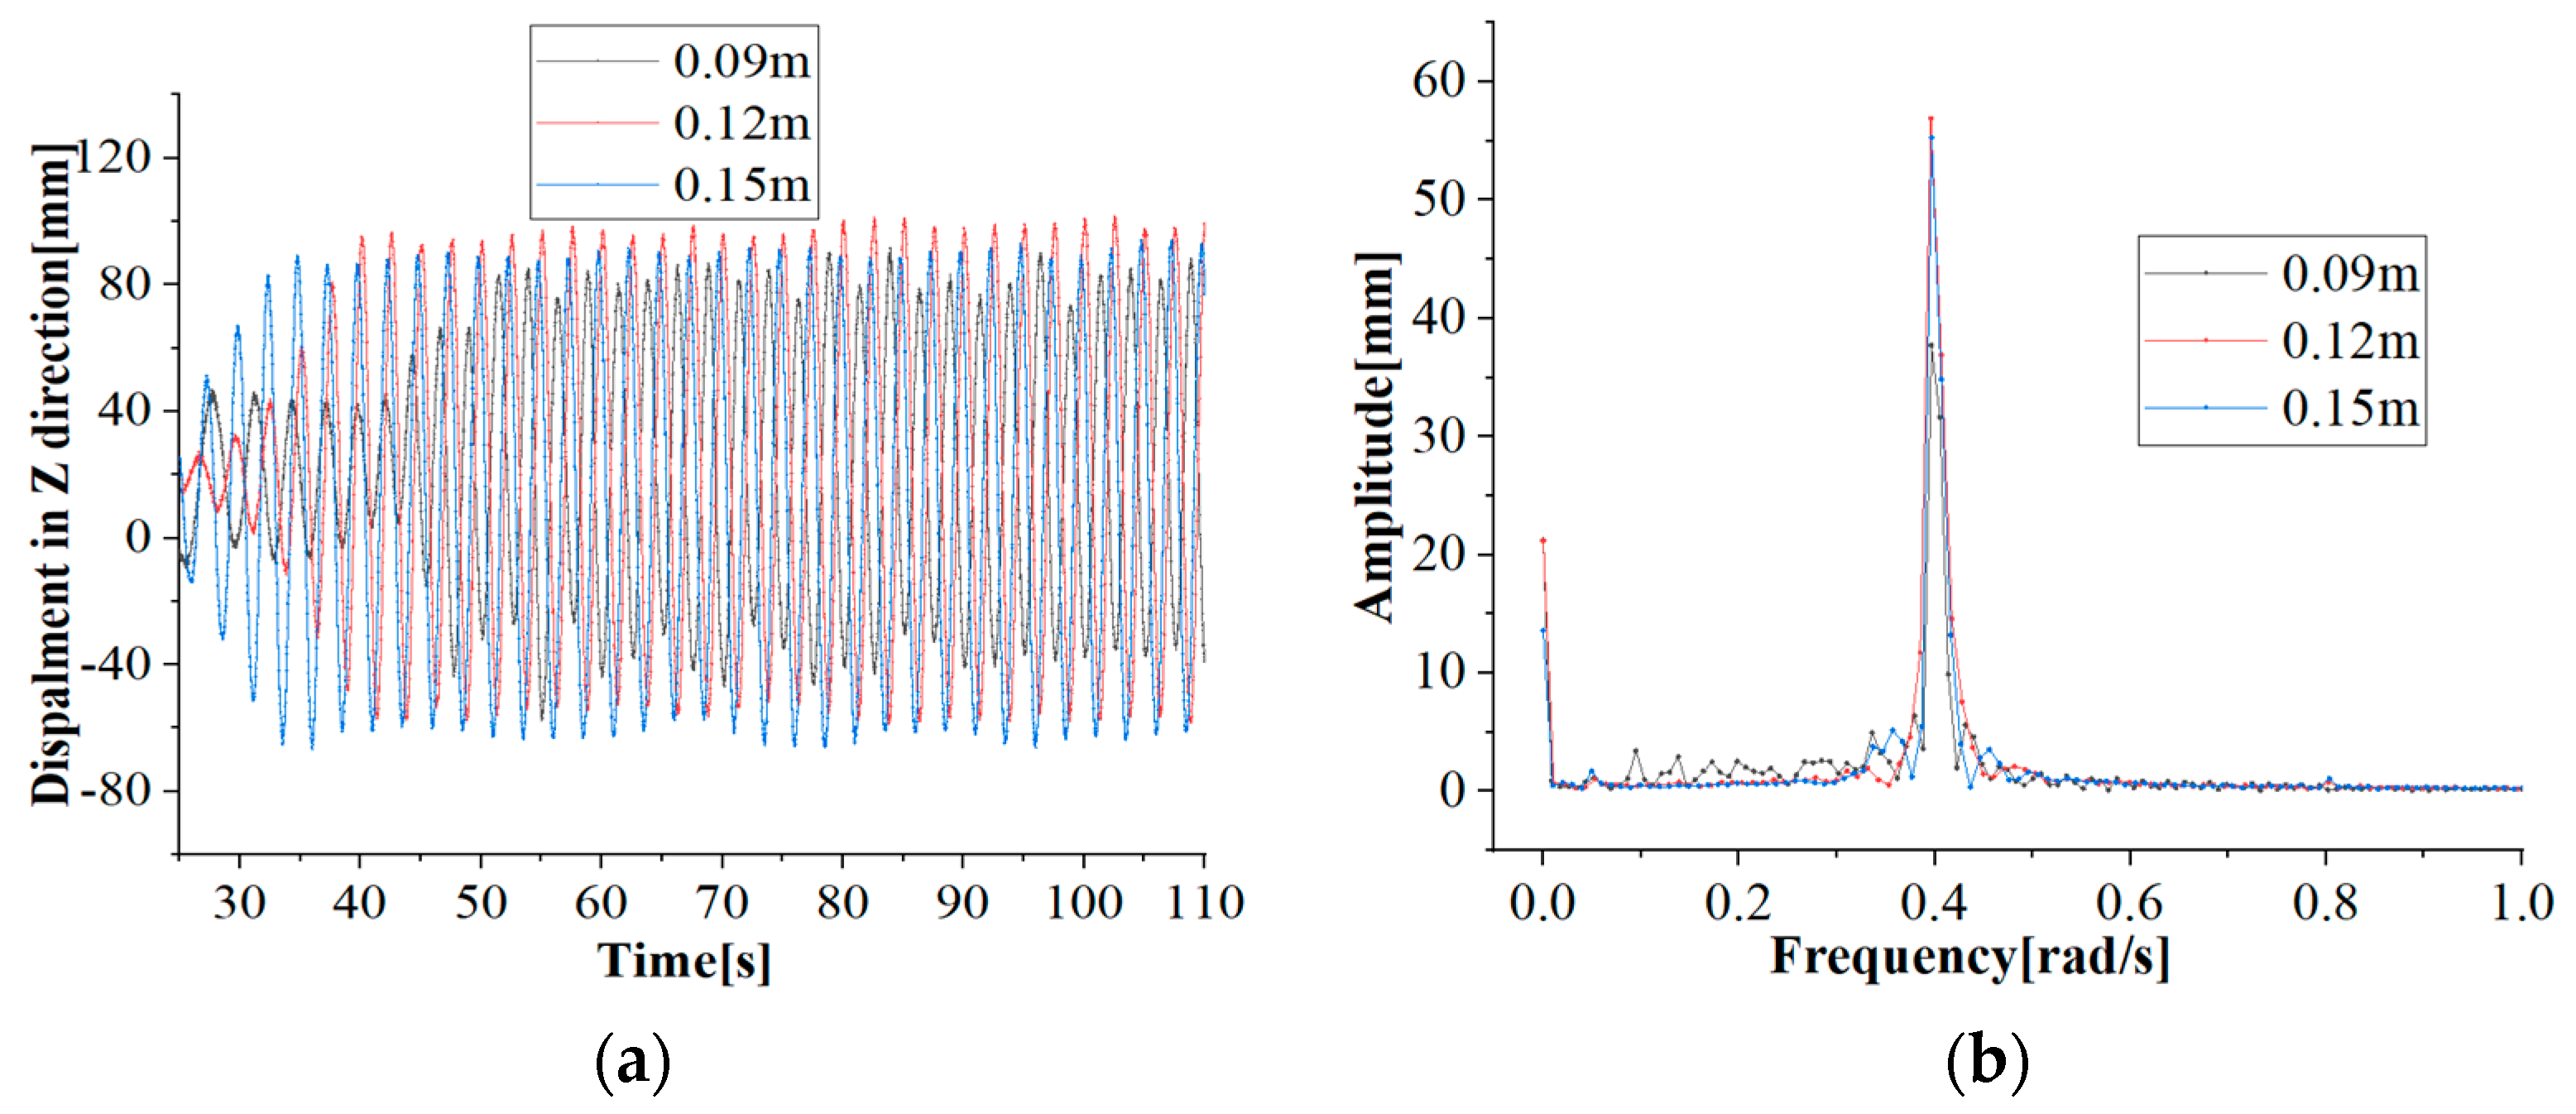
From Figure 19, Figure 20, Figure 21, Figure 22 and Figure 23, it can be found that in terms of the time history curve, under the premise of the same frequency, the greater the wave height, the greater the heave response. In the frequency domain curve, the development trend of the curve under each wave frequency is the same, and there are two obvious extreme points in the curve, and the frequency corresponding to the maximum value is consistent with the wave frequency.
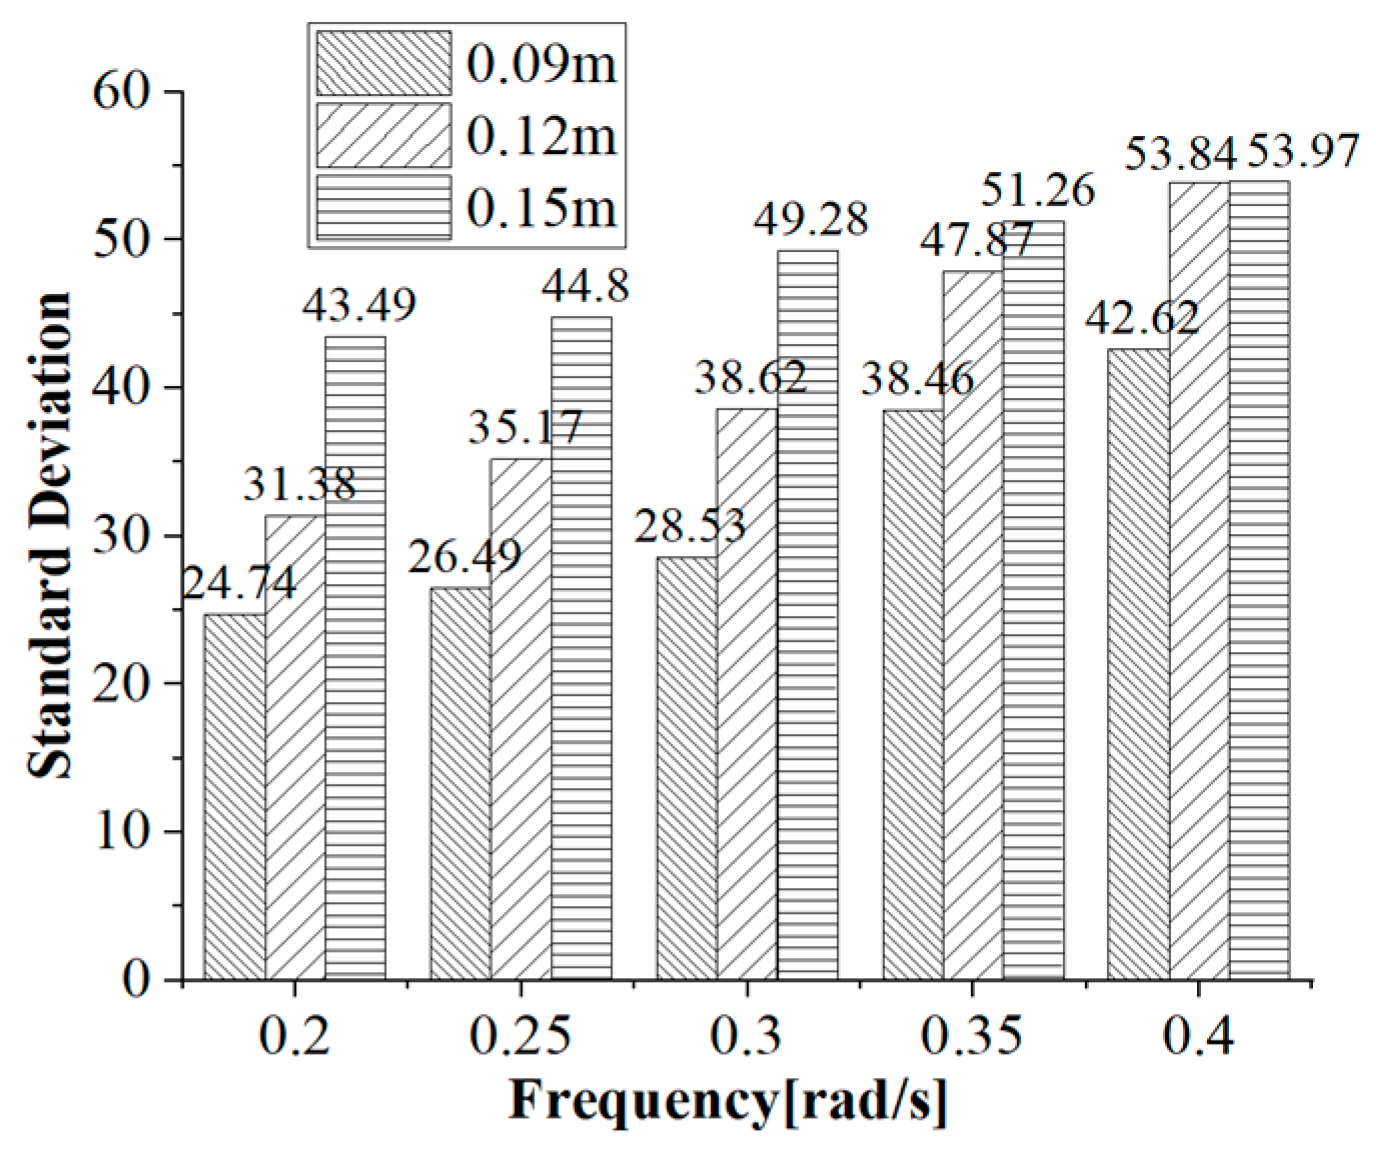
From Figure 24, it can be observed that the standard deviation of the heave of the pedestal increases gradually with the increase in wave height and frequency.

3. Numerical Simulations

3.1. Model Parameters and Working Conditions

In this chapter, the numerical simulation part of this study is introduced. The numerical simulation model refers to the platform in the above. In the research process, the wave period (T) and wave height (H) of numerical simulation are preset according to the working conditions that can be met by physical experiments. The types of wave periods and wave heights are listed in Table 3. There are five wave periods and five wave heights combined, for a total of 25 working conditions.

3.2. Computational Domain and Boundary Conditions

In this study, the Euler multiphase flow considering gravity was used in the calculation model, and the six-degrees-of-freedom motion of the pedestal in the first-order VOF wave was simulated using STAR-CCM+ software.
The rectangular calculation domain was adopted, and the coordinate origin was located in the vertical downward position of 2 m at the top of the main buoy section of the pedestal, which is located in the centre of the OXY plane.
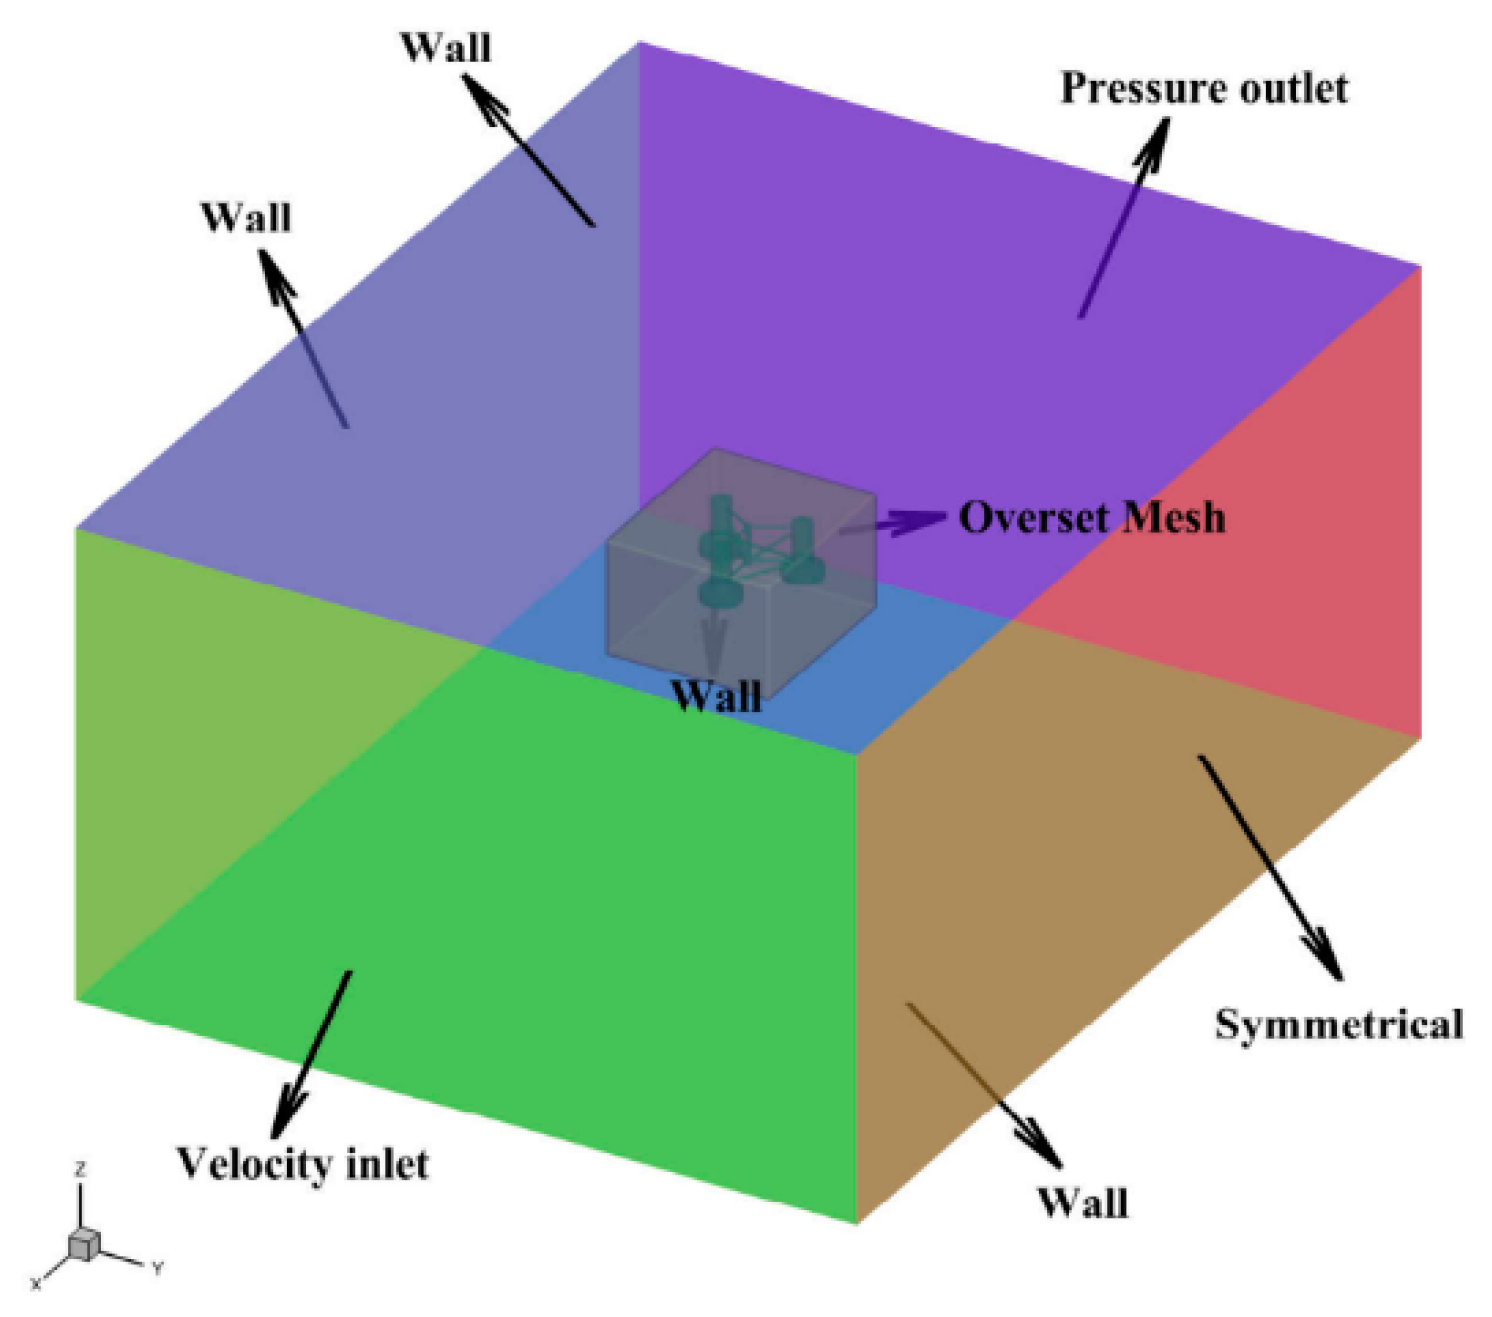
Boundary conditions were set as follows: the pedestal was set to the wall, the left and right sides of the calculation domain were symmetrical planes, the front of the calculation domain was the velocity inlet, the pressure outlet was directly behind the calculation domain, and the other surfaces of the calculation domain were the wall plane. Refer to Figure 25 for details.
Setting of mooring: three catenary mooring lines is adopted, and the angle between each catenary line is 120°. The fairleads are at the bottom of the buoy and the bottom of the calculation domain is connected with the catenary. The mass per unit length of the mooring line is 113.4 kg/m, and the tensile stiffness is 7.536 × 10⁸ N. Refer to Figure 26 for details.
In the process of the numerical simulation, with the dynamic mesh technology, the wave height, wave period, and initial position of the wave are set in the first-order VOF wave. The overall motion of the pedestal was monitored by the probe point located at the top of the main buoy section. Owing to the symmetry of the flow field, model, and mooring, the motion in the Y direction was not considered. The hydrodynamic characteristics of the pedestal with a perforated anti-heave device were studied based on the actual displacement in the X and Z directions.
Through the verification of different sizes of computational domains and different density grid models, considering the number of meshes, the time-consuming calculation, and the reliability of the results, when the calculation results remain relatively stable, the size of the computational domain and the number of grids will not be increased, and a calculation domain of 600 m × 480 m × 290 m is selected. At this time, the corresponding number of meshes is 278,624.The mesh layout is shown in Figure 27.

3.3. Hydrodynamic Performance of the Pedestal with Perforated Anti-Heave Device with Different Chamfer

To study the influence of different chamfers on the hydrodynamic performance of a pedestal with a perforated anti-heave device, the motion with five different chamfered perforations under the same wave period and wave height was studied. The working condition of numerical simulation is presented in Table 4.
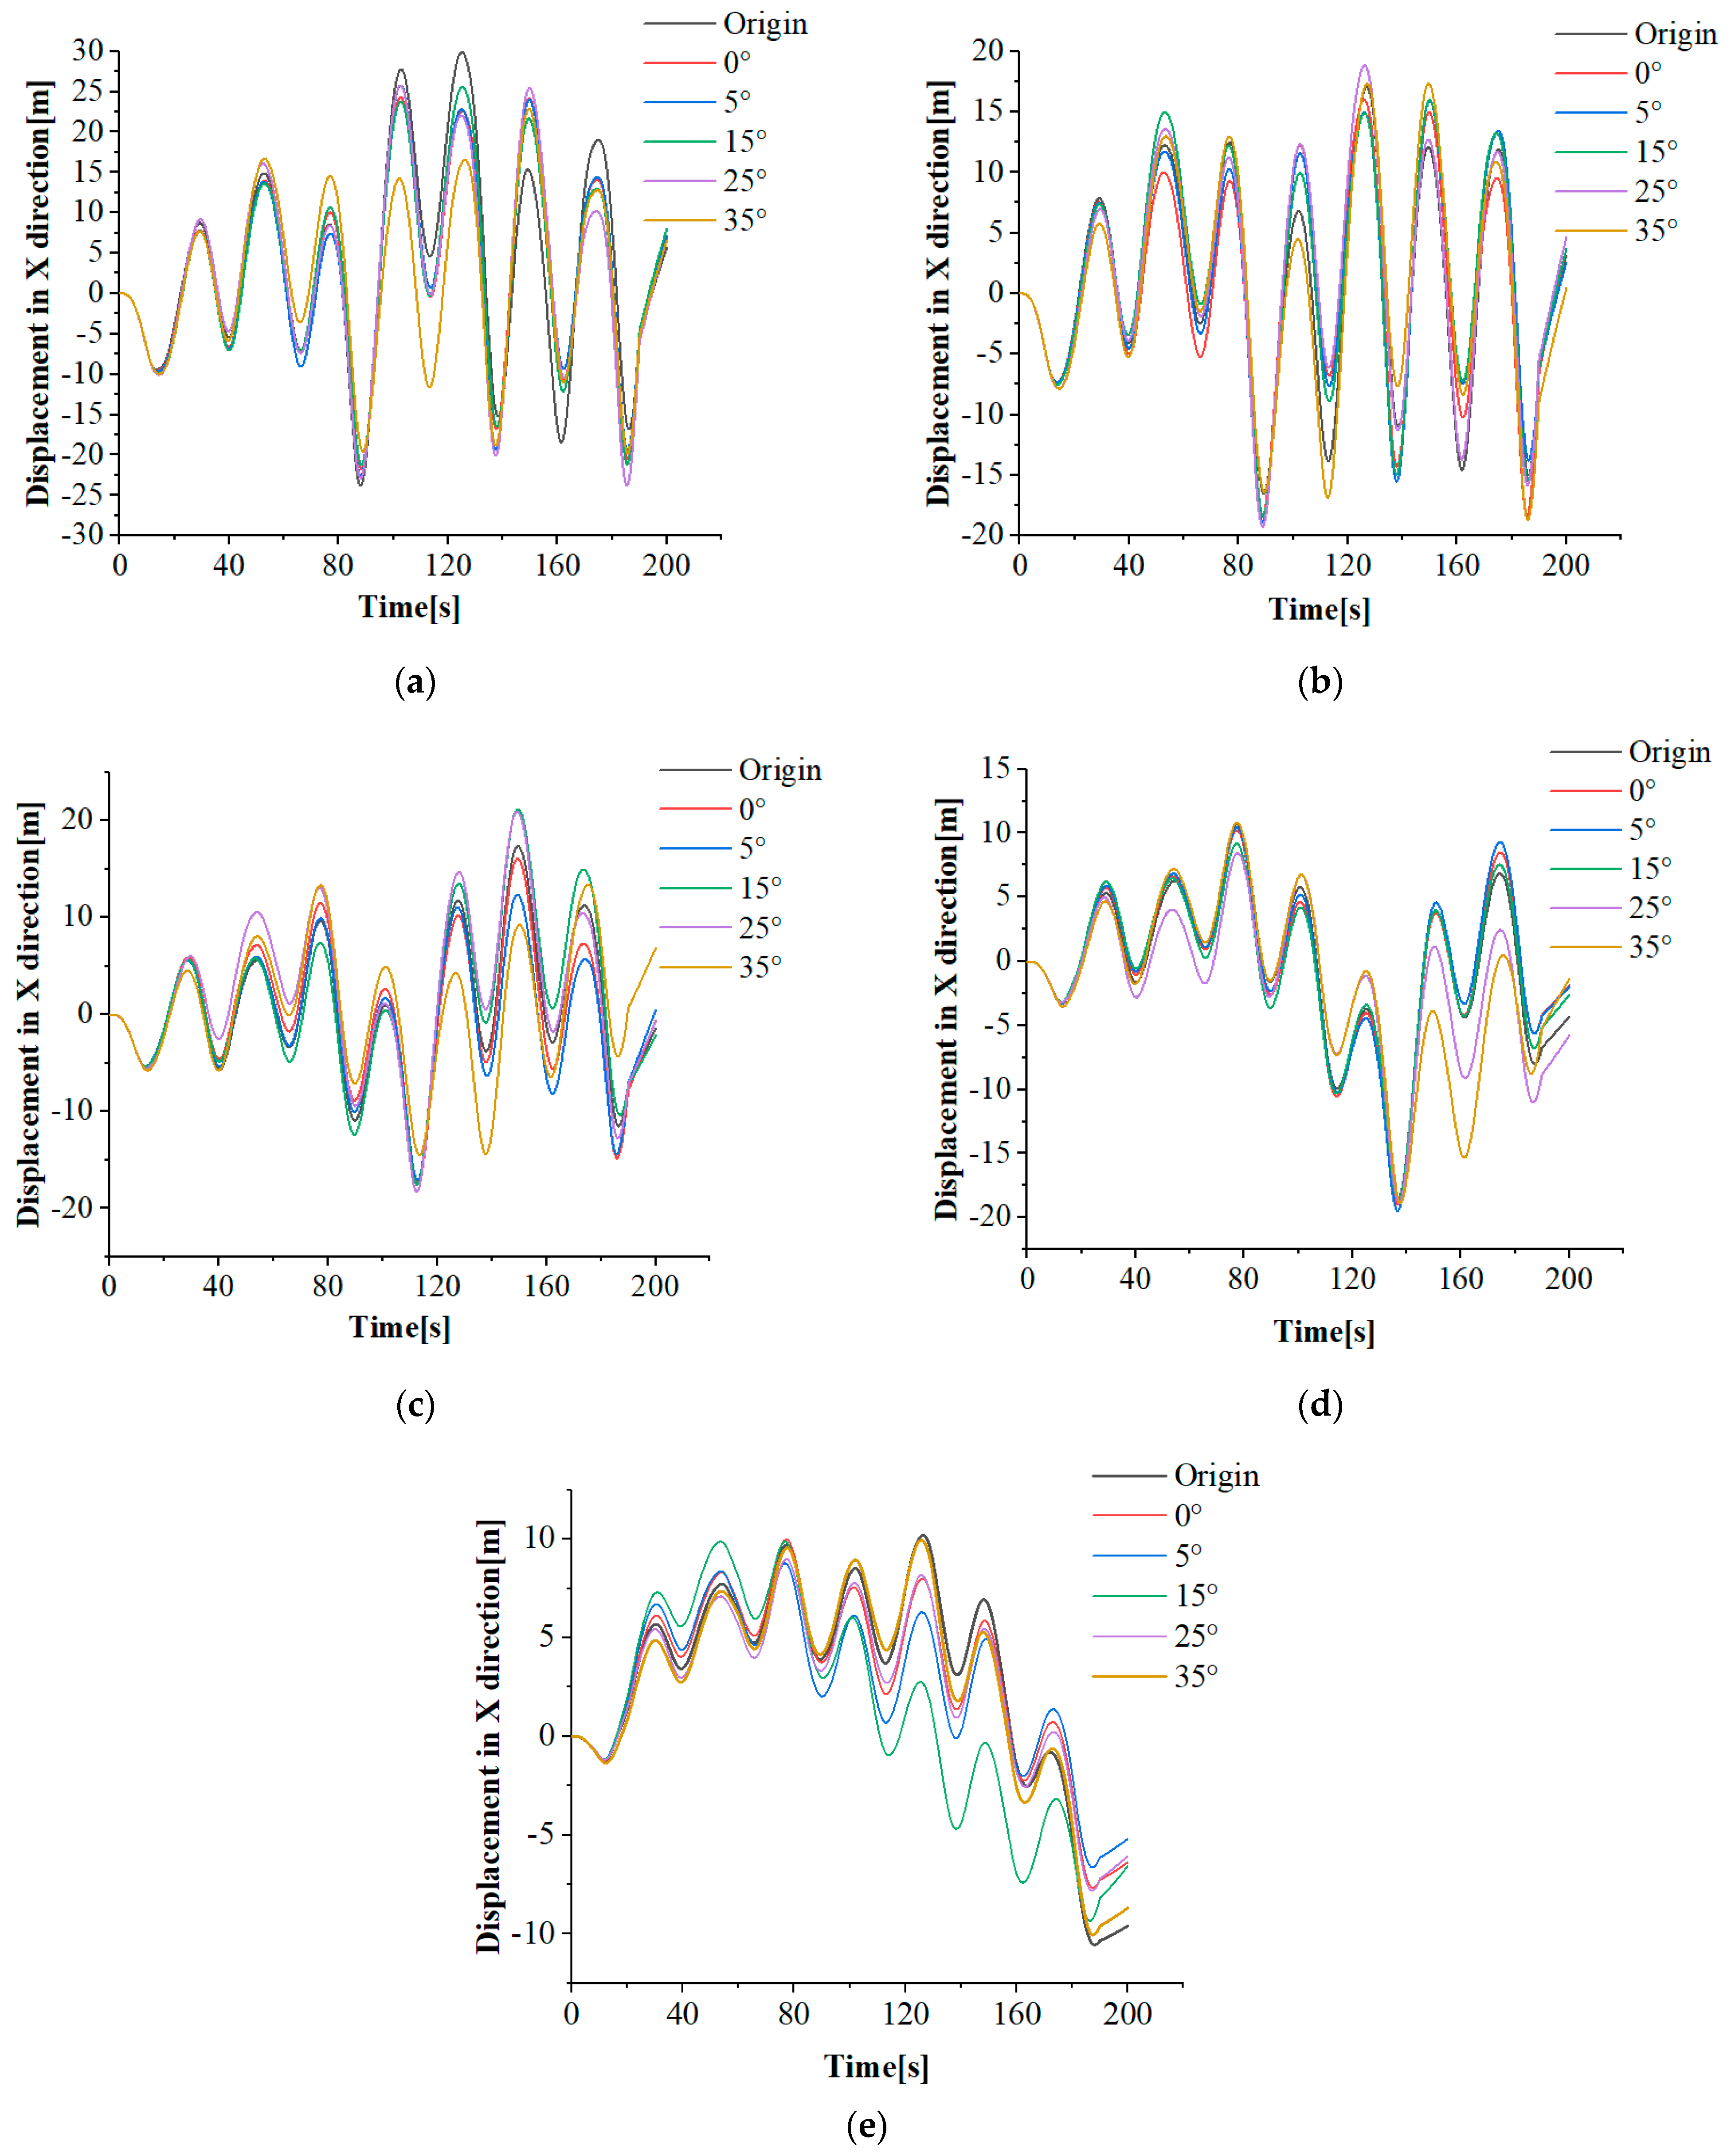
Select the working condition with an obvious anti-surge effect (T = 25.82 s) in the numerical simulation, and draw its displacement in the X direction, as shown in Figure 28 below. The origin in the figure represents the initial model without opening the anti-surge device, 0° represents the anti-surge device for drilling vertical holes, and 5°, 15°, 25°, 35° represents the 5°, 15°, 25°, 35° chamfered perforated model. The same content appearing later in the article also represents the same meaning.
Process the data in Figure 28 and subtract the movement of the model in the X direction for each perforation case from the original non-perforation model, and calculate its average absolute deviation to avoid the problem of deviation offset. The relevant data are shown in Table 5.
As can be seen from the above, when the wave period is T = 25.82 s, in most cases, the wave height is small, the anti-heave effect (absolute deviation from the original model) is not obvious, mainly because the pedestal is less affected by the wave, and the external interference will have a significant impact on its trajectory. In the case of a large wave height, the model with different perforations has a certain anti-heave effect in the X direction in each wave period, but the anti-heave effect does not increase with an increase in the chamfer.
The anti-heave effect of the 35° chamfered perforated model is the most obvious when the wave height is 3.6, 5.4, and 9 m. When the wave height is 1.8 m, the effect of 15° model is the best. When the wave height is 7.2 m, the effect of the 0° model is the most obvious, but there is little difference between it and the 35° model. Therefore, we consider selecting the 35° chamfered perforated model with an obvious anti-heave effect under most working conditions as the object of follow-up research. In other wave periods, the anti-heave pedestal also shows the same law.
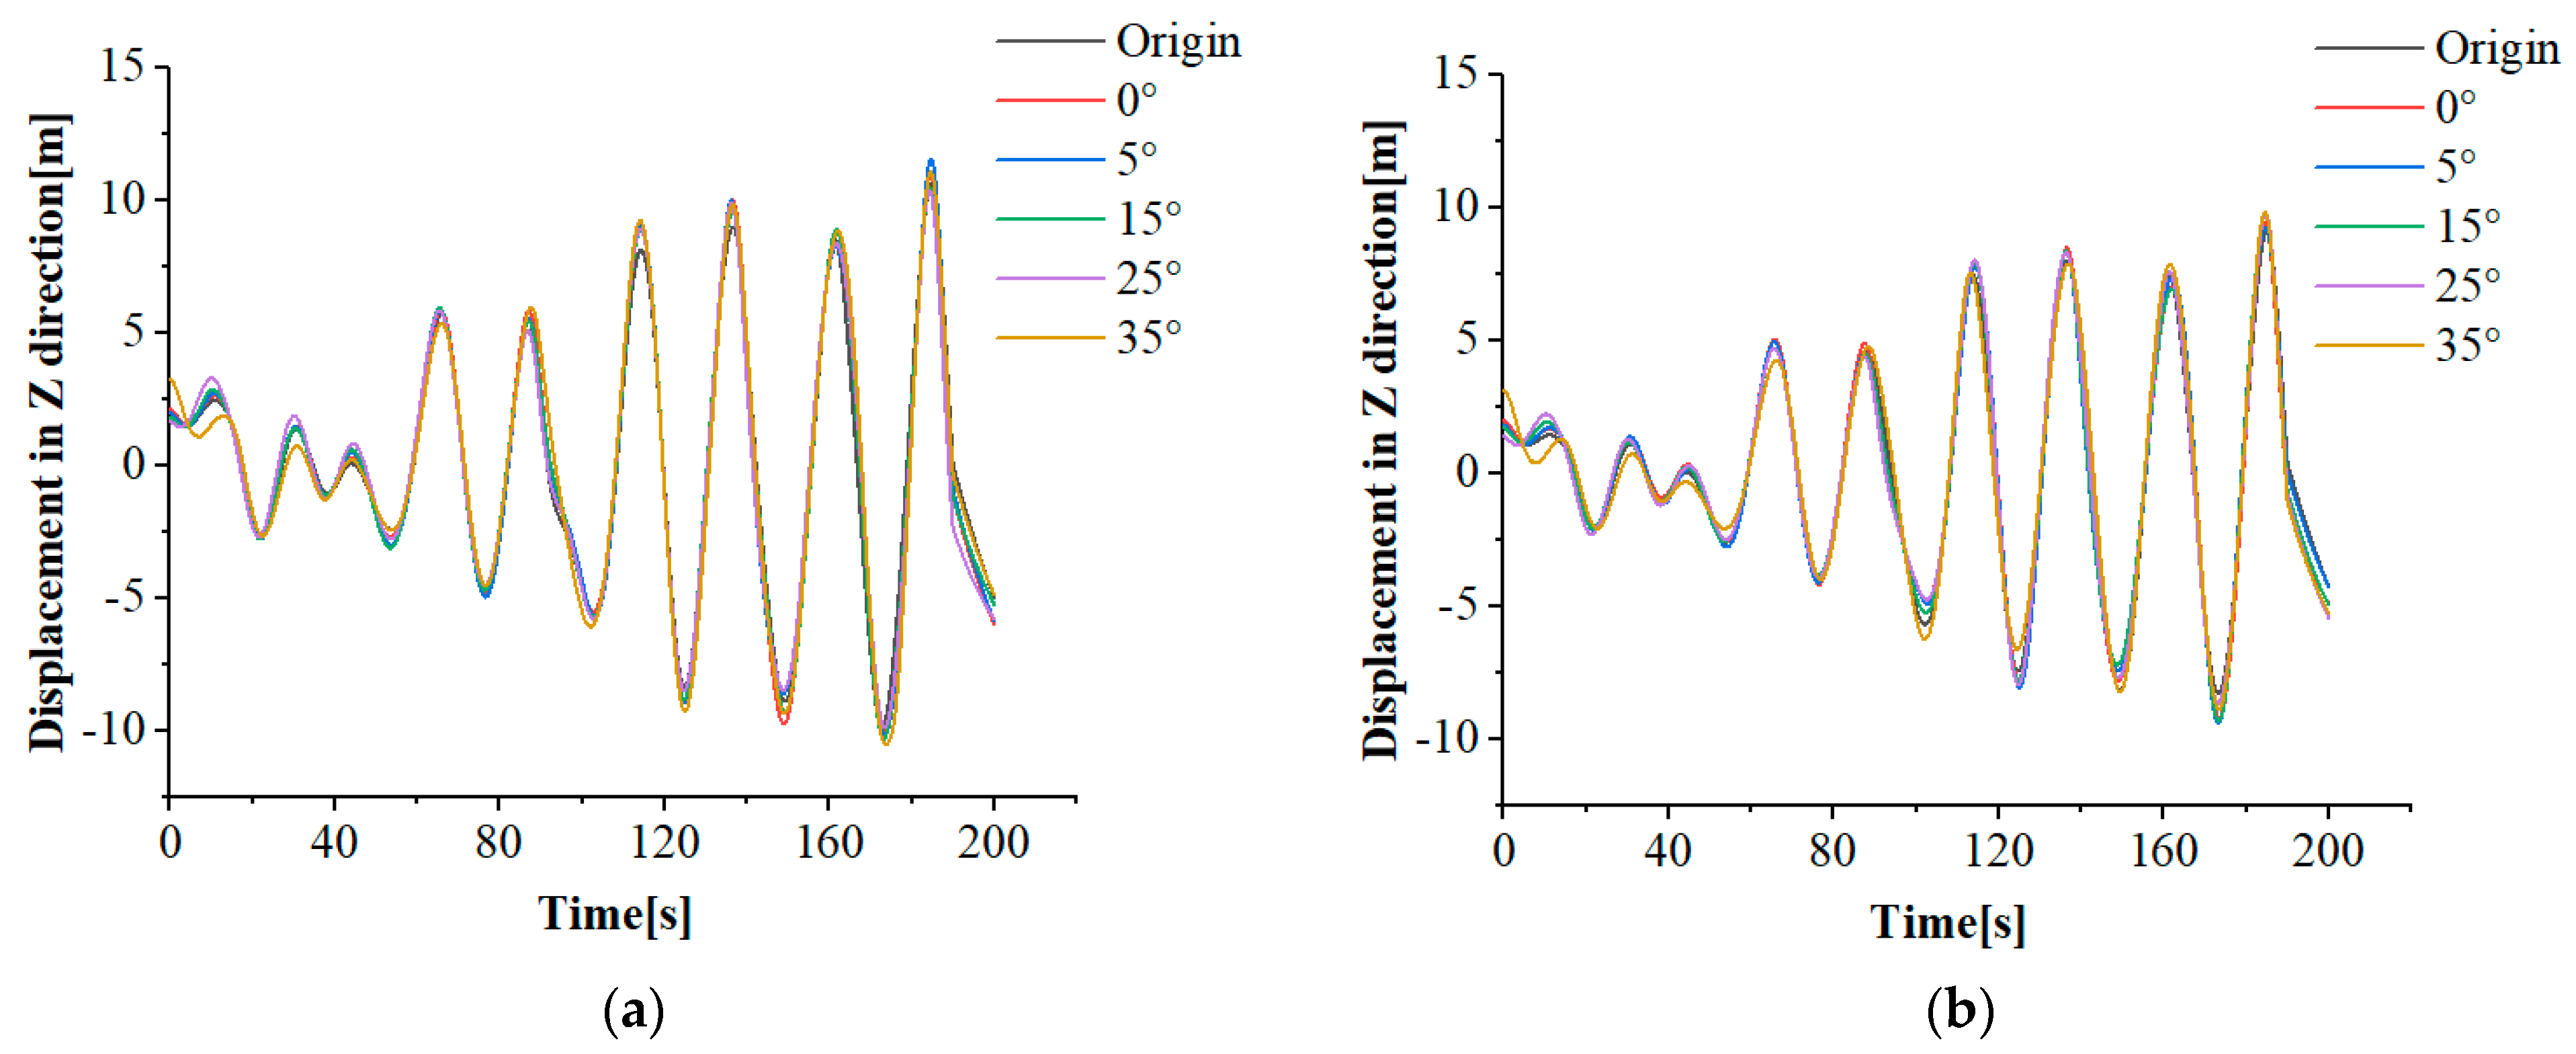
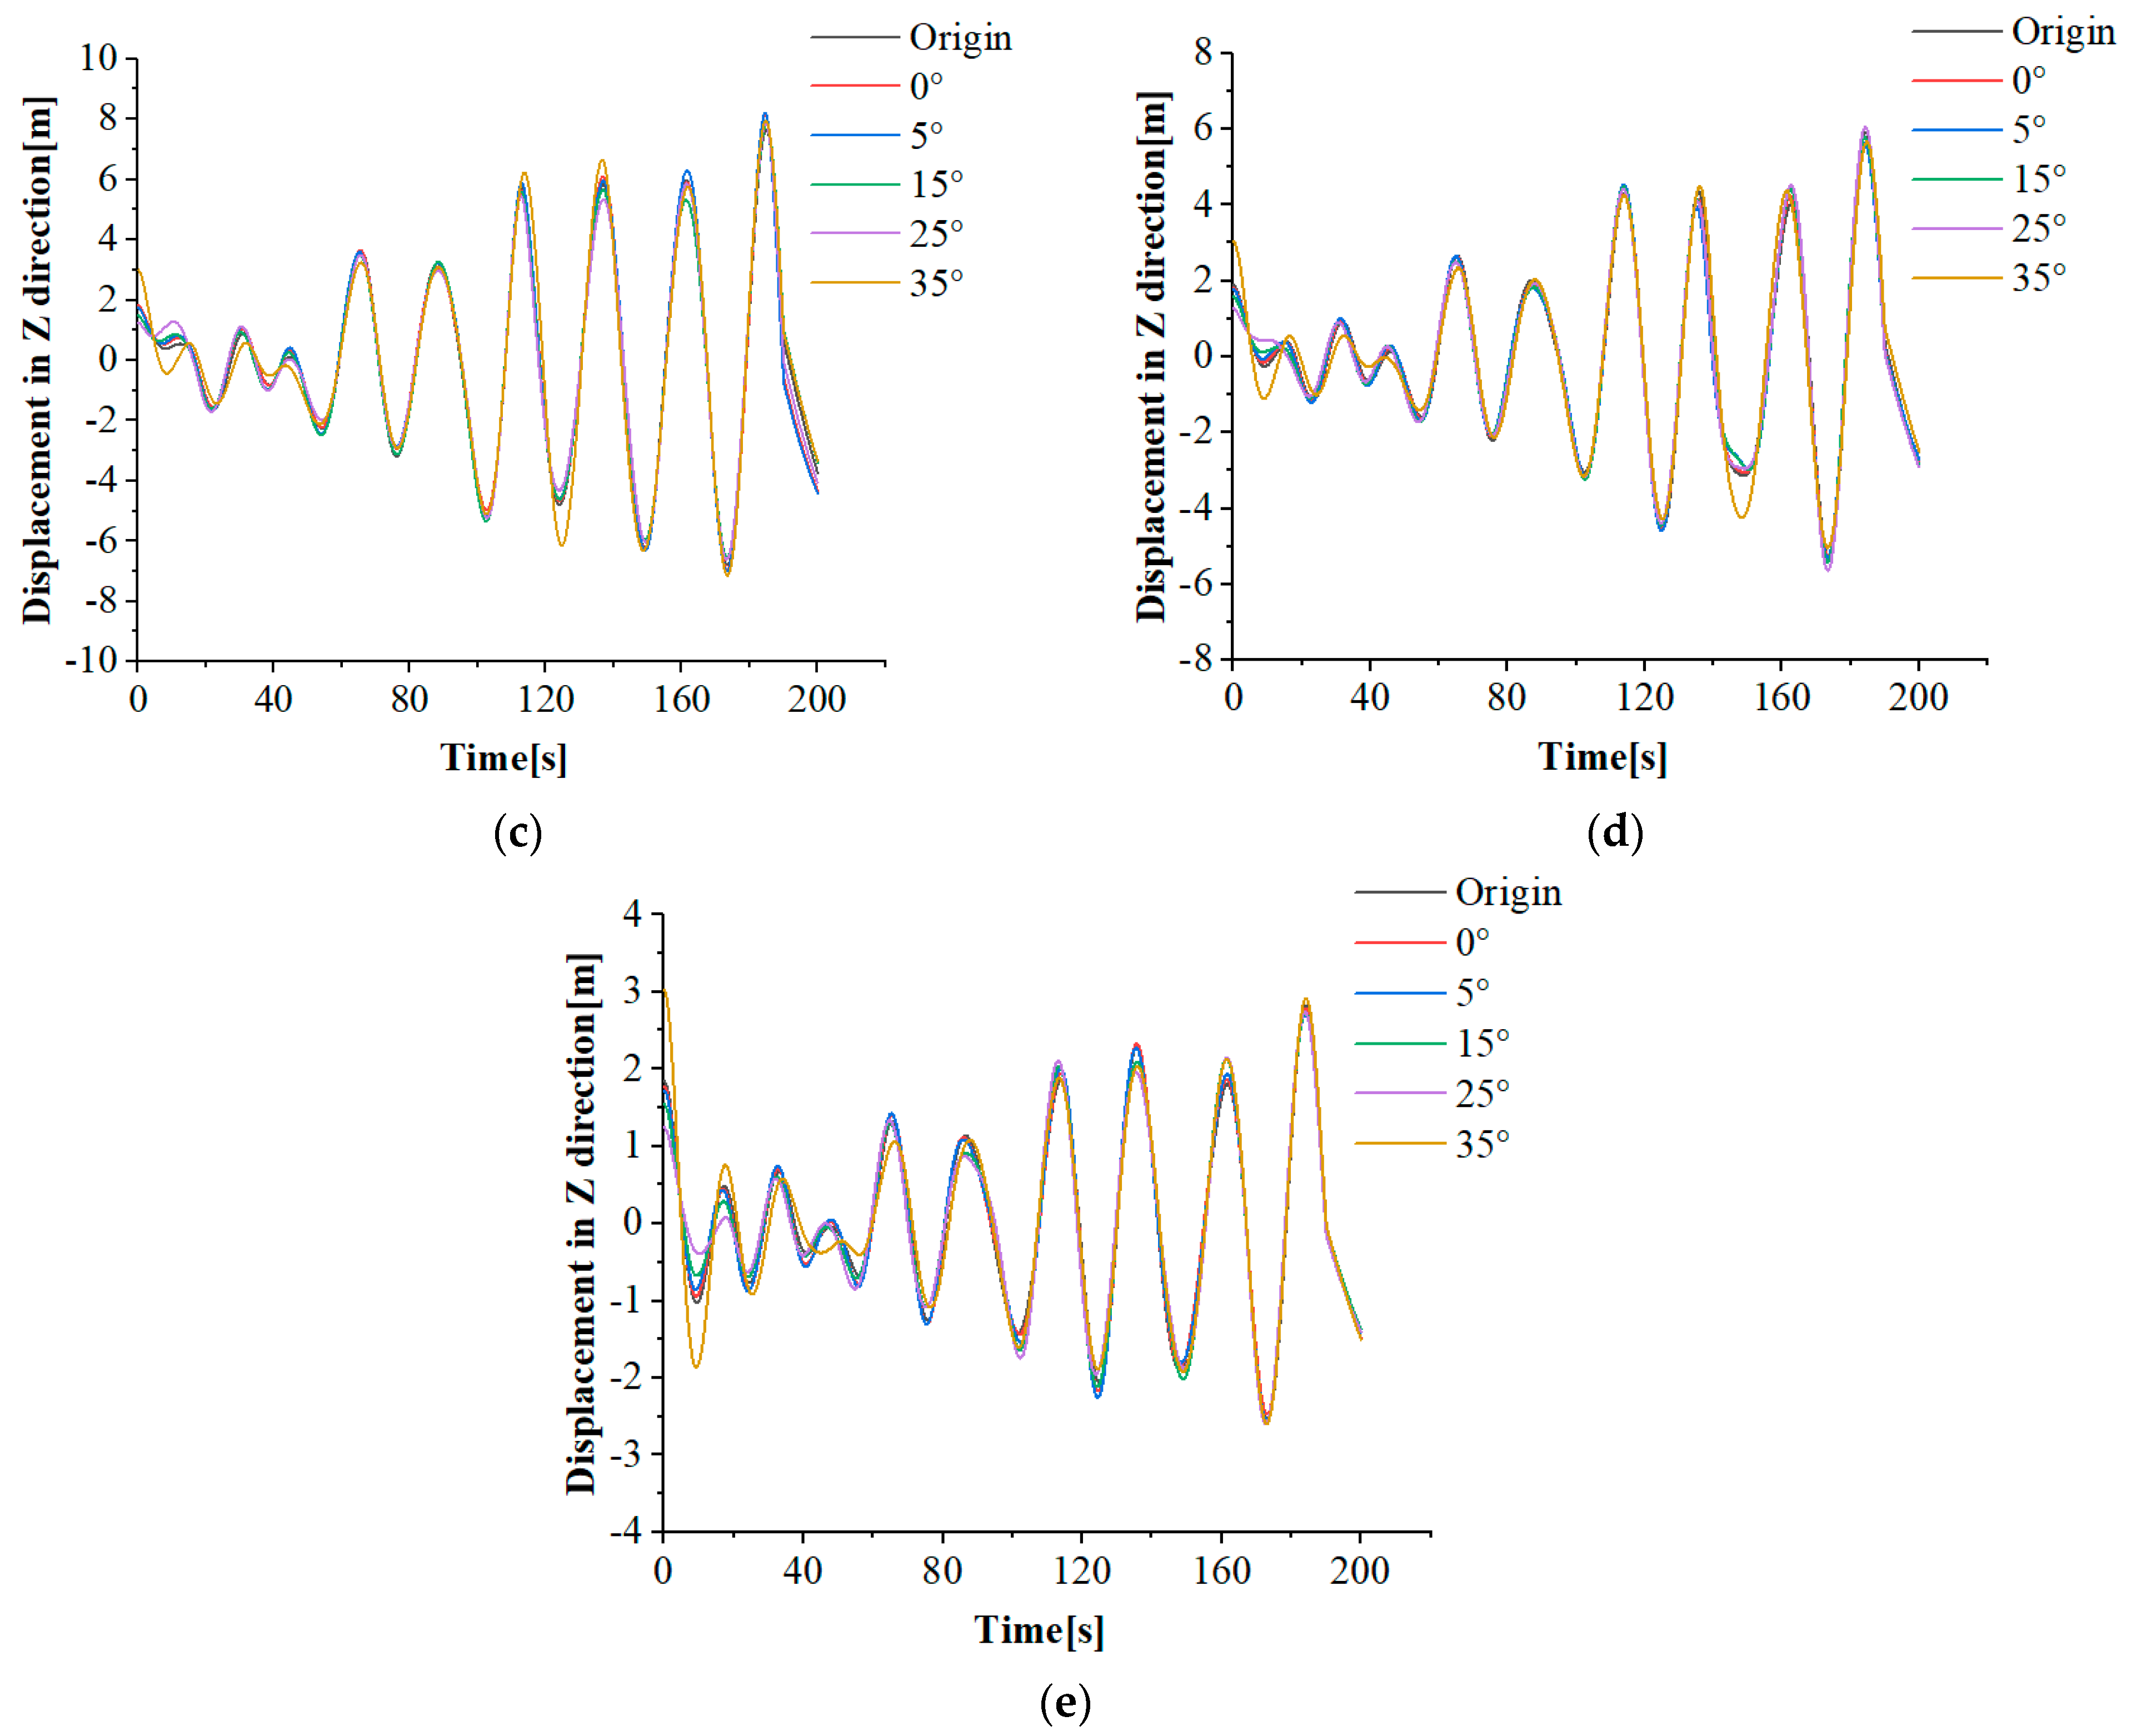
The numerical simulation data for the Z direction motion are as follows: Figure 29 (T = 25.82 s).
The above figure was processed in the same way as above, and the anti-heave motion of each chamfered perforated model in Z direction under different wave heights was obtained as shown in Table 6 below.
As can be seen from the above, the motion trajectory of the model with different chamfers is similar in the Z direction, and its anti-heave effect does not increase linearly with the increase of the chamfer, and different periods and wave heights will have an impact. However, under most working conditions, different degrees of chamfered perforations in the anti-heave device help reduce the heave of the motion process.
The movement in the Z direction is obviously weaker than that in the X direction, and the anti-heave effect of the model with 35° chamfered perforated is the most obvious in most wave heights. Therefore, in the subsequent research, the model with 35° chamfered perforated model was selected as a further research object.

3.4. Hydrodynamic Performance of the Pedestal with Perforated Anti-Heave Device under Different Wave Heights

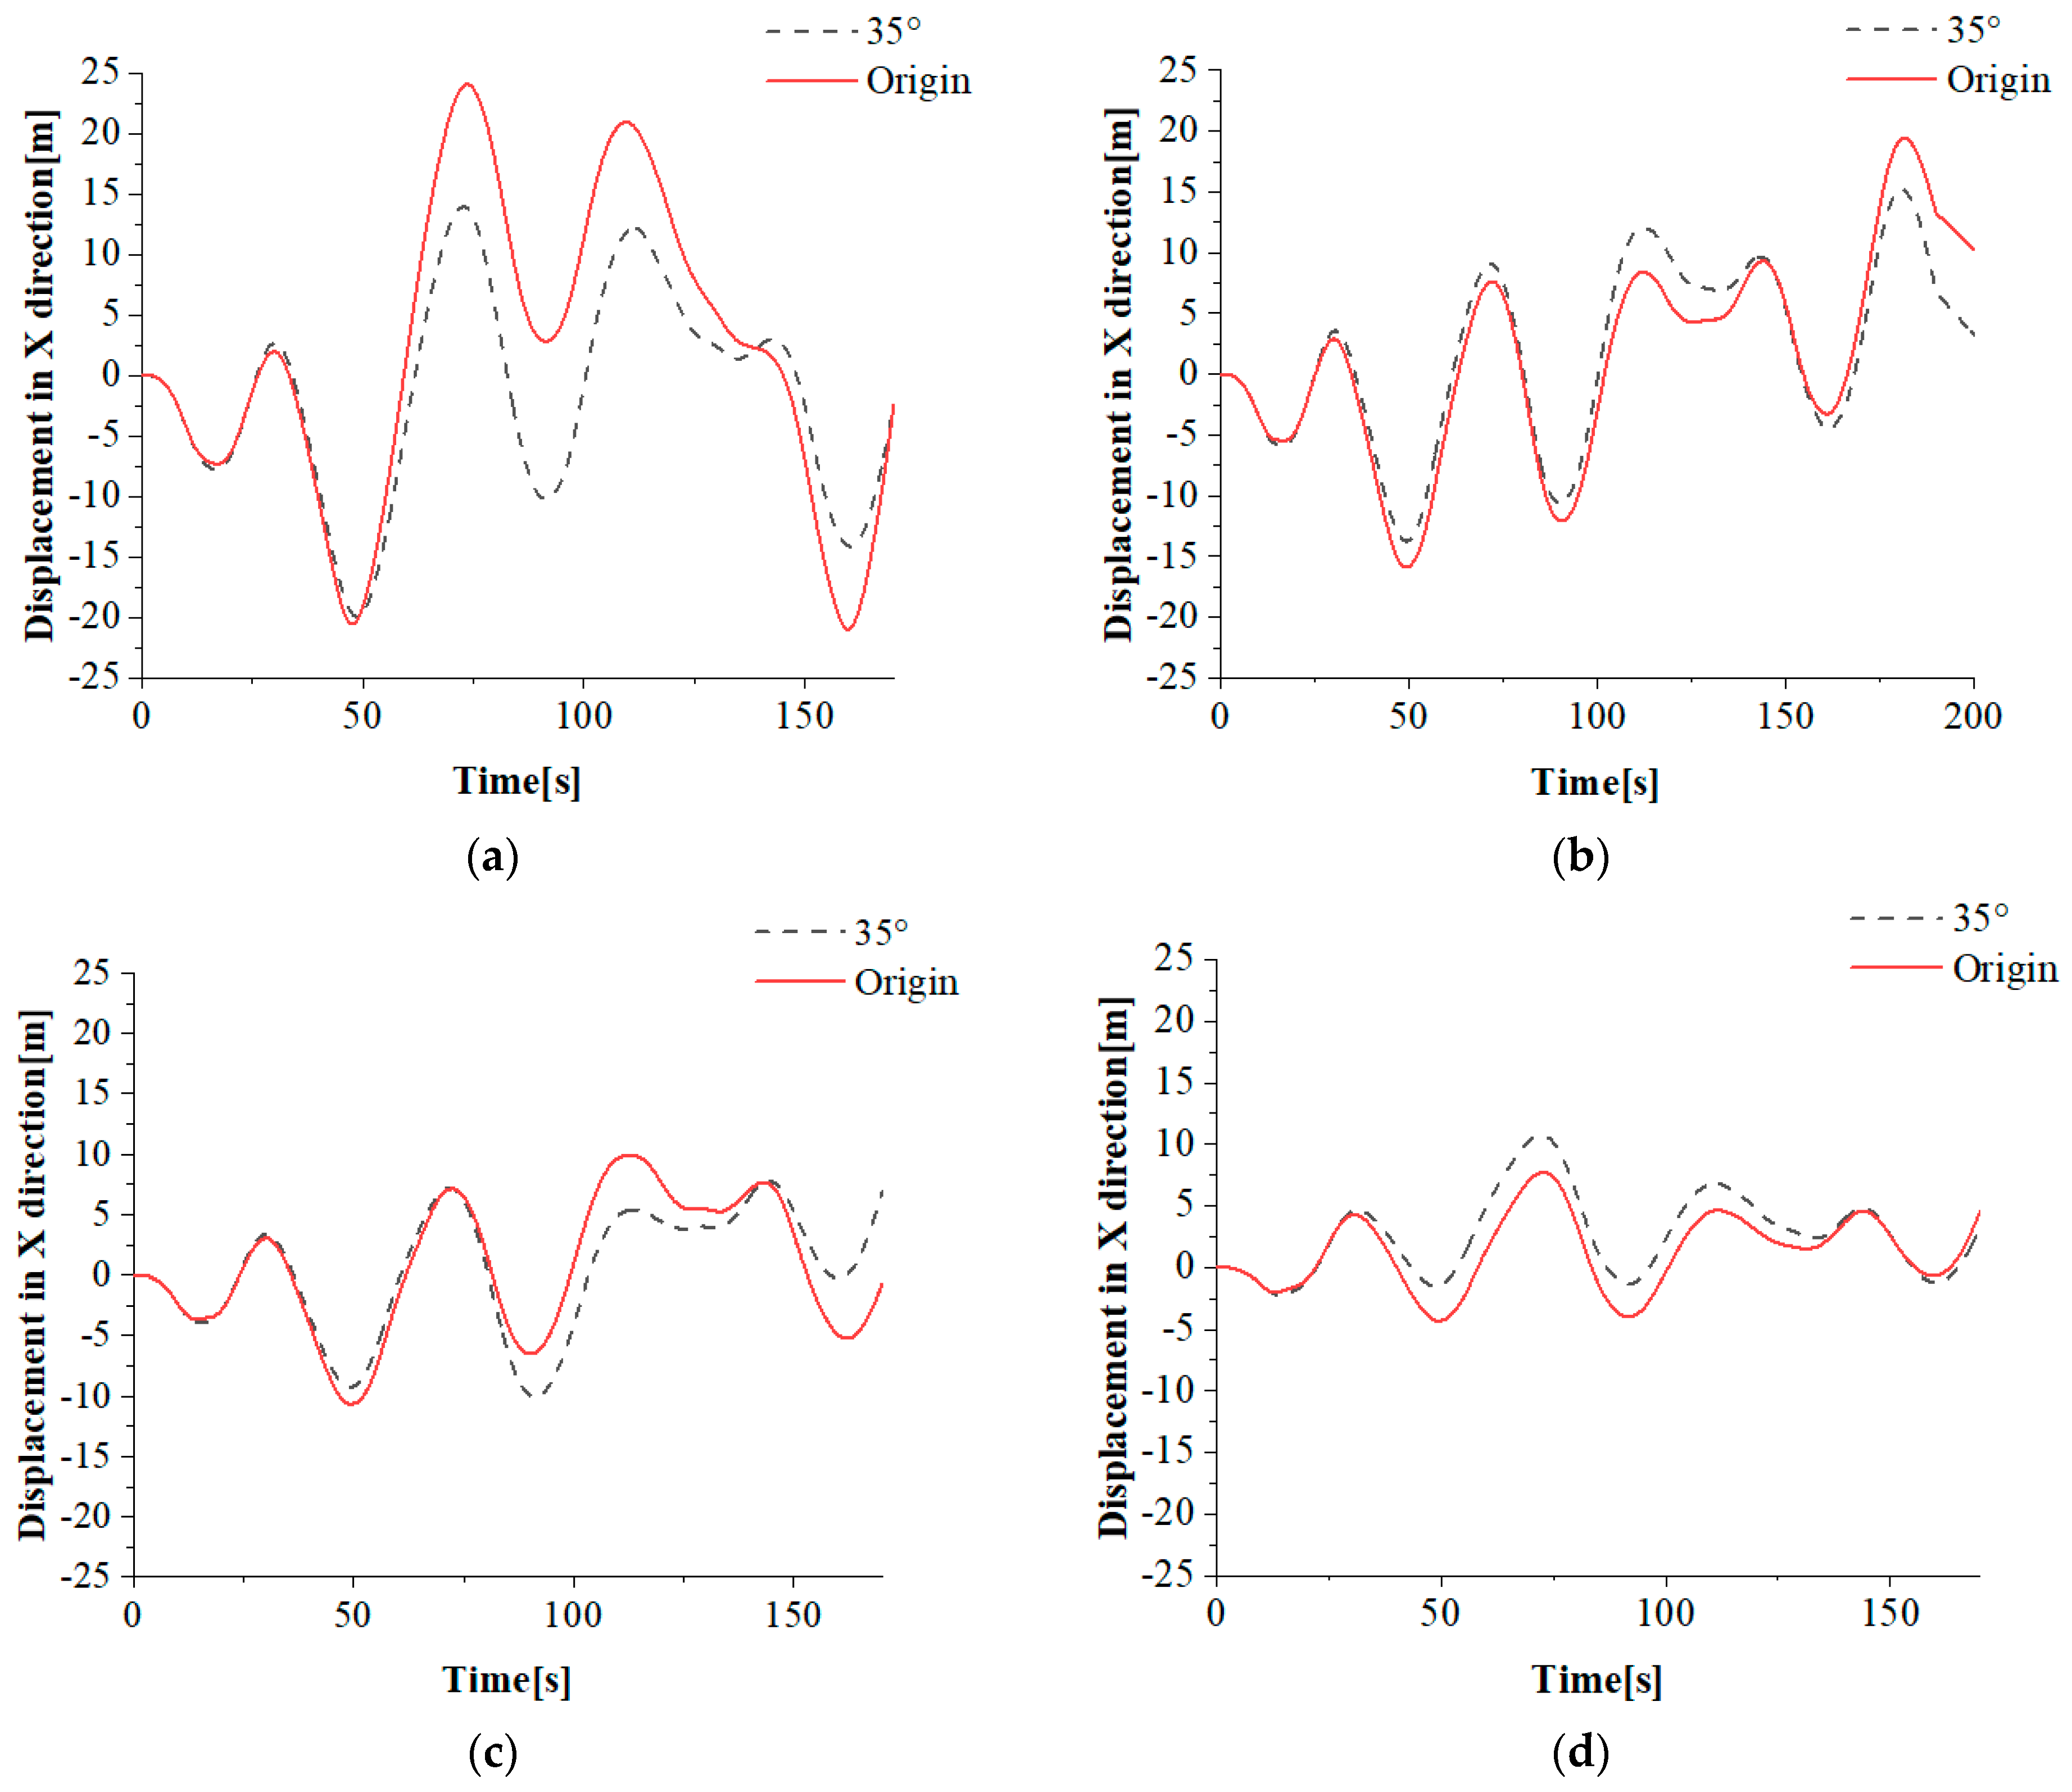
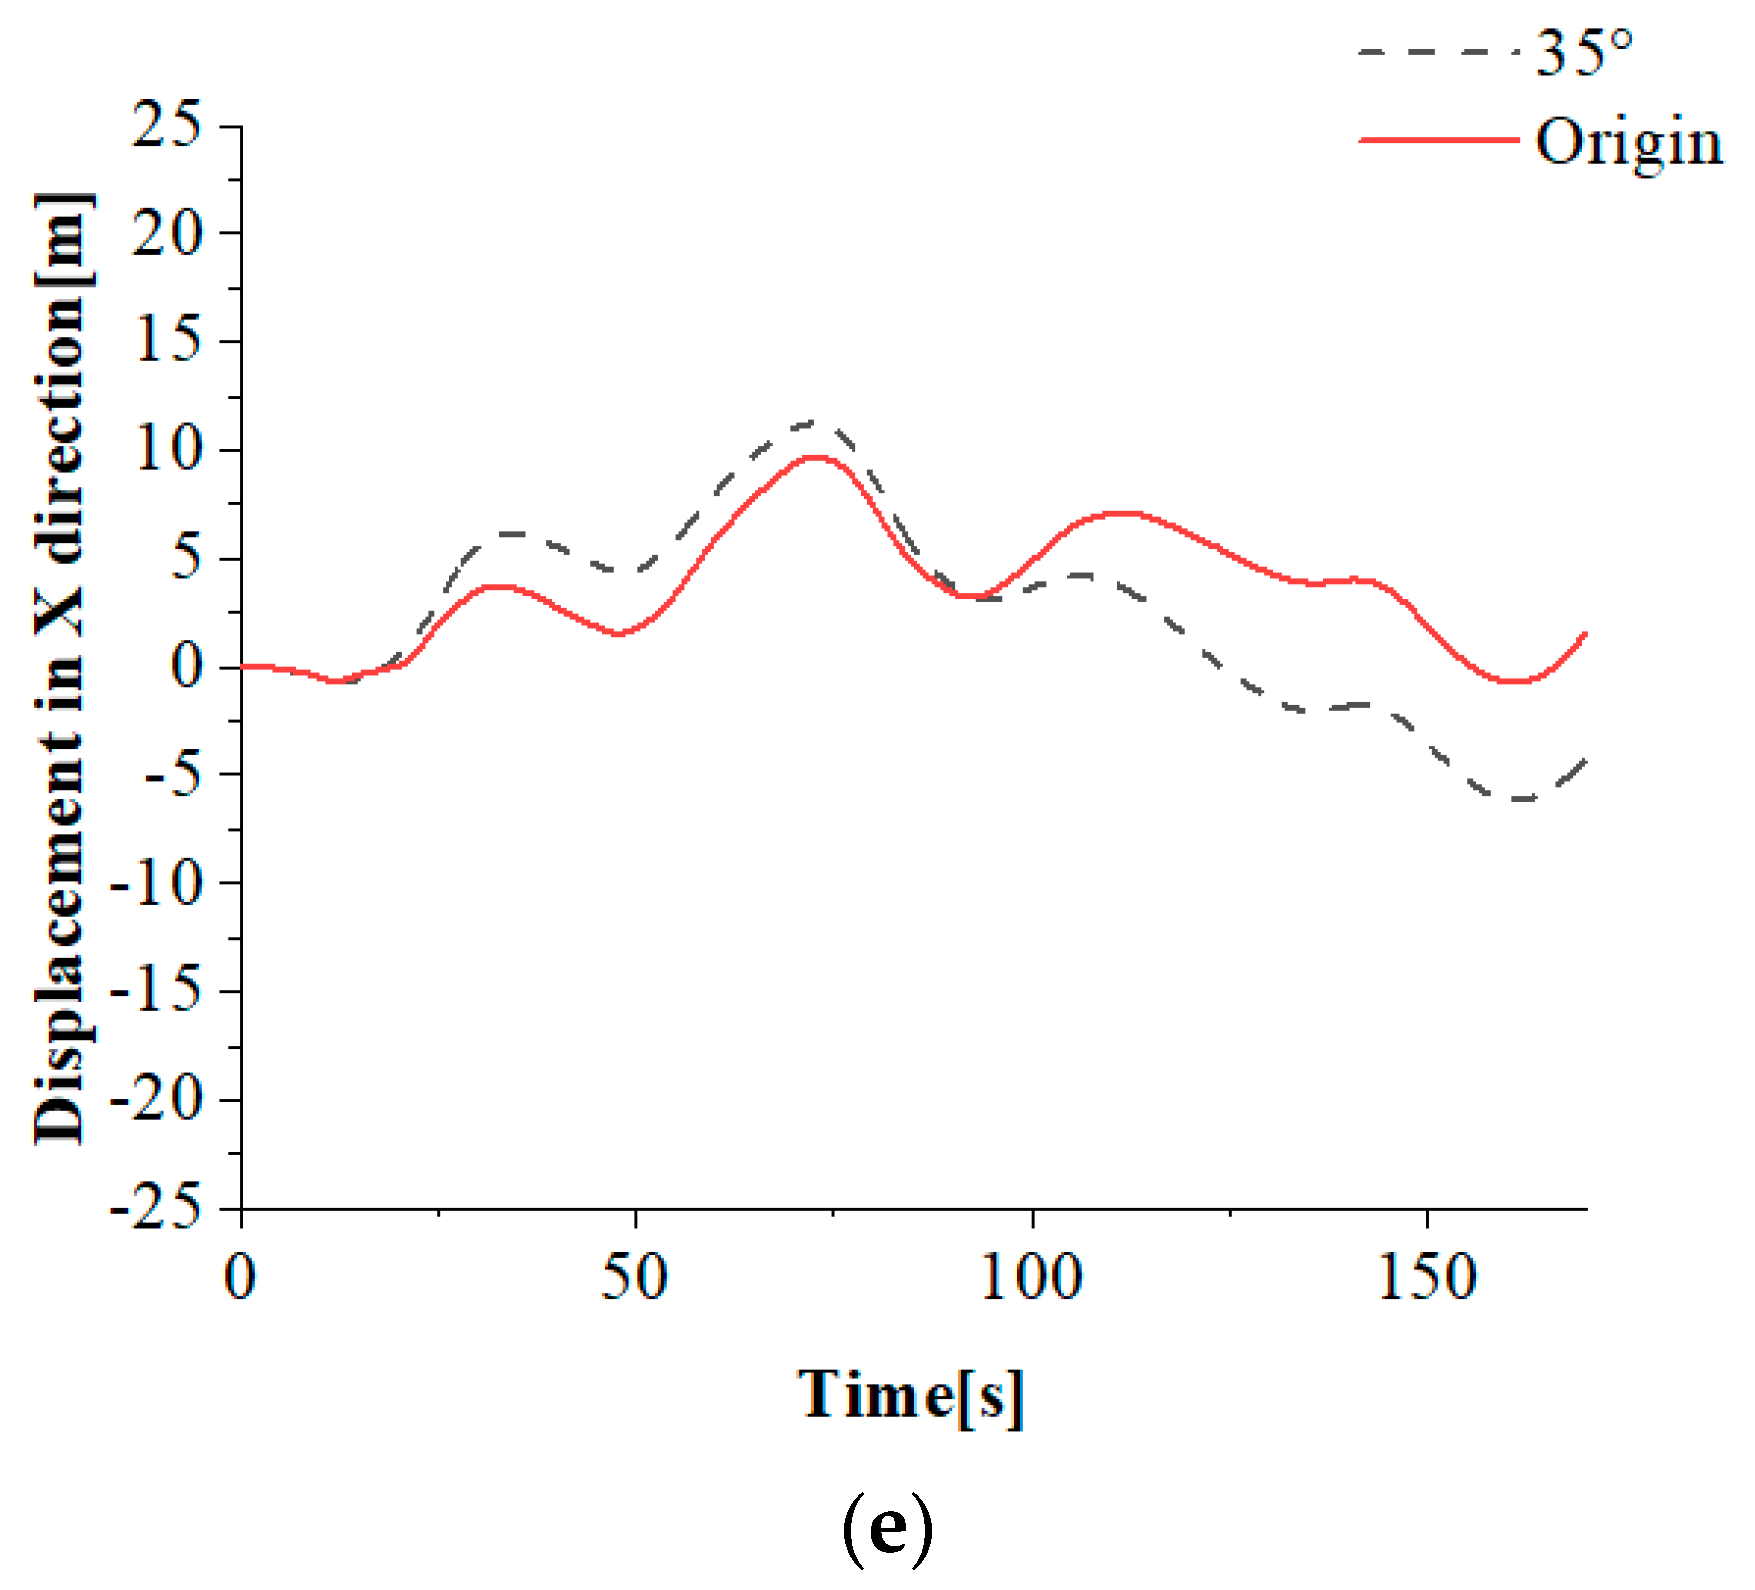
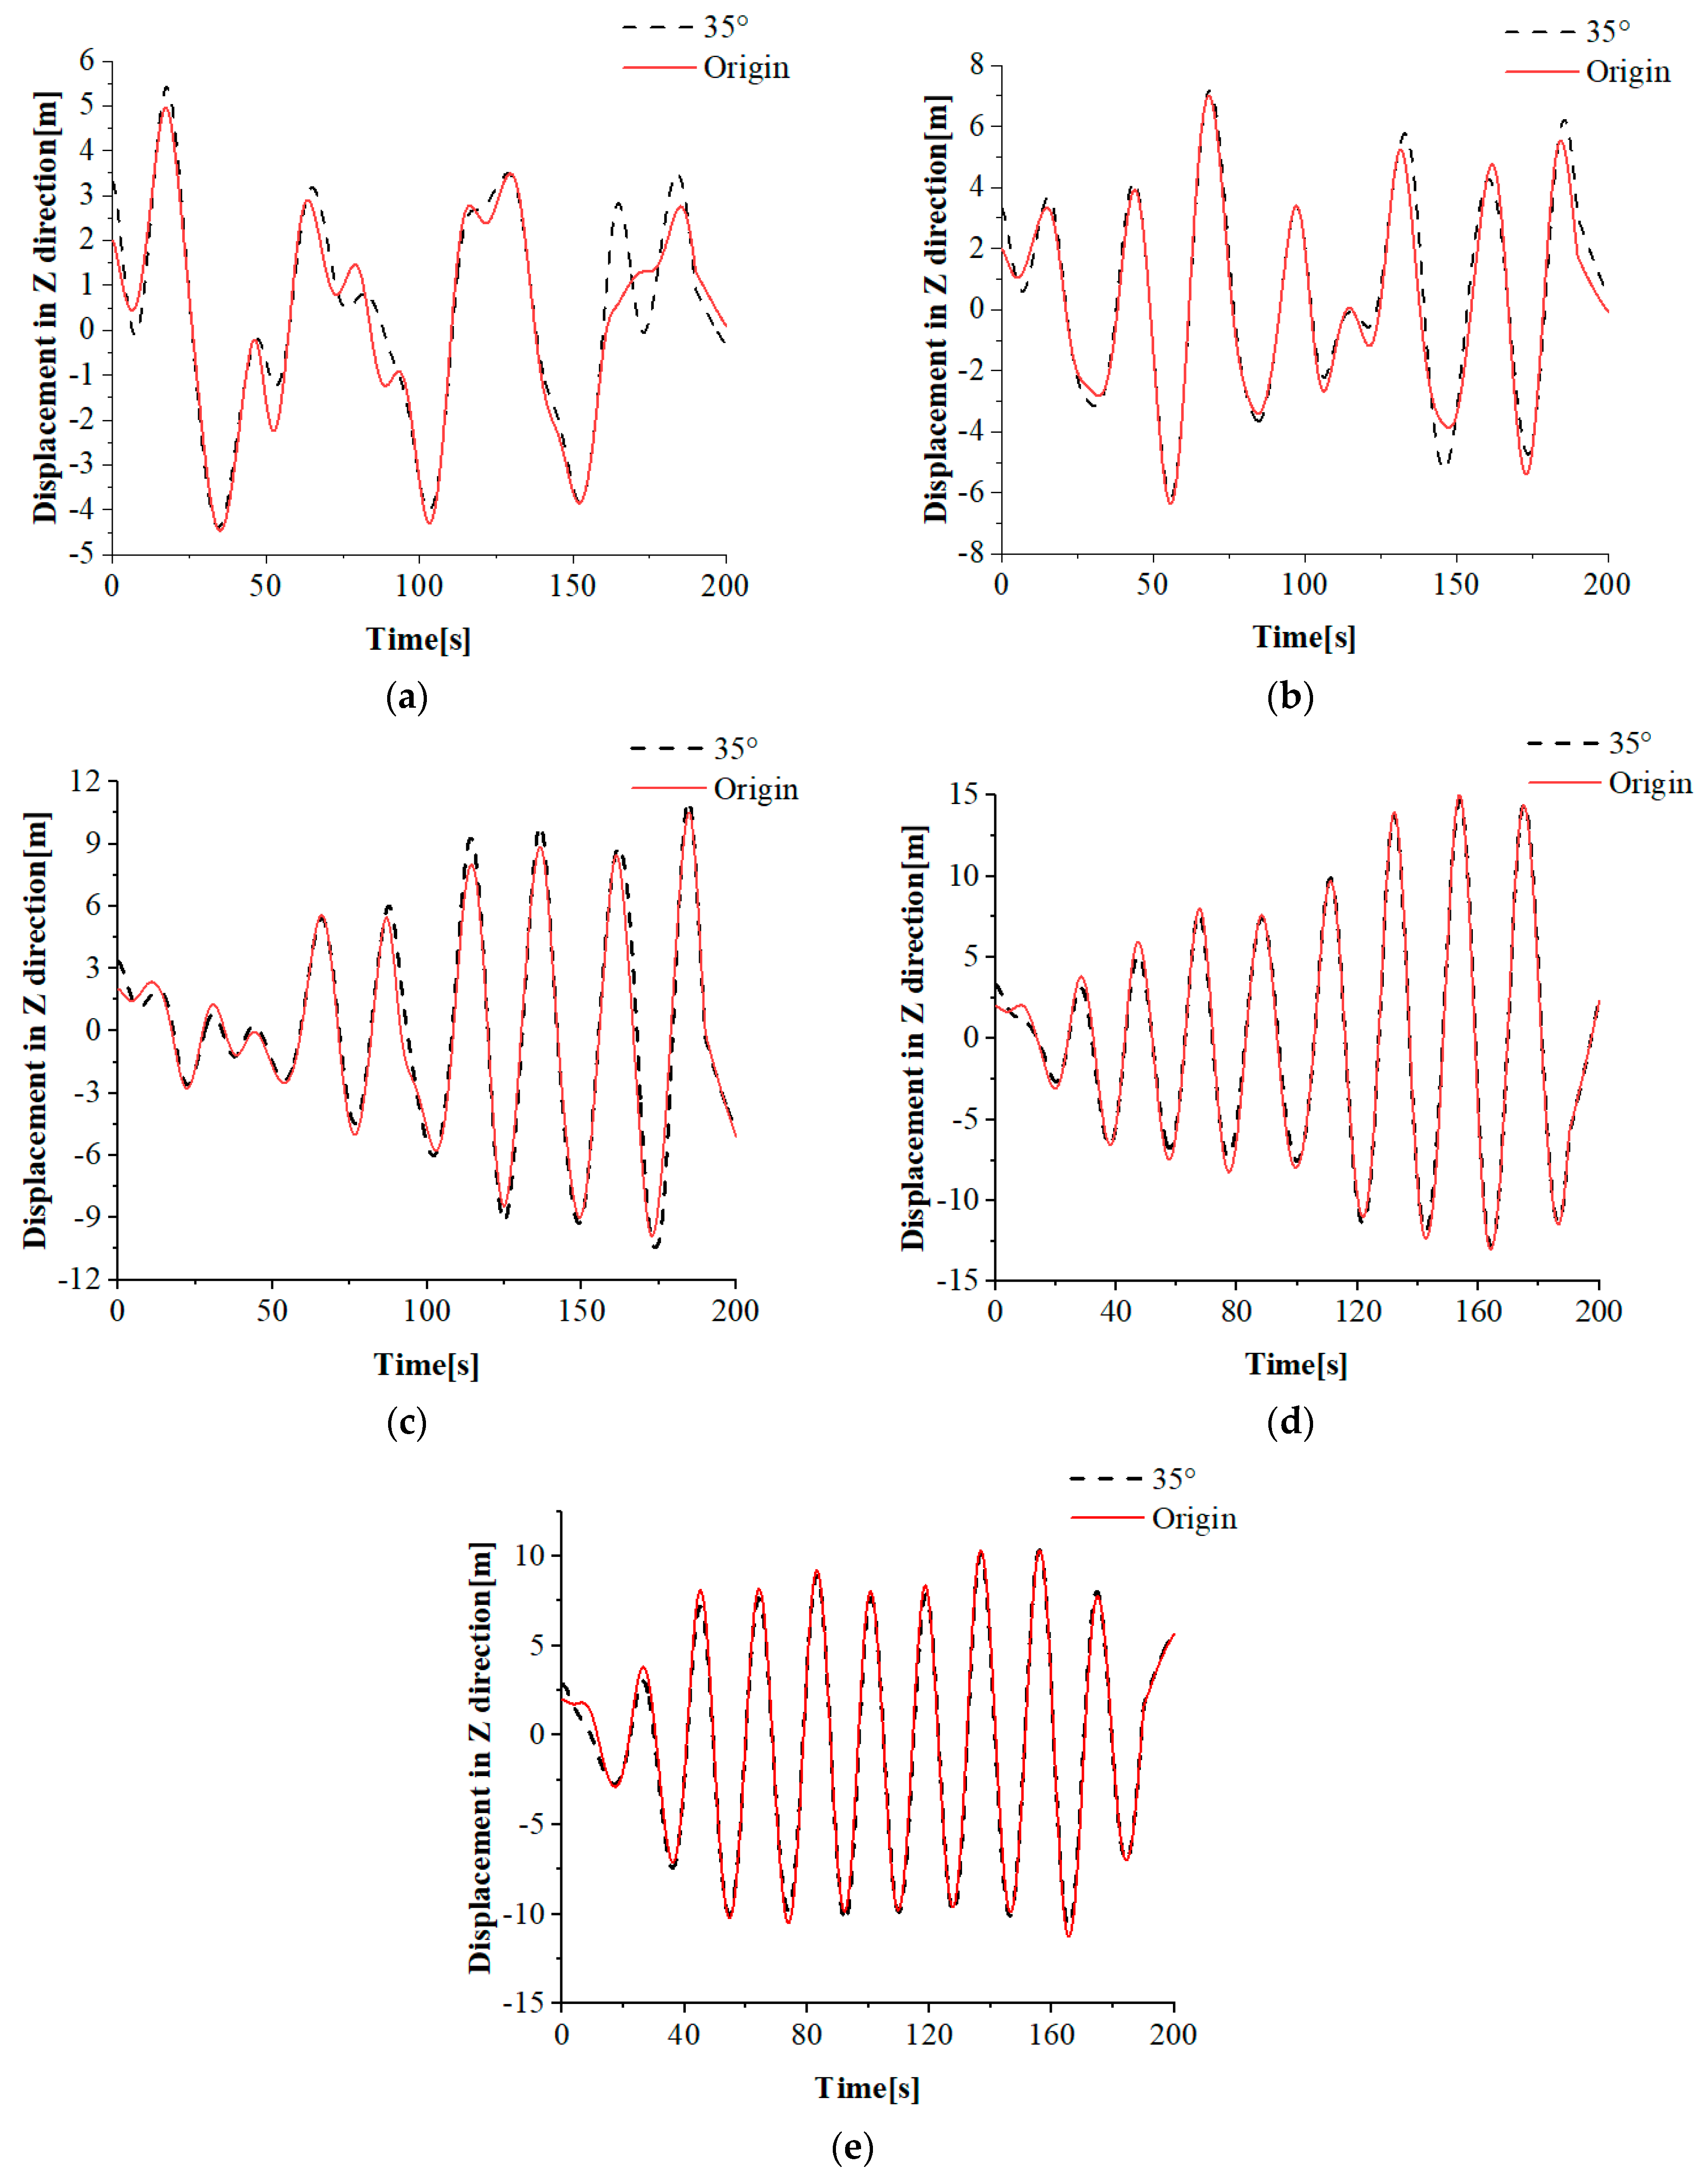
In order to further study the influence of wave heights on the hydrodynamic performance of the pedestal with a perforated anti-heave device, taking the 35° chamfered perforated model with an obvious anti-heave effect as an example, motions in the X and Z directions under different wave heights and the same wave period (T = 38.73 s) were calculated. The working condition of numerical simulation is presented in Table 7.
When the wave period is 38.73 s, the numerical simulation results under different wave heights are presented in Figure 30 and Figure 31.
As can be observed from Figure 30, when the wave height is larger, by comparing several extreme points of the motion of the pedestal, the model with 35° chamfer perforations has a smaller motion range in the X direction than the original model without perforation. It has an obvious anti-heave effect. When the wave height is small, the effect is not obvious, and even the X direction motion range increases, which may be because of the small wave action and irregular disturbance in the perforated position of the model.
As shown in Figure 31, with the increase in numerical simulation time, the motion of the pedestal gradually tends to be stable. After the simulation time was more than 25 s, the model with 35° chamfered perforation was smaller than the original model in the Z direction, except when the wave height was 9 m. It is proved that the anti-heave device has a better anti-heave effect in the Z direction.

3.5. Hydrodynamic Performance of the Pedestal with Perforated Anti-Heave Device under Different Wave Periods

To study the influence of different wave periods on the hydrodynamic performance of the pedestal with a perforated anti-heave device, using the 35° chamfered perforated model as an example, the motion in the X and Z directions under the same wave heights and different wave periods was calculated. The working condition of numerical simulation is presented in Table 8.
The specific numerical simulation data are as follows: Figure 32 and Figure 33.
As can be observed from Figure 32, when the wave period is larger, by comparing several extreme points of its motion, the model with 35° chamfered perforation has a smaller motion range in the X direction than the original model without perforations. It has an obvious anti-heave effect. When the wave period is small, the anti-heave effect is not obvious, and even the motion range in the X direction increases; this may be because the motion frequency of the model is higher when the wave period is small and also because of the excessive irregular disturbance caused by the position of the perforations.
As can be observed from Figure 33, under the same wave height, the motion range in the Z direction of the pedestal does not increase with a decrease in the wave period. When the wave period is 19.36 s, the range of motion is smaller than that of 22.13 s and 25.82 s.

4. Comparative Analysis of Numerical Simulation and Experimental Research

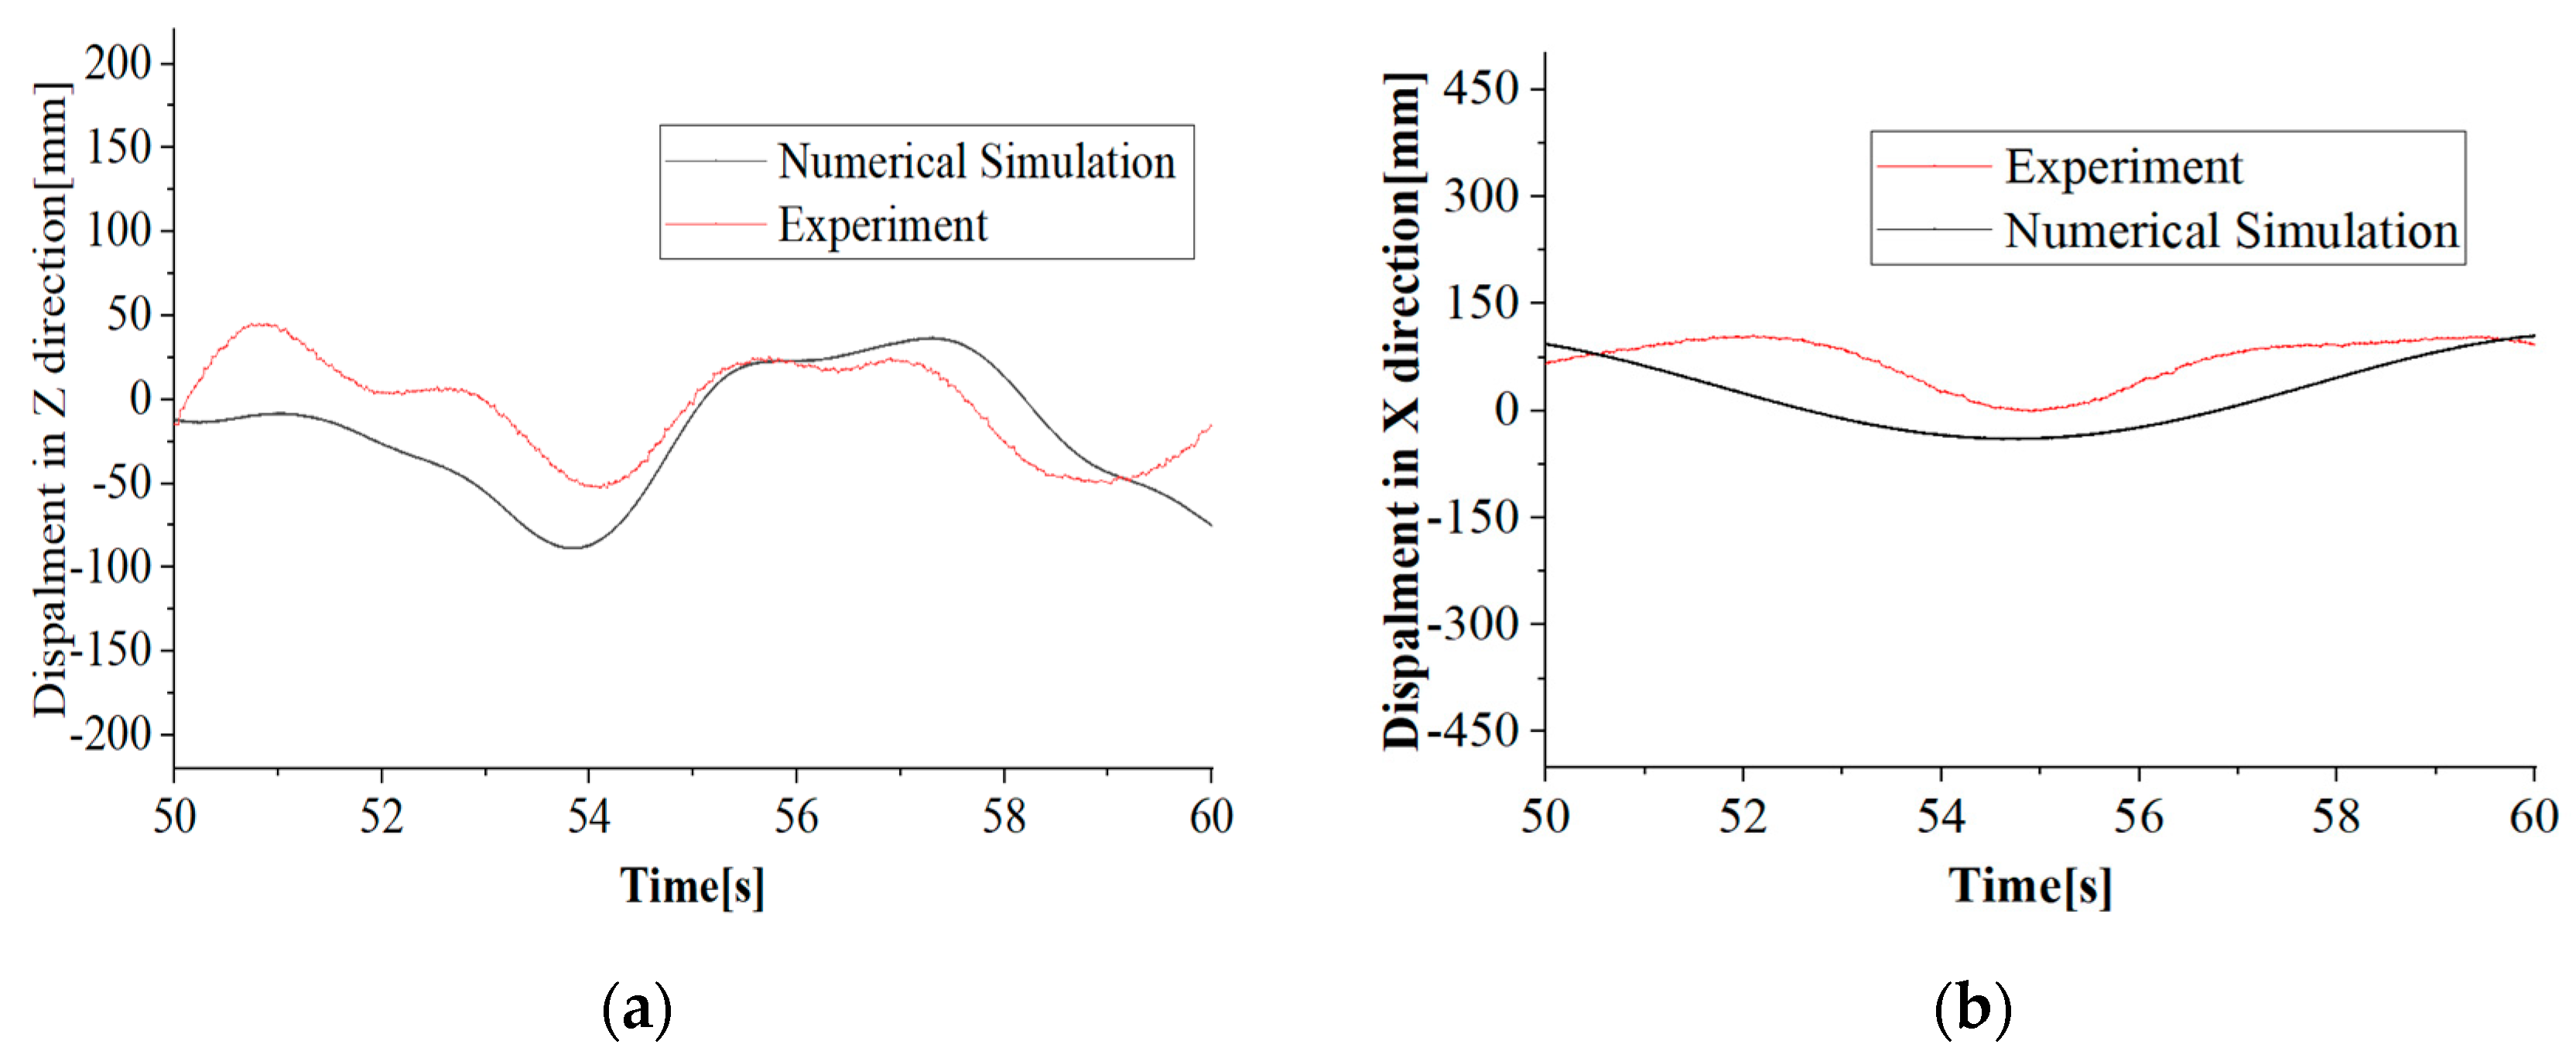
The working conditions of 0.2 Hz and 0.25 Hz under the wave height of 0.09 m were selected to compare and analyse the numerical simulation and experimental results for a certain period. The time history curves under different conditions are shown in the following figures.
From Figure 34 and Figure 35, it can be observed that the numerical simulation and experimental results of the pedestal can maintain the same trend in heave and surge in the same period, and the motion amplitude of the numerical simulation is larger than that of the experimental results. This may be caused by the constraint of the pedestal in the numerical simulation, the difference in the material of the catenary, and the error of the experimental equipment to the motion capture.
The numerical simulation data were converted by a certain scale ratio and compared with the test data, as shown in Table 9.
As shown in the table, the standard deviation of surge and heave of numerical simulation and test basically keep the same change rule—when at the same frequency, the higher the wave height, the greater the standard deviation; but when at the same frequency, the standard deviation of heave basically increases with the increase of wave height, while there is no obvious rule for standard deviation of surge.

5. Conclusions

In this study, the motion response of the DeepCwind floating wind turbine platform was investigated numerically and experimentally. The corresponding model tests of the anti-heave device with perforations and perforated chamfers were carried out, and the motion responses of the platform under different wave periods and wave heights were analyzed. After that, the corresponding numerical models were simulated and compared with the experimental results to verify the reliability of the numerical simulation.
(1)
The anti-heave effect of the three-floating-body wind turbine platform is influenced by different chamfered perforations. Under most working conditions, the anti-heave effect of the 35° chamfered perforated model is the most obvious.
(2)
When the wave height is tall, the anti-heave device has an obvious anti-heave effect in the X and Z directions; when the wave height is short, the effect is not obvious.
(3)
The longer the wave period is, the more obvious the X direction anti-heave effect is. However, the shorter the wave period is, the more obvious the Z direction anti-heave effect is.
(4)
The amplitude of surge under different wave heights changes slightly at the same wave frequency, but the standard deviation for surge increases with increasing wave height.
On the premise of not increasing the mass of the redundant platform, the perforated anti-heave device reduces the oscillation effect of the platform in the X and Z directions under most working conditions, which can reduce the construction cost, improve the power generation quality of the platform, and reduce the maintenance cost of the platform in the actual platform construction process.

Author Contributions

W.W.: Conceptualisation, Methodology, Resources, Investigation, preparation, Writing—review and editing; S.F.: Conceptualization, Supervision; Y.Y.: Conceptualization, Supervision; C.Z.: Writing—review and editing, Supervision, Project administration, L.X.: Validation, Software, Experiment; G.W.: Experiment, Writing—original draft. All authors have read and agreed to the published version of the manuscript.

Funding

This study was financially supported by National Natural Science Foundation of China (51679217).

Data Availability Statement

The data presented in this study are available on request from the corresponding author.

Conflicts of Interest

The authors declare no conflict of interest.

References

  1. Jonkman, J.M. Dynamics Modeling and Loads Analysis of an Offshore Floating Wind Turbine. Ph.D. Thesis, University of Colorado at Boulder, Boulder, CO, USA, 2007. [Google Scholar]
  2. Srinivasan, N.; Chakrabarti, S.; Radha, R. Damping-Controlled Response of a Truss-Pontoon Semi-Submersible with Heave-Plates. In Proceedings of the ASME 2005 24th International Conference on Offshore Mechanics and Arctic Engineering, Halkidiki, Greece, 12–17 June 2005; pp. 1007–1020, OMAE2005-67522. [Google Scholar]
  3. Lefebvre, S.; Collu, M. Preliminary design of a floating support structure for a 5 MW offshore wind turbine. Ocean Eng. 2012, 40, 15–26. [Google Scholar] [CrossRef]
  4. Borg, M.; Collua, M. A comparison on the dynamics of a floating vertical axis wind turbine on three different floating support structures. Energy Procedia 2014, 53, 268–279. [Google Scholar] [CrossRef] [Green Version]
  5. Duarte, T.; Gueydon, S.; Jonkman, J.M.; Sarmento, A. Computation of Wave Loads under Multidirectional Sea States for Floating Offshore Wind Turbines. In Proceedings of the International Conference on Offshore Mechanics and Arctic Engineering—OMAE9B, San Francisco, CA, USA, 8–13 June 2014. [Google Scholar]
  6. Abou-Rayan, A.M.; Khalil, N.N.; Afify, M.S. Dynamic behavior of TLP’s supporting 5-MW wind turbines under multi-directional waves. Ocean Syst. Eng. Int. J. 2016, 6, 203–216. [Google Scholar] [CrossRef]
  7. Barrera, C.; Losada, I.J.; Guanche, R.; Johanning, L. The influence of wave parameter definition over floating wind platform mooring systems under severe seastates. Ocean Eng. 2019, 172, 105–126. [Google Scholar] [CrossRef]
  8. Alkarem, Y.R.; Ozbahceci, B.O. A Complemental Analysis of Wave Irregularity Effect on the Hydrodynamic Responses of Offshore Wind Turbines with the Semi-Submersible Platform. Appl. Ocean Res. 2021, 113, 102757. [Google Scholar] [CrossRef]
  9. Downie, M.J.; Graham, J.M.R.; Hall, C.; Incecik, A.; Nygaard, I. An experimental investigation of motion control devices for truss spars. Mar. Struct. 2000, 13, 75–90. [Google Scholar] [CrossRef]
  10. Chua, K.H.; Clell, D.; Huang, S. Model Experiments of Hydrodynamic Forces on Heave Plates. In Proceedings of the 24th International Conference on Offshore Mechanics and Arctic Engineering, Halkidiki, Greece, 12–17 June 2005. [Google Scholar]
  11. Tao, L.; Dray, D. Hydrodynamic performance of solid and porous heave plates. Ocean Eng. 2008, 35, 1006–1014. [Google Scholar] [CrossRef]
  12. Li, J.; Liu, S.; Zhao, M.; Teng, B. Experimental investigation of the hydrodynamic characteristics of heave plates using forced oscillation. Ocean Eng. 2013, 66, 82–91. [Google Scholar] [CrossRef]
  13. Mentzoni, F.; Kristiansen, T. Numerical modeling of perforated plates in oscillating flow. Appl. Ocean Res. 2019, 84, 1–11. [Google Scholar] [CrossRef]
  14. Wang, B.; Xu, Z.; Li, C.; Wang, D.; Ding, Q. Hydrodynamic characteristics of forced oscillation of heave plate with fractal characteristics based on floating wind turbine platform. Ocean Eng. 2020, 212, 107621. [Google Scholar] [CrossRef]
  15. Thiagarajan, K.P.; Datta, I.; Ran, A.Z.; Tao, L.; Halkyard, J.E. Influence of Heave Plate Geometry on the Heave Response of Classic Spars. In Proceedings of the 21st International Conference on Offshore Mechanics and Arctic Engineering, Oslo, Norway, 23–28 June 2002; Volume 1, pp. 621–627. [Google Scholar]
  16. Wang, W.; Zhao, C.; Jia, P.; Lu, Z.; Xie, Y. Numerical simulation and experimental study on perforated heave plate of a DeepCwind floating wind turbine platform. Ships Offshore Struct. 2022. [Google Scholar] [CrossRef]
  17. Sheng, Z.B.; Liu, Y.Z. Theoretical Naval Architecture; Shanghai Jiaotong University Press: Shanghai, China, 2004. [Google Scholar]
  18. Zhao, J.; Guo, H. CFD numerical simulation of vortex induced vibration of two degree of freedom cylinders with different cross sections. Ship Mech. 2016, 20, 530–539. [Google Scholar]
  19. Robertson, A.; Jonkman, J.; Masciola, M.; Song, H. Definition of the Semisubmersible Floating System for Phase II of OC4; National Renewable Energy Laboratory: Golden, CO, USA, 2014. [Google Scholar]
  20. Duoandikoetxea, J. Fourier Analysis; Higher Education Press: Beijing, China, 2017. [Google Scholar]
  21. Kafeel, A.; Aziz, S.; Awais, M. An Expert System for Rotating Machine Fault Detection Using Vibration Signal Analysis. Sensors 2021, 21, 7587. [Google Scholar] [CrossRef] [PubMed]
  22. Kebabsa, T.; Ouelaa, N.; Djebala, A. Experimental vibratory analysis of a fan motor in industrial environment. Int. J. Adv. Manuf. Technol. 2018, 98, 2439–2447. [Google Scholar] [CrossRef]
Figure 1. Single pontoon model.
Energies 16 01034 g001
Figure 2. Cross-section of the heave plate.
Energies 16 01034 g002
Figure 3. Simplified model.
Energies 16 01034 g003
Figure 4. Simplified main pontoon and connection frame.
Energies 16 01034 g004
Figure 5. Model of the pedestal.
Energies 16 01034 g005
Figure 6. Coordinate system of the three-floating-body wind turbine platform.
Energies 16 01034 g006
Figure 7. Wave altimeter.
Energies 16 01034 g007
Figure 8. Wire rope and mooring block.
Energies 16 01034 g008
Figure 9. Installation of PTI 3D motion capture system on Trailer.
Energies 16 01034 g009
Figure 10. Installation diagram and capture system.
Energies 16 01034 g010
Figure 11. Common mooring method of the semi-wind turbine platform.
Energies 16 01034 g011
Figure 12. Experimental data acquisition system.
Energies 16 01034 g012
Figure 13. Surge response of the pedestal with different wave heights at 0.20 Hz. (a) Surge; (b) surge frequency domain curve.
Energies 16 01034 g013
Figure 14. Surge response of the pedestal with different wave heights at 0.25 Hz. (a) Surge; (b) surge frequency domain curve.
Energies 16 01034 g014
Figure 15. Surge response of the pedestal with different wave heights at 0.30 Hz. (a) Surge; (b) surge frequency domain curve.
Energies 16 01034 g015
Figure 16. Surge response of the pedestal with different wave heights at 0.35 Hz. (a) Surge; (b) surge frequency domain curve.
Energies 16 01034 g016
Figure 17. Surge response of the pedestal with different wave heights at 0.40 Hz. (a) Surge; (b) surge frequency domain curve.
Energies 16 01034 g017
Figure 18. Standard deviation of surge response at different frequencies.
Energies 16 01034 g018
Figure 19. Heave response of the pedestal with different wave heights at 0.20 Hz. (a) Heave; (b) heave frequency domain curve.
Energies 16 01034 g019
Figure 20. Heave response of the pedestal with different wave heights at 0.25 Hz. (a) Heave; (b) heave frequency domain curve.
Energies 16 01034 g020
Figure 21. Heave response of the pedestal with different wave heights at 0.30 Hz. (a) Heave; (b) heave frequency domain curve.
Energies 16 01034 g021
Figure 22. Heave response of the pedestal with different wave heights at 0.35 Hz. (a) Heave; (b) heave frequency domain curve.
Energies 16 01034 g022
Figure 23. Heave response of the pedestal with different wave heights at 0.40 Hz. (a) Heave; (b) heave frequency domain curve.
Energies 16 01034 g023
Figure 24. Standard deviation of heave response at different frequencies.
Energies 16 01034 g024
Figure 25. Schematic of boundary conditions.
Energies 16 01034 g025
Figure 26. Mooring arrangement diagram.
Energies 16 01034 g026
Figure 27. Schematic of numerical simulation mesh.
Energies 16 01034 g027
Figure 28. X direction displacement of the pedestal under different chamfers. (a) H = 9 m; (b) H = 7.2 m; (c) H = 5.4 m; (d) H = 3.6 m; (e) H = 1.8 m.
Energies 16 01034 g028
Figure 29. Z direction displacement of the pedestal under different chamfers. (a) H = 9 m; (b) H = 7.2 m; (c) H = 5.4 m; (d) H = 3.6 m; (e) H = 1.8 m.
Energies 16 01034 g029aEnergies 16 01034 g029b
Figure 30. X direction displacement of the pedestal under different wave heights. (a) H = 9 m; (b) H = 7.2 m; (c) H = 5.4 m; (d) H = 3.6 m; (e) H = 1.8 m.
Energies 16 01034 g030aEnergies 16 01034 g030b
Figure 31. Z direction displacement of the pedestal under different wave heights. (a) H = 9 m; (b) H = 7.2 m; (c) H = 5.4 m; (d) H = 3.6 m; (e) H = 1.8 m.
Energies 16 01034 g031aEnergies 16 01034 g031b
Figure 32. X direction displacement of the pedestal under different wave periods. (a) T = 38.73 s; (b) T = 30.98 s; (c) T = 25.82 s; (d) T = 22.13 s; (e) T = 19.36 s.
Energies 16 01034 g032
Figure 33. Z direction displacement of the pedestal under different wave periods. (a) T = 38.73 s; (b) T = 30.98 s; (c) T = 25.82 s; (d) T = 22.13 s; (e) T = 19.36 s.
Energies 16 01034 g033
Figure 34. Comparison between numerical simulation and experiment at LC1. (a) Heave; (b) surge.
Energies 16 01034 g034
Figure 35. Comparison between numerical simulation and experiment at LC4. (a) Heave; (b) surge.
Energies 16 01034 g035
Table 1. Pontoon and connecting parts data.
Characteristic ParameterValue
Height of pontoon [m]32
Height of anti-heave device [m]6
Diameter of pontoon [m]12
Diameter of anti-heave device [m]24
Number of perforations10
Perforation chamfer [°]35
Height of central column [m]24
Diameter of central column [m]3.6
Diameter of inclined column [m]1.92
Thickness of inclined column [m]0.168
Total mass [kg]1.35 × 10⁷
Radius of the inertia [m]89.20
Table 2. Working condition of wave maker.
Condition NumberFrequencies [Hz]Wave Periods [s]Wave Heights [m]
10.205.000.09
20.205.000.12
30.205.000.15
40.254.000.09
50.254.000.12
60.254.000.15
70.303.330.09
80.303.330.12
90.303.330.15
100.352.860.09
110.352.860.12
120.352.860.15
130.402.500.09
140.402.500.12
150.402.500.15
Table 3. Working conditions of waves.
Wave Periods [s]Wave Heights [m]
19.369.0
22.137.2
25.825.4
30.983.6
38.731.8
Table 4. The working condition of numerical simulation.
Wave Periods [s]Wave Heights [m]Chamfer Angle [°]
19.369.00
22.137.25
25.825.415
30.983.625
38.731.835
Table 5. Mean absolute deviation between the motion in the X direction in each case [m].
Chamfer Angle [°]Wave Heights [m]
1.83.65.47.29
00.9980.7241.4812.2392.775
51.8090.8381.8812.1802.653
153.0570.7541.4971.9302.586
250.9111.6721.8101.5663.355
350.5432.7163.8261.8975.355
Table 6. Mean absolute deviation between the motion in Z direction in each case [m].
Chamfer Angle [°]Wave Heights [m]
1.83.65.47.29
00.0590.1020.1760.4330.417
50.0920.1790.2200.3990.460
150.1330.2000.1950.4020.402
250.1930.2220.2440.4110.586
350.1790.3140.3770.4530.569
Table 7. The condition of numerical simulation.
Condition NumberWave Heights [m]Wave Periods [s]
19.038.73
27.238.73
35.438.73
43.638.73
51.838.73
Table 8. The working condition of numerical simulation.
Condition Number [s]Wave PeriodsWave Heights [m]
119.369
222.139
325.829
430.989
538.739
Table 9. Summary of simulation and experiment results [mm].
Condition NumberFrequencies [Hz]Wave Heights [m]Standard Deviation of HeaveStandard Deviation of Surge
ExperimentSimulationExperimentSimulation
10.200.0924.7428.9639.3068.23
20.200.1231.3835.6855.4483.52
30.200.1543.4954.2386.8997.46
40.250.0926.4928.6656.5268.51
50.250.1235.1736.6549.9090.18
60.250.1544.8047.9873.55110.86
70.300.0928.5327.8534.9055.36
80.300.1238.6239.8649.8568.96
90.300.1549.2853.4659.3580.92
100.350.0938.4645.6426.1432.37
110.350.1247.8755.3138.7442.01
120.350.1551.2660.7543.8352.82
130.400.0942.6265.7532.8235.67
140.400.1253.8477.6838.9546.87
150.400.1553.9785.2138.0159.64
Disclaimer/Publisher’s Note: The statements, opinions and data contained in all publications are solely those of the individual author(s) and contributor(s) and not of MDPI and/or the editor(s). MDPI and/or the editor(s) disclaim responsibility for any injury to people or property resulting from any ideas, methods, instructions or products referred to in the content.