Abstract
Renewable energy technologies play a crucial role in solving global energy and environmental issues, and the pace of the energy transition directly depends on improving their efficiency. Presently, the development and implementation of renewable energy systems are ensured mainly through state funding, the possibilities of which are limited. The potential of attracting private investments depends directly on their impact on companies’ profitability indicators, and the uncertainty regarding the return on investments is one of the main barriers affecting investors’ decision-making. Based on a vector autoregressive model for analysing the stationary time series, the paper explores the impact of long-term investments and research and development costs in renewable energy technologies on the financial performance of ten of the largest companies operating in this field. The study’s results showed that investments and spending on research and development positively affect such companies’ profitability indicators as earnings before interest, taxes, depreciation and amortisation, earnings before interest and tax, net income, and return on investment. The obtained results can be used to substantiate the economic effectiveness of investments in developing and improving renewable energy technologies when forming the companies’ financial policies to support them.
1. Introduction
Nowadays, renewable energy is considered by the world community as the primary mean of meeting future energy needs and tackling the climate challenge. A wide range of advantages of using renewable energy sources related to optimising energy consumption, declining the dependence of energy-importing countries on fossil fuels, reducing greenhouse gas emissions, creating jobs, and promoting economic development and innovations make it a vital tool in achieving the above goals.
The pace of the energy transition directly depends on the number of investments in renewable energy technologies. In recent years there has been a positive trend towards their considerable increase. Over the past eight years, investments in renewable energy systems have exceeded U.S. $250 billion annually, reaching a record high of U.S. $366 billion in 2021 [1]. Thanks to significant investment flow in the renewable energy industry, it became possible to achieve substantial progress in increasing the efficiency of green energy production and reducing its cost.
Thus, according to [2] weighted average Levelized cost of electricity for large-scale photovoltaic facilities for 2010–2020 decreased by 85% due to the increase in power plants’ efficiency, the effect of scale, and a decline in the cost of components through the reduction of using silver in production. In turn, the weighted average Levelized cost of electricity for concentrated solar power plants from 2010 to 2020 decreased by 68% due to a decrease in capital costs and an increase in the efficiency ratio. The average weighted indicator of the capacity factor of onshore wind farms increased from 27% in 2010 to 36% in 2020 due to technological innovations implementation. Due to the same reason, the weighted average capacity factor of onshore wind farms increased from 27% in 2010 to 36% in 2020. At the same time as the production cost of wind turbines decreased, the weighted average Levelized cost of electricity decreased by 56% during this period–to 0.039 USD/kWh. As regards the progress in offshore wind energy, the development of technologies made it possible to master the facilities installation on deeper areas of the seabed. Together with the optimisation of offshore wind turbine maintenance, it decreased the weighted average Levelized cost of electricity by 48%–to 0.084 USD/kWh. Other renewable energy technologies have demonstrated no less large-scale progress in recent years.
However, despite significant achievements in renewable energy technologies, declared long-term goals for green energy development and implemented state support schemes for encouraging energy production from renewable energy resources, the world’s final energy consumption is still mainly based on fossil fuels. Thus, as of the end of 2021, only 28.3% of electricity in the global electricity mix was provided by renewable energy resources, nuclear power accounted for about 10%, and fossil fuels ensured the rest. In the heating and cooling sectors, the share of energy produced from renewables was 11.2%, while fossil fuels provided 88.8%. The contribution of renewable energy resources in the transport sector was only 3.7%, whereas the share of fossil fuels amounted to 96.3% [1].
Thus, it can be stated that despite the annual increase in investments in renewable energy technologies, their volumes still need to be increased to replace fossil fuels rapidly. In the study [3], the authors argue that for every dollar invested in renewable energy sources, three dollars are invested in fossil fuels, particularly coal. As a result of fierce competition with conventional energy production technologies, renewable energy systems require more significant amounts of investments to achieve the effect of scale and reach economic profitability.
It is worth noting that today most of the investment flows in renewable energy technologies development are provided at the expense of state subsidies, which leads to market inefficiency. Attracting private capital could significantly improve the situation. However, private companies reluctantly invest in such projects due to the difficulty of forecasting future cash flows and guaranteeing a return on such investments [4]. Thus, the uncertainty regarding the return of invested funds is one of the main barriers to attracting private capital in renewable energy technologies.
Given the above, the main purpose of this article is to study the economic efficiency of long-term investments and research and development (R&D) costs in renewable energy technologies by assessing and forecasting their impact on companies’ profitability. Therefore, for the first time in the article, the economic efficiency of long-term investments and R&D costs in renewable energy technologies based on the created author’s model will be substantiated.
The obtained results will allow us to find whether it is possible to minimise such uncertainty by visually demonstrating their impact on the companies’ economic performance.
To achieve this purpose the following tasks were set:
- −
- to analyse the investments volume and R&D costs for supporting renewable energy technologies development in the ten most prominent companies operating in this field;
- −
- to build a model that reflects the impact of long-term investments and R&D costs in renewable energy technologies on such companies’ profitability indicators as earnings before interest, taxes, depreciation and amortisation (EBITDA); earnings before Interest and taxes (EBIT), net income, and return on investments (ROI).
- −
- to test regressions and vector autoregression models;
- −
- to forecast the value of investments and the economic effect of supporting renewable energy technologies development based on the variance decomposition of VAR models.
The remainder of this article is organised as follows. Section 2 is devoted to analysing relevant research papers addressing financing renewable energy technologies’ importance and main challenges. Section 3 describes methods and reflects collected statistical data for their further processing. Section 4 represents testing the built model, evaluating and interpreting the results. Section 5 contains conclusions and recommendations regarding the use of obtained research results.
2. Literature Review
Many research papers are devoted to attracting investments in the development of renewable energy systems [5,6,7,8], their further implementation [9,10,11,12,13,14,15], as well as their role in sustainable development [16,17,18,19,20,21,22] and the profitability of enterprises [23,24,25,26]. Most authors conclude that investments and R&D costs in renewable energy technologies are drivers of the transformation of the global energy market. To accelerate the energy transition and its impact on environmental quality, the renewable energy sector needs combined financial support from the state, international institutions, and the private sector. The studies devoted to these questions are given below.
Ahmed et al. [27] investigate the effect of public investments in R&D in clean energy-related technological innovation on the share of green energy in final energy consumption and carbon dioxide emissions in the G7 countries. The results demonstrated that investments are essential in enhancing renewable energy supply and reducing CO2 emissions. Hailemariam et al. [28] investigate the nexus between investments in renewable energy technologies and environmental quality in developed and developing countries. The authors found that R&D investments in renewable systems positively affect the environment by reducing greenhouse gas emissions. Zhang et al. [29] explore the impact of green finance, renewable energy investments, and technological innovation on environmental protection in G-20 economies. The findings reveal they are an essential role in curbing carbon dioxide emissions and meeting climate-policy goals. The authors note that investments in renewable energy technologies should be considerably boosted to achieve the climate policy goals.
The report [30] indicates that investments in clean energy infrastructure need to be significantly increased in the coming years to keep the average global temperature rise. Nowadays, investments in green energy are limited by specific barriers, including inefficient subsidies for fossil fuels, weak or absent carbon pricing, imperfection of regulatory policy, and lack of measures to support immature renewable technologies to become competitive with existing ones. In addition, there is a significant burden on state finances. Therefore, mobilising investments in renewable energy infrastructure will require attracting domestic and international private investments. A wide range of policy measures is needed to transform the energy system and shift investment away from fossil fuels towards green energy.
Das et al. [31] provide evidence for the need to finance renewable energy systems in developing countries. The report presents different models of innovative mechanisms for financing projects in the renewable energy field, including catalysing private investments. The researchers’ idea is to encourage the development of several options based on global, regional, bilateral, national, or local initiatives. It will allow us to diversify financing models to minimise investor risks, which are currently the main obstacle to investing in renewable energy projects.
Bindzi & Long [32] examine the role of attracting private investments through public-private partnerships to complement the limited capacity of the public sector in financing renewable energy systems. The paper analyses different arrangements contributing to reducing risks related to renewable energy projects implementation and the main advantages that both public and private actors have under such cooperation. The authors highlight the importance of public-private partnerships for lower-middle and low-income economies, which face severe difficulties accessing financing for renewable energy development.
Azhgaliyeva et al. [33] conduct quantitative estimates of the effect of government renewable energy policies on private investments across different sources of financing. Research results showed that government costs on R&D positively affect private investments from asset finance and corporate R&D. Ragosa & Warren [34] investigate similar aspects. The study’s results demonstrated that combining state support policy measures with attracting financing from international institutions contributes to the movement of global investments in renewable energy systems. In this context, the state can attract international private investments by demonstrating support for renewable energy.
Peimani [35] points to financial barriers to introducing renewable energy systems in Asia. In the short term, using exhaustible energy sources is much more profitable, as technologies have long been available as do not require significant investments in development. At the same time, the vast majority of renewable energy systems are currently unprofitable. The absence of venture capital and limited government-provided funds caused severe difficulties in funding capital-intensive renewable energy projects. This difficulty has served as a disincentive for those interested in undertaking these projects, resulting in a limited expansion of renewable energy in Asian countries.
Kurbatova & Khlyap [36], and Kurbatova & Skibina [37] state that one of the main problems of implementing renewable energy projects in Ukraine is the need for significant investments. The primary role in financing renewable energy projects belongs to the state. However, the green energy industry needs more financial resources due to limited state financing. High requirements regarding the projects’ economic, technical, and environmental criteria also constrain the possibility of attracting investments under special programs of international institutions. Accordingly, creating a favourable investment climate for attracting private investments is necessary for improving renewable energy projects support.
The literature review showed that public investments play a crucial role in financing renewable energy projects; however, their volume needs to be increased to achieve global energy and climate policy goals. Deployment of large-scale renewable energy infrastructure requires attracting extra private equity. In this context, the economic efficiency of the companies engaged in developing and implementing renewable energy systems becomes particularly relevant. It is because, for business, the key criterion is the economic efficiency of investing in such projects. If companies’ profitability indicators meet investors’ expectations, the private sector will also support renewable energy projects. With that in mind, this study deals with the economic justification of the economic efficiency of investments and R&D costs in renewable energy technologies.
3. Methods and Data
In this study, authors build a model that reflects the impact of long-term investments and R&D costs on companies’ profitability indicators such as EBITDA, EBIT, Net Income, and ROI. These indicators are the basis for assessing the companies’ financial positions and determining the effectiveness of their operation. It should be noted that long-term investments and R&D costs are the target costs for companies involved in developing and implementing renewable energy technologies. Therefore, by assessing the impact of long-term investments and R&D costs on companies’ financial performance, we can determine the economic viability of such companies in general.
The theoretical basis for developing the author’s model is the role of the entrepreneur as an innovator, developed by Schumpeter. Based on this economic theory, we consider long-term investments and R&D costs as a function of companies to improve their positions in the market. In turn, innovations should bring profit and be beneficial to the business. That is why in our model, the resulting indicators of long-term investments and R&D costs are companies’ profitability indicators. So, in this study, we will test the following regressions:
- Model 1:
- Model 2:
- Model 3:
- Model 4:
For the sample in this study, 10 of VARVARin 2020 companies engaged in developing and implementing renewable energy technologies were taken [38]. The list of companies included in the sample is given in Table 1.

Table 1.
Companies that make up a sample of research.
The study period includes two stages. The first one covers the period 2011-2020. It is taken as the base period for determining the impact of long-term investments and R&D costs on the companies’ financial performance. The second stage covers 2021–2025, which will be used to forecast the impact of long-term investments and R&D costs on the companies’ profitability indicators.
The study uses quarterly data, which are available in companies’ financial reports on their official websites. The output data are shown in Table 2.

Table 2.
Initial data for regressions.
The primary research method is the vector autoregressive model (VAR) for stationary time series analysis. The Dickie-Fuller test for a single root will be used to test time series for stationarity. It will allow us to test the time series for stationarity and find that they are stationary at the variable and first difference levels. The Engle-Granger test will be used to perform the cointegration test. It is to establish that the variables are not cointegrated. The pulse functions of the VAR model will be used to determine the pulses of the resulting variables on the shocks of independent regressors. It will show how much influence each independent variable has on the resulting parameter. The forecasting of indicators will be carried out based on the forecast of the VAR model. The decomposition method will be used to estimate and decompose the variance of the forecast errors. It will allow us to show how the degree of influence of independent variables on the resulting indicator changes over several quarters. Since all variables and results in the next period depending on their values in the previous period, all data for testing the model are considered time series (Time Series Data).
The formation of the table with the initial data for the study took place in the software product Microsoft Excel. Gretl software was used for regression calculations.
4. Results and Discussion
One of the critical economic aspects determining renewable energy systems development is the companies’ R&D costs and long-term investments. R&D costs reflect the financing of renewable energy technologies development. In this case, the number of resources spent only sometimes correlates with the results obtained, but the increase in these costs is evidence of funding for developing these technologies.
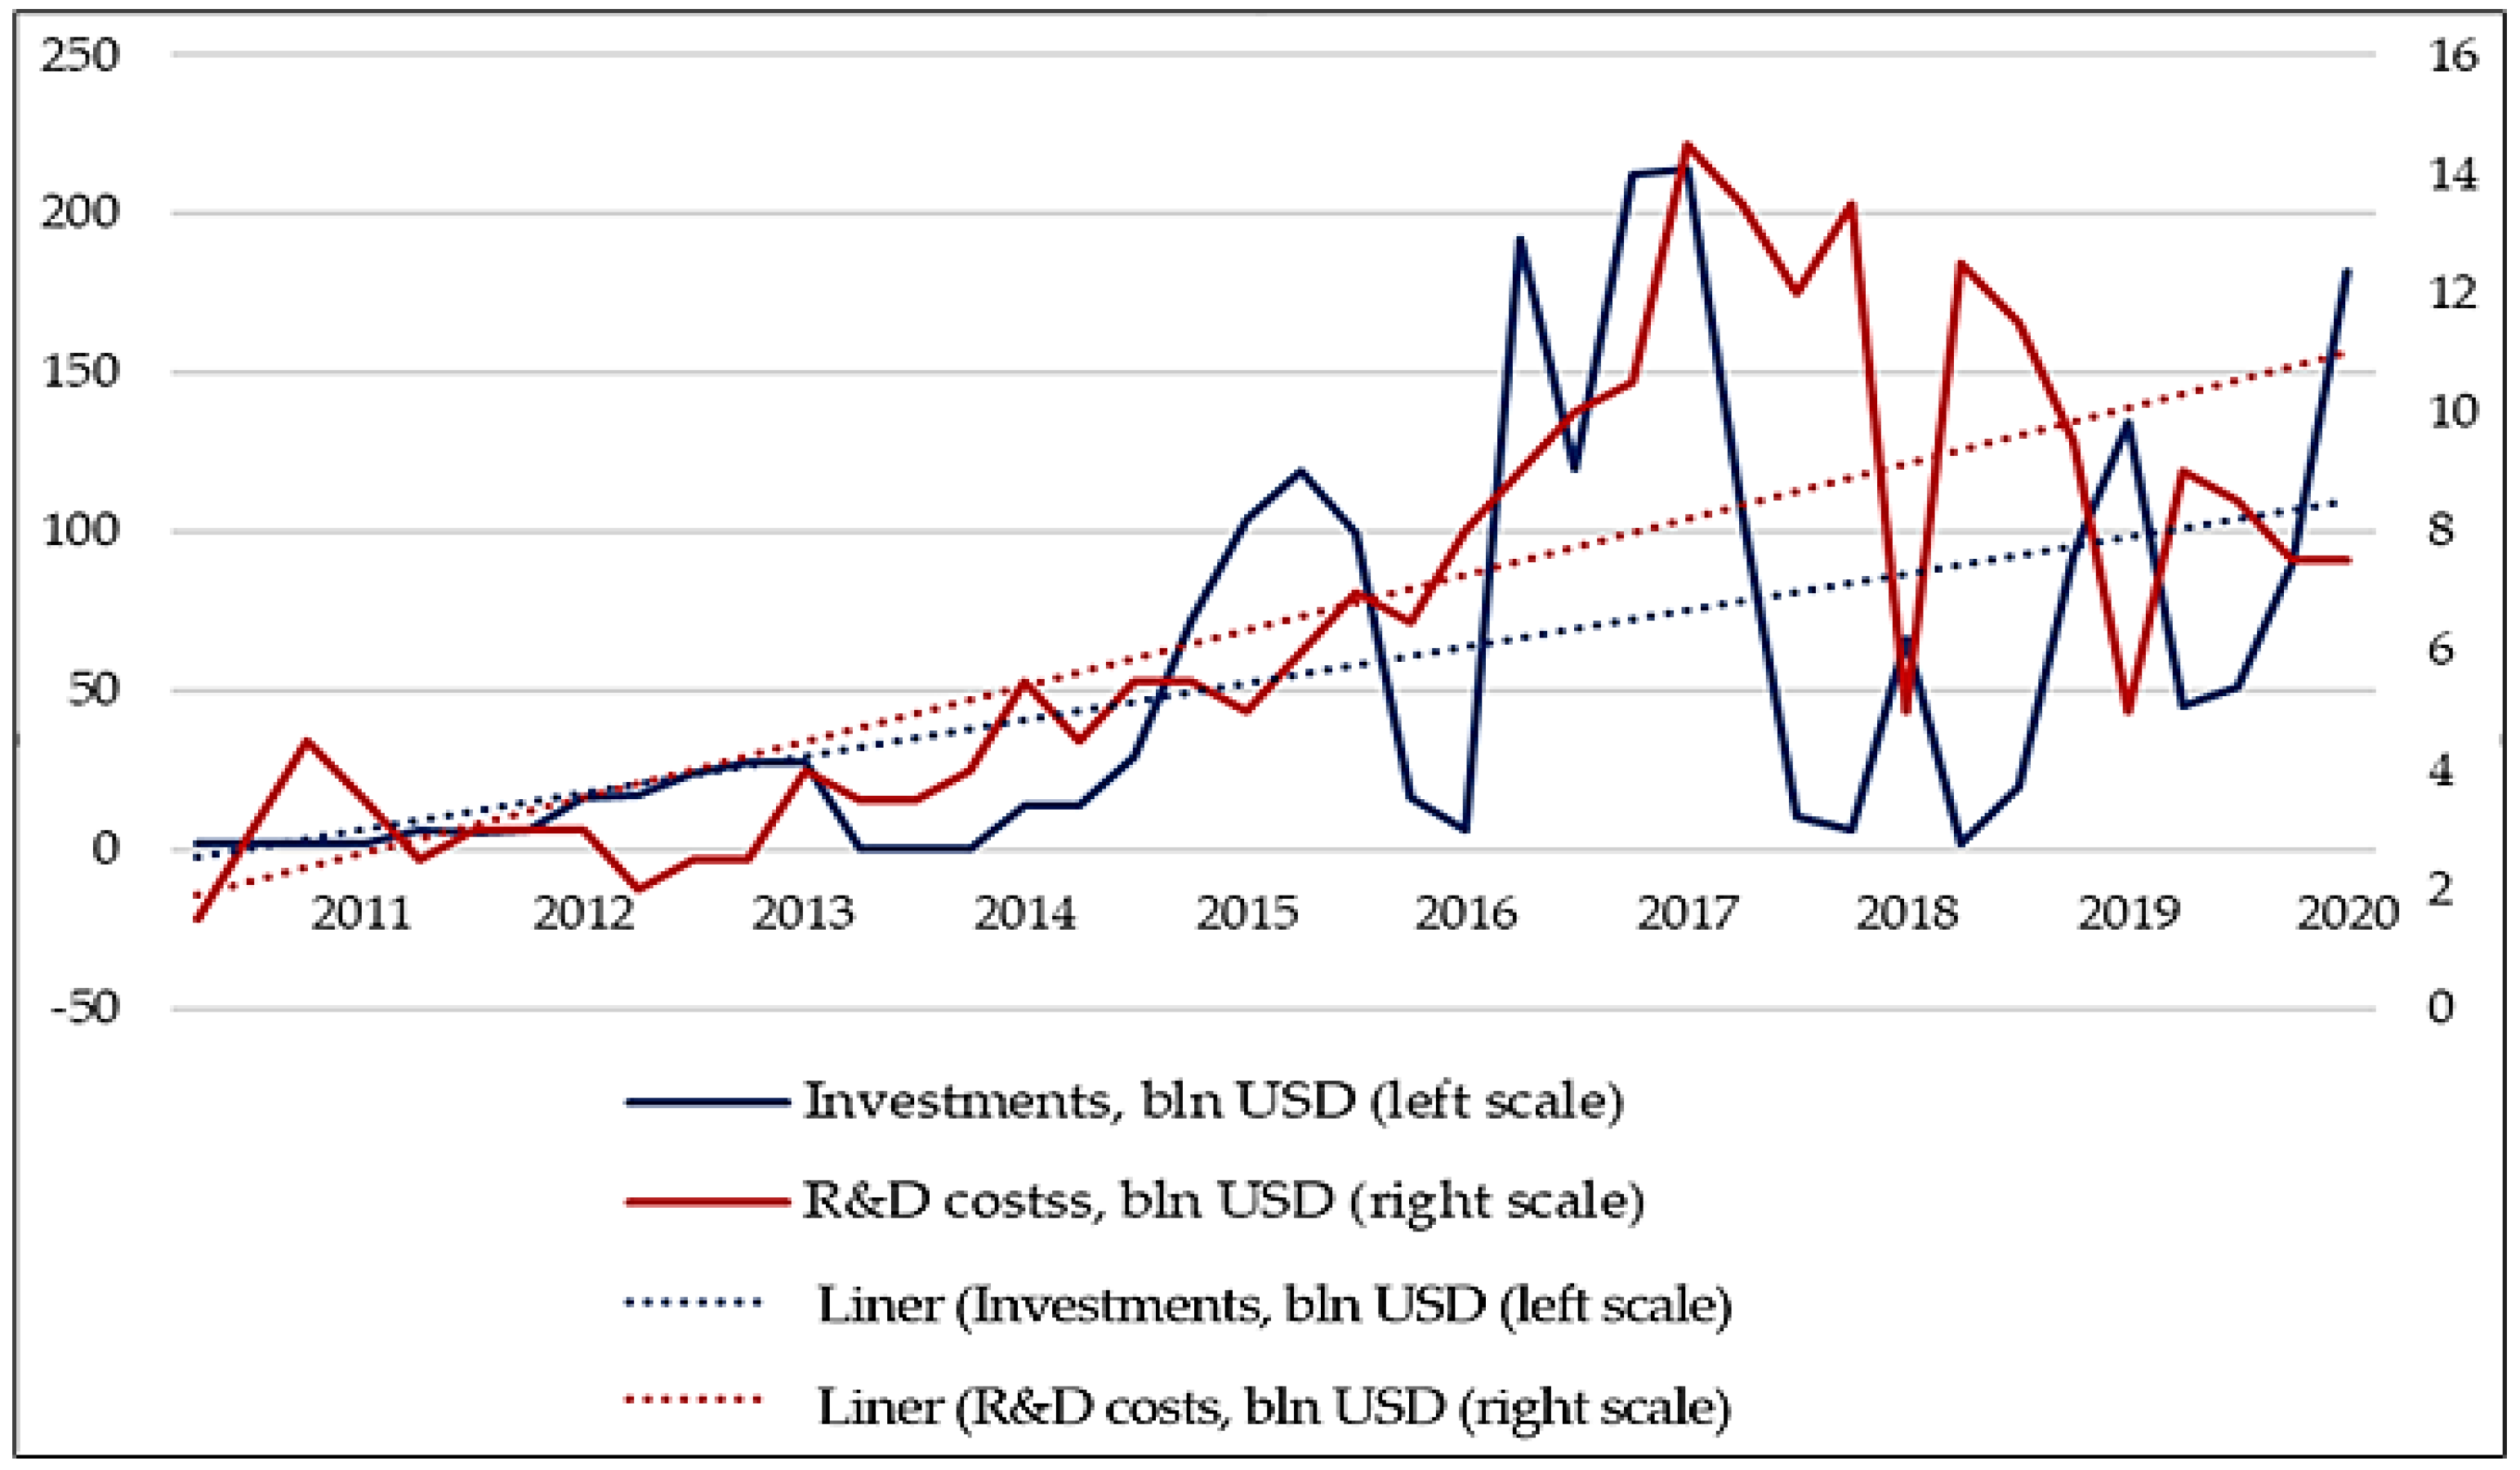
Long-term investments of companies reflect the financing of renewable energy technologies implementation. By long-term investments, we mean investments with a payback period of more than 1 calendar year. These are the costs for constructing energy complexes, production facilities, etc. The data in Figure 1 show the growing dynamics of long-term investments and R&D costs of the ten largest renewable energy companies selected for this study.
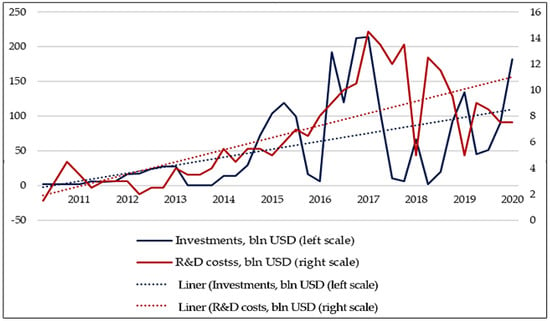
Figure 1.
Long-term investments and R&D costs of the selected ten companies operating in the renewable energy field in 2011–2020, bln USD (Source: constructed by author).
Next, we will consider how long-term investments and R&D costs affect the financial performance of the ten largest companies engaged in developing and implementing renewable energy technologies. The study uses performance indicators of companies, which by their nature, are time series. Considering this, the first step is to check the time series for stationarity. To do this, the Augmented Dickey-Fuller test for a single root (Augmented Dickey-Fuller test) is used. If the stationary time series is confirmed, the vector autoregressive model (VAR) will be suitable for the analysis of the model. If the stationarity is not confirmed, the VECM (Vector Error Correction Model) model will be used.
The data in Table 3 show that investments, Net Income, and ROI are stationary at the level of the first difference. In turn, EBIDTA, EBIT and R&D are stationary at the variable level. Thus, we can conclude that all variables are stationary either at the variable level or at the level of the first difference. Therefore, we can use the vector autoregressive model for stationary data series for further analysis.

Table 3.
Unit Root Test Results using ADF Procedure.
Testing the time series for stationarity showed that they are stationary at the first difference level. With a delay of one-time lag, the economic indicators of the model retain the nature of the connection between themselves. In general, such a result is satisfactory because long-term investments and R&D costs are carried out in one period, and the effect is manifested in subsequent ones. Also, financing these costs depends on obtaining profits in previous periods.
The next stage of the study is to verify the cointegration of variables. To do this, we will build models described in Section 3. The results of the cointegration test are shown in Table 4, Table 5, Table 6 and Table 7.

Table 4.
Engle-Granger test results. Model 1. Dependent variable: EBITDA.

Table 5.
Engle-Granger test results. Model 2. Dependent variable: EBIT.

Table 6.
Engle-Granger test results. Model 3. Dependent variable: Net Income.

Table 7.
Engle-Granger test results. Model 4. Dependent variable: ROI.
Table 4 shows that long-term investments are cointegrated with EBITDA. This is confirmed by the p-value of 0.0086. However, R&D costs are not cointegrated with EBITDA, as the p-value is more than 0.05.
The data in Table 5 indicate that long-term investments are cointegrated with the EBIT indicator. This is confirmed by the p-value of 0.0267. At the same time, R&D costs are not cointegrated with EBIT, as the p-value is more than 0.05.
The data in Table 6 demonstrate that long-term investments are not cointegrated with the Net Income indicator. This is confirmed by the p-value, which is 0.8158 and more than the threshold value of 0.05. R&D costs are also not cointegrated with EBIT, as the p-value is more than 0.05.
The data in Table 7 indicate that long-term investments are not cointegrated with the ROI indicator. This is confirmed by the p-value, which is 0.6668 and exceeds the threshold value of 0.05. R&D costs are also not cointegrated with EBIT, as the p-value is more than 0.05.
The results show that EBITDA, EBIT, Net Income, and ROI are not cointegrated with investments and R&D costs. It is confirmed by the corresponding values of the p-value parameter, which is greater than the reference value of 0.05. The model data cannot be considered an error correction model (ECM), so a vector autoregressive model (VAR) will be used.
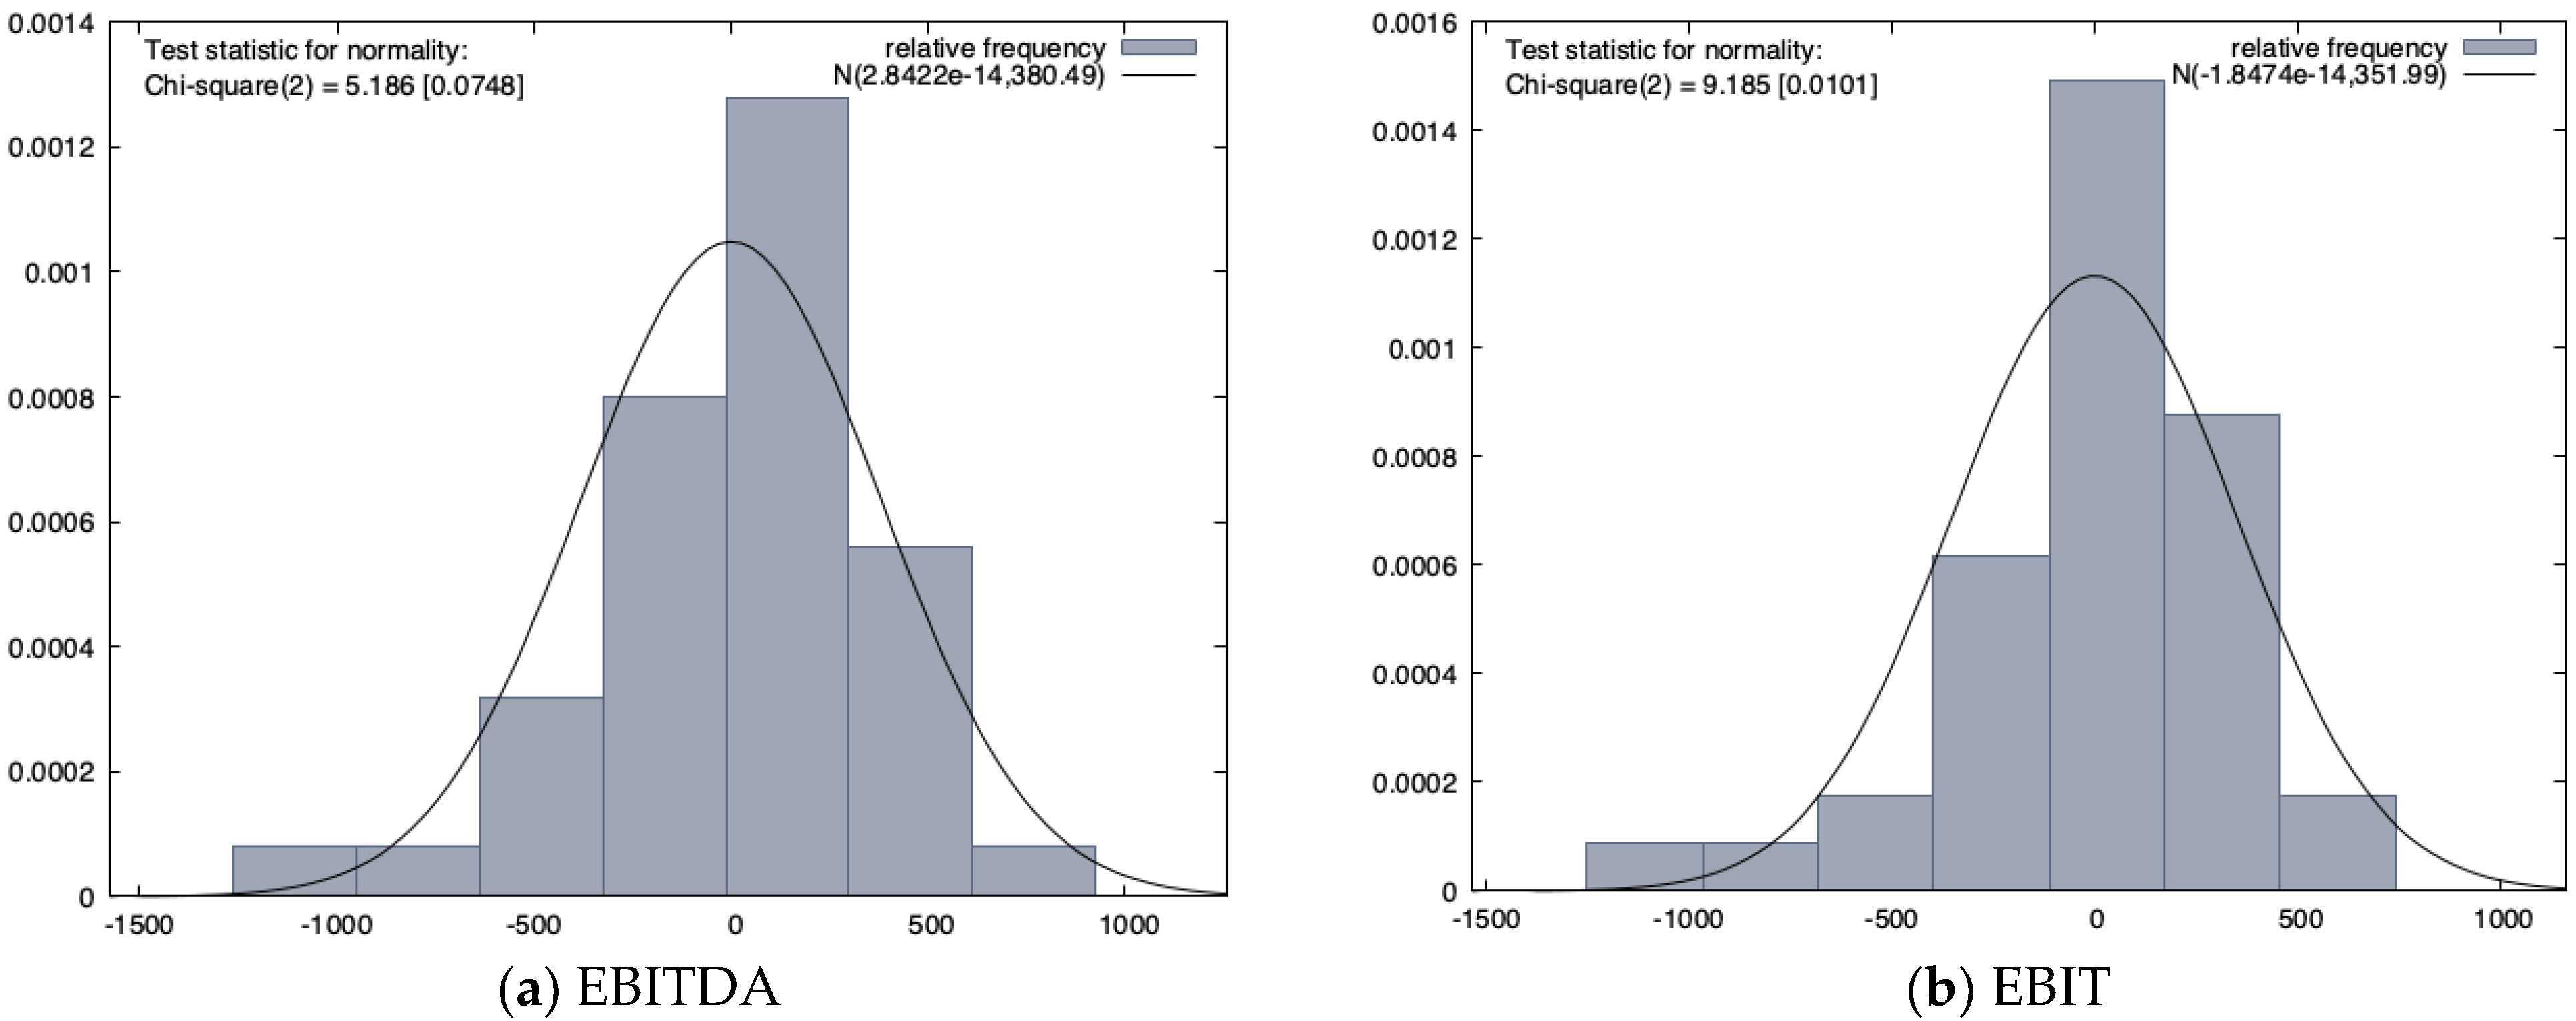
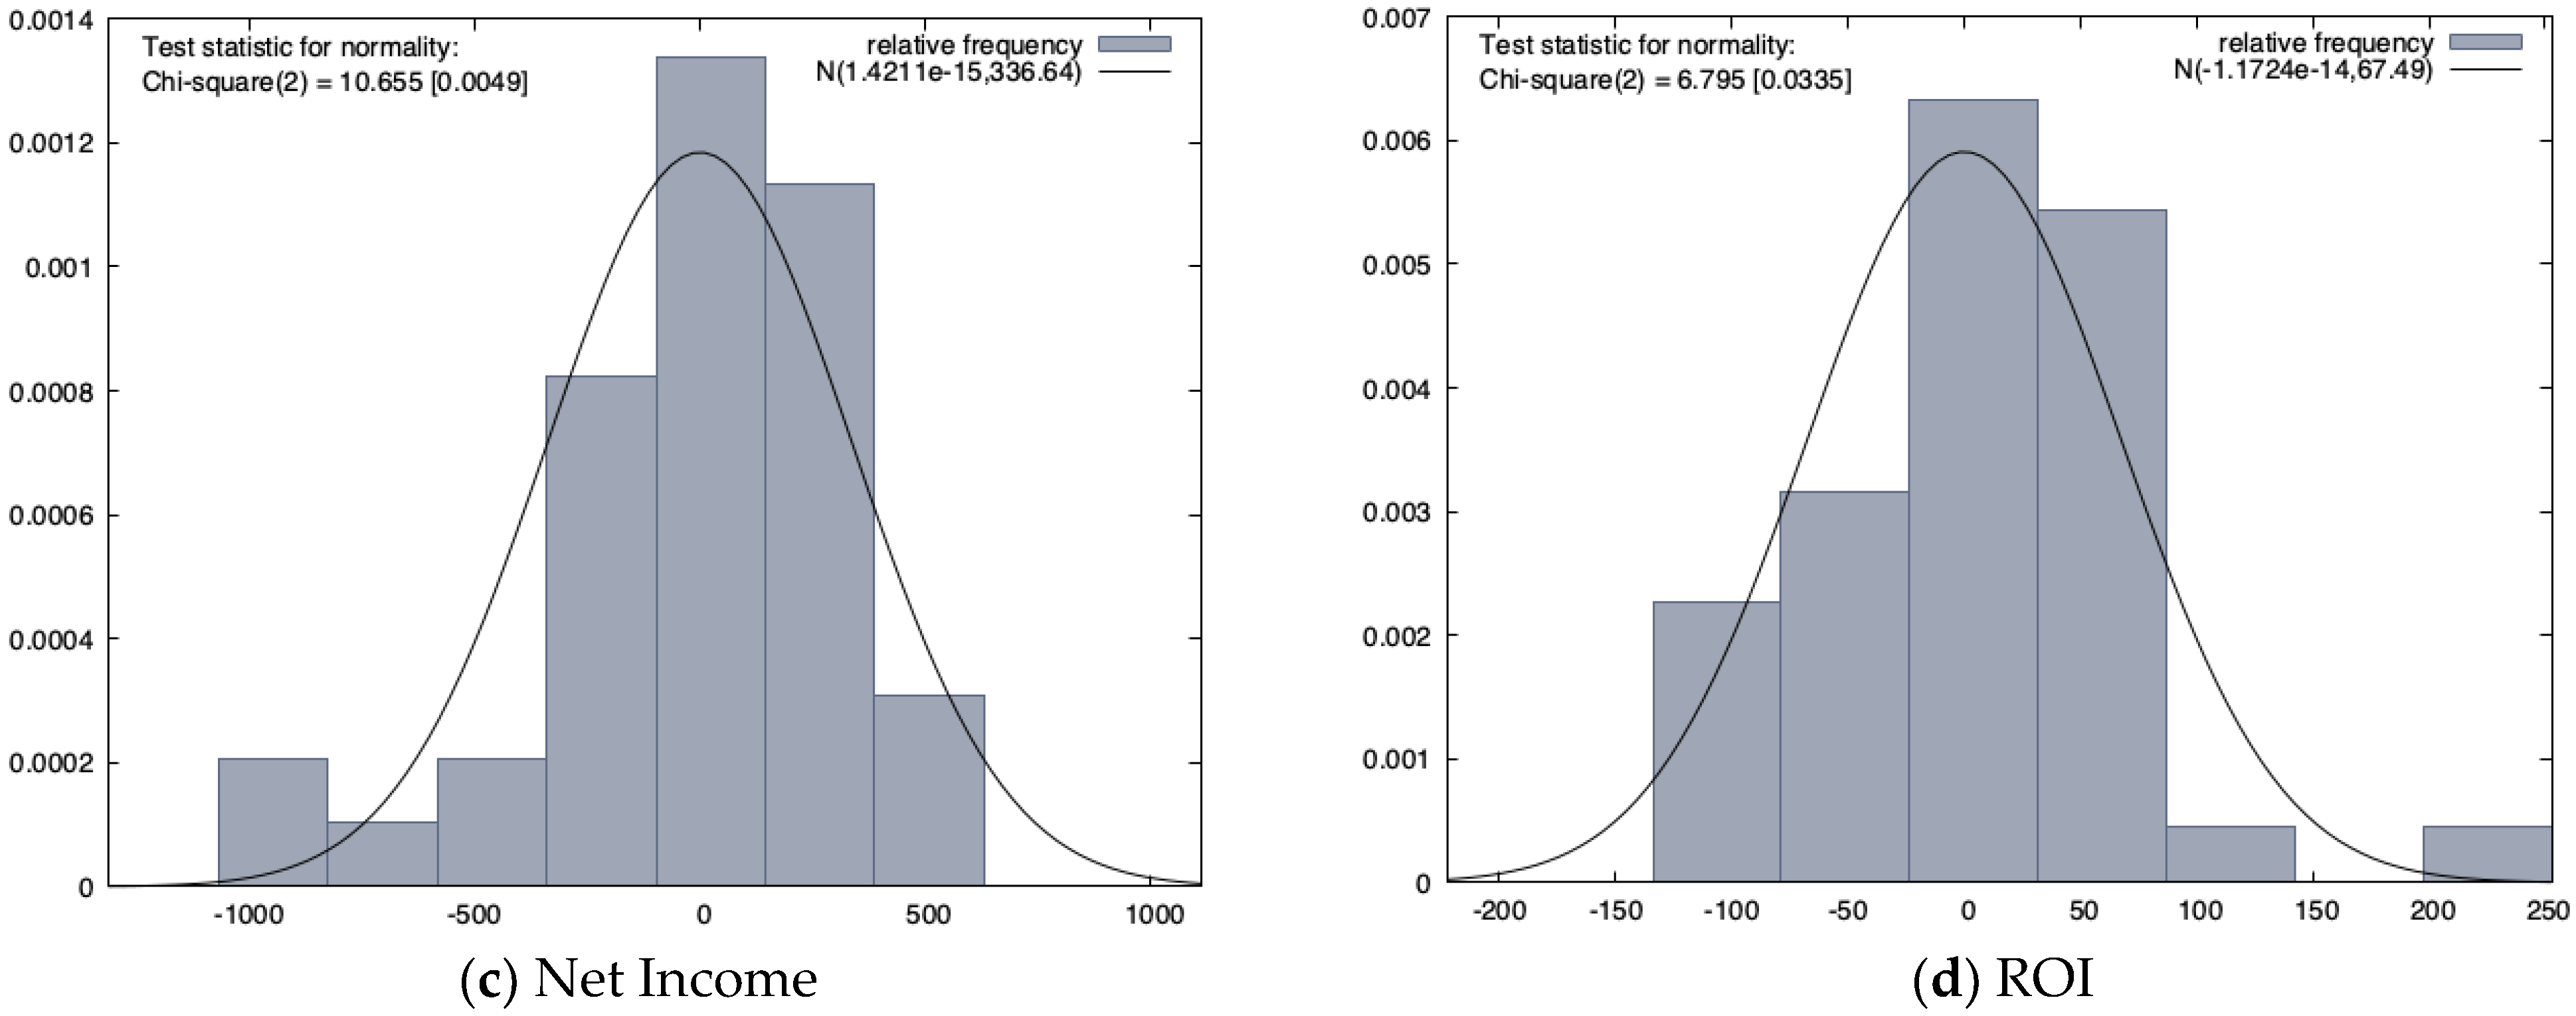
In the time series of economic parameters, it is difficult to obtain a normal distribution of regression residues because economic indicators depend on many variables and do not have average objective values. The next step is to check the regression residues of the corresponding models 1–4 for the normality of the distribution. Figure 2 shows the graphs of the normality distribution of the regression balances of the impact of long-term investments and R&D costs on the resulting indicators.
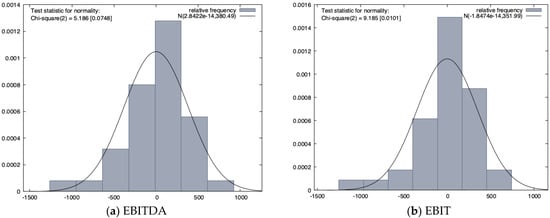
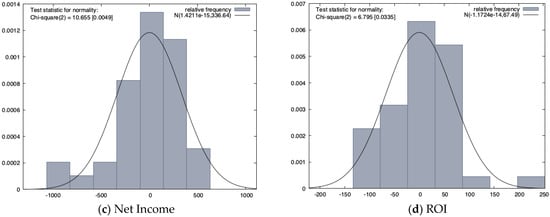
Figure 2.
Residuals of (a)-EBITDA, (b)-EBIT, (c)-Net Income, (d)-ROI Distribution Normality Test (Source: constructed by author).
The data in Figure 2 indicate the normality of residues distribution, which is confirmed graphically and by the corresponding values of coefficients. Next, we will construct vector autoregressive models of the impact of long-term investments and R&D costs on the resulting indicators.
According to the calculations, we have a VAR model with a lag length of 4. For each equation, we present variables that are statistically significant regressors, which is confirmed by the corresponding values of the p-value parameter. These equations answer the question: do changes in regressor values lead to changes in the values of the resulting indicator? The null hypothesis assumes no causation. If the p-value parameter is less than 0.05, we can reject the null hypothesis and confirm the existence of a causal relationship. Table 8, Table 9, Table 10, Table 11, Table 12 and Table 13 provide information on the causal relationship between variables in the respective lags.

Table 8.
VAR (4) Equation (1): Long-term investments.

Table 9.
VAR (4) Equation (2): R&D costs.

Table 10.
VAR (4) Equation (3): EBITDA.

Table 11.
VAR (4) Equation (4): EBIT.

Table 12.
VAR (4) Equation (5): Net Income.

Table 13.
VAR (4) Equation (6): ROI.
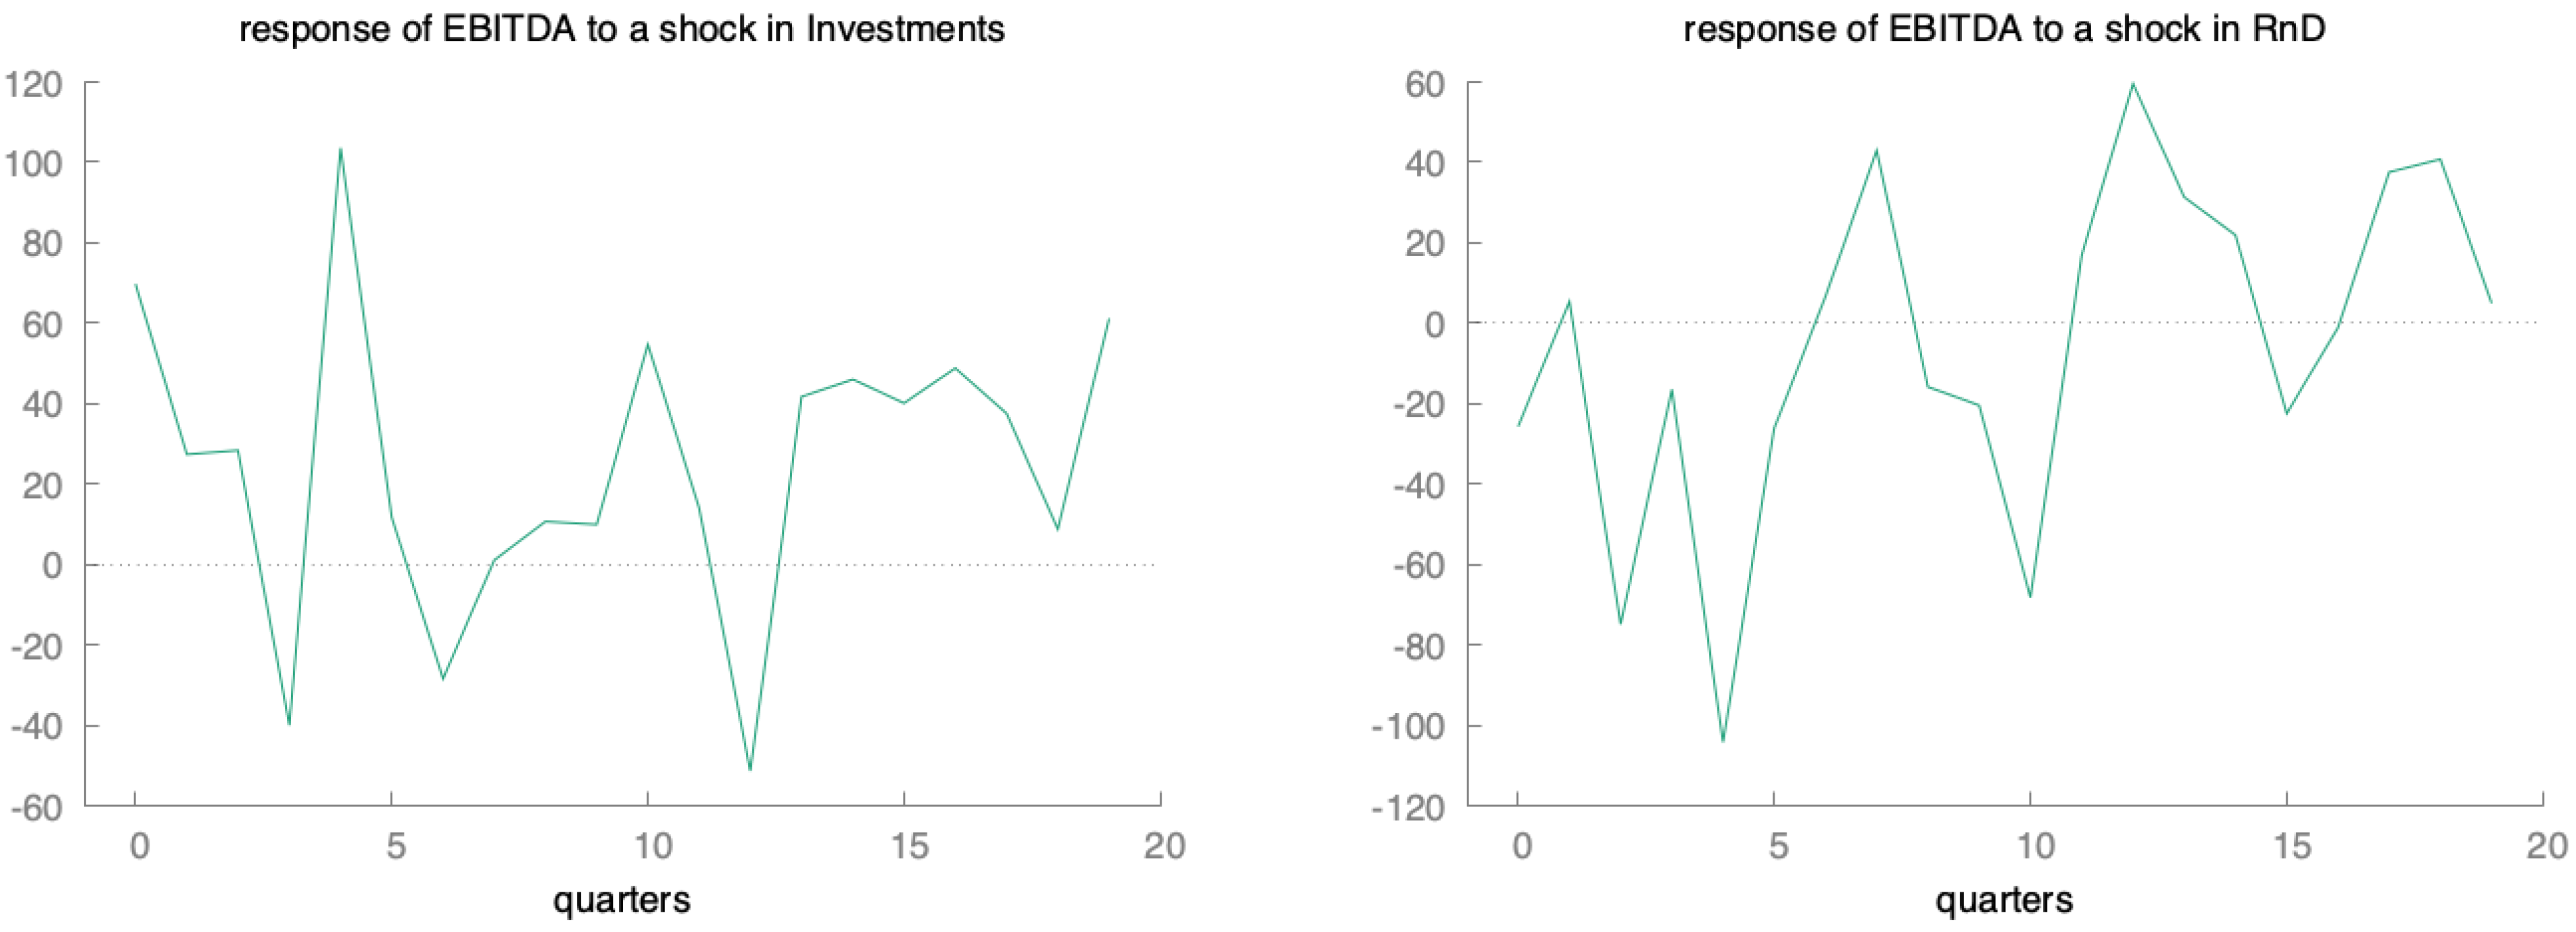
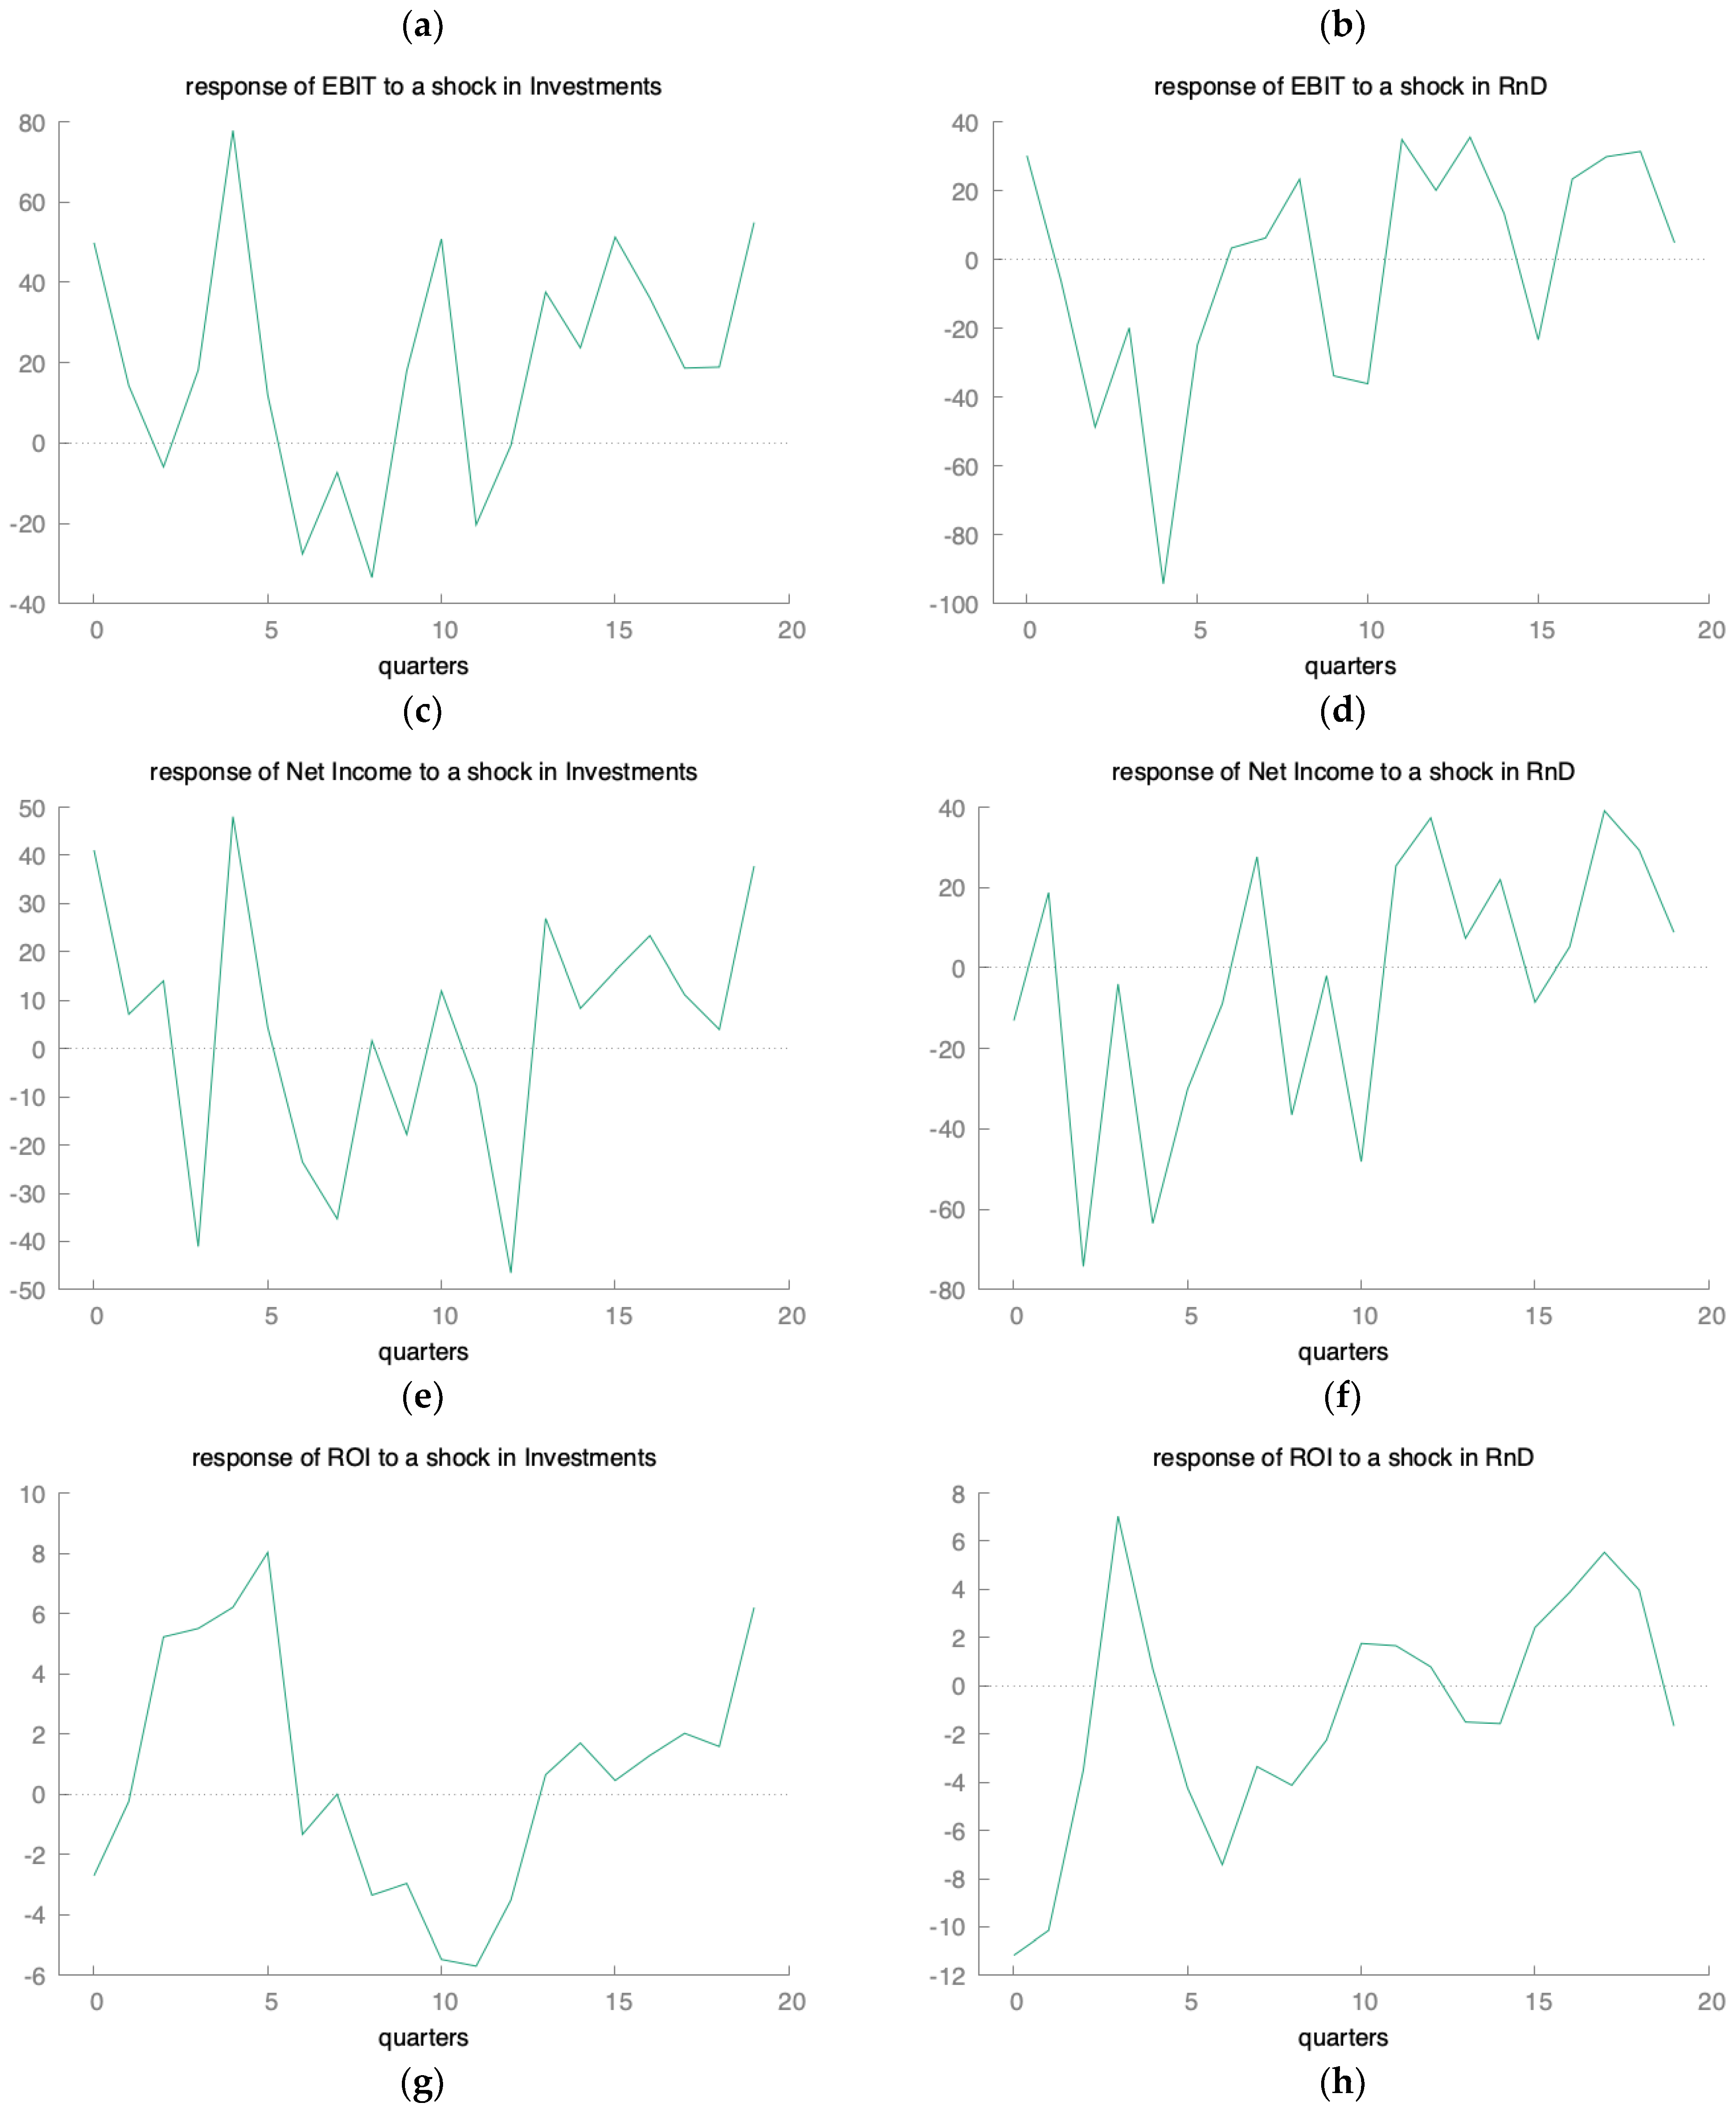
The responses of the dependent variables to the shocks of the independent variables are shown in Figure 3. We can argue that financial indicators do not affect the number of investments and R&D costs based on the obtained data. It can be explained by the fact that investments and R&D are carried out not based on indicators of past activity but on a prospective assessment of the development of the market and companies.
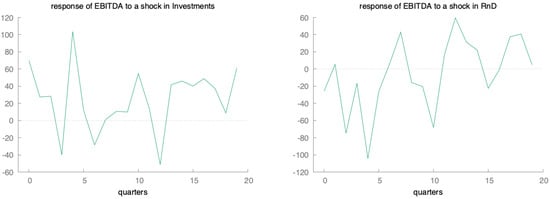
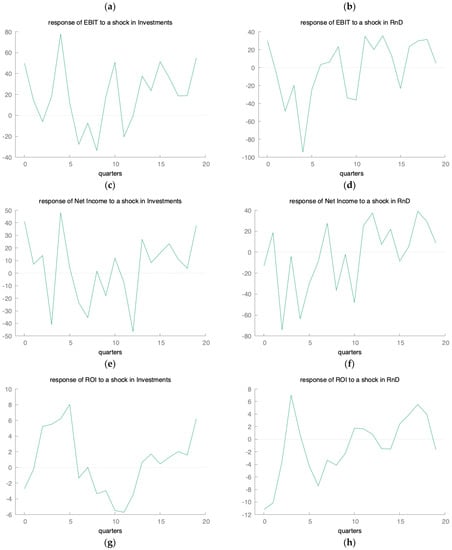
Figure 3.
Responses: (a)-EBITDA, (c)-EBIT, (e)-Net Income, (g)-ROI on shocks in Investments and (b)-EBITDA, (d)-EBIT, (f)-Net Income, (h)-ROI on shocks in Research and Development Expenditures (Source: constructed by author).
EBITDA has a statistically significant impact on R&D costs in the fourth tier, the EBITDA indicator itself in the first tier, and EBIT in the first tier. EBIT is affected by R&D costs in the fourth tier, EBIT in the first tier, and Net Income in the fourth tier. Given that the initial data are quarterly, the fourth lag predicts the impact approximately one year later, that is, during the use of profits.
Figure 3 indicates a long-term relationship between dependent and independent variables. All impulses of shocks of investments and R&D costs cause long-term shifts in indicators of EBITDA, EBIT, Net Income, and ROI. EBITDA has a positive response to the investment shock, but a negative response to the R&D costs shock. EBIT has a weak response to investments and R&D costs shocks, which virtually drops to zero after just ten observation periods. Net income reacts negatively to investments and R&D costs shocks, which is expected as additional costs reduce net income. The ROI has a negative response to the investment shock in the first ten periods but a positive response in the following eight. The ROI response to R&D costs is positive in the first five periods, followed by a negative response. After ten periods is transformed again into a positive one.
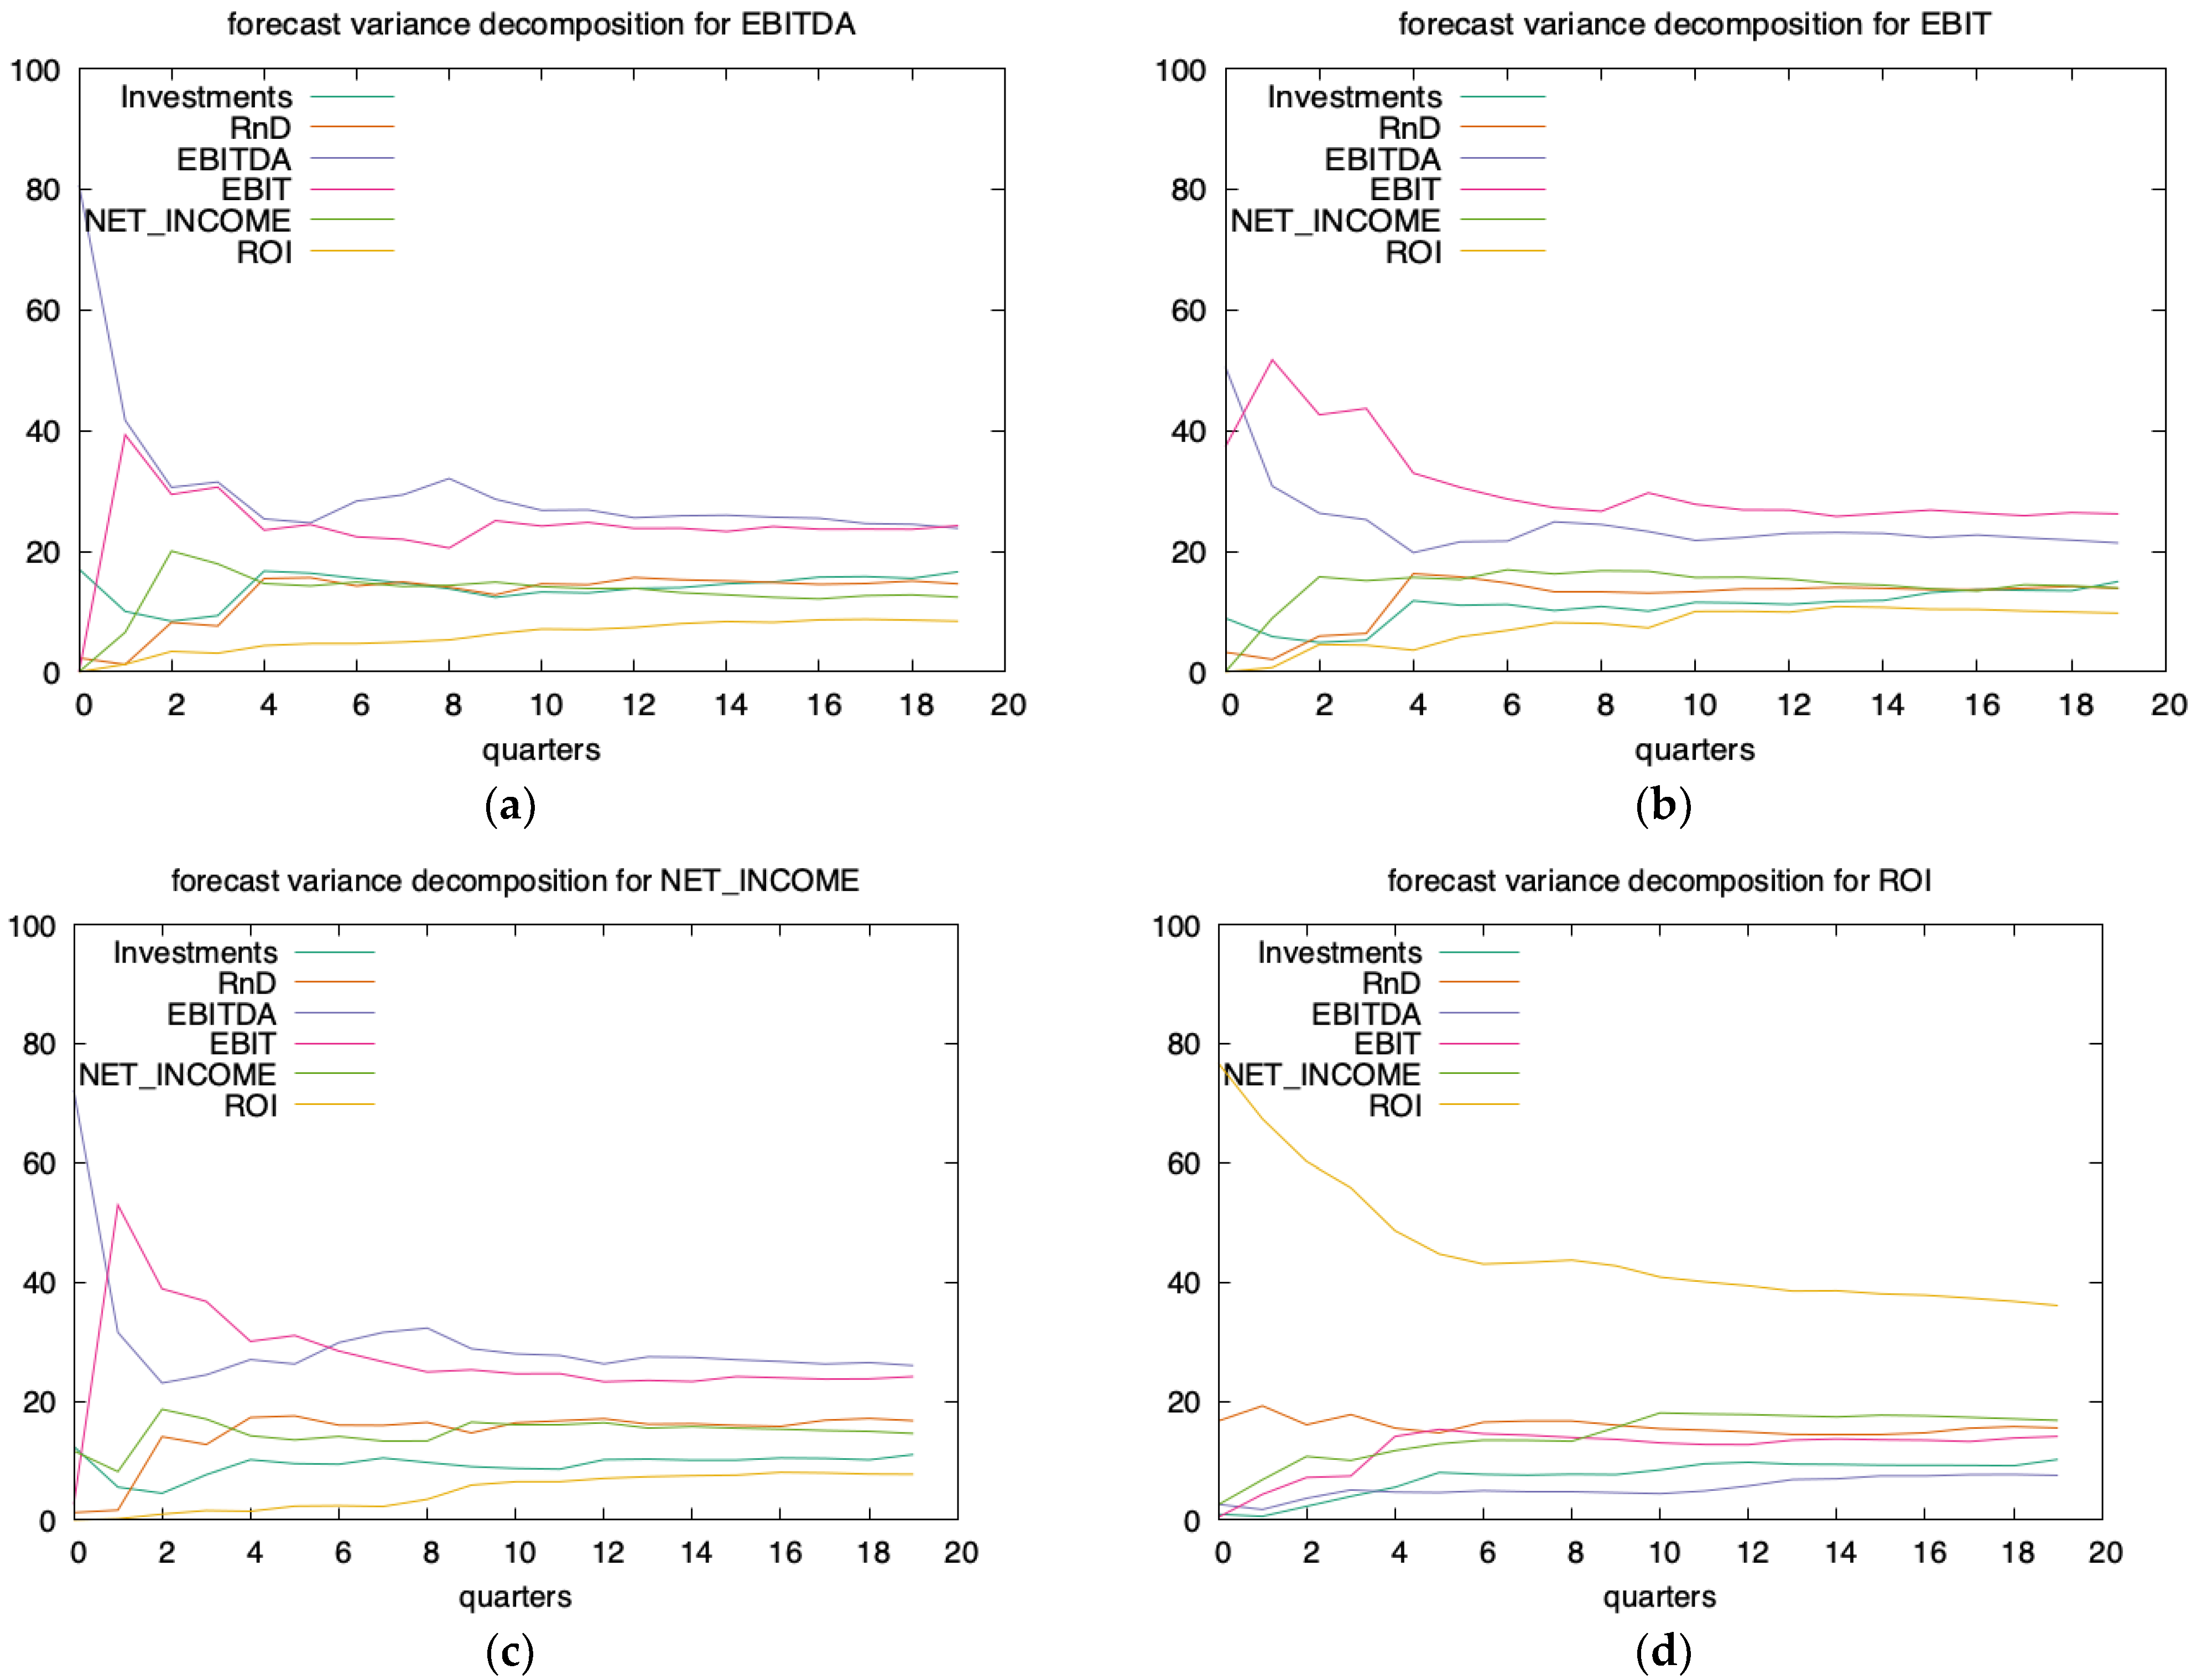
For a more detailed understanding of the results obtained, it is necessary to consider the properties of forecast errors and the decomposition of their variances. The decomposition of variances allows us to estimate the proportions of the variance caused by shocks of different variables. It will enable us to determine by what percentage the change of one indicator explains the change of another. Figure 4 shows a graphical representation of the decomposition of variances of VAR model variables over 20 periods.
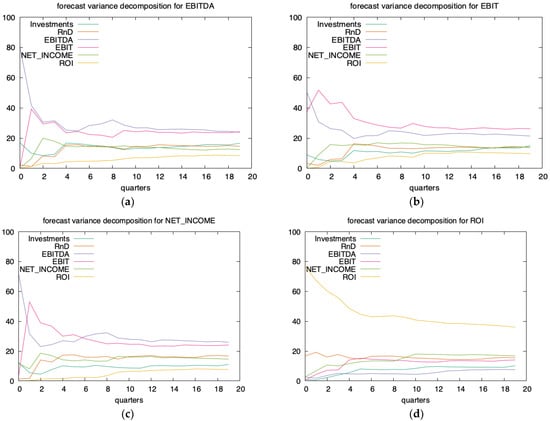
Figure 4.
Variance Decomposition of (a)-EBITDA, (b)-EBIT, (c)-Net Income, (d)-ROI (Source: constructed by author).
The data shows that EBITDA after the first period is equally dependent on itself and EBIT by about 30%. Other variables account for an average of 20% of the influence. The situation is similar concerning the EBITD indicator.
ROI is primarily up to itself. Net income after the fourth period is equally dependent on EBITDA and EBIT—which exert an influence of 30% each. This influence is more than 60% in the first two periods and decreases to 40% after the sixth period.
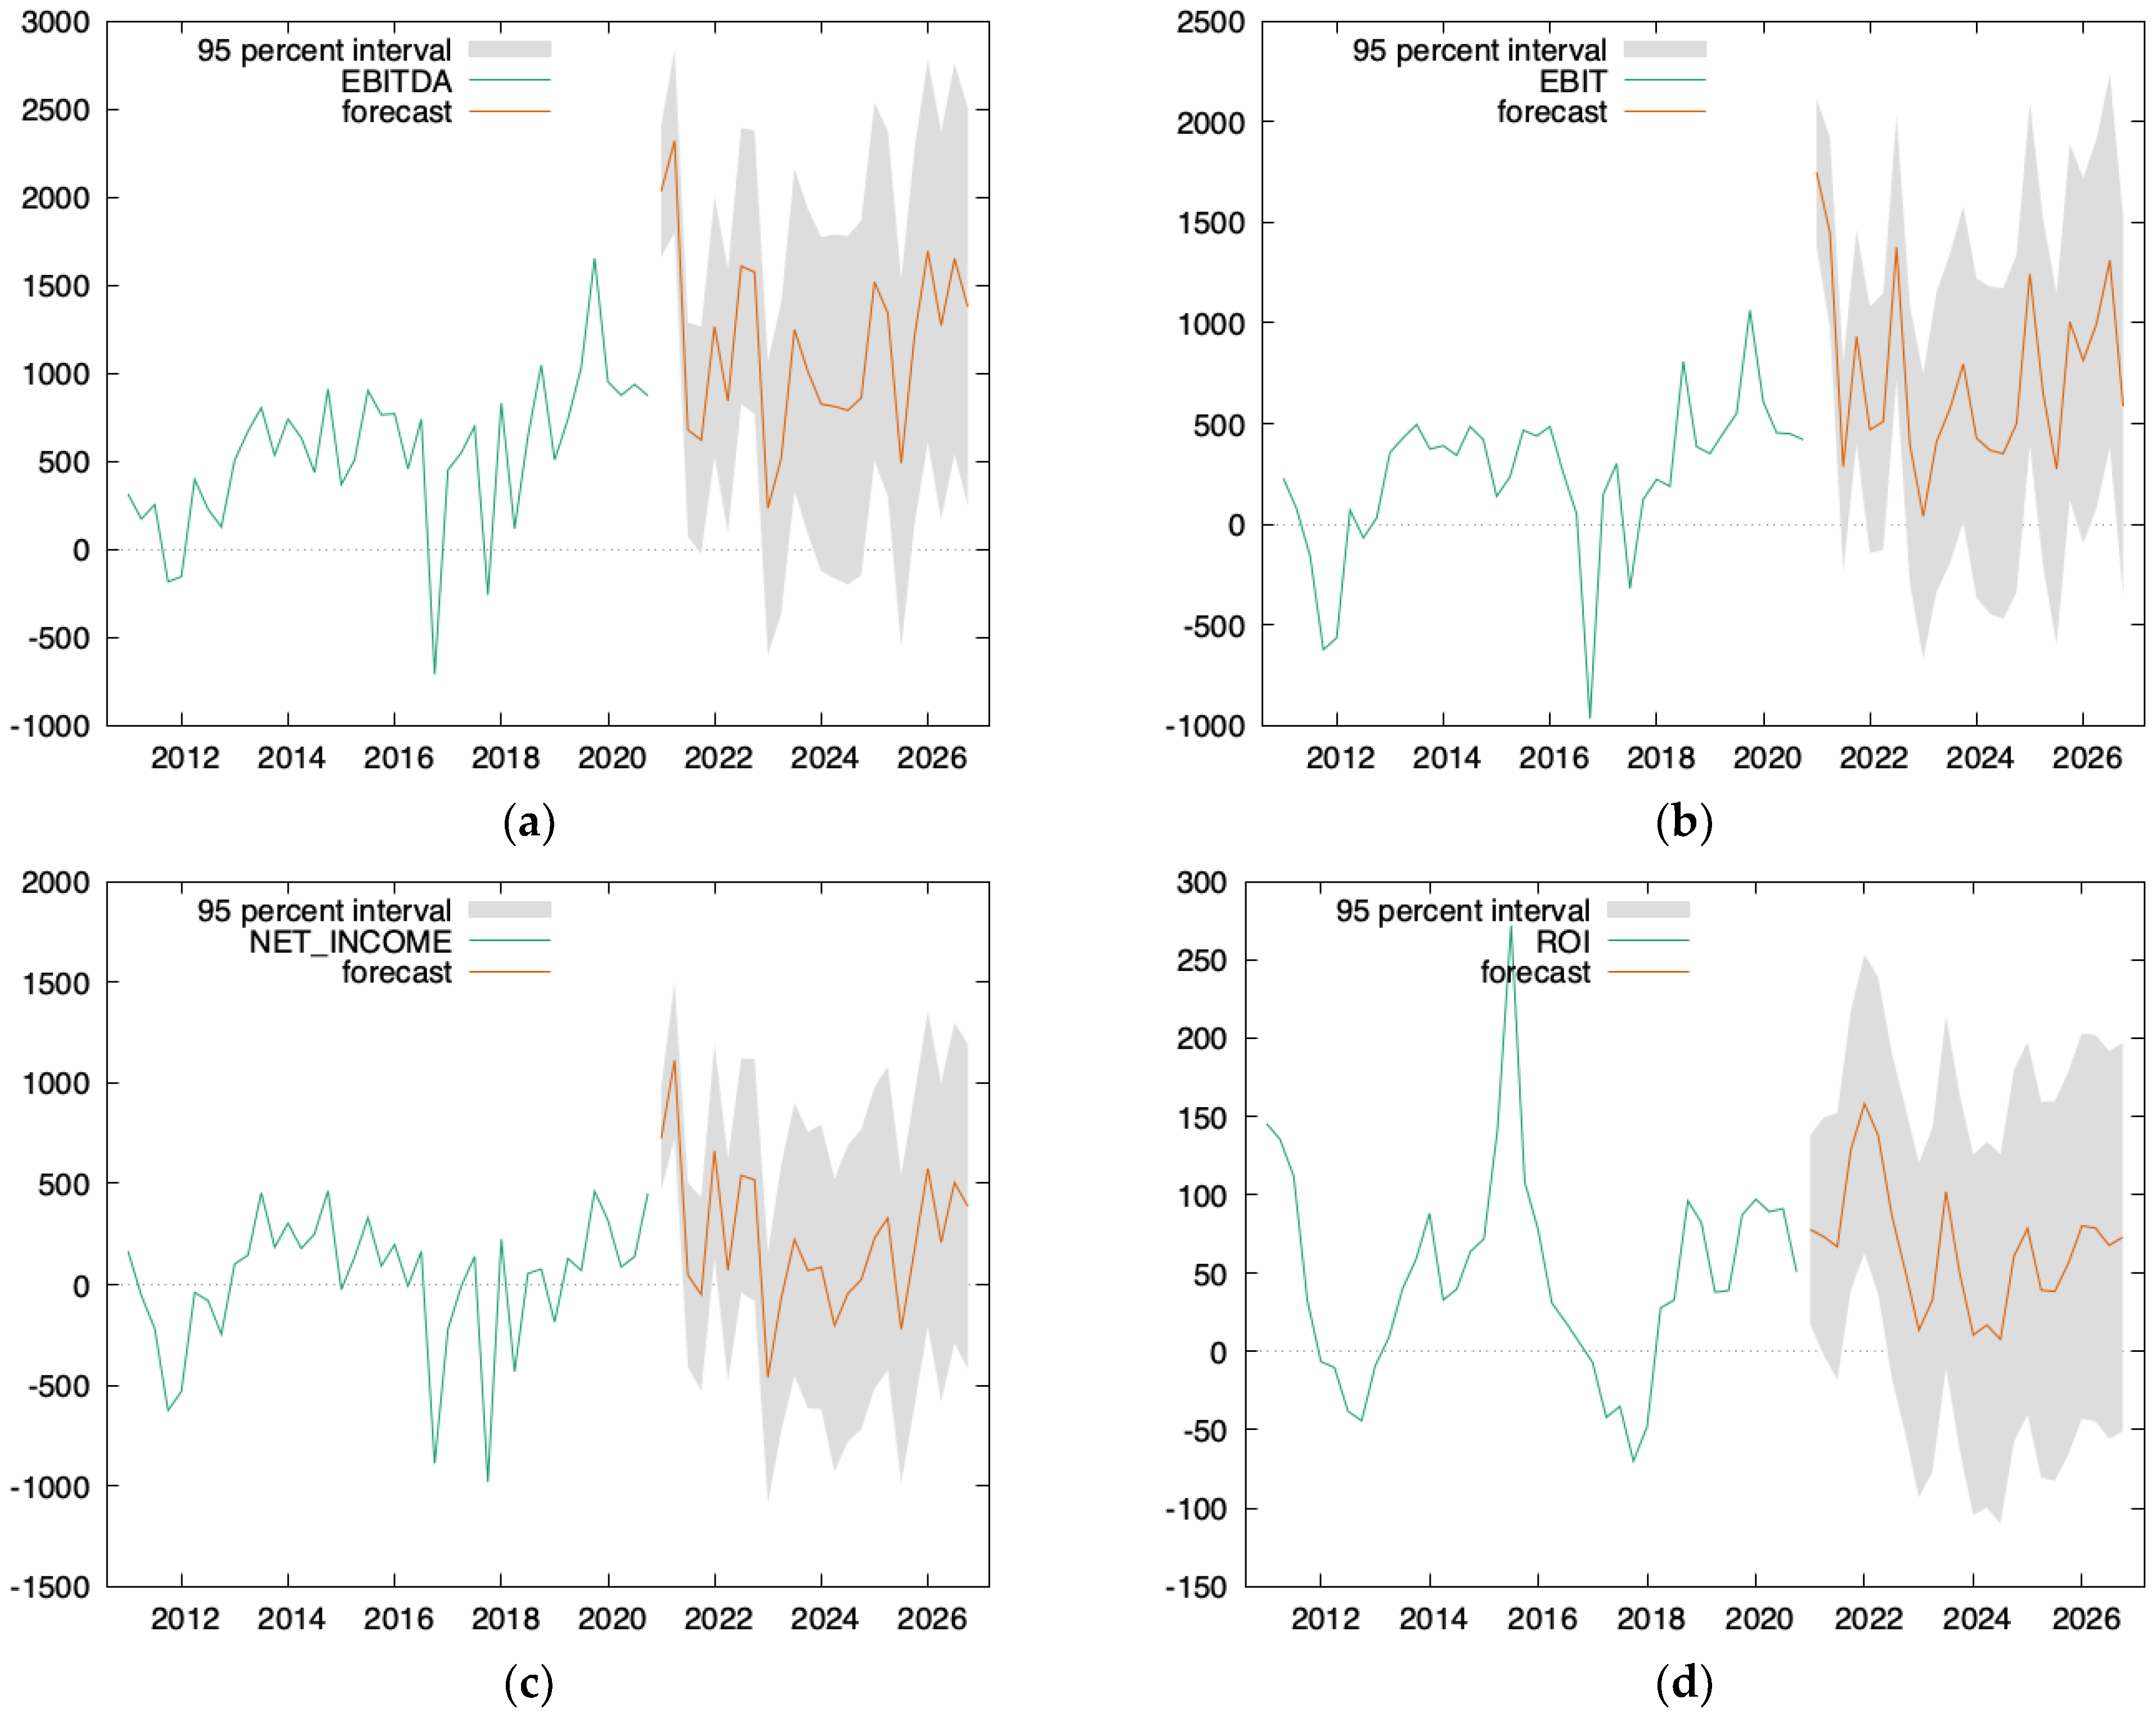
The forecast of the impact of long-term investments and R&D costs on EBITDA, EBIT, Net Income, and ROI is shown in Figure 5.
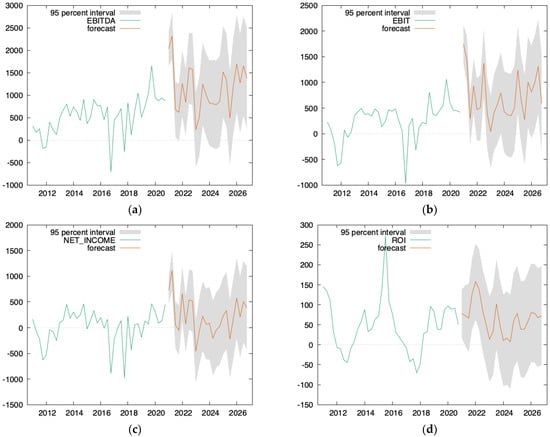
Figure 5.
Forecast of (a)-EBITDA, (b)-EBIT, (c)-Net Income, (d)-ROI (Source: constructed by author).
The forecast results show that long-term investments and R&D costs of companies involved in developing renewable energy technologies have a positive impact on their profitability indicators. The forecast was calculated for the horizon until 2026. All indicators are positive, and the forecast values are within 95% of the confidence interval.
Thus, the obtained results demonstrate the positive impact of investments and R&D costs in renewable energy technologies on the financial performance of companies engaged in such activity. The results indicate that on the forecast horizon of 5 years, such indicators as EBITDA, EBIT, Net Income, and ROI prove positive growth dynamics that prove the economic efficiency of attracting investments and spending costs for R&D to promote renewable energy technologies.
Several studies [4,49,50,51,52,53,54,55] indicate that one of the main challenges for attracting financing for renewable energy technologies development is the complexity of predicting future cash flows and the return of invested funds. As a result of such uncertainty, investors grudgingly invest in such projects. In contrast to the mentioned research, we prove the possibility of levelling this obstacle due to a visual demonstration of the economic efficiency of investments in renewable energy technologies.
The possibility to estimate the future cash flows and companies’ profitability indicators with high probability, confirmed by research results, demonstrates the effectiveness of private investments in renewable energy technologies. It can be a strong argument for increasing the share of private financing in renewable energy projects through awareness of the attractiveness of such investments.
In addition to the above, evidence of the positive impact of long-term investments and R&D costs on the companies’ key performance indicators can serve as a basis for developing commercial proposals for attracting investments for companies operating in the renewable energy field. Furthermore, the obtained results can be used to substantiate and assess the economic efficiency of financial policy aimed at supporting renewable energy technologies.
It should be noted that this study has some limitations. The first one relates to the fact that the object of the study is only ten companies. Although the selected companies are the largest in the renewable energy technologies production field, including more companies in the sample may slightly change the results. The second one is related to the impossibility of including in the mathematical research apparatus all the factors that influence the investment process in the energy sector, primarily macro-environmental factors and those caused by the global social and political situation, as well as rapid and unpredictable technological changes.
The study opens up new areas for further research, particularly related to assessing the impact of investments in renewable energy technologies on other performance indicators of energy companies, mainly related to achieving sustainable development goals. In addition, the direction of further research on this topic can be the study of the impact of uncertainty on the prospects and economic feasibility of investments in renewable energy systems in comparison with conventional energy production technologies.
5. Conclusions
The paper studies the quantitative parameters of the built model, which reflects the impact of long-term investments and R&D costs in renewable energy technologies on such companies’ profitability indicators as EBITDA, EBIT, Net Income, and ROI. The obtained results showed that energy companies’ financial performance improved significantly due to long-term investments and spending costs for R&D. The corresponding values of the p-value parameter confirm it. The p-value for EBITDA is 0.01111; for EBIT is 0.05702; for net income is 0.04439. Only ROI is not cointegrated with investments and R&D costs, confirmed by a p-value of 0.3562, more significant than the reference value of 0.05.
Regression testing results and the vector autoregressive model indicate a long-term relationship between the dependent and independent variables. All impulses of investment shocks and research and development costs cause long-term shifts in EBITDA, EBIT, Net Income and ROI indicators. EBITDA has a positive response to an investment shock but a negative response to an R&D expenditure shock. EBIT has a weak response to investments and R&D costs shocks, practically falling to zero after ten observation periods. The change in EBITDA is primarily determined by changes in the indicator itself in previous periods, but after the eighth period, such a change is determined by only 40%. Changes in financial indicators are caused by changes in R&D costs by an average of 5% and investments by an average of about 20%. Therefore, the EBITDA, EBIT, Net Income and ROI indicators can determine the effectiveness of the implemented financial policy to support renewable energy technologies development.
The results obtained by forecasting the value of investments and the economic effect of supporting renewable energy technologies development also demonstrate that investments and R&D costs positively impact companies’ financial performance. The forecast was calculated for the horizon until 2026. A positive trend is observed for all predictors, and the predicted values are within the 95% confidence interval. The forecasting results indicate the presence of long-term potential for investing financial resources in renewable energy technologies development.
The theoretical value of the obtained results lies in the fact that they prove a long-term statistically significant relationship between investments and R&D costs on the economic indicators of companies engaged in renewable energy technologies development. The practical value of the study results is that they can be used in the economic justification of the financial policy aimed at supporting renewable energy technologies development with the participation of private investors that can have an essential impact on accelerating the energy transition.
Author Contributions
Conceptualisation, O.P., T.K. and G.P.; methodology, J.B.; software, M.K. and Y.K.; validation, J.B., T.B. and I.K.; formal analysis, A.Z.; investigation, S.S.-P.; resources, T.B.; data curation, Y.K.; writing—original draft, O.P.; writing—review & editing, S.S.-P., T.K. and I.K.; visualisation, M.K.; supervision, G.P.; project administration, A.Z. All authors have read and agreed to the published version of the manuscript.
Funding
This research received no external funding.
Data Availability Statement
Not applicable.
Conflicts of Interest
The authors declare no conflict of interest.
References
- REN 21. Renewables 2022 Global Status Report. 2022. Available online: http://surl.li/cgkxs (accessed on 8 September 2022).
- IRENA. Renewable Technology Innovation Indicators: Mapping Progress in Costs, Patents, and Standards. 2022. Available online: http://surl.li/dumky (accessed on 14 September 2022).
- OECD. The Clean Energy Finance and Investment Policy Review of Indonesia. 2021. Available online: http://surl.li/dumlb (accessed on 14 September 2022).
- Owens, G. Economic & Financial Evaluation of Renewable Energy Projects. 2002. Available online: https://pdf.usaid.gov/pdf_docs/PNADB613.pdf (accessed on 20 September 2022).
- Artie, W.N.; Jatin, N.; Jingyan, F.; Hui, Z. Green financing for global energy sustainability: Prospecting transformational adaptation beyond Industry 4.0. Sustain. Sci. Pract. Policy 2021, 17, 377–390. [Google Scholar]
- Castrejon-Campos, O.; Aye, L.; Hui, F.; Vaz-Serra, P. Economic and environmental impacts of public investment in clean energy RD&D. Energy Policy 2022, 186, 113134. [Google Scholar] [CrossRef]
- Chen, H.; Shi, Y.; Zhao, X. Investment in renewable energy resources, sustainable financial inclusion and energy efficiency: A case of US economy. Resour. Policy 2022, 77, 102680. [Google Scholar] [CrossRef]
- Liu, F.; Feng, J.; Zhai, G.; Razzaq, A. Influence of fiscal decentralization and renewable energy investment on ecological sustainability in EU: What is the moderating role of institutional governance? Renew. Energy 2022, 200, 1265–1274. [Google Scholar] [CrossRef]
- Korauš, A.; Gombár, M.; Vagaská, A.; Šišulák, S.; Černák, F. Secondary energy sources and their optimization in the context of the tax gap on petrol and diesel. Energies 2021, 14, 4121. [Google Scholar] [CrossRef]
- Mihalcova, B.; Koraus, A.; Prokopenko, O.; Hvastova, J.; Frenákova, M.; Gallo, P.; Beata, B. Effective Management Tools for Solving the Problem of Poverty in Relation to Food Waste in Context of Integrated Management of Energy. Energies 2021, 14, 4245. [Google Scholar] [CrossRef]
- Prokopenko, O.; Toktosunova, C.; Sharsheeva, N.; Zablotska, R.; Mazurenko, V.; Halaz, L. Prospects for the Reorientation of Investment Flows for Sustainable Development under the Influence of the COVID-19 Pandemic. Probl. Ekorozw. 2021, 16, 7–17. [Google Scholar] [CrossRef]
- Shkola, V.; Prokopenko, O.; Stoyka, A.; Nersesov, V.; Sapiński, A. Green Project Assessment within the Advanced Innovative Development Concept. Estudios de Economia Aplicada. Stud. Appl. Econ. 2021, 39. [Google Scholar] [CrossRef]
- Shpak, N.; Kulyniak, I.; Gvozd, M.; Pyrog, O.; Sroka, W. Shadow economy and its impact on the public administration: Aspects of financial and economic security of the country’s industry. Adm. Manag. Public 2021, 2021, 81–101. [Google Scholar] [CrossRef]
- Wang, B.; Zhao, W. Interplay of renewable energy investment efficiency, shareholder control and green financial development in China. Renew. Energy 2022, 199, 192–203. [Google Scholar] [CrossRef]
- Zhang, Y. How Economic Performance of OECD economies influences through Green Finance and Renewable Energy Investment Resources? Resour. Policy 2022, 79, 102925. [Google Scholar] [CrossRef]
- Vodianka, L.; Antokhov, A.; Podluzhna, N.; Antokhova, I.; Saichuk, V.; Kobelia, Z. Influence of structural age shifts of population on sectoral structure of employment. Estudios de Economia Aplicada. Stud. Appl. Econ. 2021, 39. [Google Scholar] [CrossRef]
- Pimonenko, T.; Prokopenko, O.; Dado, J. Net zero house: EU experience in Ukrainian conditions. Int. J. Ecol. Econ. Stat. 2017, 38, 46–57. [Google Scholar]
- Prause, G. Smart Specialization and EU Eastern Innovation Cooperation: A Conceptual Approach. Balt. J. Eur. Stud. 2014, 4, 3–19. [Google Scholar] [CrossRef]
- Prause, G. Sustainable business models and structures for industry 4.0. J. Secur. Sustain. 2015, 5, 159–169. [Google Scholar] [CrossRef]
- Prause, G.; Atari, S. On sustainable production networks for Industry 4.0. J. Entrep. Sustain. Issues 2017, 4, 421–431. [Google Scholar] [CrossRef]
- Shpak, N.; Ohinok, S.; Kulyniak, I.; Sroka, W.; Fedun, Y.; Ginevičius, R.; Cygler, J. CO2 emissions and macroeconomic indicators: Analysis of the most polluted regions in the world. Energies 2022, 15, 2928. [Google Scholar] [CrossRef]
- Sotnyk, I.; Kurbatova, T.; Kubatko, O.; Prokopenko, O.; Prause, G.; Kovalenko, Y.; Trypolska, G.; Pysmenna, U. Energy Security Assessment of Emerging Economies under Global and Local Challenges. Energies 2021, 14, 5860. [Google Scholar] [CrossRef]
- Adamisin, P.; Kotulic, R.; Mura, L.; Kravcakova Vozarova, I.; Vavrek, R. Managerial approaches of environmental projects: An empirical study. Menedżerskie podejścia do projektów środowiskowych: Badanie empiryczne. Pol. J. Manag. Stud. 2018, 17, 27–38. [Google Scholar]
- Breus, S.; Bielialov, T.; Denysenko, M.; Zarichniak, A.; Al-Tmeizi, A. Strategic management of deployment of innovation projects at the enterprise. Acad. Strateg. Manag. J. 2019, 18, 1–5. Available online: https://www.abacademies.org/articles/strategic-management-of-deployment-of-innovation-projects-at-the-enterprise-8713.html (accessed on 20 September 2022).
- Kwilinski, A.; Ruzhytskyi, I.; Patlachuk, V.; Patlachuk, O.; Kaminska, B. Environmental taxes as a condition of business responsibility in the conditions of sustainable development. J. Leg. Ethical Regul. 2019, 22, 1–6. [Google Scholar]
- Malynovska, Y.; Bashynska, I.; Cichoń, D.; Malynovskyy, Y.; Sala, D. Enhancing the Activity of Employees of the Commu-nication Department of an Energy Sector Company. Energies 2022, 15, 4701. [Google Scholar] [CrossRef]
- Ahmed, Z.; Ahmad, M.; Murshed, M.; Shah, M.; Mahmood, H.; Abbas, S. How do green energy technology investments, technological innovation, and trade globalisation enhance green energy supply and stimulate environmental sustainability in the G7 countries? Gondwana Res. 2022, 112, 105–115. [Google Scholar] [CrossRef]
- Hailemariam, A.; Ivanovski, K.; Dzhumashev, R. Does R&D investment in renewable energy technologies reduce greenhouse gas emissions? Appl. Energy 2022, 327, 120056. [Google Scholar] [CrossRef]
- Zhang, D.; Mohsin, M.; Taghizadeh-Hesarycd, F. Does green finance counteract the climate change mitigation: Asymmetric effect of renewable energy investment and R&D. Energy Econ. 2022, 113, 106183. [Google Scholar] [CrossRef]
- OECD. Mobilising Private Investment in Clean Energy Infrastructure. 2015. Available online: http://surl.li/dvkfn (accessed on 7 October 2022).
- Das, K.C.; Deodhar, V.; Sharma, S.; Shrestha, D. Innovative Finance for Renewable Energy Solutions. 2015. Available online: https://energypedia.info/wiki/File:Innovative_Finance_For_Renewable_Energy_Solutions.pdf (accessed on 7 October 2022).
- Cedricka, B.; Long, W. Investment Motivation in Renewable Energy: A PPP Approach. Energy Procedia 2017, 115, 229–238. [Google Scholar] [CrossRef]
- Azhgaliyeva, D.; Beirne, J.; Mishra, R. What matters for private investment in renewable energy? Clim. Policy 2022. [Google Scholar] [CrossRef]
- Ragosa, G.; Warren, P. Unpacking the Determinants of Cross-Border Private Investment in Renewable Energy in Developing Countries. 2019. Available online: https://discovery.ucl.ac.uk/id/eprint/10092582/1/Accepted%20Manuscript.pdf (accessed on 20 October 2022).
- Peimani, H. Financial Barriers to Development of Renewable and Green Energy Projects in Asia. 2017. Available online: https://www.adb.org/sites/default/files/publication/445156/adbi-wp862.pdf (accessed on 20 October 2022).
- Kurbatova, T.; Khlyap, H. Economical mechanisms for renewable energy stimulation in Ukraine. Renew. Sustain. Energy Rev. 2014, 31, 486–491. [Google Scholar] [CrossRef]
- Kurbatova, T.; Sidortsov, R. Trash to Hryvnias: The economics of electricity generation from landfill gas in Ukraine. Int. J. Sustain. Energy Plan. 2022, 33, 53–64. [Google Scholar] [CrossRef]
- Johnston, M. 10 Biggest Renewable Energy Companies in the World. 2021. Available online: https://www.investopedia.com/investing/top-alternative-energy-companies/ (accessed on 25 October 2022).
- Orsted. Reports, Presentations, and Fact Sheets. 2021. Available online: http://surl.li/dupff (accessed on 25 October 2022).
- Iberdrola. Annual Reports. 2021. Available online: https://www.iberdrola.com/shareholders-investors/annual-reports/2019 (accessed on 25 October 2022).
- Jinko Solar. Annual Reports. 2021. Available online: https://ir.jinkosolar.com/financials/annual-reports (accessed on 2 November 2022).
- Vestas. Financial Reports. 2021. Available online: https://www.vestas.com/en/investor/reports-and-presentations/vestas-reporting (accessed on 2 November 2022).
- Siemens Gamesa Renewable Energy. Audited Annual Accounts. 2021. Available online: http://surl.li/dupfh (accessed on 2 November 2022).
- Brookfield Renewable Partners. Annual Reports. 2021. Available online: https://bep.brookfield.com/bep/reports-filings/annual-reports (accessed on 6 November 2022).
- First Solar. Annual Reports. 2021. Available online: https://investor.firstsolar.com/financials/annual-reports/default.aspx (accessed on 6 November 2022).
- Canadian Solar. Financial Reports. 2021. Available online: http://investors.canadiansolar.com/financial-reports (accessed on 6 November 2022).
- Renewable Energy Group. Annual Reports. 2021. Available online: https://www.annualreports.com/Company/renewable-energy-group (accessed on 6 November 2022).
- SunPower. Annual Reports. 2021. Available online: https://investors.sunpower.com/financial-information/annual-reports/ (accessed on 6 November 2022).
- Bielialov, T. Risk Management of Startups of Innovative Products. J. Risk Financ. Manag. 2022, 15, 202. [Google Scholar] [CrossRef]
- Marhasova, V.; Garafonova, O.; Popelo, O.; Tulchynska, S.; Pohrebniak, A.; Tkachenko, T. Environmentalization of Production as a Direction of Ensuring the Sustainability of Production Activities of Enterprises and Increasing Their Economic Security. Int. J. Saf. Secur. Eng. 2022, 12, 159–166. [Google Scholar] [CrossRef]
- Oklander, M.; Yashkina, O.; Yashkin, D. Minimization of transportation risks in logistics by choosing a cargo delivery route with the minimal projected number of road accidents. East.-Eur. J. Enterp. Technol. 2019, 5, 57–69. [Google Scholar] [CrossRef]
- Pinchuk, A.; Tkalenko, N.; Marhasova, V. Implementation of circular economy elements in the mining regions. E3S Web Conf. 2019, 105, 04048. [Google Scholar] [CrossRef]
- Polzina, F.; Eglib, F.; Steffen, B.; Schmidt, T. How do policies mobilize private finance for renewable energy?—A systematic review with an investor perspective. Appl. Energy 2019, 15, 1249–1268. [Google Scholar] [CrossRef]
- Rausser, G.; Papineau, M. Managing R&D Risk in Renewable Energy. 2008. Available online: http://surl.li/eeqid (accessed on 6 November 2022).
- Sysoyeva, L.; Bielova, I.; Ryabushka, L.; Demikhov, O. Determinants of management of central bank to provide the economic growth: An application of structural equation modeling. Estudios de Economia Aplicada. Stud. Appl. Econ. 2021, 39. [Google Scholar] [CrossRef]
Disclaimer/Publisher’s Note: The statements, opinions and data contained in all publications are solely those of the individual author(s) and contributor(s) and not of MDPI and/or the editor(s). MDPI and/or the editor(s) disclaim responsibility for any injury to people or property resulting from any ideas, methods, instructions or products referred to in the content. |
© 2023 by the authors. Licensee MDPI, Basel, Switzerland. This article is an open access article distributed under the terms and conditions of the Creative Commons Attribution (CC BY) license (https://creativecommons.org/licenses/by/4.0/).

