Abstract
The use of nuclear energy is inevitable to reduce the dependence on fossil fuels in the energy sector. High-temperature gas-cooled reactors (HTGRs) are considered as a system suitable for the purpose of reducing the use of fossil fuels. Furthermore, eco-friendly mass production of hydrogen is crucial because hydrogen is emerging as a next-generation energy carrier. The unit cost of hydrogen production by the levelized cost of energy (LCOE) method varies widely depending on the energy source and system configuration. In this study, energy, exergy, and thermoeconomic analyses were performed on the hydrogen production system using the HTGR and high-temperature water-cooled nuclear reactor (HTWR) to calculate reasonable unit cost of the hydrogen produced using a thermoeconomic method called modified production structure analysis (MOPSA). A flowsheet analysis was performed to confirm the energy conservation in each component. The electricity generated from the 600 MW HTGR system was used to produce 1.28 kmol/s of hydrogen by electrolysis to split hot water vapor. Meanwhile, 515 MW of heat from the 600 MW HTWR was used to produce 8.10 kmol/s of hydrogen through steam reforming, and 83.6 MW of electricity produced by the steam turbine was used for grid power. The estimated unit cost of hydrogen from HTGR is approximately USD 35.6/GJ with an initial investment cost of USD 2.6 billion. If the unit cost of natural gas is USD 10/GJ, and the carbon tax is USD 0.08/kg of carbon dioxide, the unit cost of hydrogen produced from HTWR is approximately USD 13.92/GJ with initial investment of USD 2.32 billion. The unit cost of the hydrogen produced in the scaled-down plant was also considered.
1. Introduction
The accelerated use of fossil fuels for economic development not only leads to their depletion but also severely affects the environment. The use of nuclear energy [1,2,3] is inevitable to reduce the dependence on fossil fuels in the energy sector. Jaszczur et al. [1] examined sulfur–iodine (S-I) and copper–chlorine (Cu-Cl) cycles using high-temperature Onuclear reactors. A four-step Cu-Cl cycle was used to produce hydrogen using a supercritical water-cooled reactor [2]. Milewski et al. [3] investigate two types of high temperature electrolyzers for hydrogen production using nuclear power plants. The high-temperature gas-cooled reactor (HTGR), which is the basis of small modular reactors (SMR) that requires a special design for the reaction core [4], is evaluated as a suitable system for the purpose of reducing the use of fossil fuel [5,6]. The reactor’s inert gas cooling and heat-resistant structure enable it to reach core exit temperatures of up to 950 °C [5] compared to other predictable reactors.
The HTGR is well suited for numerous thermal process applications [1]. One of these is the mass production of hydrogen using electricity and heat obtained from the HTGR. The reason why eco-friendly mass production of hydrogen is crucial is because hydrogen is emerging as a next-generation energy carrier. Hydrogen can be used in various approaches, including stationary power generation using fuel cells and transportation power devices such as automobiles.
Based on the conceptual design of the hydrogen production system by steam reforming of methane gas [7,8,9] or water decomposition by high temperature electrolysis [9] with HTGR, exergetic and thermoeconomic analyses of hydrogen production systems have been reported. Kim et al. [10] used the steam reforming of methane gas to produce hydrogen using heat from high-temperature nuclear power plants cooled with helium gas (HTGR) or water (HTWR). In the HTGR, 217.6 MW of electricity from the Brayton cycle was connected to the grid system, and 83.7 MW of heat was used to produce 1.12 kmol of hydrogen. However, in the HTWR, 502 MW of heat produced 10.0 kg/s of hydrogen, and 83.6 MW of power from the steam turbine was connected to the grid system. The unit costs of hydrogen produced by the HTGR and HTWR were USD 0.81/kg and USD 0.73/kg, respectively. The initial investment costs used in their study were USD 1642 million (USD 2740/kW) for an HTGR plant and USD 1478 million (USD 2460/kW) for an HTWR plant, with a uranium fuel cost of 2.33 USD/GJ. Bolden [9] performed an exergy analysis on an HTGR system that used electricity from a Brayton cycle to decompose water to produce hydrogen. They calculated the amount of exergy and cost flows at each state point.
Water electrolysis using renewable energy sources (RESs) with low carbon footprint, such as solar [11,12,13] and wind [14], is considered to be a sustainable hydrogen production method. However, the unit cost of renewable-based hydrogen production is inevitably high because of substantial capital expenditure. In terms of low cost and carbon footprint, methane pyrolysis through carbon capture and storage has been reported to have one of the lowest levelized costs of hydrogen (LCOH) at USD 2.01/kg [15]. Recent studies using life cycle assessment methods have shown that high-temperature electrolysis is cleaner than the S-I cycle [16].
Recently, Lee et al. [17] reported that 300 MW of electricity and 68 MW of heat were input to produce hydrogen at a rate of 2.33 kg/s in a solid oxide electrolytic cell using an HTGR system: the calculated unit cost of hydrogen was approximately USD 5.0/kg, which is similar to the LCOH of USD4.95/kg obtained by Al-Qahtani et al. [15]. The initial investment cost of HTGR covered by Lee et al. [16] was approximately USD 1120 million. However, Wang et al. [18] and Ozbilen et al. [19] used various reactor systems to obtain a more economical LCOH. The unit cost of hydrogen production by the levelized cost of energy (LCOE) method varies widely depending on the energy source. For nuclear energy, the unit cost of hydrogen ranges from USD 2.18/kg to USD 5.46/kg [12].
Exergy analysis [20,21] enables estimation of the lost work rate in each component of a thermal system, while the thermoeconomic analysis provides a tool to properly estimate the unit cost of system’s products. Modified production structure analysis (MOPSA) [22] combines exergy and thermoeconomic analyzes to calculate the production cost of each component and the lost cost flow due to entropy production rate [22]. In MOPSA, the entropy generation rate was calculated from the second law of thermodynamics.
In this study the high-temperature water electrolysis method proposed by the Idaho Research Institute in the United States [5] and the steam reforming method of methane gas in a water-cooled reactor proposed by the Electric Power Research Institute [8] were used as models for hydrogen production. Assuming the states at the inlet and outlet of each device of the configured system, the state was confirmed through the first law of thermodynamics and exergy analysis. Finally, a thermoeconomics analysis using MOPSA was performed using the input and output conditions of each of these devices to obtain a more reasonable unit cost of hydrogen than that of the LCOE method. The unit cost of hydrogen produced by electrolysis with an HTGR is approximately USD 4.27/kg, whereas the unit cost of hydrogen produced by steam reforming with an HTWR is approximately USD 1.67/kg. Detailed exergetic and thermoeconomic analyses using MOPSA provide a reliable unit cost of hydrogen for the system depending on the initial investments and fuel cost.
This paper is organized as follows. A description of HTGR and HTWR systems is in Section 2 where steam decomposition and steam reforming reactions are also discussed.
Section 3 and Section 4 deal with the general exergy-balance equation and the exergy cost-balance equation, respectively, which constitute the basic equations of the MOPSA method. Therefore, the exergy balance equation for each component and the corresponding exergy cost balance equation are formulated in these sections. Section 5 presents calculation results and discussions, and Section 6 concludes.
2. System Description
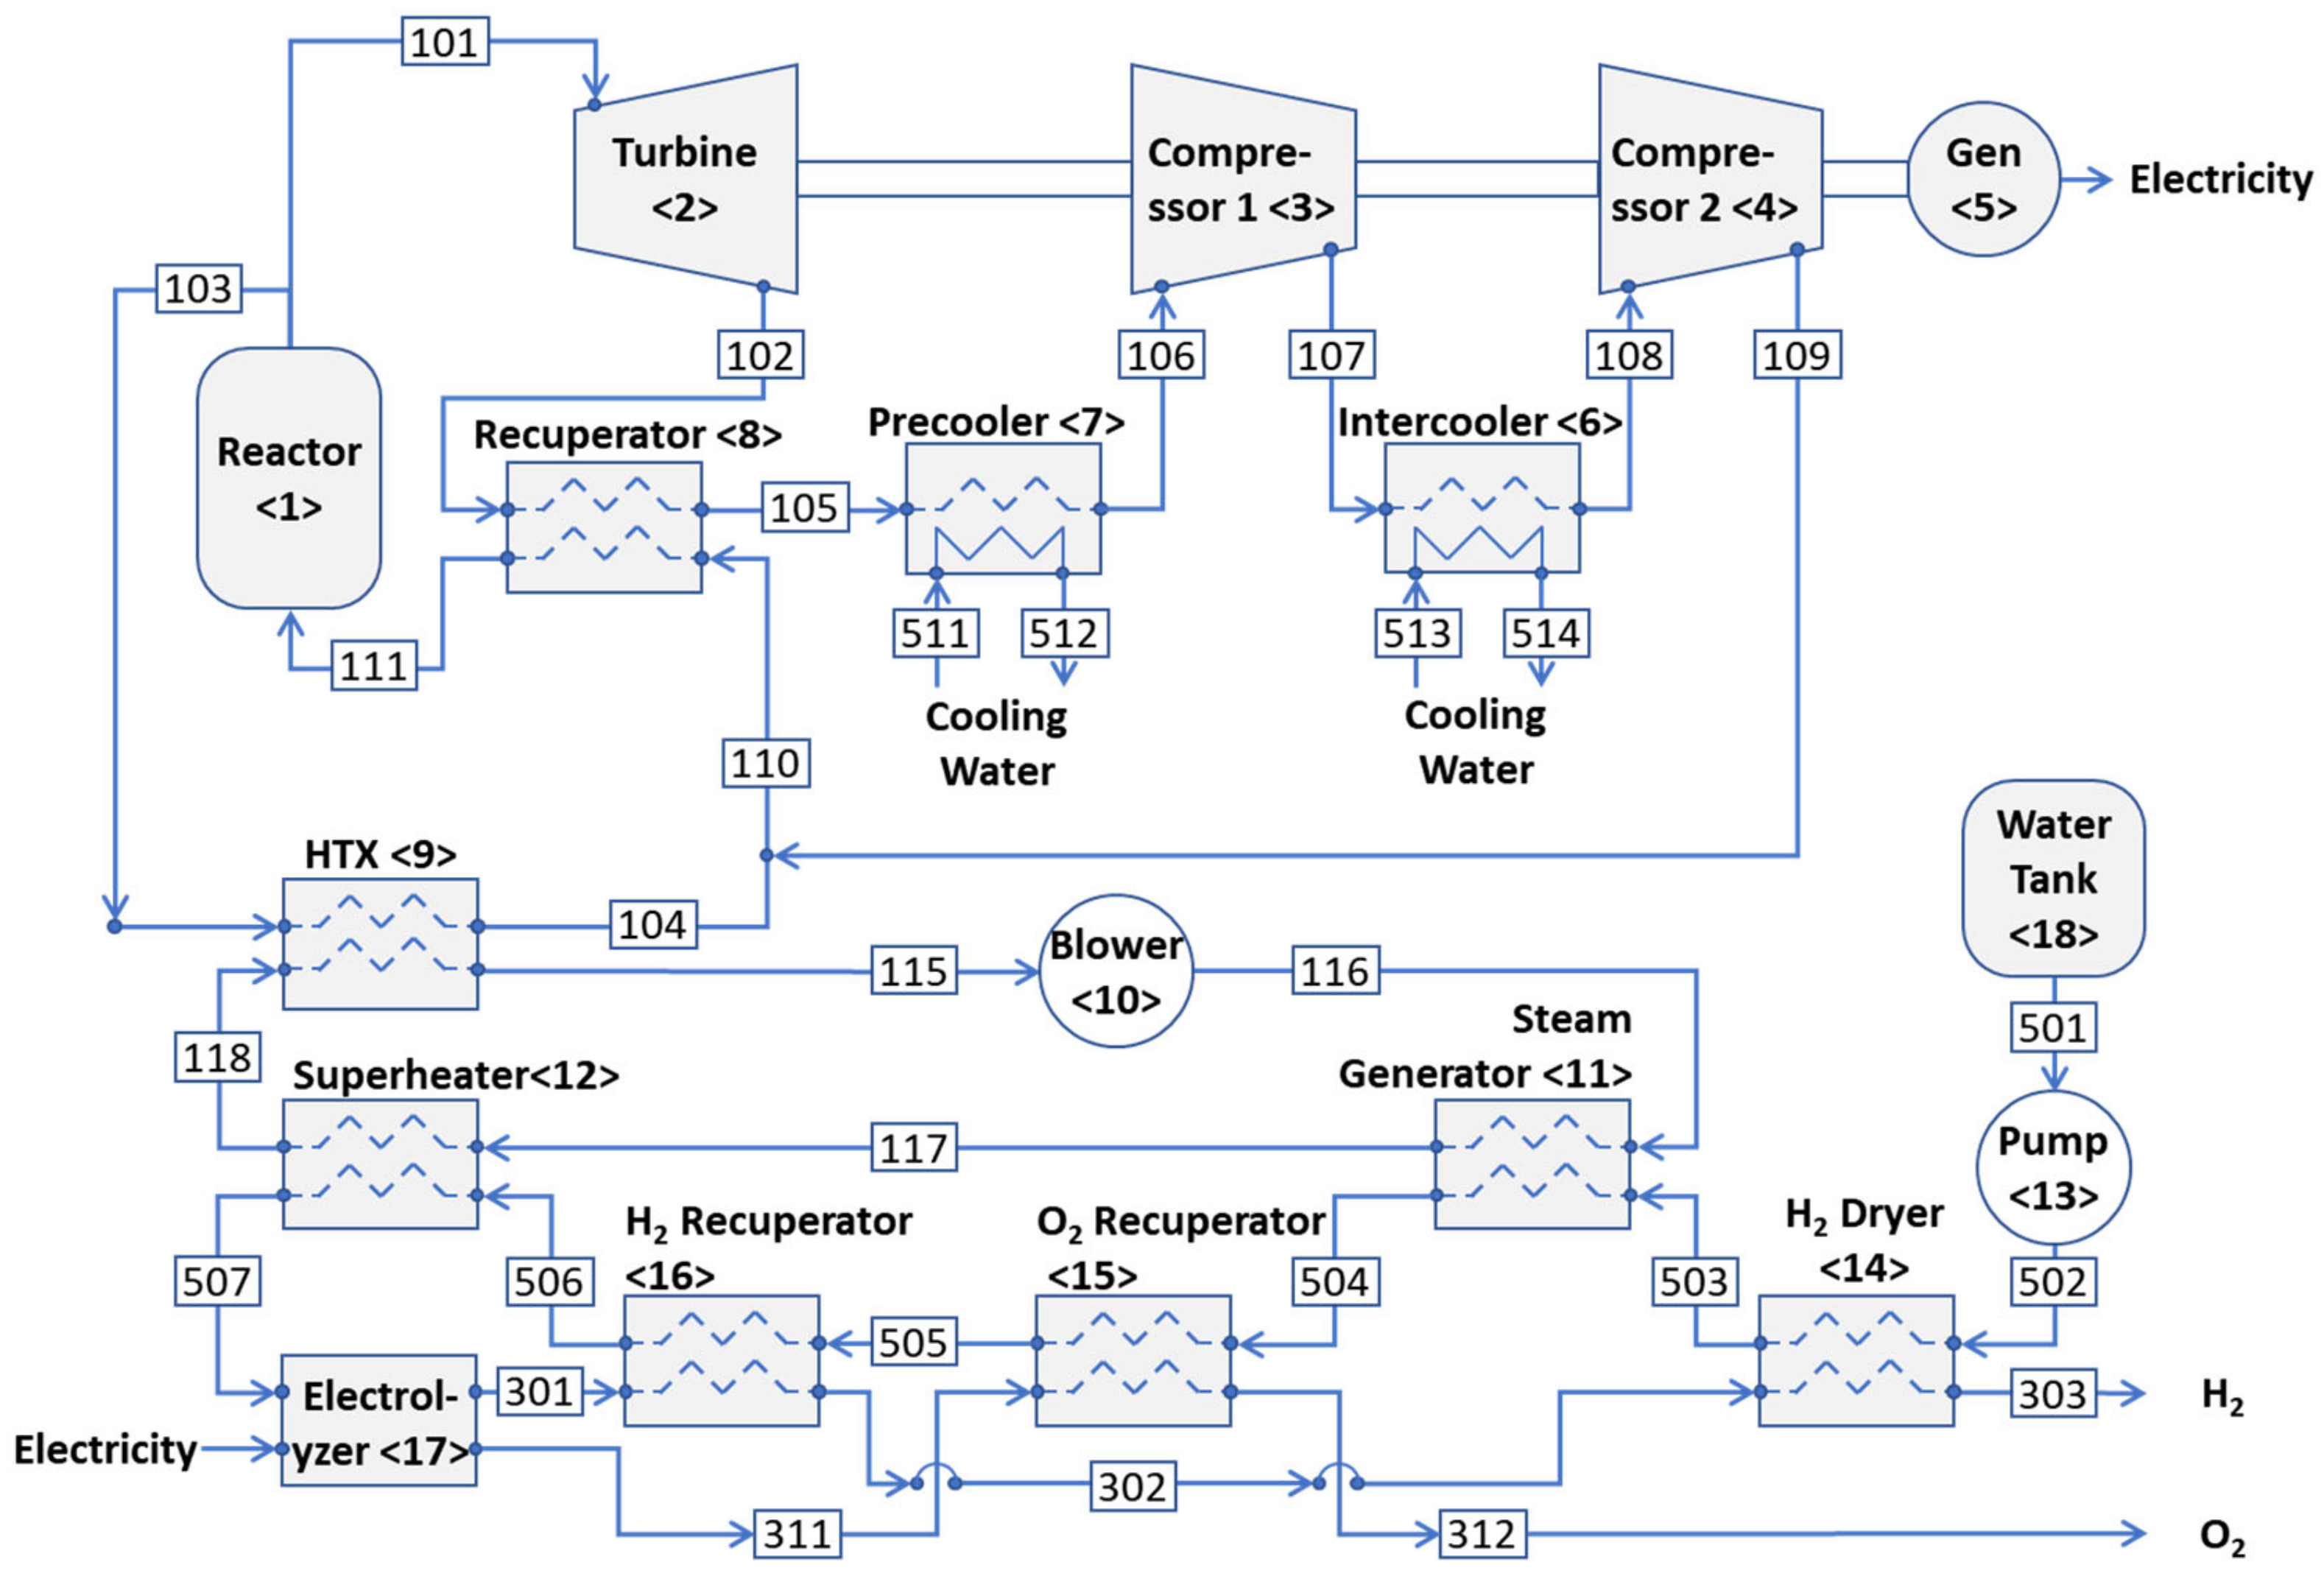
2.1. HTGR with the Brayton Cycle
In the case shown in Figure 1, the reactor is cooled with helium gas whose exit temperature from the reactor core is 850 °C, and its mass flow rate is 320 kg/s. A portion of the helium gas steam (278 kg/s) drives the turbine <2> and heats the helium gas, which returned to the recuperator <8>. The helium gas was cooled by a water flow in the pre-cooler <7> before entering the compressor <3>. The helium gas was cooled again by another water stream in the intercooler <6> before entering the compressor <4>. The pressure drop that occurs in the turbine is recovered by compressors <3> and <4>. The helium gas from compressor <4> mixes with the helium gas from heat exchanger <9> and returns to the reactor.
Figure 1.
Schematic of a hydrogen production plant with the gas turbine (GT)-high-temperature gas-cooled reactor (HTGR) system. GEN: Generator, HTX: Heat exchanger.
Heat exchanger <9> provides heat for converting water to water vapor through a secondary loop of helium gas circulated by blower <10>. The water from the water tank is pressurized by the pump <13>, converted into steam in the steam generator <11>, and heated in the oxygen recuperator <15> and the hydrogen recuperator <16>. Subsequently, the water vapor heated again in the recuperator <12> enters the electrolytic cell <17>. In the electrolyzer <17>, water vapor is decomposed by electrical energy supplied from the generator <5>.
The chemical formula for steam electrolysis is:
For this process to occur, 241,826 kJ of energy, which is the lower heating value of water, is required. The amount of water vapor that can be electrolyzed is determined by the following law of energy conservation for the electrolyzer:
Considering a certain amount of heat loss in the electrolyzer, the value given in Equation (2) must be negative and the amount of water vapor decomposed in the electrolyzer can be determined using this equation.
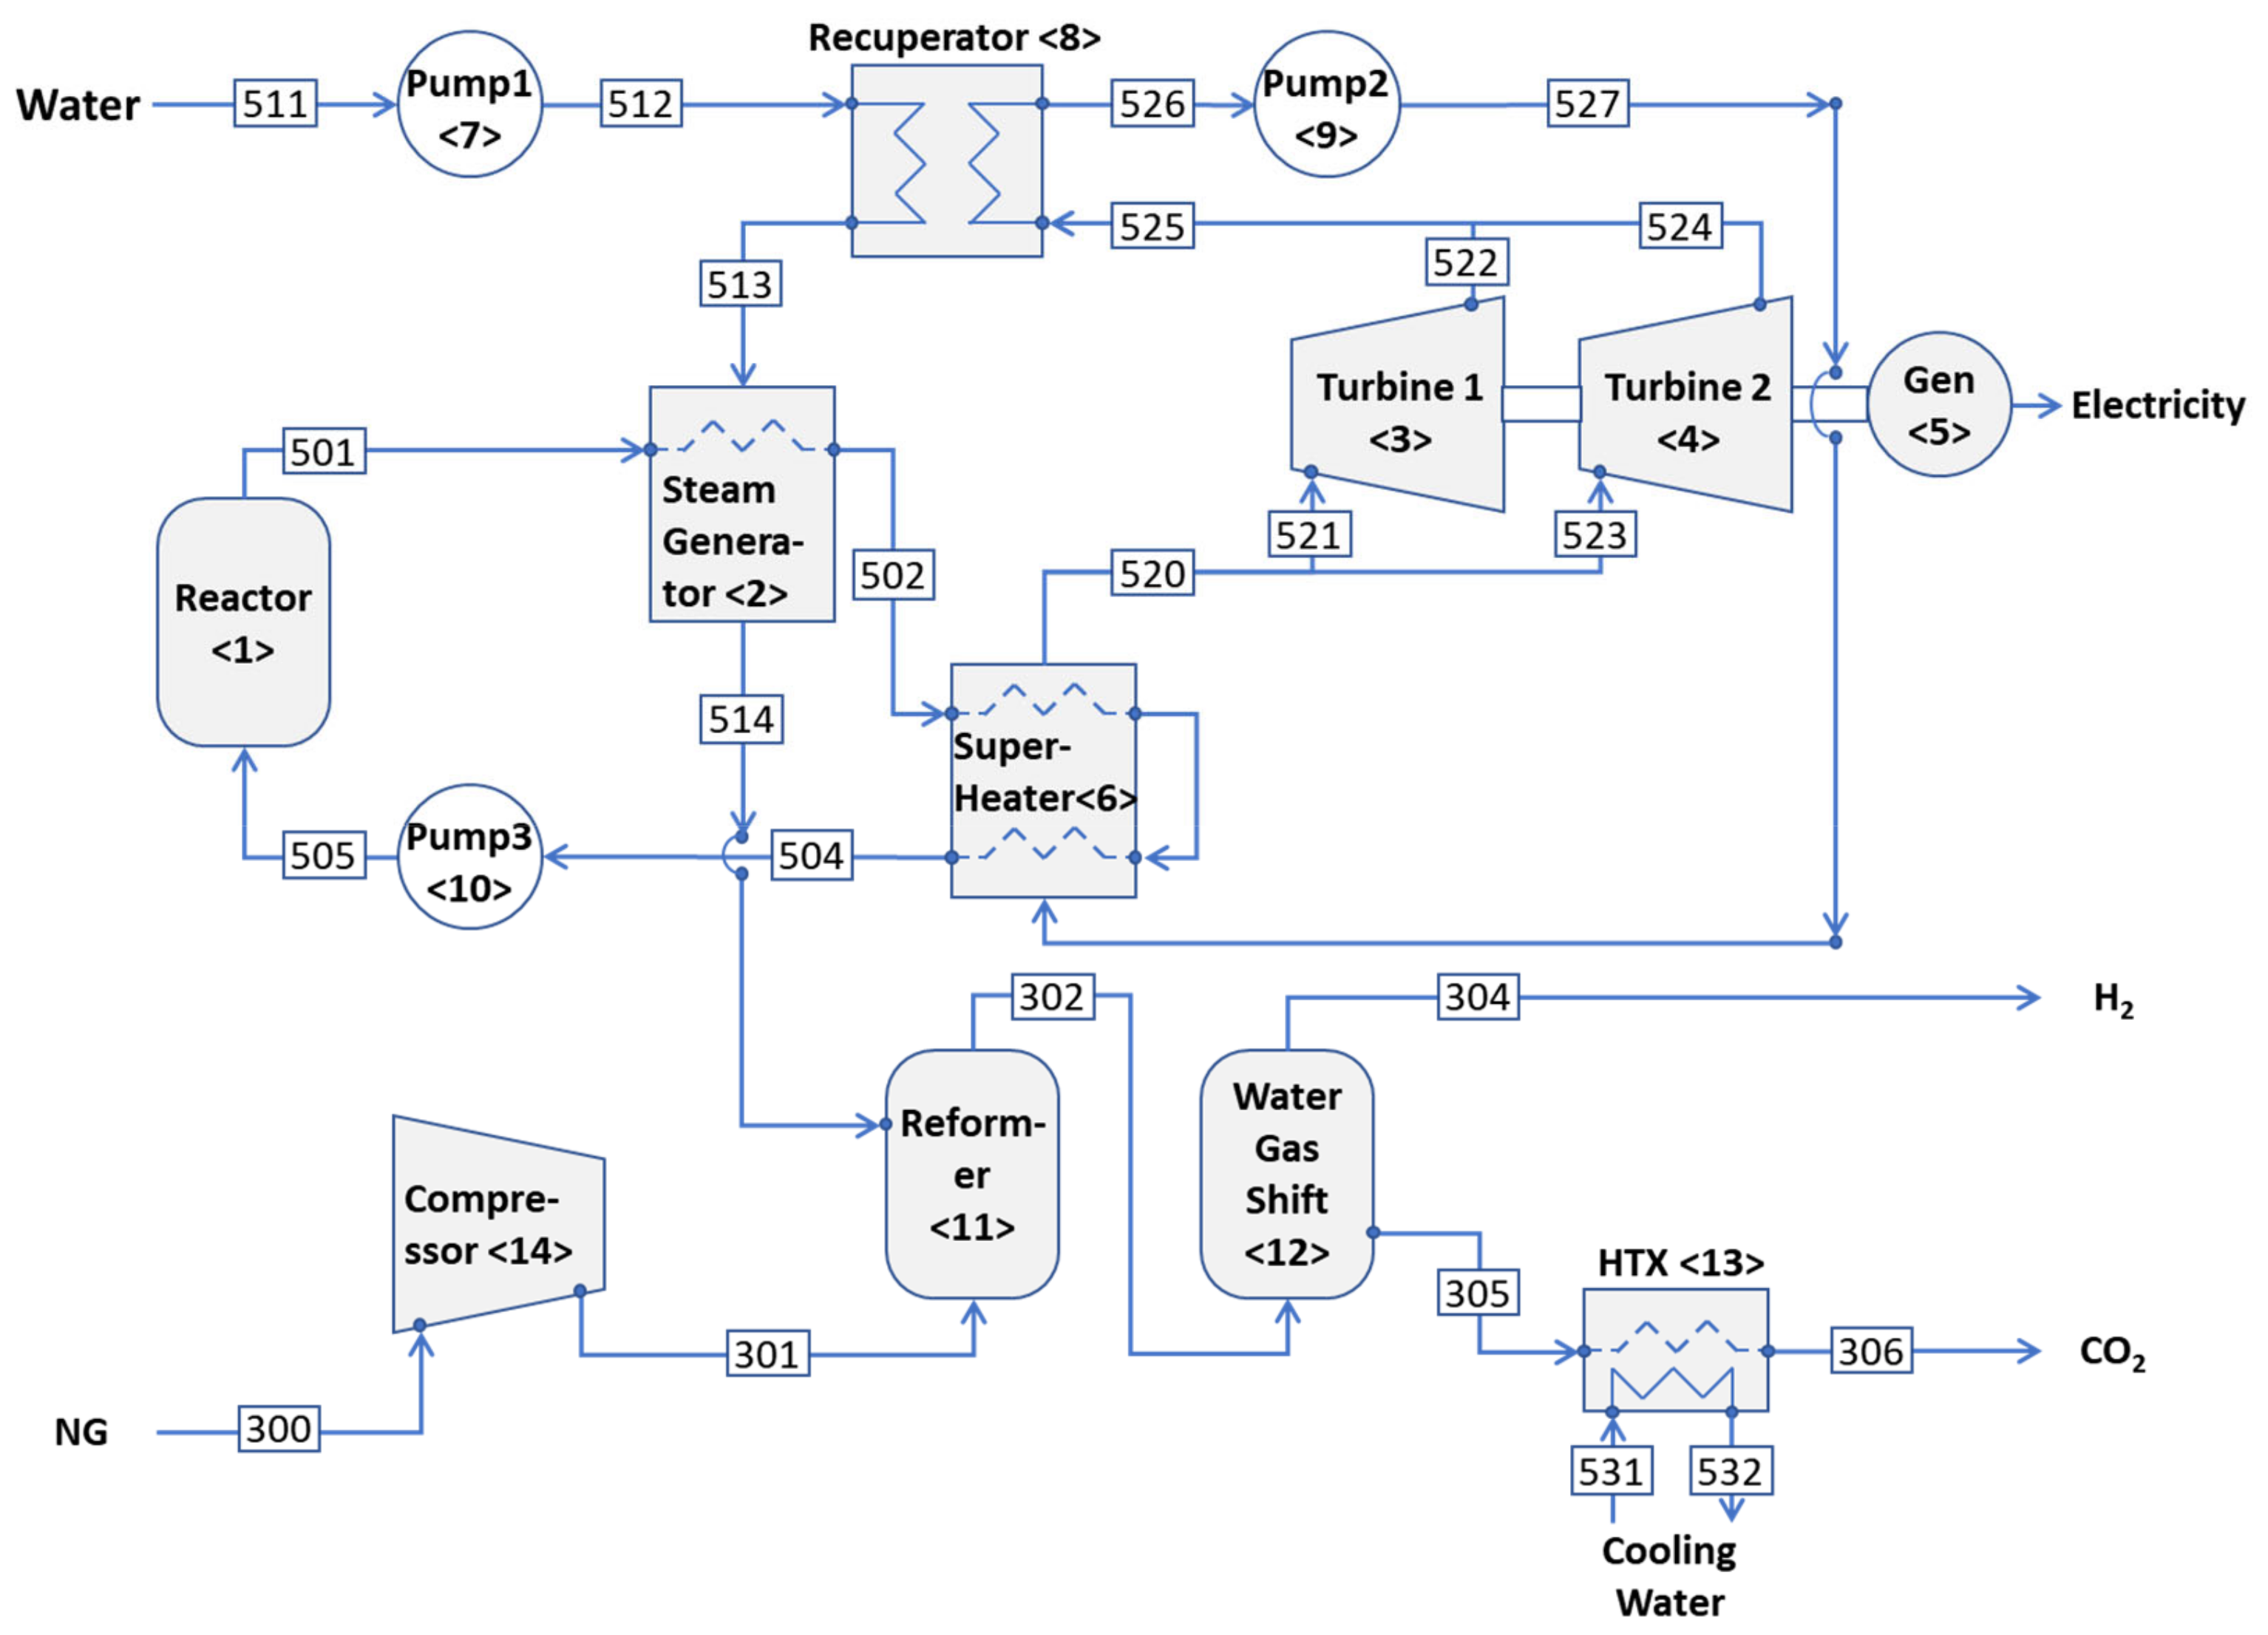
2.2. HTWR with Steam Reforming
To convert the reactor energy into heat energy, it is recommended to cool the reactor with water. As shown in Figure 2, the HTWR system contains three water streams. The primary water steam from reactor <1> passes through steam generator <2> and exchanges heat with the secondary water stream heated in recuperator <8>. The secondary water stream from the pump 1 <7> passes through the steam generator and becomes hot steam before entering reformer <17>. Meanwhile the third water stream converted to steam in the superheater <6> by the first water stream operates turbines <3> and <4> and enters the recuperator <8> to transfer heat to the second water stream. Steam flows into reformer <11> and is mixed with methane gas introduced from compressor <14> to reform the methane gas. The CO2 gas stream from the water–gas shift reactor <13> was cooled by a water stream. The reforming reaction of methane can be written as [23]:
Figure 2.
Schematic of a hydrogen production plant with the ST-HTGR system.
The reactions in Equations (3) and (4) are endothermic: therefore, the heat required for the reforming process is supplied by the inflow of high-temperature steam. Since the natural gas entering the reformer is composed of CH4, C2H6, C3H8, C4H10, etc., the reaction equation should be written considering these components. The overall reaction between hydrocarbons and steam in the reformer when the reaction in Equation (3) occurs f times and the reaction in Equation (4) occurs (l–f) times is presented below [24]. The smaller the value of f, the more heat the reforming reaction uses because the reaction given in Equation (3) occurs.
In Equation (5), the molar flow rate of carbon and the hydrogen atomic weights of the hydrocarbons including methane are given as follows:
In Equation (5), nw is the number of moles of steam introduced into the reformer and ηCR is the reformer efficiency. As shown in Equation (5), the number of moles of water vapor entering the reformer must be greater than (1 + f) nαt. The enthalpy of the combustion for the reforming reaction is given by:
where LHV_RFOM in Equation (8) is given as follows:
As the chemical reactions in the reformer are endothermic, LHV_RFOM has a positive value. The molar flow rate of hydrocarbons, including methane, into the reformer is determined by the law of energy conservation. Considering the heat loss in the reformer, the values in Equation (10) must be negative.
Reformed gases, such as water vapor from the reformer, enter the water–gas shift reactor and react with the carbon monoxide (CO) generated in the reformer from CO2 and H2 gas. The chemical reaction is given as:
Therefore, the chemical reaction equation in the water–gas shift reactor can be written as:
where p is the molar flow rate of CO gas due to incomplete combustion. The enthalpy of combustion for the reaction given in Equation (12) is expressed as:
where LHV_WGS is the amount of heat released in the WGS reaction.
The first law of thermodynamics in a water–gas shift reactor is given by:
Considering heat loss in the water–gas shift reactor, Equation (15) should be negative.
3. Exergy Analysis of HTGR/HTWR Systems
3.1. Mass and Energy Conservation, and the Exergy-Balance Equation
For each device, the following mass and energy conservation equations are satisfied.
Mass conservation:
Energy conservation:
In Equation (17), , where h is the enthalpy per mass, is the heat transfer rate, and is the work rate.
From the first and second laws of thermodynamics, the following exergy balance equations for the flow of materials flowing in and out of each device were derived [20].
where the superscripts CHE and W represent the chemical and work exergies, respectively, and the superscripts T and P represent the thermal exergy and mechanical exergy, respectively. The fourth term from the left is a negative value for the lost work rate owing to entropy generation. The lost work rate, , is given as [25]:
The exergy flow is expressed as:
The exergy per unit mass () can be expressed by dividing it into thermal exergy related to the temperature of the material flow and mechanical exergy related to the pressure as follows [26]:
The exergy for the material flow can be defined as follows based on the reference temperature (Tref) and reference pressure (Pref):
In general, the exergy per unit mass given in Equation (22) can be described as follows based on the environmental temperature and pressure when the kinetic energy and potential energy of the material flow are ignored:
The thermal exergy and mechanical exergies expressed in Equation (21) can be defined as:
The reference temperatures and reference pressures used in Equations (24) and (25) represent the ambient temperature and pressure, respectively.
3.2. Exergy-Balance Equations for the HTGR System
Applying the exergy balance expressed in Equation (18) for each device in the HTGR system yields the following exergy-balance equation: In Ex,abc, which represents the flow of exergy entering and exiting each device, the subscript abc is expressed as a number and a indicates the type of material. Specifically, 1 represents the flow of helium gas, 3 represents oxygen or hydrogen gas, and 5 represents water flow. Among the numbers, bc represents the number of entrances and exits of each device.
- 1.
- Reactor <1>:
- 2.
- Gas Turbine <2>:
- 3.
- Compressor 1 <3>:
- 4.
- Compressor 2 <4>:
- 5.
- Generator <5>:
In Equation (30), the first term is the work produced by the turbine plus the work supplied to compressors <1> and <2>, or the work entering the generator; the second term is the work lost in the generator; and the third term is the electricity produced by the generator.
- 6.
- Intercooler <6>:
- 7.
- Precooler <7>:
- 8.
- Recuperator <8>:
- 9.
- Heat exchanger <9>:
- 10.
- Blower <10>:
- 11.
- Steam generator <11>:
In Equation (36), the superscripts DT and DP denote the thermal and mechanical exergies of the water or steam flow, respectively.
- 12.
- Superheater <12>:
- 13.
- Pump <13>:
- 14.
- Hydrogen dryer <14>:
- 15.
- Oxygen recuperator <15>:
- 16.
- Hydrogen recuperator <16>:
- 17.
- Electrolyzer <17>:
3.3. Exergy-Balance Equations for the HTWR System
In the case of an HTGR, if the exergy-balance equation given in Equation (18) is used to establish the exergy-balance equation for each component of the HTWR, it is as follows:
- 1.
- Reactor <1>:
- 2.
- Steam generator <2>:
- 3.
- Turbine 1<3>:
- 4.
- Turbine 2 <4>:
Notably, turbine 2 receives relatively less steam than that of turbine 1.
- 5.
- Generator <5>:
In Equation (47), the first term is the work produced by the turbines <3> and <4>, the second term is the work lost by the generator, and the third term is the electricity produced by the generator.
- 6.
- Superheater <6>:
- 7.
- Pump 1 <7>:
- 8.
- Recuperator <8>:
- 9.
- Pump 2 <9>:
- 10.
- Pump 3 <10>:
- 11.
- Reformer <11>:
- 12.
- Water–gas shift reactor <12>:
- 13.
- Heat exchanger <13>:
- 14.
- Compressor <14>:
The electricity required for the pumps and compressors is produced by the generator. The pressure of the gas exiting the compressor must be equal to the pressure of the steam entering the reformer.
4. Thermoeconomic Analysis of HTGR/HTWR Systems
4.1. Exergy Cost-Balance Equations
Modified Productive Structure Analysis (MOPSA) [22], a thermoeconomics method assigns different unit costs according to the exergy types to the exergy-balance equation given in Equation (18) to obtain the exergy cost-balance equation. To rephrase, if CO is assigned to the unit cost of fuel, CT to the unit cost of thermal exergy, CP to the unit cost of mechanical exergy, CS to the unit cost of lost work, and CW to the unit cost of work or electricity, the following general exergy cost-balance equation can be obtained from Equation (18):
where is the flow of capital cost per unit time including the initial purchase cost and operating cost of the i-th device and can be obtained using the following equation [27]
where and are the maintenance factor and the annual operating hours, respectively. In contrast, is the initial purchase cost of the equipment converted into an annual equivalent cost and is given as follows:
where Ci is the initial purchase cost of the equipment, SV is the depreciation cost after n years of equipment life, and PWF and CRF are the present worth factor and capital recovery factors, respectively.
The equations obtained by applying the exergy cost-balance equation given in Equation (57) for each device in the HTGR system shown in Figure 1 are as follows: A new unit cost may be assigned to the unit cost of a product that represents the characteristics of the device. For example, gas turbine <1> is a device that produces power; therefore, a new unit cost of work is given to the power term C2W and is expressed in Gothic font. The number 2 in this expression represents the number of the device.
4.2. Exergy Cost-Balance Equations for the HTGR System
- 1.
- Reactor <1>:
Superscript UR of the first term in Equation (60) is the unit cost of uranium.
- 2.
- Gas Turbine <2>:
- 3.
- Compressor 1 <3>:
- 4.
- Compressor 2 <4>:
- 5.
- Generator <5>:
- 6.
- Intercooler <6>:
- 7.
- Precooler <7>:
- 8.
- Recuperator <8>:
- 9.
- Heat exchanger <9>:
- 10.
- Blower <10>:
- 11.
- Steam generator <11>:
- 12.
- Superheater <12>:
- 13.
- Pump <13>:
- 14.
- Hydrogen dryer <14>:
- 15.
- Oxygen recuperator <15>:
- 16.
- Hydrogen recuperator <16>:
- 17.
- Electrolyzer <17>:
In Equation (76), and are the molar flow rate of hydrogen and the energy per kmol of hydrogen, respectively.
As shown above, 17 cost-balance equations were obtained from the 17 components. However, the unknowns shown in the cost-balance equation described above are C1T, C2W, C3P, C4P, C5E, C6T, C7T, C8T, C9T, C10P, C11DT, C12DT, C13DP, C14DT, C15DT, C16DT, C17H2, CT, CP, CDT, CDP, CW, and CS. As there were twenty-three unknowns, six additional auxiliary equations were required to determine them. Six additional equations can be obtained for the thermal and mechanical exergy junctions for helium flow, thermal and mechanical exergy junctions for water flow, work exergy junction, and boundary condition, which are as follows:
Thermal exergy junction for helium flow:
Mechanical exergy junction for helium flow:
Thermal exergy junction for water flow:
Mechanical exergy junction for water flow:
Work exergy junction:
System boundary:
4.3. Exergy Cost-Balance Equations for the HTWR System
In the case of the HTGR, the equations obtained by applying the exergy cost-balance equation given in Equation (53) for each device of the HTWR in Figure 2 are as follows:
- 1.
- Reactor <1>:
- 2.
- Steam generator <2>:
- 3.
- Turbine 1 <3>:
- 4.
- Turbine 2 <4>:
- 5.
- Generator <5>:
- 6.
- Superheater <6>:
- 7.
- Pump 1 <7>:
- 8.
- Recuperator <8>:
- 9.
- Pump 2 <9>:
- 10.
- Pump 3 <10>:
- 11.
- Reformer <11>:
- 12.
- Water-gas shift reactor <12>:
In Equation (94), and are the mass flow rate of CO2 gas and the carbon tax imposed per kg of CO2 gas, respectively.
Heat exchanger <13>:
- 14.
- Compressor <14>:
As shown above, 14 cost-balance equations were obtained from the 14 components. However, the unknowns shown in the cost-balance equations described above are C1DT, C2DT, C3W, C4W, C5E, C6DT, C7DP, C8DT, C9DP, C10DP, C11H2, C12T, C13T, C14P, CT, CP, CDT, CDP, CW, and CS, which are 20 unknowns. Therefore, six additional auxiliary equations are required to determine the unknowns. Six additional equations can be obtained for the thermal and mechanical exergy junctions for water flow, thermal and mechanical exergy junctions for gas flow, work exergy junction, and boundary conditions, which are as follows:
Thermal exergy junction for water flow:
Mechanical exergy junction for water flow:
Thermal exergy junction for gas flow:
Mechanical exergy junction for gas flow:
Work exergy junction:
System boundary:
5. Results and Discussion
5.1. HTGR System
Table 1 shows the enthalpy, entropy, and exergy flow rates calculated using thermodynamic properties, such as the molar flow rate (kmol/s), temperature, and pressure, at the state points of the HTGR system. The preliminary design of the HTGR system at the Idaho Nuclear Research Laboratory [5] was referenced to determine the temperature and pressure at the critical state points. The flow rate of the working fluid was determined by trial and error to establish an energy conservation law for each device. The helium gas at 850 °C and 278 kg/s from the reactor enters the turbine <2> to produce work, and the helium at 40 kg/s enters the heat exchanger <9> and supplies heat to the gas circulating in the secondary helium loop whose mass flow rate is 23.0 kg/s. The molar flow rate of the water vapor entering the state point 527 was 1.28 kmol/s. The costs of the materials consumed in the HTGR and HTWR systems were assumed to be USD 3.5/GJ for uranium and USD 10.0/GJ for natural gas.
Table 1.
Estimation of hydrogen production cost using a small modular reactor (SMR) (Reference [13]).
If the gas temperature of helium exiting the nuclear reactor is 950 °C, the turbine can produce more electricity and the temperature of the steam entering the electrolyzer can be slightly higher, such that additional water vapor can be electrolyzed. However, even if the temperature of the water exiting the reactor is lowered and the temperature of the steam entering the electrolytic cell is lowered, this is not a significant problem. This is because the amount of water decomposed in the electrolytic cell is primarily determined by the amount of electricity supplied.
Table 2 shows the enthalpy, entropy, and exergy flow rates calculated using thermodynamic properties such as the molar flow rates, temperature and pressure at the state points of the HTGR system. Table 3 shows energy conservation figures for each device in the HTGR system. To rephrase, the amount of heat introduced into each device is the sum of the enthalpy flow out of the device, the enthalpy flow into the device, and the work performed by the device. In particular, in electrolyzer <17>, the amount of water vapor introduced into the device is determined by the amount of electricity input from the generator. From Table 2, the mass flow rate of water vapor entering the electrolyzer is approximately 23 kg/s, producing 1.277 kmol of hydrogen and 0.64 kmol of oxygen per second.
Table 2.
Property values and enthalpy, entropy, and exergy flow rates at various state points in the GT-HTGR system.
Table 3.
Energy balance for each component in the GT-HTGR system shown in Figure 1.
Table 4 lists the exergy flow of each component. The sum of the exergy flows for each component was zero, indicating that the exergy-balance equation was satisfied. From Table 4, turbine <2> produces 460.2 MW of work. Of this, 118.8 MW is supplied to compressor 1 <3> and 110.5 MW is supplied to compressor 2 <4>. The remainder of the work input into the generator produces electricity. Assuming that the efficiency of the generator is 95%, it supplies approximately 219 MW of electricity to the electrolyzer. It was assumed that the isentropic efficiency of the turbine was 85% and that the isentropic efficiency of the compressor was 84–85%. However, in the electrolyzer, 265 MW of energy is required to decompose 1.277 kmol of water vapor (state point 507) into hydrogen and oxygen. Therefore, the remaining energy, except for the electric energy input into the electrolyzer should be obtained from incoming water vapor. As shown in Table 2, this energy is approximately 54 MW, which is the difference between the enthalpy of the gas flowing into the electrolyzer and that of the gas flowing out. From these calculations, the temperature of the water vapor entering the electrolyzer does not significantly affect the electrolysis of water.
Table 4.
Exergy balance for each component in the HTGR system.
Table 5 lists the initial investment costs and cost flows per unit rate for each component in the HTGR system. Assuming that the total initial investment of the HTGR power plant is USD 2588.0 million, the construction cost is equivalent to USD 4300/kW, and the cost flow including maintenance fees and repair costs is approximately USD 9.91/s. When calculating the maintenance cost, it was assumed that the annual operation time was 5000 h, the life of the equipment was 30 years, the annual interest was 5%, and there was no depreciation cost after 30 years. From this table, the cost flow rate of the HTGR system used in this study was 62% compared to the cost flow rate of 15.91 USD/s of the system considered by the Idaho Nuclear Institute, USA. However, the initial investment cost considered in this study is twice that of the HTGR system considered by Kim et al. [10].
Table 5.
Initial investments, annualized costs, and corresponding monetary flow rates of each component in the GT−HTGR system.
Table 6 lists the cost flow for each exergy in each component obtained by solving the 23 exergy cost-balance equations from Equations (60)–(82). Since the sum of the exergy cost streams for each device was zero, the exergy cost-balance was correct. As shown in Table 6, the loss cost has a negative value, which can be regarded as the investment cost of the device. As shown in Table 6, because the cost flow of electricity from the generator is 3.889 USD/s and the electricity produced from the generator is approximately 230.9 MW, the unit cost of electricity produced from the generator is approximately USD 16.84/GJ (=USD 0.061/kWh). The more accurate unit costs of the primary product for each unit are shown in Table 7. For example, the unit cost of the work produced by a turbine (C2W) is USD 16.49/GJ and the unit cost of electricity produced by a generator (C5E) is USD 17.7/GJ (USD 0.064/kWh). In addition, the unit cost of hydrogen (C17H2) produced in the electrolyzer is USD35.7/GJ, which corresponds to USD 4.28/(hydrogen per kg). Since the unit cost of electricity produced by an HTGR is cheaper than that of any other energy source [11], the unit cost of hydrogen production by electrolyzing water with electricity from an HTGR is substantially lower than that of any other system. The total lost cost flow due to entropy generation is approximately USD 0.0157/s, which is less than 0.7% of the total investment cost flow USD 12.0/s.
Table 6.
Cost flow rates of various exergies, lost cost, and investment cost flow rates of each component in the GT-HTGR system. Unit is USD/s.
Table 7.
Unit cost of various exergies in the cost-balance equations for the HTGR system. Unit is USD/GJ.
Figure 3 shows the change in the unit cost of hydrogen as a percentage change in the investment and uranium fuel costs. If the initial investment cost of HTGR increases by 50%, the unit cost of electricity and hydrogen production increases by 27% (USD 22.5/GJ = USD 0.081/kWh) and 45% (USD 51.7/GJ = USD 6.2/kg hydrogen), respectively. If the unit cost of uranium fuel increases by 50% from USD 3.5/GJ to USD 5.25/GJ, the unit cost of hydrogen production increases by 9.6% (USD 39.0/GJ). This result indicates that the unit cost of hydrogen in this system is highly dependent on the investment cost as shown in Figure 3.
Figure 3.
Change in unit cost of hydrogen according to a percentage change in investment and uranium fuel costs.
5.2. HTWR System
Table 8 shows the enthalpy, entropy, and exergy flow rates calculated using thermodynamic properties such as the molar flow rate (kmol/s), temperature, and pressure at the state points of the HTWR system. The preliminary design of the HTWR system at the Electric Power Research Institute [8] was used to determine the temperature and pressure at critical state points. The flow rate of the working fluid was determined through trial and error to establish the law of energy conservation for each component. However, unlike Kim et al. [10], the turbine was designed as a system that operates by an independent loop without using water from the nuclear reactor to reduce radiative contamination to the greatest extent possible. In the HTWR system, the molar flow rate of steam entering the reformer (state point 514) is 7.2162 kmol/s (130 kg/s), and the flow rate of natural gas (state point 301) is 2.2 kmol/s.
Table 8.
Property values and enthalpy, entropy, and exergy flow rates at various state points in the HTGR system.
As described above, the mass flow rate of water flowing through pump 1<7>, that is, the amount of water vapor flowing into reformer <11> and the flow rate of natural gas flowing into the compressor, are determined by the energy conservation law for the reformer. From Table 8, the molar flow rate of water flowing through pump 1 was 7.216 kmol/s (=130.0 kg/s), and the city gas introduced through the compressor <14> was approximately 2.3 kmol/s. In this case, the heat required for the reformer is obtained from the steam entering the reformer. Table 9 lists the energy conservation figures for each device in the HTWR system. In the reforming process, 304 MW of enthalpy is consumed from the input enthalpy of 535 MW. The mass flow rate of steam to the reformer is determined from Equation (10).
Table 9.
Energy balance for each component in the HTWR system shown in Figure 2.
Table 10 lists the exergy flow of each component. The sum of the exergy flows for each component is zero, indicating that the exergy-balance equation is satisfied. From the table, the work produced by turbine 1<3> is 69.2 MW, and the work produced by turbine 2<4> is approximately 17.3 MW. With the work produced by these turbines, the generator produces 82.2 MW of electricity to supply electricity for the compressor and pump, constituting a surplus of 19.0 MW. The surplus electricity provides the electricity required for the system.
Table 10.
Exergy balance for each component in the HTWR system.
Table 11 lists the initial investment costs and cost flows per unit rate for each component in the HTWR system. Assuming that the total initial investment of the HTWR plant is USD 2417.9 million, the construction cost is equivalent to USD 4000/kW, and the cost flow including maintenance and repair costs is approximately USD 8.88/s. When calculating the maintenance cost, it was assumed that the annual operation time was 5000 h, the life of the equipment was 30 years, the annual interest is 5%, and there was no depreciation cost after 30 years.
Table 11.
Initial investments, annualized costs, and corresponding monetary flow rates of each component in the ST-HTWR system.
Table 12 lists the cost flow for each exergy in each component obtained by solving the 20 exergy cost-balance equations from Equations (83)–(102). Since the sum of the exergy cost streams for each device was zero, the exergy cost-balance was correct. As shown in Table 12, the lost cost has a negative value, indicating that the amount of cost loss occurring in the component is the investment cost for the device. As listed in Table 12, the total amount of work produced by the two turbines is 86.5 MW. If the efficiency of the generator is 95%, the electricity produced by the generator is approximately 82.2 MW. The more accurate unit costs for the primary product for each component are presented in Table 13. For example, the unit costs of work produced by turbines 1<3> and turbine 2<4> is USD 40.5/GJ and USD 60.0/GJ, respectively, and the unit cost of electricity produced by the generator (C5E) is USD 48.1/GJ (=USD 0.173/kWh). In addition, the unit cost of the hydrogen (C12H2) produced in the electrolyzer is USD 13.92/GJ, which corresponds to USD 1.67/(hydrogen per kg). In this calculation, a carbon tax of USD 0.08/(kg of CO2) was imposed on carbon dioxide, leaving a state point of 306. The unit cost of hydrogen produced at the HTWR plant by steam reforming was twice as high as that of hydrogen obtained by Kim et al. [9]. This is because the initial investment and uranium fuel costs in this study were nearly double those reported by Kim et al. [10]. The total lost cost flow due to entropy generation for HTWR is approximately USD2.5/s, which is approximately 12.0% of the total investment cost flow USD 20.0/s.
Table 12.
Cost flow rates of various exergies, lost cost, and investment cost flow rates of each component in the ST-HTWR system. Unit is USD/s.
Table 13.
Unit cost of various exergies in the cost-balance equations for the ST-HTWR system. Unit is USD/GJ.
As shown in Table 8, the molar flow rate of hydrogen exiting to state point 304 is 8.0958 kmol/s: thus, the HTWR system produces 6.3-fold more hydrogen than the HTGR system does. However, the unit cost of hydrogen production is only 38% lower than that of HTGR because the HTWR system not only requires natural gas as a fuel but also imposes a carbon tax on carbon dioxide emitted. If a carbon tax is not imposed on carbon dioxide, the unit cost of hydrogen would be USD 8.77/GJ, which corresponds to a unit cost of USD 1.1/kg.
Figure 4 shows the change in the unit cost of hydrogen as a percentage change in investment, uranium fuel, and natural gas costs. If the initial investment cost of HTWR increases by 50%, the unit cost of hydrogen production increases by 22% (USD 16.9/GJ). A 50% increase in the uranium fuel increases the unit cost of hydrogen production by 5.2% (USD 14.6/GJ). If the unit cost of natural gas increases by 50%, from USD 10.0/GJ to USD 15.0/GJ, the unit cost of the hydrogen production increases by 4.3% (USD 14.5/GJ). In contrast, the initial investment cost of the HTWR plant decreases by 50%, and the unit cost of hydrogen decreases to USD 10.79/GJ. The unit cost of hydrogen produced in this system is not highly dependent on the unit cost of the uranium fuel and natural gas, as shown in Figure 4.
Figure 4.
Change in unit cost of hydrogen according to a percentage change in investment, uranium fuel, and natural gas costs.
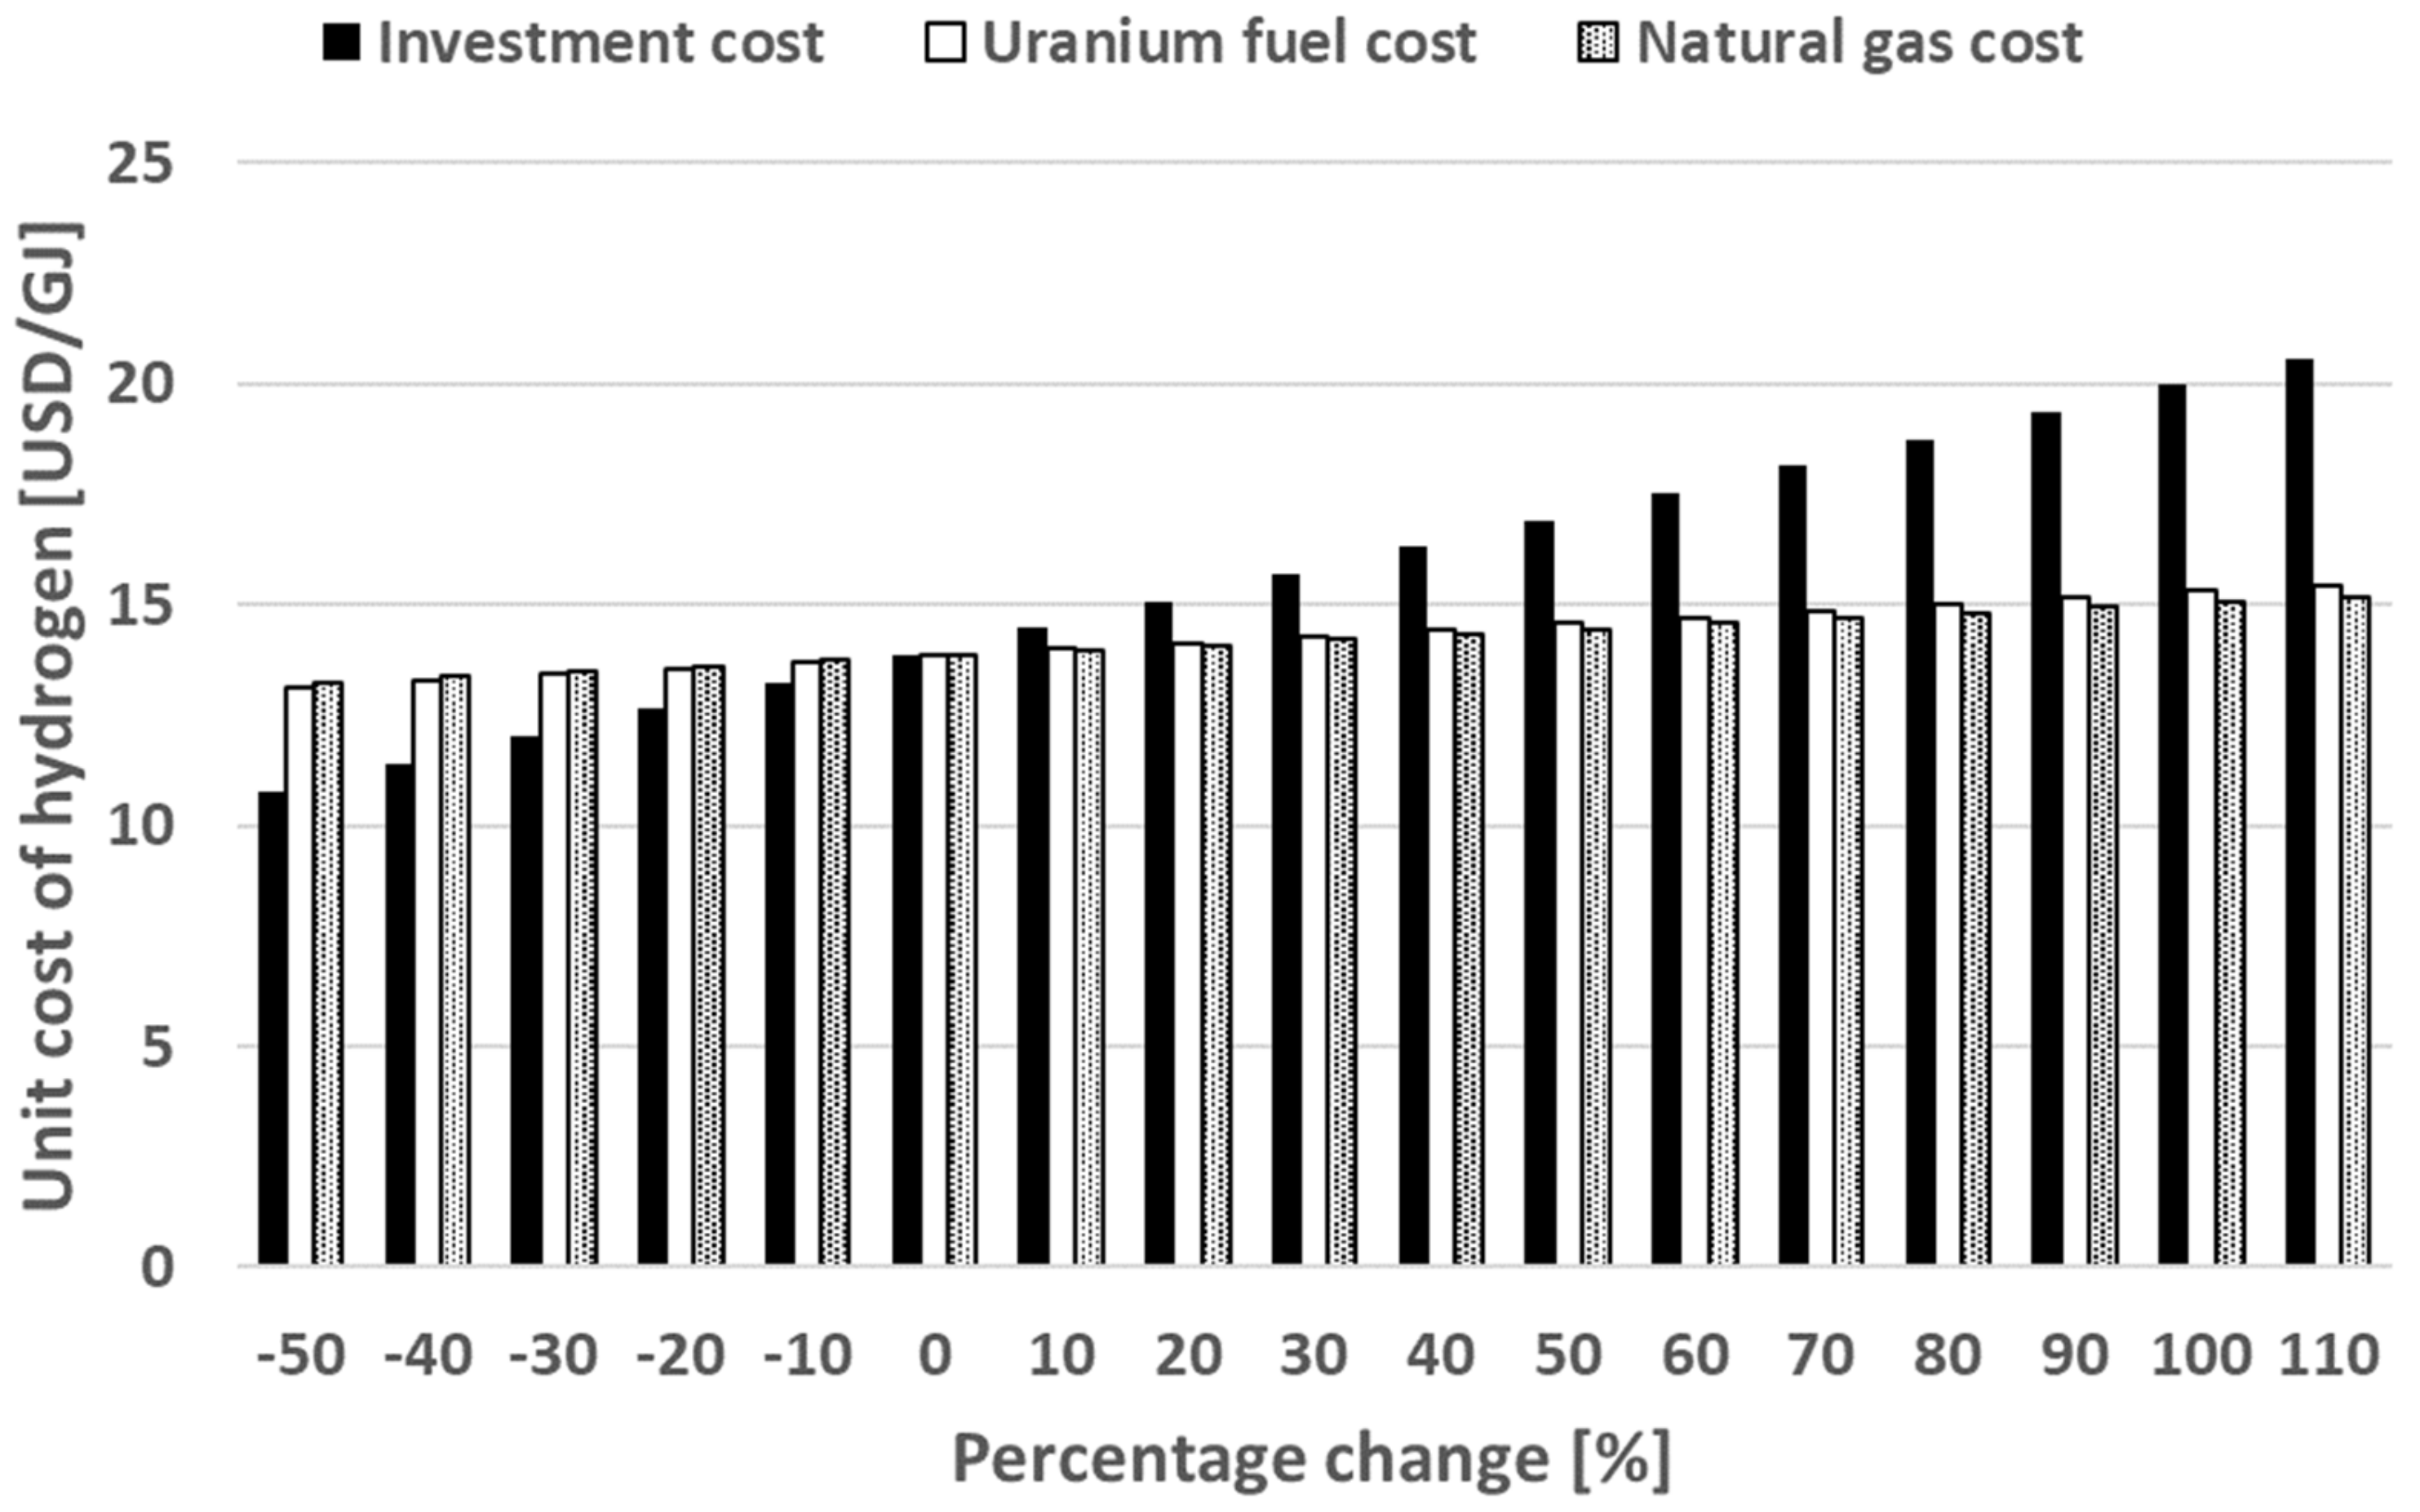
5.3. Scaled-Down of the Plant
Small module reactors (SMRs) [28] have capacities below 300 MW. The development of a 1-MW SMR for hydrogen production is currently planned. The unit cost of hydrogen production was calculated when the scale of the 600 MW HTGR plant or 600 MW HTWR plant used in this study was scaled down to 1/10 or 1/100. This can be achieved by reducing the flow rate of the working fluid and initial investment. Table 14 lists the calculated hydrogen production rate and corresponding unit costs of hydrogen produced by the 60 MW and 6 MW HTGR plants and the 60 MW and 6 MW HTWR plants. The hydrogen production rate in scaled-down reactors decreases proportionally with reactor capacity: however, the unit cost of hydrogen produced in the scaled-down reactors does not change. The slight decrease in the hydrogen unit cost in the scaled-down HTWR plant was due to the reduced CO2 production in that plant.
Table 14.
Hydrogen production rate and corresponding unit cost of hydrogen scaled-down HTGR and HTWR reactors.
6. Conclusions
In this study, to obtain a reasonable unit price of hydrogen produced from HTGR and HTWR, energy, exergy, and thermoeconomic analysis was performed. In the flowsheet analysis, the temperature, pressure, and flow rate of the working fluid at the critical state point of the system were determined such that the energy conservation law was established for each component of the system. A thermoeconomic method called MOPSA (Modified Production Structure Method) provides the appropriate unit cost of the product and the loss cost flow of each component due to entropy generation. When the reactor was cooled with helium (HTGR) or water (HTWR), the temperature of the working fluid exiting the reactor was assumed to be 850 °C and the size of the reactor was set to 600 MW.
For the 600 MW HTGR system, electricity is produced using the Brayton cycle and hydrogen is produced by decomposing high-temperature water vapor using this electricity, resulting in 1.28 kmol (2.57 kg) of hydrogen per second and 0.6384 kmol (20.43 kg) of oxygen. When the initial investment amount of the system is USD 2.6 billion, the unit cost of hydrogen production is USD 35.6/GJ (=USD 4.28/kg) thanks to the low unit cost of power produced by the system at USD 0.064/kWh.
For the 60 MW HTWR system, water with a temperature of 850 °C and a mass flow rate of 670 kg/s exiting a nuclear reactor is converted into water vapor at a temperature of 650 °C through heat exchange and injected into the reformer. Hydrogen is produced through a reforming reaction with natural gas at a temperature of 200 °C and a molar flow rate of 2.2 kmol/s entering the reformer. The maximum hydrogen production possible in this system is 8.33 kmol/s (16.74 kg/s), which is 6.6-fold more hydrogen than the HTGR system, but also emits carbon dioxide with a molar flow rate of 2.60 kmol/s. With the initial investment being USD 2318 million for the HTWR system, the unit cost of natural gas is USD 10.0/GJ, the carbon tax is USD 0.08 per kg of carbon dioxide, and the unit cost of hydrogen produced is USD 13.85/GJ (USD1.66/kg)), which is substantially more economical than the current selling price of hydrogen, which is USD 3.7/kg.
A more detailed study of the electrolysis system is needed to achieve a reasonable unit cost of hydrogen from HTGR. Additional research is also needed on the addition of CO2 removal plants to HTWR systems with steam reforming. Currently, different types of SMRs are being developed in many countries. In the near future, cheaper hydrogen could be produced through SMR.
Author Contributions
H.-Y.K.: Conceptualization, Methodology, Formal Analysis. W.-Y.L. and S.-D.O.: Supervision, Project administration, Funding acquisition. T.K. and S.-H.S.: Software, Validation, Data Curation. H.-Y.K. and T.K.: Writing—Reviewing and Editing. All authors have read and agreed to the published version of the manuscript.
Funding
This work was supported by the Korea Institute of Energy Technology Evaluation and Planning (KETEP) grant funded by the Korea government (MOTIE), (20213030030190, Development of Smart DPO (Design, Production, Operation) Open Platform for Fuel Cell System.
Data Availability Statement
Data are contained within the article.
Conflicts of Interest
Authors Seok-Ho Seo, Si-Doek Oh and Ho-Young Kwak were employed by the company Blue Economy Strategy Institute Co., Ltd. The remaining authors declare that the research was conducted in the absence of any commercial or financial relationships that could be construed as a potential conflict of interest.
References
- Jaszczur, M.; Rosen, M.A.; Sliwa, T.; Dudel, M. Hydrogen production using high temperature nuclear reactors. Int. J. Hydrogen Energy 2016, 41, 7861–7871. [Google Scholar] [CrossRef]
- Al-Zareer, M.; Dincer, I.; Rosen, M.A. Development and assessment of a novel integrated nuclear plant for electricity and hydrogen production. Energy Convers. Manag. 2017, 134, 221–234. [Google Scholar] [CrossRef]
- Milewski, J.; Kupecki, J.; Szczesnial, A.; Uzunow, N. Hydrogen production in s. Energyolid oxide electrolyzers coupled with nuclear reactors. Int. J. Hydrogen Energy 2021, 46, 35765–35776. [Google Scholar] [CrossRef]
- Oettingen, M.; Cetnar, J. Numerical modeling of modular high-temperature gas-cooled reactors with thorium fuel. Nukleonika 2021, 66, 133–138. [Google Scholar] [CrossRef]
- Harvego, E.A.; Reza, S.M.M.; Richards, M.; Shenoy, A. An evaluation of reactor cooling and coupled hydrogen production using the modular helium reactor. Nucl. Eng. Des. 2006, 236, 1481–1489. [Google Scholar] [CrossRef]
- Yan, X.; Tachibana, T.; Ohashi, H.; Sato, H.; Tazawa, Y.; Kunitomi, K. A small modular reactor design for multiple energy applications. Nucl. Eng. Technol. 2013, 45, 401–414. [Google Scholar] [CrossRef]
- Chikazawa, Y.; Konomura, M.; Uchida, S.; Sato, H. A feasibility study of a steam methane reforming hydrogen production plant with a sodium-cooled fast reactor. Nucl. Technol. 2005, 152, 266–272. [Google Scholar] [CrossRef]
- Sandell, L. High Temperature Gas-Cooled Reactors for the Production of Hydrogen: An Assessment in Support of the Hydrogen Economy; EPRI: Palo Alto, CA, USA, 2003; p. 1007802. [Google Scholar]
- Boldon, L.; Sabharwall, P.; Rabiti, C.; Bragg-Sitton, S.M.; Liu, L. Thermodynamic exergy analysis for small modular reactor. Nucl. Sci. Technol. 2016, 2, 23. [Google Scholar]
- Kim, D.J.; Kim, J.H.; Kwak, H. Thermoeconomic analysis of high-temperature gas-cooled reactors with steam methane reforming for hydrogen production. Nucl. Technol. 2011, 176, 337–351. [Google Scholar] [CrossRef]
- Tenhumberg, N.; Büker, K. Ecological and economic evaluation of hydrogen production by different water electrolysis technologies. Chem. Ing. Technol. 2020, 92, 1586–1595. [Google Scholar] [CrossRef]
- El-Emam, R.S.; Ozcan, H. Comprehensive review on the techno-economics of sustainable large-scale clean hydrogen production. J. Clean. Prod. 2019, 220, 593–609. [Google Scholar] [CrossRef]
- Machhammer, O.; Bode, A.; Hormuth, W. Financial and ecological evaluation of hydrogen production processes on large scale. Chem. Eng. Technol. 2016, 39, 1185–1193. [Google Scholar] [CrossRef]
- Fragiacomo, P.; Genovese, M. Technical-economic analysis of a hydrogen production facility for power-to-gas and hydrogen mobility under different renewable sources in Southern Italy. Energy Convers. Manag. 2020, 223, 113332. [Google Scholar] [CrossRef]
- Ai-Qahtani, A.; Parkinson, B.; Hellgardt, K.; Shah, N.; Guillen-Gosalbez, G. Uncovering the true cost of hydrogen production routes using life cycle monetization. Appl. Energy 2021, 281, 115958. [Google Scholar] [CrossRef]
- Ji, M.; Shi, M.; Wang, J. Life cycle assessment of nuclear hydrogen production processes based on high temperature gas-cooled reactor. Int. J. Hydrogen Energy 2023, 48, 22302–22318. [Google Scholar] [CrossRef]
- Lee, J.M.; Lee, S.; Kye, D.H.; Park, H.J.; Park, W.; Shin, J.; Park, K. Environ-economic analysis of high-temerature steam electrolysis for decentralized hydrogen production. Energy Convers. Manag. 2022, 266, 115856. [Google Scholar] [CrossRef]
- Wang, Z.L.; Naterer, G.F.; Gabriel, K.S.; Gravelsins, R.; Daggupati, V.N. Comparison of sulfur–iodine and copper–chlorine thermochemical hydrogen production cycles. Int. J. Hydrogen Energy 2010, 35, 4820–4830. [Google Scholar] [CrossRef]
- Ozbilen, A.; Dincer, I.; Rosen, M.A. Development of a four-step Cu–Cl cycle for hydrogen production—Part I: Exergoeconomic and exergoenvironmental analyses. Int. J. Hydrogen Energy 2011, 36, 11321–11327. [Google Scholar] [CrossRef]
- Oh, S.-D.; Pang, H.-S.; Kim, S.; Kwak, H. Exergy analysis for a gas turbine cogeneration system. J. Eng. Gas Turb. Power 1996, 118, 782–791. [Google Scholar] [CrossRef]
- Khaljani, M.; Saray, R.K.; Bahlouli, K. Comprehensive analysis of energy, exergy and exergo-economic of cogeneration of heat and power in a combined gas turbine and organic Rankine cycle. Energy Convers. Manag. 2015, 97, 154–165. [Google Scholar] [CrossRef]
- Kwak, H.; Kim, D.-J.; Jeon, J.-S. Exergetic and thermoeconomic analyses of power plants. Energy 2003, 28, 343–360. [Google Scholar] [CrossRef]
- Kordesch, K.; Simader, G. Fuel Cells and Their Applications; VCH: Weinheim, Germany, 1996. [Google Scholar]
- Seo, S.-H.; Oh, S.-D.; Park, J.; Oh, H.; Choi, Y.-Y.; Lee, W.-Y.; Kwak, H. Thermodynamic, exergetic, and thermoeconomic analyses of a 1-kW proton exchange membrane fuel cell system fueled by natural gas. Energy 2021, 217, 11962. [Google Scholar] [CrossRef]
- Bejan, A. Advanced Engineering Thermodynamics, 4th ed; John Wiley & Sons: Hoboken, NJ, USA, 2016. [Google Scholar]
- Kotas, T.J. The Exergy Methods of Thermal Plant Analysis; Krieger Publishing, Co.: Malabar, FL, USA, 1995. [Google Scholar]
- Moran, J. Availability Analysis: A Guide to Efficient Energy Use; Prentice-Hall: Upper Saddle River, NJ, USA, 1982. [Google Scholar]
- Richards, M.; Shenoy, A.; Schultz, K.; Brown, L.; Fukuie, M.; Harvego, E. The modular helium reactor for hydrogen production. In Proceedings of the 15th Pacific Basin Nuclear Conference (15PBNC), Sydney, Australia, 16 October 2006. [Google Scholar]
Disclaimer/Publisher’s Note: The statements, opinions and data contained in all publications are solely those of the individual author(s) and contributor(s) and not of MDPI and/or the editor(s). MDPI and/or the editor(s) disclaim responsibility for any injury to people or property resulting from any ideas, methods, instructions or products referred to in the content. |
© 2023 by the authors. Licensee MDPI, Basel, Switzerland. This article is an open access article distributed under the terms and conditions of the Creative Commons Attribution (CC BY) license (https://creativecommons.org/licenses/by/4.0/).