Abstract
Based on the transient-performance calculation model of a dual-spool mixed-flow turbofan engine, this article improves the dynamic algorithm of geometric adjustment mechanisms and establishes a transient-performance calculation model suitable for a three-stream adaptive cycle engine (three-stream ACE). Using this model, the transient characteristics of a three-stream ACE were analyzed. The results indicate that the delay in the area of the fan nozzle significantly reduces the surge margin of the front fan during deceleration, while the delay in the angle of the front-fan and aft-fan guide vanes significantly reduces the surge margin of the front fan during acceleration, therefore becoming a limitation of the transient performance of the engine. At the same time, to meet the demand for equal-thrust mode switching, this article also proposes a mode-switching control scheme that solves the problem of engine state oscillation during the mode-conversion process and achieves a smooth conversion with thrust fluctuations within 1%. The research results of this article can guide the optimization design of three-stream ACE transition-state control laws and the design of control system architecture, which has important engineering significance.
1. Introduction
An adaptive cycle engine is one of the ideal engines for future multi-mission combat aircraft [1]. It has two working modes: the thrust priority mode and the specific fuel consumption (SFC) priority mode. It can switch between the two modes through the adjustment of geometric mechanisms provided that the same engine has both high specific thrust characteristics in a high-power state and low fuel consumption characteristics in a low-power state.
In 2007, the United States proposed an adaptive cycle engine [2], which was considered a technological breakthrough. Additionally, the United States implemented a series of research plans, such as Adaptive Versatile Engine Technology (ADVENT), Adaptive Engine Technology Development (AETD), and the Adaptive Engine Transition Program (AETP). With the support of these research programs, adaptive fans, efficient core engines, and multi-variable control systems were validated [3]. They developed full-scale, three-stream ACEs XA100 and XA101 and performed performance and operational tests [4]. Some researchers have also conducted in-depth research on parameter analysis, overall matching, steady-state characteristics, and control laws of ACEs [5,6].
In China, research on the key technologies of ACEs began in 2010. They mainly studied four different configurations of ACEs: an ACE with a rear variable fan (RVF-ACE), an ACE with a variable fan system (VFS-ACE), an ACE with a blade tip fan (FLADE-ACE), and a three-stream ACE. In these studies, the advantages and disadvantages of different configurations were compared [7,8], the overall performance-matching technologies of ACEs were explored [9,10,11,12,13,14], and the optimization methods for steady-state control laws were determined [15,16,17,18].
The above-mentioned research results explore the working characteristics of ACEs from a steady-state perspective, providing support for the study of the transition-state characteristics of ACEs in this paper. A transition state refers to the operating state of an engine when it transforms from one steady state to another. For military turbofan engines, the transition state accounts for a significant portion of the engine’s lifespan. The scholar Goribelke from CIAM [19] conducted a statistical analysis of the frequency of transition-state usage for F100 engines and found that the number of changes in the operating state within the “idle-maximum” range was 10 times per hour, while it could exceed 10,000 times throughout its entire lifespan. In the future, the proportion of transition states in high-performance engines will increase by 5–10 times. A detailed evaluation of the transient characteristics of the engine can provide support for engine flow path matching, control system design, and blade tip clearance design [20]. At present, to meet the evaluation requirements of ACE transition-state characteristics, scholars have established transition-state performance calculation models and analyzed the transition-state characteristics [17,21,22,23,24,25,26,27,28,29]. Refs. [21,22,23,24] focus on analyzing the impacts of heat exchangers, large-scale power extraction, and variable geometric parameters on the transient performance of ACEs. Ref. [25] simulated the characteristics of an engine during acceleration, deceleration, and mode-transition processes and set the geometric component control law during the mode-switching process based on the main fuel control law that kept the high-pressure rotor speed unchanged. Ref. [26] optimized the control law of the mode-switching process with the principle of minimizing engine thrust fluctuations. Ref. [27] analyzed the mode-switching process characteristics of a double-bypass ACE engine with FLADE. Ref. [28] focused on the adaptive cycle engine as the research object and proposed an “intermediate state” phased mode-conversion method. The state of the engine in the main operating mode, except for the mode selection valve, is defined as the intermediate state when other geometric adjustment laws are consistent. The speed at which the thrust of the two modes in the intermediate state is the same is defined as the mode-conversion speed. To achieve equal-thrust mode switching, the entire process is divided into three stages: pre-adjustment, switching, and post-adjustment. Refs. [17,29,30] proposed a thrust step mode-conversion method and a control law design method based on direct thrust control technology to address the problem of parameter fluctuations during the mode-conversion process, ensuring rapid and stable mode conversions. Refs. [31,32], respectively, explored the hysteresis response of the external flow rate and total pressure of the mode selection valve during the dynamic adjustment process, as well as the essential reasons for the backflow of the second external gas during the mode-conversion process, providing theoretical support for the analysis of the mode-conversion characteristics.
For adaptive cycle engines, the transition state mainly includes two parts: acceleration and deceleration, and mode switching. From the above-mentioned literature analysis results, it can be seen that there are many studies on the transition-state characteristics of these two parts, both domestically and internationally, exploring the effects of power extraction, heat exchangers, and variable geometric parameters on transition-state performance. At the same time, mode-transition methods, such as “intermediate state” and “thrust step”, were also proposed. However, the impact of the dynamic response of adjustable geometric components on the transition-state performance and the specific control methods during mode switching is rarely mentioned. Compared to conventional engines, adaptive cycle engines have two typical features: multiple variable geometric components and two or more operating modes. These two characteristics present two difficulties in the study of engine transition characteristics. First, during the transition process, these variable geometric components need to follow the change in engine state quickly, so the dynamic response of the adjustment mechanisms may become an important factor affecting the acceleration and deceleration performance of the engine. Second, in order to ensure smooth mode switching, in addition to the geometric adjustment laws mentioned in the above literature, attention should also be paid to the control of the high- and low-pressure rotor speed, namely the control mode of main fuel flow and the primary-nozzle throat area.
This article will use the three-stream ACE as the research object to study the above two issues. The transition state referred to in the article includes the acceleration process from idle to military-thrust state, the deceleration process from military-thrust state to idle, and the transition process between thrust priority mode and SFC priority mode. One of the research focuses of this article is to explore the changes in engine acceleration and deceleration time, as well as the aerodynamic stability of compression components, when the response of these geometric mechanisms is delayed. This provides direction for optimizing geometric control laws in transition-state processes. Another research focus of this article is to explore mode-switching control methods that are easy to implement for control systems in response to the demand for equal-thrust mode switching. The research results will provide support for the design of control system architecture.
2. Physical Models and Calculation Methods
2.1. Physical Models
The configuration of the three-stream ACE studied in this article is shown in Figure 1 and Figure 2, consisting of a front fan, an aft fan, a high-pressure (HP) compressor, a combustor, a high-pressure turbine, a low-pressure (LP) turbine, a rear variable area bypass injector (RVABI), an afterburner, a primary nozzle, and a fan nozzle. After being compressed by the front fan, a portion of the airflow passing through the inlet enters the third bypass and is discharged by the fan nozzle, while a portion enters the aft fan. The airflow entering the aft fan is compressed and divided into two streams, with one stream entering the second bypass and the other stream entering the first duct (core airstream). After further compression by the compressor, the airflow in the first duct generates high-temperature and high-pressure gas through the combustor, which enters the HP turbine and LP turbine for expansion and work. Finally, it is mixed with the airflow in the second duct in the RVABI and discharged by the primary nozzle.
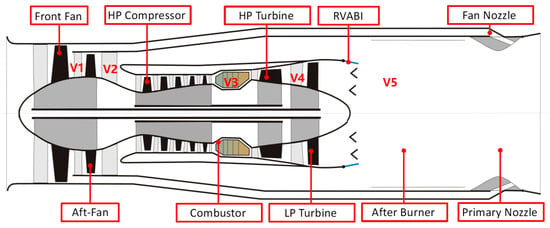
Figure 1.
Schematic of the Structure of a Three-Stream Adaptive Cycle Engine.
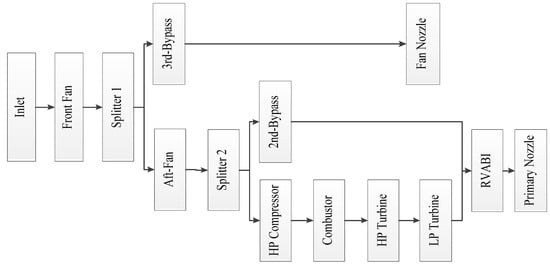
Figure 2.
Physical Model of Three-Stream Adaptive Cycle Engine (own editing).
This engine mainly consists of 6 geometrically adjustable mechanisms, including the front-fan guide vane angle (α1), the aft-fan guide vane angle (α2), the HP compressor guide vane angle (α3), the outer bypass inlet area of the RVABI (A16), the throat area of the fan nozzle (A18), and the throat area of the primary nozzle (A8). It can achieve stable operation in thrust priority mode and SFC priority mode, as well as smooth switching between these two operating modes by adjusting the geometric position and speed ratio of high- and low-pressure rotors.
The V1–V5 marked in red font in Figure 1 are the selected cavities for model establishment in this paper and will be elaborated on in detail in Section 2.2.1.
2.2. Transition-State Performance Calculation Model
The transition-state performance calculation model in this article is based on the dual-spool mixed-flow turbofan engine (DMTE) model and is improved according to the structural and operational characteristics of the three-stream ACE. The model consists of two main parts: the first part is the engine performance calculation model, which is used to calculate the overall performance of the engine and the parameters of each section. The second part is a simplified control model used to achieve control functions such as engine fuel flow rate, geometric adjustment, and mode-switching logic.
In 2002, Xinyue provided a detailed explanation of this type of model using a DMTE as an example [33]. In 2014, Xuedong validated the model using engine test data, proving its accuracy [34]. From a configuration perspective, the three-stream ACE is equivalent to adding a third stream based on a DMTE. Therefore, the validated transient-performance calculation model of the DMTE can be used for the analysis of the transient characteristics of the ACE after conducting applicability improvement.
Due to the detailed description of the model in ref. [33], this article focuses on the improvements made to meet the transition-state performance simulation requirements of the three-stream ACE.
2.2.1. Engine Model Based on Volumetric Effect
The performance simulation of the three-stream ACE involves 11 unknown variables, including LP rotor speed , HP rotor speed , front-fan pressure ratio , aft-fan pressure ratio , HP compressor pressure ratio , total temperature at the outlet of the combustor , HP turbine expansion ratio , LP turbine expansion ratio , total temperature at the outlet of the afterburner , second bypass airflow rate , and third bypass airflow rate . To solve these unknown variables, it is necessary to provide the fuel supply laws of the main combustor and afterburner and establish 9 equilibrium equations.
The engine performance calculation model in this article adopts a modeling method based on the “volumetric effect”. The basic idea is to obtain the pressure ratio and speed of rotating components through the volumetric state equation and rotor kinematics equation, obtain the total temperature at the outlet of the combustor and afterburner according to the given fuel supply law, and obtain the duct airflow rate based on the static pressure balance of the mixer. This type of calculation model has been applied in the transient-performance simulations of turboshaft [35], mixed-flow turbofan [36], split-flow turbofan with boost stage [37], and double-bypass variable cycle engine [38] and has been described in detail in references [35,36,37,38]. Therefore, this article will not elaborate on it further. According to the mass and energy storage Equations (1) and (2) of the volumetric effect [38], it can be seen that the selection of the cavity and the flow rate calculation method related to the cavity determine the solution of unknown variables and component characteristic-map interpolation in the model, which are key issues in modeling.
In the equations, represents temperature, represents pressure, represents the volume of the chamber, represents gas constant, represents the specific heat capacity of the gas, represents gas-flow rate, represents specific enthalpy, and represents the added heat. The subscript represents the stagnation parameter, represents the outlet cross-section of the cavity, and represents the inlet cross-section of the cavity. The superscript represents the -th stream entering the cavity, represents the -th stream flowing out of the cavity. The left side of the equal sign in the two equations represents the rate of change in the outlet temperature and pressure of the cavity, respectively. In Equation (1), the first three terms to the right of the equal sign represent the accumulation of energy in the cavity, and the last two terms represent the accumulation of mass. In Equation (2), the first two terms to the right of the equal sign represent the accumulation of mass in the cavity, and the last term represents the pressure change caused by the temperature change inside the cavity.
Based on the structural characteristics of the three-stream ACE, the selected cavities in this article are the volume between the front fan and the aft fan (V1), the volume between the aft fan and the compressor (V2), the combustor volume (V3), the volume between the HP turbine and LP turbine (V4), and the afterburner volume (V5), as shown in the red font in Figure 1. The inlet and outlet gas-flow rates of each volume are shown in Table 1. In the table, the inlet flow rate of V1 () is obtained by interpolation of the front-fan characteristic map, the outlet flow rate is obtained by interpolation of the aft-fan characteristic map, and the outlet flow rate is obtained by continuous flow conditions of the fan nozzle. The inlet flow rate of V2 is , the outlet flow rate is obtained by interpolation of the HP compressor characteristic map, and the outlet flow rate is obtained by the static pressure balance between the inner and outer bypass of RVABI. The inlet flow rate of V3 () is the outlet flow rate of the HP compressor, which is equal to minus the flow rate extracted from the compressor. is the fuel flow rate of the combustor, and the outlet flow rate is obtained through interpolation of the HP turbine characteristic map. The inlet flow rate of V4 () is the outlet flow rate of the HP turbine, which is equal to plus the cooling gas of the HP turbine. The outlet flow rate is obtained by interpolating the characteristic map of the LP turbine. The inlet flow rate of V5 () is the inlet flow rate of the afterburner, which is equal to plus the cooling airflow rate of the LP turbine and the second bypass airflow rate. is the afterburner fuel flow rate, and the outlet flow rate is the nozzle inlet flow rate, which is obtained by the continuous flow condition of the nozzle.

Table 1.
Inlet and outlet flow for each volume.
The initial guesses of the model, such as the front-fan pressure ratio, aft-fan pressure ratio, HP compressor pressure ratio, total combustor outlet temperature, HP turbine expansion ratio, and LP turbine expansion ratio, can be calculated separately by the selected volumes and the gas-flow rate matching through the volumes, and the impulse equation of the RVABI. First, calculate the aerodynamic parameters of each component’s outlet through initial conditions and use these aerodynamic parameters to obtain the change rate of each initial guess value over time. Then, based on the given time step, the initial guess values of the engine at the next time can be calculated. Finally, based on the engine throttle lever command, working mode, mode-transition type, and other settings, the engine control model is used to calculate the fuel supply and the positions of geometric adjustment mechanisms of the engine at the next moment. Therefore, the corresponding cross-sectional parameters of the engine can be calculated at the next moment. By cycling in sequence, the aerodynamic and thermodynamic parameters of each section of the engine at each moment can be obtained, therefore achieving a transient-performance simulation of the engine.
2.2.2. Dynamic Algorithm for Regulating Mechanism
The regulation mechanisms of the ACE engine studied in this article include α1, α2, α3, A16, A18, and A8. In the transient-performance calculation model, except for the PID regulator used in A8, the dynamic algorithm of other geometric adjustment mechanisms adopts an inertial system with delay, and its functional block diagram is shown in Figure 3.

Figure 3.
Function Block Diagram of Adjustment Mechanisms Considering Delay.
According to aircraft engine control [39], the transfer function of the above block diagram is shown in Equation (3):
The differential form corresponding to the transfer function shown in Equation (3) can be found in Equation (4):
When calculating, the improved Euler method [40] is used for solving, as shown in Equation (5):
In these equations, and are the Laplace transform of the input signal and output signal, respectively; is the time constant of the adjustment mechanism, and the response speed of the mechanism is adjusted by changing the size of this parameter during calculation; is the proportional coefficient of the regulating mechanism, which affects the steady-state error of the regulating mechanism; is the delay time; is the Laplace operator; is the final output geometric position of the adjustment mechanism; is the given geometric position of the adjustment mechanism; is the time step size;
The dynamic algorithm for the primary-nozzle area adopts an incremental PID regulator [39], as shown in Equation (6):
In the equation, is the change in the throat area of the primary nozzle; is the proportional coefficient; is the integral coefficient; is the derivative coefficient; represents the control-variable error at that time. If A8 controls the low-pressure speed, represents the difference between the actual speed and the given value at the current time.
2.2.3. Fuel Flow Calculation Method
When calculating the transient performance, the fuel flow control law is a function of the total pressure at the outlet of the HP compressor and the relative corrected speed of the HP rotor [39], as shown in Equation (7):
In the equation, is the fuel flow rate of the combustor; is the total pressure at the outlet of the HP compressor; is the total temperature at the engine inlet; is the relative corrected speed of the HP rotor. reflects the fuel-air ratio of the combustor; is the correction of the fuel-air ratio using .
The calculation logic of fuel flow is shown in Figure 4. After the control logic calculates the required fuel flow rate, the actual fuel flow rate is provided to the engine model based on the dynamic response algorithm [39] of the fuel metering device shown in Equation (8).
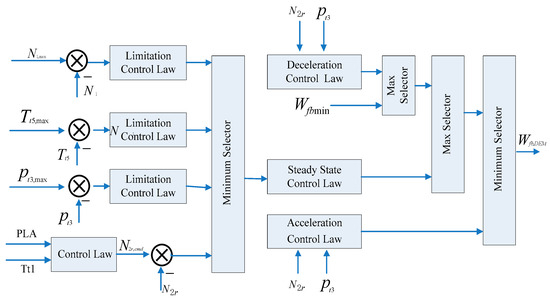
Figure 4.
Fuel Calculation Logic.
In the equation, is the position of the fuel metering device; is the time constant of the fuel metering device.
3. Acceleration and Deceleration Characteristics
The impact of the dynamic response of the geometric adjustment mechanism on the acceleration and deceleration characteristics of a three-stream ACE was analyzed in this section due to the fact that in the calculation model established in this article, A8 is used for closed-loop control of the low-pressure rotor speed, while the other geometric adjustment mechanisms are open-loop control based on the given adjustment law. Therefore, in this section, when considering the impact of the dynamic response of the geometric adjustment mechanism on the acceleration and deceleration characteristics of the engine, the geometric adjustment mechanisms are divided into two parts: A8 and the others. It should be noted that when calculating the acceleration and deceleration performance in this section, an engine-deceleration command was given at 15 s, and an engine-acceleration command was given at 35 s. Before 15 s, the engine was in a military-thrust state (hereinafter referred to as design point). In the following analysis, except for the primary-nozzle throat area, which is dimensionless based on the maximum area, all other parameters are dimensionless based on this state. In the intermediate state, the throat area of the nozzle is 52% of the maximum area.
3.1. Impact of A8 Response Speeds
The A8 response speed in this article refers to the adjustment speed of A8 to eliminate the deviation between the actual value and the given value of the LP rotor speed. In the transient-performance calculation model of this article, A8, as the regulating variable, needs to be closed-loop controlled for the given LP rotor speed, and its response speed has a significant impact on engine matching. The A8 response speed is related to the deviation between the given value and the actual value, as well as the PID parameters. This article calculates the acceleration and deceleration characteristics at different A8 response speeds by changing the error amplification coefficient of the control variable, as shown in Figure 5, Figure 6, Figure 7 and Figure 8. The vertical axis of Figure 5 was dimensionless based on the maximum nozzle throat area, while the horizontal and vertical axes of Figure 6, Figure 7 and Figure 8 were dimensionless based on the design point.
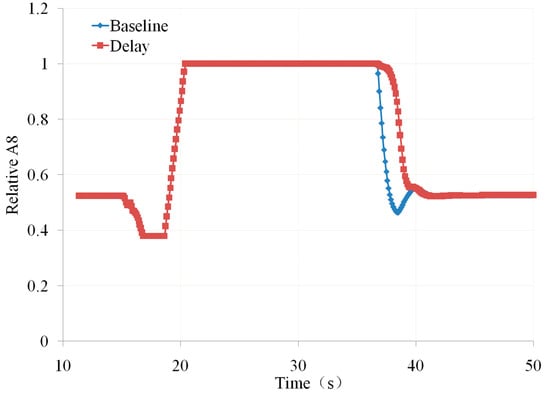
Figure 5.
Relative Primary-Nozzle Throat Area vs. Time (own editing).
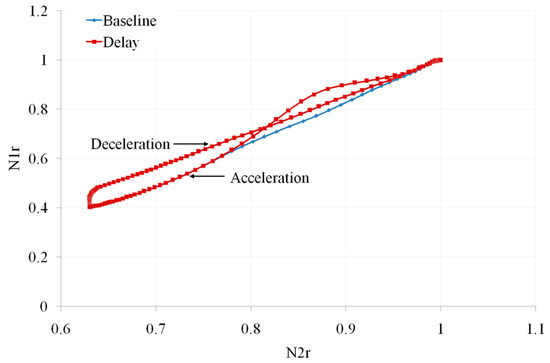
Figure 6.
Relative Corrected LP Rotor Speed vs. Relative Corrected HP Rotor Speed (own editing).
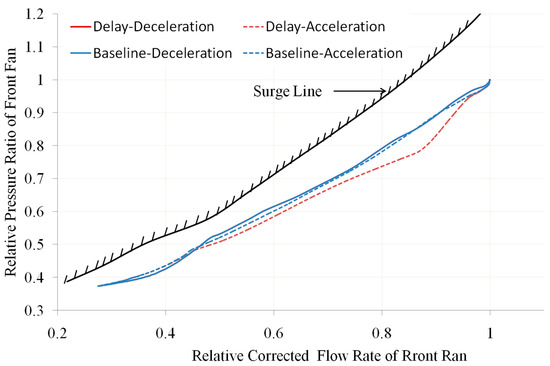
Figure 7.
Operating Line of Front Fan (own editing).
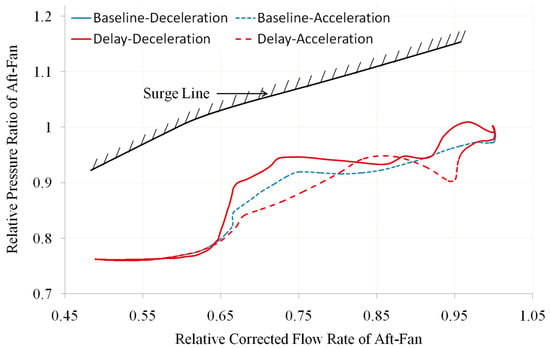
Figure 8.
Operating line of aft fan (own editing).
Among them, Figure 5 depicts the variation of primary-nozzle throat area (A8) over time, and Figure 6 describes the variation of the ratio of relative LP rotor speed (N1r) to relative HP rotor speed (N2r) under two different A8 response speeds, Figure 7 and Figure 8, respectively, depict the changes in the operating line of the front fan and aft fan under two different A8 response speeds. From Figure 5, Figure 6, Figure 7 and Figure 8, it can be seen that during the deceleration process, the change trends of the nozzle throat area, ratio of rotor speeds, and working line overlap. This is because the starting position of the A8 is to make the given LP rotor speed equal to the actual LP rotor speed. This means that a small change in the A8 during the deceleration process can meet the closed-loop control requirements of the LP rotor speed. Changing the error amplification coefficient of the adjustment variable has little effect on the response speed of the nozzle throat area.
During the acceleration process, A8 needs to be reduced from the maximum area to achieve closed-loop control of the LP rotor speed. After changing the error amplification coefficient of the regulating variable, A8 showed a significant response lag, with a slower turning down speed, and A8 was larger than the baseline (as shown in Figure 5). Due to A8 being larger than the baseline, the expansion ratio of the LP turbine increases, increasing the LP rotor speed. Therefore, in Figure 6, the N1r under the same N2r is larger than the baseline, and the rotor speed ratio increases. At the same time, due to the fact that the second bypass flow exiting from the aft fan needs to be mixed in the RVABI and discharged through the primary nozzle, the nozzle area deviation will cause a decrease in the back pressure at the aft fan outlet, therefore causing its operating line to shift downwards. However, the increases in nozzle area and LP rotor speed will cause the overall operating line of the fan to shift upwards. Under the joint action of the two, in the early stage of acceleration, it is mainly affected by the larger throat area of the primary nozzle, which causes the working line of the aft fan to move downward. The second half of acceleration is mainly affected by the ratio of the LP rotor speed to the HP rotor speed, which causes the operating line of the aft fan to shift upwards. The operating line of the front fan also shows an overall downward trend (as shown by the red and blue dashed lines in Figure 7 and Figure 8). The downward shift of the fan operating line caused by the response speed of A8 is not a favorable factor for the ACE configuration studied in this paper. If the response speed of A8 is slow during the acceleration process, causing the aft-fan operating line to be at the clogging boundary, it may lead to stable operation and overall performance-matching problems of the fan.
3.2. Impact of α1, α2, α3, A16 and A18
This section analyzes the impact of α1, α2, α3, A16, and A18 delays on the acceleration and deceleration characteristics of the engine under dual-speed control mode (that is, the main fuel controls the HP rotor speed, and the nozzle throat area controls the LP rotor speed). For the convenience of comparison, A8 adopted the basic response speed described in Section 3.1 to control the low-pressure rotor speed during calculation, and the delay time of α1, α2, α3, A16, and A18 were all taken as 0.6 s.
3.2.1. Acceleration and Deceleration-Time Characteristics
Figure 9 and Figure 10, respectively, show the thrust-response curve and acceleration/deceleration-time statistics of the engine when the above-mentioned geometric adjustment mechanism is delayed. Among them, the values shown on the vertical axis of Figure 9 are the relative values of the actual thrust relative to the design point, and the acceleration and deceleration time shown in Figure 10 refers to the time it takes from the start of the throttle lever movement to the time when the thrust change reaches 95%. From Figure 9, it can be seen that when considering the delay of the geometric adjustment mechanism, except for the overshoot of the final acceleration stage when α1 and α2 are delayed, the acceleration and deceleration thrust-response curves basically coincide. From the local amplification of Figure 9 (as shown in the black squares in the figure), it can be seen that the thrust-response curve basically overlaps in the low-speed range, while in the high-speed range, the thrust-response curves vary with the delays of the geometric adjustment mechanisms, namely in the initial stage of deceleration and final stage of acceleration. These phenomena are related to the control laws of the geometric adjustment mechanisms, especially the constant guide vane angle of the compression component in the low-speed range. From Figure 10, it can be seen that α3 delay can shorten the deceleration time by about 0.2 s. In terms of acceleration time, except for the α3 delay that increases the acceleration time, other geometric mechanism delays shorten the acceleration time. The shortening effect is most obvious when α1 and α2 delay is about 0.6~0.7 s.
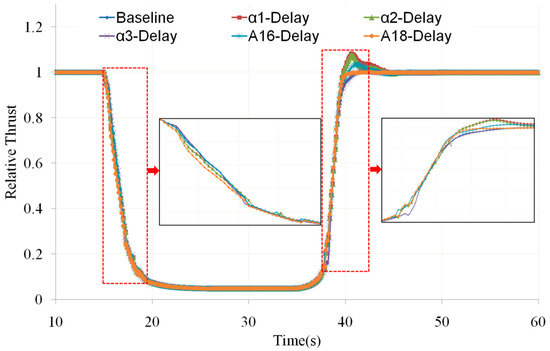
Figure 9.
Relative Thrust of Engine vs. Time (own editing).
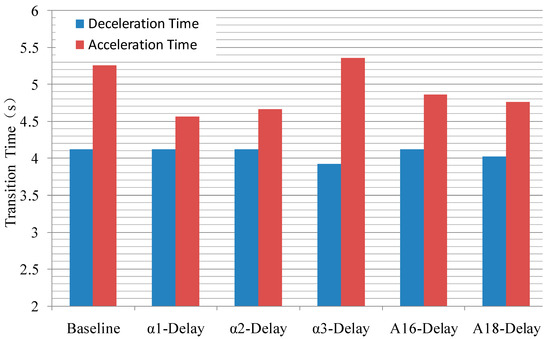
Figure 10.
Comparison of Acceleration and Deceleration Times under Delayed Conditions of Geometric Adjustment Mechanisms (own editing).
3.2.2. Aerodynamic Stability of Front Fan
Figure 11, Figure 12, Figure 13 and Figure 14 show the changes in the operating line and surge margin of the front fan compared to the baseline when there is a delay in one of the geometric adjustment mechanisms α1, α2, α3, A16, and A18. Among them, the horizontal and vertical axes of Figure 11, Figure 12 and Figure 13 are dimensionless based on the design points.
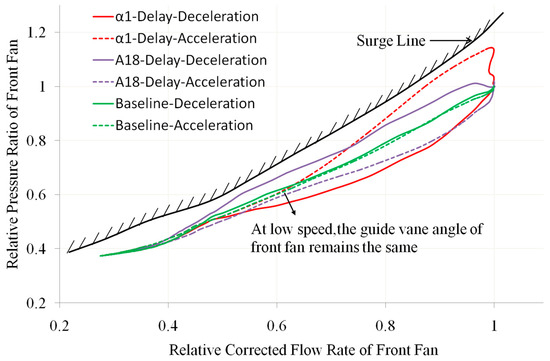
Figure 11.
Comparison of Front-Fan Operating Line with α1 Delay and A18 Delay (own editing).
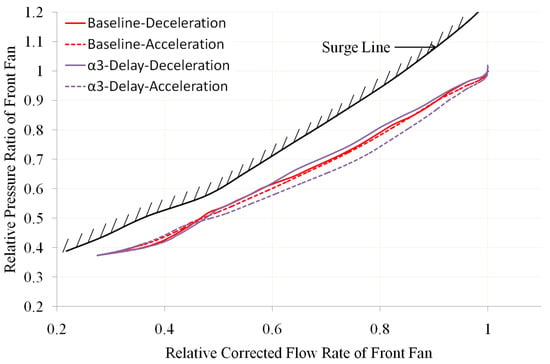
Figure 12.
Comparison of Front-Fan Operating Line with α3 Delay (own editing).
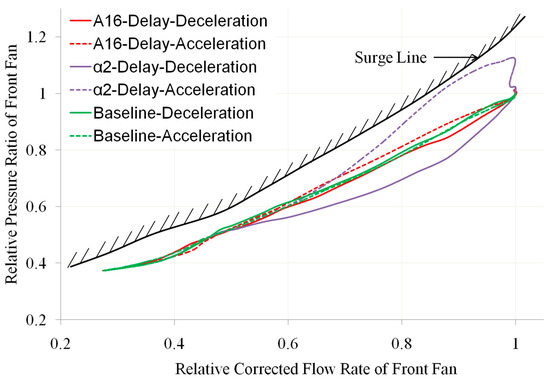
Figure 13.
Comparison of Front-Fan Operating Line with α2 Delay and A16 Delay (own editing).
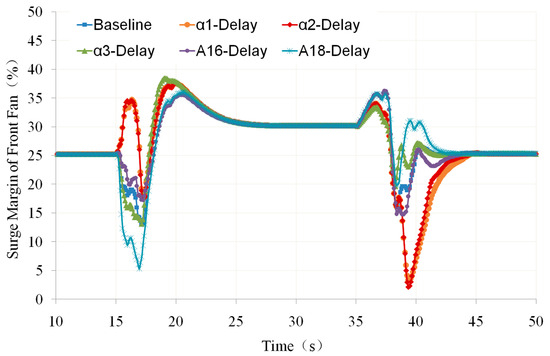
Figure 14.
Comparison of Front-Fan Surge Margin with Geometric Adjustment Mechanism Delay (own editing).
From these figures, it can be seen that compared to the baseline operating line:
- α1, α2, and A16 delays will cause the front-fan deceleration operating line to move down (toward the blockage boundary) and the acceleration operating line to move up (toward the surge boundary). In particular, the delay of α1 and α2 has a greater impact on the operating line of the front fan (as shown in the red curve in Figure 11 and the purple curve in Figure 13), causing a significant reduction in the surge margin of the front fan during the engine-acceleration process (as shown in the yellow and red curves in Figure 14, respectively). From Figure 14, it can be seen that during the acceleration process, when there is no delay in the geometric adjustment mechanism (baseline), the minimum surge margin of the front fan is about 15%, while when α1 or α2 is delayed, its minimum surge margin decreases to 2%.
- Both A18 and α3 delays cause the deceleration working line of the front fan to move up and the acceleration working line to move down (as shown in the purple lines in Figure 11 and Figure 12, respectively). In particular, the delay of A18 has a greater impact on the working line of the front fan, which greatly reduces the surge margin of the front fan during engine deceleration (as shown in Figure 14). From Figure 14, it can be seen that during the deceleration process, when there is no delay in the geometric adjustment mechanism (baseline), the minimum surge margin of the front fan is about 13%, while when A18 is delayed, its minimum surge margin decreases to 5%.
3.2.3. Aerodynamic Stability of Aft Fan
Figure 15, Figure 16, Figure 17 and Figure 18 show the changes in the operating line and surge margin of the aft fan compared to the baseline when there is a delay in one of the geometric adjustment mechanisms α1, α2, α3, A16, and A18. Among them, the horizontal and vertical axes of Figure 15, Figure 16 and Figure 17 are dimensionless based on the design points.
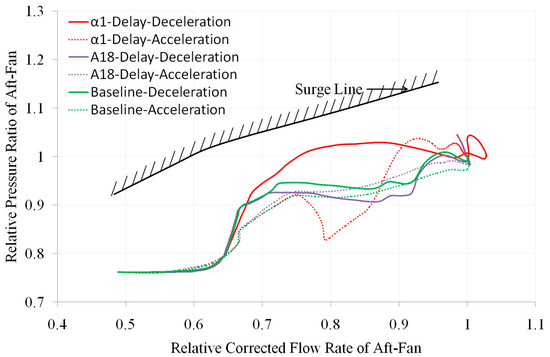
Figure 15.
Comparison of Aft-Fan Operating Line with α1 Delay and A18 Delay (own editing).
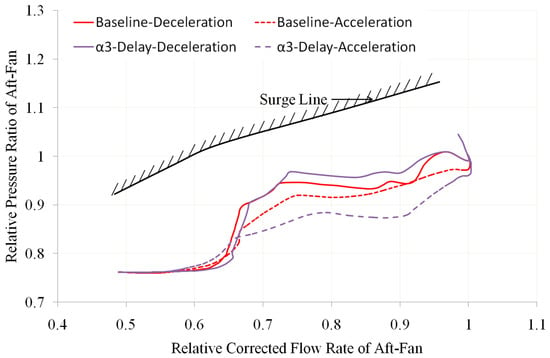
Figure 16.
Comparison of Aft-Fan Operating Line with α3 Delay (own editing).
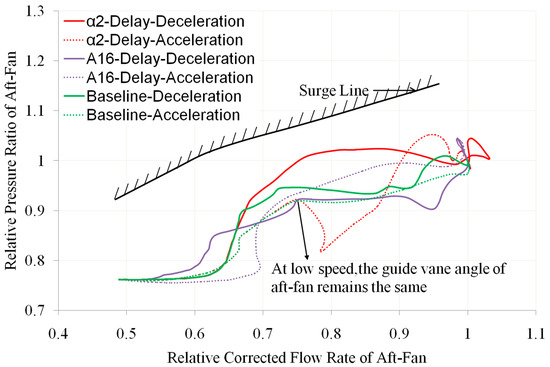
Figure 17.
Comparison of Aft-Fan Operating Line with α2 Delay and A16 Delay (own editing).
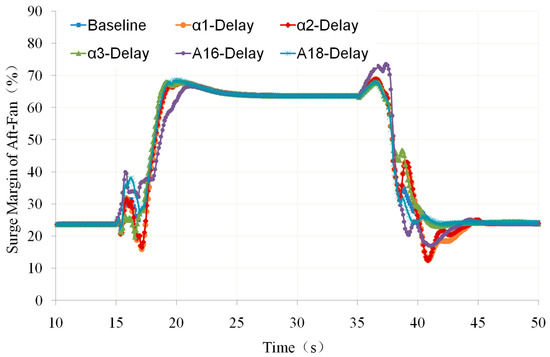
Figure 18.
Comparison of Aft-Fan Surge Margin with Geometric Adjustment Mechanism Delay (own editing).
From these figures, it can be seen that compared to the baseline operating line:
- When any one of the geometric adjustment mechanisms α1, α2, α3, A16, and A18 is delayed, it will not cause a significant decrease in the surge margin of the aft fan. Throughout the acceleration and deceleration process, the aft fan has a sufficient surge margin, all above 10% (as shown in Figure 18). Although the delay of the geometric adjustment mechanisms will not reduce the surge margin of the aft fan to an unacceptable level, due to the generally lower design pressure ratio of the aft fan, if its operating line deviates significantly to the lower right, it may lead to issues with its stable operation and overall engine performance matching.
- From Figure 15 and Figure 17, it can be seen that during the acceleration process, there is a sudden decrease in the operating line of the aft fan when there is a delay in α1 or α2 (as shown by the red dashed line in these two figures). This is because the guide vane angles of the front fan and aft fan remain unchanged over a wide range of speeds. When the engine accelerates rapidly, the inlet flow rate of the HP compressor changes rapidly, while the guide vane angle of the front fan or aft fan remains at the minimum flow capacity position, resulting in a mismatch between the flow rate of the aft fan and the HP compressor.
3.2.4. Aerodynamic Stability of HP Compressor
Figure 19, Figure 20, Figure 21 and Figure 22 show the changes in the operating line and surge margin of the HP compressor compared to the baseline when there is a delay in one of the geometric adjustment mechanisms α1, α2, α3, A16, and A18. Among them, the horizontal and vertical axes of Figure 19, Figure 20 and Figure 21 are dimensionless based on the design points.
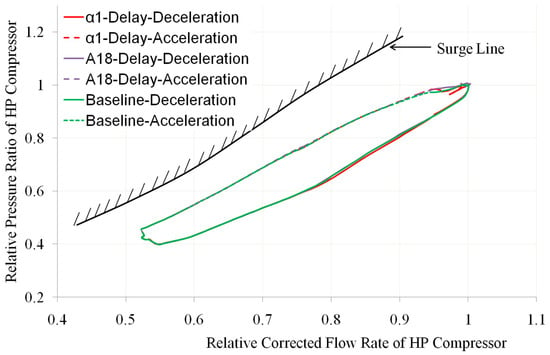
Figure 19.
Comparison of HP Compressor Operating Line with α1 Delay and A18 Delay (own editing).
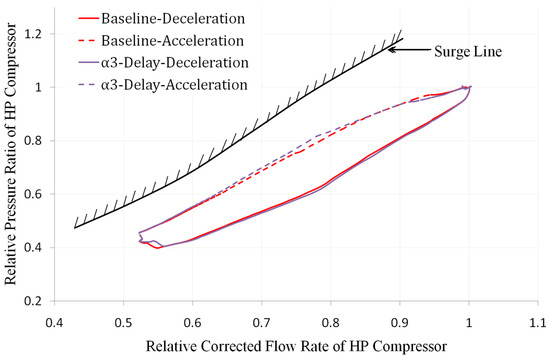
Figure 20.
Comparison of HP Compressor Operating Line with α3 Delay (own editing).
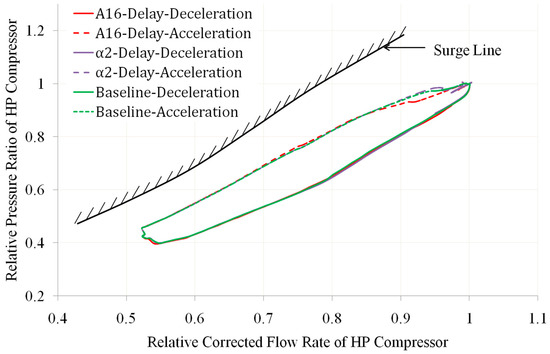
Figure 21.
Comparison of HP Compressor Operating Line with α2 Delay and A16 Delay (own editing).
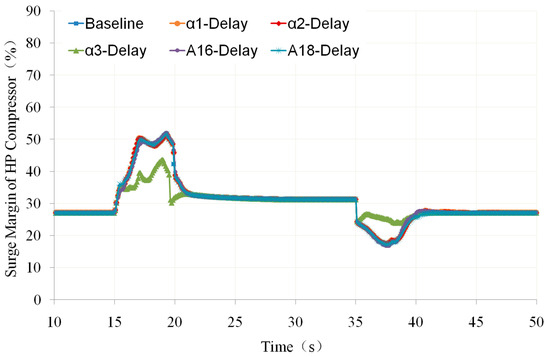
Figure 22.
Comparison of HP Compressor Surge Margin with Geometric Adjustment Mechanism Delay (own editing).
From these figures, it can be seen that the delays of the geometric adjustment mechanisms have little effect on the working line and surge margin of the HP compressor. When there is a delay in the geometric adjustment mechanism, the working line basically coincides with the baseline. Among these geometric adjustment mechanisms, when there is a delay in α3, the impact on the working line and surge margin of the HP compressor during acceleration and deceleration is relatively significant. The reason for these phenomena is that the operating line and surge margin of the HP compressor are mainly affected by the flow capacity of the HP turbine throat. When the area of the HP turbine throat remains unchanged, the changes in flow rate of the geometric mechanisms α1 and α2 located in front of the HP compressor and the geometric mechanisms A16 and A18 located in the outer bypass have little effect on it.
3.2.5. Result Analysis
According to the results of the above analysis, the delay of the geometric adjustment mechanism has a small impact on the working characteristics of the HP compressor, while it has a significant impact on the working characteristics of the front fan and aft fan. For example, A18 delay significantly reduces the front-fan surge margin during engine deceleration, while α1 and α2 delays will significantly reduce the front-fan surge margin during engine acceleration.
The reason for these phenomena lies in the different ways in which the delay of the geometric adjustment mechanism affects the working characteristics of the compression components:
- The delay of the guide vanes α1, α2, and α3 of the three compression components affects the working characteristics of the aft-an. The main reason is that after the delay of the guide vanes, it will cause a large deviation in the flow into the throttle surface of the core flow channel, resulting in a change in the equivalent flow area of the throttle position and, ultimately the deviation of its working line. For example, if there is a delay in one of α1, α2, and α3 during the deceleration process, the flow entering the throttle position in the core flow channel increases, resulting in a decrease in the current flow area at the throttle position and an increase in the back pressure at the rear fan outlet, therefore causing the working line to move upwards. The analysis of the acceleration process is the opposite.
- The main reason for the influence of the guide vane angles α1, α2, and α3 of the compression components on the working characteristics of the front fan is that when one of the angles is delayed, the flow capacity of the aft fan and the matching of high- and low-pressure rotor-speed change, resulting in changes in the working line of the front fan.
- A16 delay directly affects the working line of the aft fan and then indirectly affects the working line of the front fan through the flow capacity of the aft fan.
- The delay of A18 directly affects the working line of the front fan, and the control mechanism of the low-pressure rotor by the throat area of the nozzle further affects the working line of the aft fan.
4. Mode-Switching Characteristics
As mentioned earlier, an adaptive cycle engine has two operating modes: the thrust priority mode and the SFC priority mode. When the aircraft needs to fly at high speed, the engine is in the thrust priority mode, and when the aircraft needs to cruise, the engine is in the SFC priority mode. Therefore, for ACE studied in this paper, the transient characteristics also include the transition between these two modes. An important task in studying the characteristics of mode switching is to obtain control logic that enables the engine to transition smoothly and ensures that the thrust after conversion does not undergo significant changes compared to before conversion. However, based on the matching of the three-stream ACE in two operating modes, to ensure mode switching at the same thrust, N1r, N2r, α2, A16, and A18 all need to be changed. For example, when switching from SFC priority mode to thrust priority mode, it is necessary to reduce N1r and A18 (as shown in Figure 23 and Figure 24) and increase N2r and A16 (as shown in Figure 25 and Figure 26). The horizontal and vertical axes of these figures are dimensionless based on the design points.
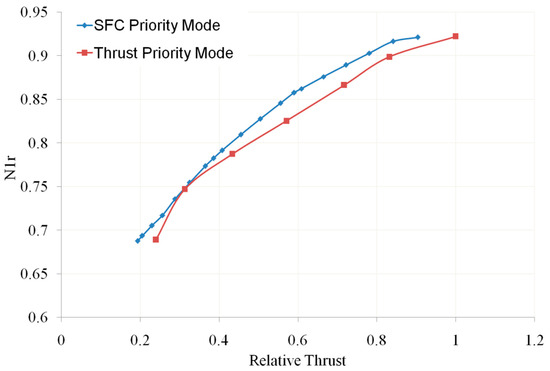
Figure 23.
Relative Corrected LP Rotor Speed vs. Relative Thrust (own editing).
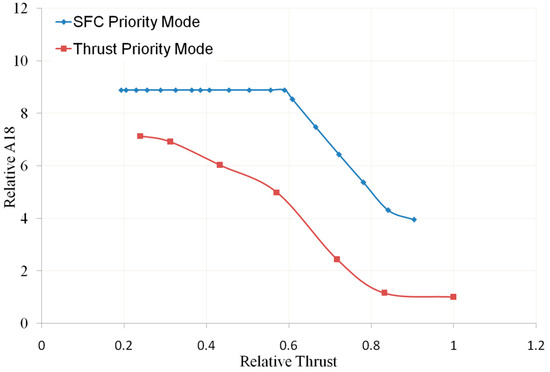
Figure 24.
Relative A18 vs. Relative Thrust (own editing).
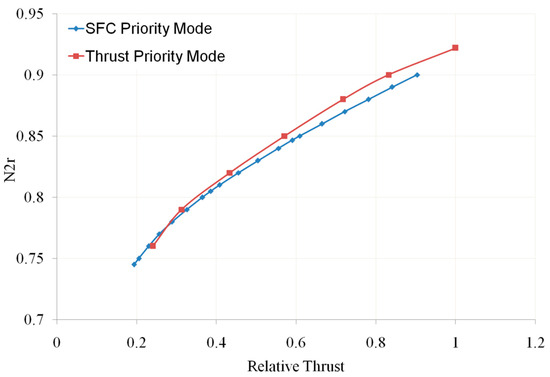
Figure 25.
Relative Corrected HP Rotor Speed vs. Relative Thrust (own editing).
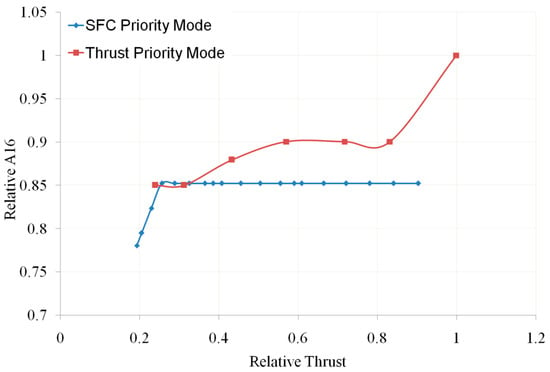
Figure 26.
Relative A16 vs. Relative Thrust (own editing).
From these figures, it can be seen that the changes in the direction of the HP rotor speed and the LP rotor speed under the two working modes are opposite. If the N1r corresponding to the current time of N2r is used as the control target for A8, then during mode switching, the A8 regulation oscillation caused by the non-monotonic and rapid changes in the given N1r will cause significant fluctuations in important engine parameters, such as thrust. To solve this problem, a mode-switching control scheme was proposed, which gives two sets of throttle lever control laws, and when the engine receives a mode-switching command, the two sets of throttle lever control laws switch at a certain rate while giving the rate of change in N1r. The calculation process of this control logic is shown in Figure 27, and the corresponding description is as follows:
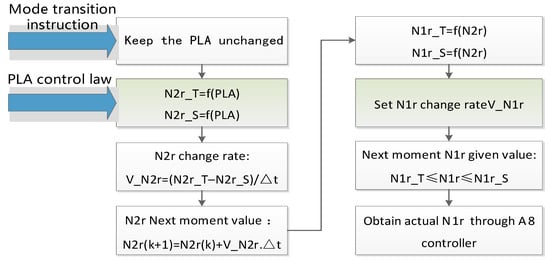
Figure 27.
Rotor Speed Control Logic during Mode Switching (own editing).
- The model receives a mode-transition instruction.
- Based on the power level angle (PLA) at time , obtain the relative corrected speeds of the HP rotor in thrust priority mode and SFC priority mode, denoted as and , respectively.
- According to Equations (9) and (10), give the change rate of and the given value of at the next time, respectively:
- Obtain the corrected speed of the low-pressure rotor under two operating modes based on interpolation, denoted as and .
- Set the change rate for the given value of to be between and as the variable for iteratively solving the primary-nozzle area.
- Interpolate each geometric adjustment mechanism according to the time sequence to obtain the geometric position of the next moment.
The engine mode-transition characteristics were calculated using this method, and the control laws formulated during the calculation are shown in Figure 28, Figure 29, Figure 30, Figure 31 and Figure 32. The obtained thrust-variation characteristic during mode switching is shown in Figure 33. Among them, except for Figure 30, the vertical axes of other figures are dimensionless based on the design points. In Figure 30, the vertical axis is a percentage, defined as 100% when the guide vanes are fully open and 0 when the guide vanes are closed to the minimum.
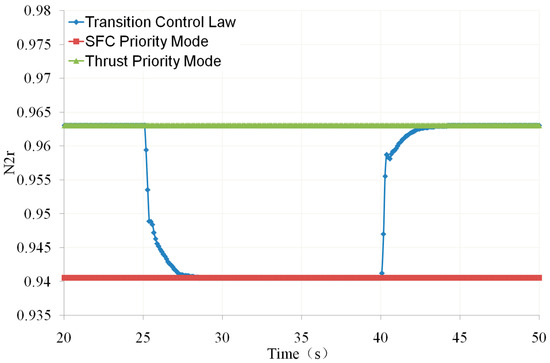
Figure 28.
Relative Corrected HP Rotor Speed vs. Time (own editing).
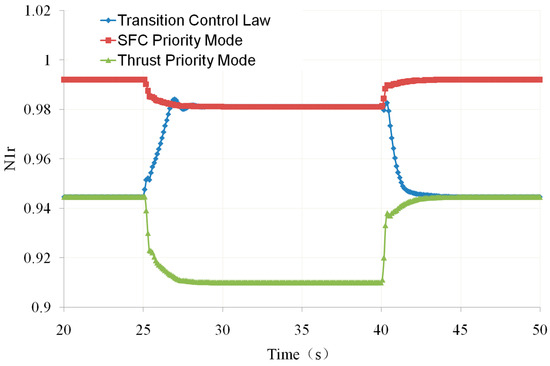
Figure 29.
Relative Corrected LP Rotor Speed vs. Time (own editing).
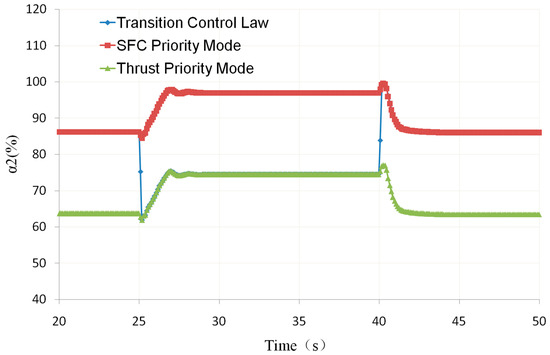
Figure 30.
α2 vs. Time (own editing).
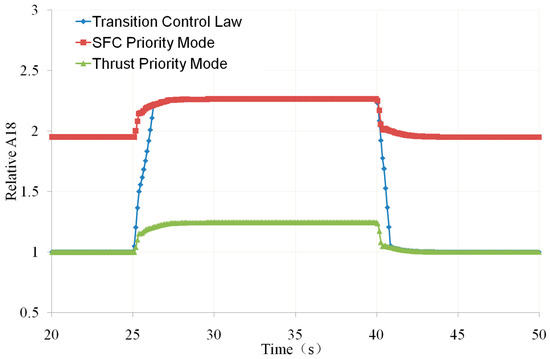
Figure 31.
Relative A18 vs. Time (own editing).
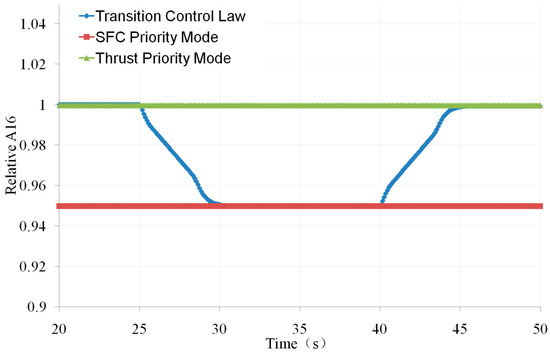
Figure 32.
Relative A16 vs. Time (own editing).
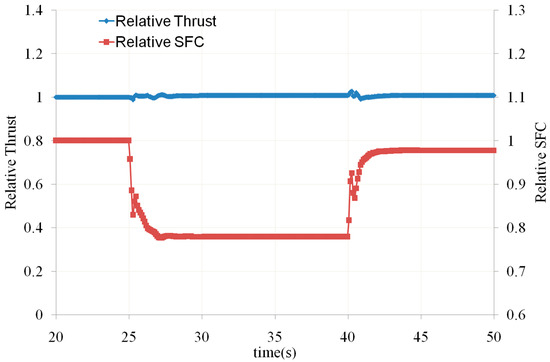
Figure 33.
Relative Thrust vs. Time (own editing).
From Figure 33, it can be seen that the control method proposed in this article can control the thrust fluctuation within 1% during the mode-conversion process, achieving smooth conversion.
5. Conclusions
This article establishes a transition-state performance calculation model for the three-stream ACE, mainly discusses the acceleration and deceleration characteristics of the engine when there is a delay in the geometric adjustment mechanism, and proposes a speed control method with equal-thrust mode-switching requirements. The specific conclusion can be summarized as follows:
- The response speed of A8 to the LP rotor speed has a significant impact on the trend of changes in the operating line of the aft fan. If the A8 responds slowly during the acceleration process, the operating line of the aft fan will shift significantly downwards, which may have adverse effects on the stable operation of the rear fan and engine matching.
- The delay of the geometric adjustment mechanism affects the operating lines of the front fan and aft fan, therefore causing changes in their surge margin. Especially when A18 is delayed, the minimum surge margin of the front fan during deceleration decreases from 13% to 5%. When there is a delay α1 or α2, the minimum surge margin of the front fan during the acceleration process is reduced from 15% to 2%. The decrease in surge margin will limit the acceleration and deceleration time of ACE.
- The mode-conversion process control method proposed in this paper, along with the established control laws, ensures that the thrust fluctuation is within 1% during the conversion process, achieving smooth conversion.
- The above research results can provide support for the geometric adjustment mechanism motion design, acceleration and deceleration control law design, transition-state test-performance debugging, and control system architecture design of the three-stream adaptive cycle engine.
There are many geometric adjustment mechanisms in adaptive cycle engines, and to operate these mechanisms, more power needs to be extracted from the engine. If the engine cannot meet the required power, the response of the geometric adjustment mechanism will inevitably be affected. Meanwhile, its time constant and delay time are related to the engine operating state and fuel system design results. When studying the influence of geometric adjustment mechanism dynamic response on engine transition characteristics in this article, the time constant and delay time used are fixed values, which may have a certain impact on the accuracy of the results listed in the article.
Author Contributions
Conceptualization, J.H. and W.W.; Data curation, Q.Y. and W.W.; Formal analysis, Q.Y.; Funding acquisition, W.W.; Investigation, Q.Y.; Methodology, Q.Y. and B.G.; Project administration, W.W.; Resources, J.H.; Software, Q.Y. and B.G.; Supervision, J.H.; Validation, W.W.; Visualization, Q.Y. and B.G.; Writing—original draft, Q.Y.; Writing—review and editing, Q.Y., W.W., and B.G. All authors have read and agreed to the published version of the manuscript.
Funding
This research was funded by the National Science and Technology Major Project, grant number J2019-I-0011-0011.
Data Availability Statement
The data presented in this study are available on request from the corresponding author. The data are not publicly available due to the intellectual property rights of numeric simulation code and the confidentiality of some data.
Acknowledgments
We are very grateful for the support provided by Baofeng, T. from Nanjing University of Aeronautics and Astronautics.
Conflicts of Interest
The authors declare no conflict of interest.
References
- GE Aviation. GE’s Adaptive Cycle Engine. 2021. Available online: https://www.geaviation.com/military/engines (accessed on 29 July 2021).
- Chris, K. GE Aviations US Fighter Engine. AIR Int. 2015, 1, 84–89. [Google Scholar]
- Sun, M.; Liang, C.; Suo, D.; Liu, D. Analysis of U.S. sixth generation fighter engine progresses. Aeroengine 2021, 47, 1–7. [Google Scholar]
- GE Aviation. Testing on GE’s First XA100 Adaptive Cycle Engine Concludes, Proves out Transformational Capabilities. 2021. Available online: https://blog.geaviation.com/technology (accessed on 13 May 2021).
- Patel, H.R. Parametric Cycle Analysis of Adaptive Cycle Engine. Master’s Thesis, The University of Texas at Arlington, Arlington, TX, USA, 2016. [Google Scholar]
- Simmons, M.S. Design and Control of a Variable Geometry Turbofan with an Independently Modulated Third Stream. Ph.D. Thesis, The Ohio State University, Columbus, OH, USA, 2009. [Google Scholar]
- Meng, X.; Zhu, Z.L.; Chen, M. Steady-State Performance Comparison of Two Different Adaptive Cycle Engine Configurations. In Proceedings of the 53rd AIAA/SAE/ASEE Joint Propulsion Conference, Atlanta, GA, USA, 10–12 July 2017. [Google Scholar]
- Li, R.; Wang, J.; Wu, M. Performance Advantage Evaluation Method of Adaptive Variable Cycle Engine. Aeroengine 2021, 47, 17–21. [Google Scholar]
- Chen, M.; Zhang, J.; Tang, H.; Zhu, Z. Discussion on overall performance design technology of adaptive cycle engine. J. Aerosp. Power 2022, 37, 2046–2058. [Google Scholar]
- Meng, X.; Zhu, Z.; Chen, M.; Xu, Y. A Matching Problem between the Front Fan and Aft Fan Stages in Adaptive Cycle Engines with Convertible Fan Systems. Energies 2021, 14, 840. [Google Scholar]
- Zheng, J.; Chen, M.; Tang, H. Matching mechanism analysis on an adaptive cycle engine. Chin. J. Aeronaut. 2017, 30, 706–718. [Google Scholar]
- Zheng, J.; Tang, H.; Chen, M.; Zhang, Y.J.; Zhuge, W.L. Operating Modes Performance Comparison Research in Typical Working Conditions on an Adaptive Cycle Engine. J. Eng. Thermophys. 2022, 43, 1743–1750. [Google Scholar]
- Ma, S.; Tan, J.; Wang, G.; Zhang, Z. Study on Characteristics Optimization of Adaptive Cycle Engine Based on Aircraft-Engine Integrated Analysis. J. Propuls. Technol. 2018, 39, 1703–1711. [Google Scholar]
- Wang, Y.; Chen, H.; Zhang, H. Research on Adaptive Cycle Engine Inlet/Engine Matching for Cruise Mission. Acta Aeronaut. Astronaut. Sin. 2024, 45, 128637. [Google Scholar]
- Xu, Y.; Tang, H.; Chen, M. Design method of optimal control schedule for the adaptive cycle engine steady-state performance. Chin. J. Aeronaut. 2022, 35, 148–164. [Google Scholar]
- Li, Y.; Nie, L.; Mou, C.; Song, Z. Online Intelligent Optimization Algorithm for Adaptive Cycle Engine Performance. J. Propuls. Technol. 2021, 42, 1716–1724. [Google Scholar]
- Hao, W. Research on Performance Design and Control Schedule Optimization Method of Adaptive Cycle Engine. Ph.D. Thesis, Northwestern Polytechnical University, Xi’an, China, 2022. [Google Scholar]
- Zhang, X.; Wang, Z.; Ye, Y. Research on Performance Optimization of Adaptive Cycle Engine Based on Improved Multi-objective Particle Swarm Optimization. In Proceedings of the 2018 Joint Propulsion Conference, AIAA, Cincinnati, OH, USA, 9–11 July 2018. [Google Scholar]
- Goriberk, F.D.; Gulevich, O.C. Optimizing Transition State Control to Improve the Life of High Temperature Gas Turbine Engines. Gas Turbine Test. Res. 1998, 11, 6–8. [Google Scholar]
- Khalid, S.J. Role of Dynamic Simulation in Fighter Engine Design and Development. In Proceedings of the 25th Joint Propulsion Conference, American Institute of Aeronautics and Astronautics (AIAA), Monterey, CA, USA, 10–13 July 1989. [Google Scholar]
- Corbett, M.W. Large-Scale Transient Loading of a Three Stream Variable Cycle Engine. In Proceedings of the 48th AIAA/ASME/SAE/ASEE Joint Propulsion Conference, Atlanta, GA, USA, July 30–1 August 2012. [Google Scholar]
- Meng, X.; Yang, X.; Chen, M. High-Level Power Extraction from Adaptive Cycle Engine for Directed Energy Weapon. In Proceedings of the 2018 Joint Propulsion Conference, Cincinnati, OH, USA, 9–11 July 2018. [Google Scholar]
- Rober, W.B. Dynamic Modeling and Simulation of a Variable Cycle Turbofan Engine with Controls. Master’s Thesis, Wright State University, Dayton, FL, USA, 2015. [Google Scholar]
- Jia, L.Y.; Chen, Y.C.; Tan, T.; Li, M.; Gu, B. Analysis for Influence of Variable Geometry Parameters on Transition State Performance of Variable Cycle Engine. J. Propuls. Technol. 2020, 41, 1681–1691. [Google Scholar]
- Yang, Y. Research on Modeling and Control Law of Adaptive Cycle Engine. Master’s Thesis, Nanjing University of Aeronautics and Astronautics, Nanjing, China, 2017. [Google Scholar]
- Gao, G. Research on Adaptive Cycle Engine Modeling and Mode Switching Control Schemes. Master’s Thesis, Nanjing University of Aeronautics and Astronautics, Nanjing, China, 2021. [Google Scholar]
- Zhang, X.; Wang, Z.; Zhou, H. Analysis on Characteristics of Mode Transition Performance of Variable Cycle Engine with FLADE. J. Propuls. Technol. 2018, 39, 14–22. [Google Scholar]
- Zheng, J.; Luo, Y.; Tang, H. Design Method Research of Mode Switch Transient Control Schedule on Adaptive Cycle Engine. J. Propuls. Technol. 2022, 43, 210607. [Google Scholar]
- Hao, W.; Wang, Z.; Zhang, X.; Zhou, L.; Wang, J. Mode Transition Modeling and Control Law Design Method of Variable Cycle Engine. J. Propuls. Technol. 2022, 43, 210058. [Google Scholar]
- Hao, W.; Wang, Z.; Zhang, X.; Zhang, M. A New Design Method for Mode Transition Control Law of Variable Cycle Engine. In Proceedings of the 2018 Joint Propulsion Conference, Cincinnati, OH, USA, 9–11 July 2018. [Google Scholar]
- Liu, J.; Wang, Z.; Yan, W. Numerical Simulation of Transition Between Single and Double Bypass Mode. J. Propuls. Technol. 2017, 38, 1699–1708. [Google Scholar]
- Liu, B.; Wang, R.; Ling, C.; Yu, X.; Wang, J.; An, G. A CFD Model for Bypass Flow in Variable Cycle Engine Compression Systems and Criterion to Predict Flow Recirculation During Mode Transition. J. Propuls. Technol. 2021, 42, 1976–1984. [Google Scholar]
- Wang, X.Y.; Su, S.M.; Lian, X.C. Numerical simulation of turbofan engine with mixer afterburning under transient conditions. J. Propuls. Technol. 2002, 23, 189–192. [Google Scholar]
- Zhang, X.; Li, Y.; Sui, Y. The Study of Two Method for Numerical Simulation of Turbofan Engine with Mixer under Transient Conditions. In Proceedings of the 8th Power Annual Conference of the Chinese Aeronautical Society, Beijing, China, 17–18 September 2014. [Google Scholar]
- Huang, K.M.; Huang, J.Q.; Liu, J.; Zhou, J.B. An Aeroengine Real Time Model Based on Non-Iterative Method. Aeroengine 2004, 30, 35–38. [Google Scholar]
- Xie, Z.; Guo, Y.; Li, R. Improvement of Utilizing Volume Method in Mixed Flow Turbofan Engine Modeling. Aeronaut. Comput. Tech. 2015, 45, 10–13. [Google Scholar]
- Tang, S.; Tong, W. Turbofan engine transient modeling based on inter-component volume method. J. Aerosp. Power 2013, 28, 709–713. [Google Scholar]
- Xie, Z.-W.; Guo, Y.-Q.; Lu, J. Application of Volume and Rotor State Values in Variable Cycle Engine Numerical Simulation. J. Propuls. Technol. 2015, 36, 1085–1092. [Google Scholar]
- Yao, H. Full Authority Digital Electronic Control System for Aero-Engine, 1st ed.; Aviation Industry Press: Beijing, China, 2014; pp. 230–237. [Google Scholar]
- Li, X.; Che, G.; Ouyang, J.; Feng, J. Computing Method, 2nd ed.; Northwestern Polytechnical University Press: Xi’an, China, 2010; pp. 184–188. [Google Scholar]
Disclaimer/Publisher’s Note: The statements, opinions and data contained in all publications are solely those of the individual author(s) and contributor(s) and not of MDPI and/or the editor(s). MDPI and/or the editor(s) disclaim responsibility for any injury to people or property resulting from any ideas, methods, instructions or products referred to in the content. |
© 2023 by the authors. Licensee MDPI, Basel, Switzerland. This article is an open access article distributed under the terms and conditions of the Creative Commons Attribution (CC BY) license (https://creativecommons.org/licenses/by/4.0/).