1. Introduction
Currently, the electrical power system (EPS) seeks to satisfy the electrical demand by optimizing its technical and economic resources, guaranteeing reliability and security in the power supply. Inadequate management in transmitting reactive power to the load centers has a detrimental effect on EPS stability [
1,
2]. Thus, optimal reactive power dispatch (ORPD) becomes essential to maintain optimal system operation by managing the reactive power flow [
3].
Among the main processes to be considered in power systems is the voltage stability of the EPS, for which optimal power flows, optimal line switching, system restoration, and the location of compensation elements, among other techniques that can be applied, are analyzed [
4,
5]. All of these methodologies have a direct impact on EPS losses and reactive dispatch.
ORDP is a nonlinear optimization problem, a subproblem of OPF models [
6]. One of the main objectives of the ORPD is to perform an optimal adjustment in the control variables, such as the reactive power of the compensators, the terminal voltage of the generators, and the transformer taps, thus allowing us to minimize the active power losses in the transmission lines, minimize voltage variations, and maximize the voltage stability of the EPS [
7], with the latter considering that the main objective is voltage stability.
For example, to reduce losses in power systems, a metaheuristic is presented in [
8], in which they compare the efficiency of placing reactive compensation in power grids while taking care not to reduce the power factor. The authors also compare Particle Swarm Optimization (PSO), the Parasitism Predation Algorithm (PPA), and the Tunicate Swarm Algorithm (TSA), with the latter algorithm being the one recommended by the authors.
To analyze multi-objective problems of the NP-hard type, it is necessary to develop methodologies that relax the optimization problem. The authors in [
9] show how the metaheuristics analyzed in two stages help to solve this type of problem, so that when analyzing each objective function, different results are obtained, to which the Pareto principle is applied to obtain a global optimum.
Coincidentally, the Pareto principle is employed to solve multi-objective optimization problems, as presented by the authors in [
10], whose research to locate compensators in the power system relaxes the optimization problem regardless of the number of EPS nodes.
The mathematical optimization of the ORPD is considered a mixed integer nonlinear programming problem (MINLP) because it has continuous variables and discrete variables, where the reactive power output of the generators and the voltage magnitude at the busbars are continuous variables. In contrast, the reactive compensators and transformer taps are discrete variables [
11,
12]. The continuous improvement in the control variables, and hence, the operational levels of the entire EPS, has changed the ORPD problem from a single-objective problem to a multi-objective optimization problem [
13]. In the present investigation, we have a multi-objective optimization problem by considering the minimization of active power losses in transmission lines and the total cost as objective functions.
In recent years, different methodologies have been developed for the ORPD problem, so a series of algorithms that seek to improve the solution to this problem have emerged. In [
14], the ORPD problem is solved via the Fractional Particle Swarm Optimization Gravitational Search Algorithm (FPSOGSA), which integrates the Particle Swarm Optimization (PSO) algorithm and the Gravitational Search Algorithm (GSA) to improve the solution time and guarantee the convergence of the problem, minimizing the active power losses and voltage variations (voltage deviation). In [
15], the authors solve the ORPD problem by considering the uncertainty of solar irradiance and wind speed regarding integrating renewable energy sources.
In [
16], the ORPD problem is solved via a Gray Wolf Optimization (GWO), which offers a hierarchical approach to the decision variables, allowing us to minimize the active power losses in the transmission lines, voltage variations, voltage stability indexes, and energy costs. In [
17], the authors solve the ORPD problem by employing a Backtracking Search Optimizer (BSO), which is a population-based evolutionary algorithm with a simple structure and a single control parameter, where the dependent variables that are part of the problem constraints are included in the objective function using quadratic constraint terms.
Also, in [
18], an optimal reactive power flow is presented using multi-objective mathematical programming based on the Grey wolf optimizer (GWO), where the total cost, the active power losses considered in the ORPD, and the system loadability are considered as objective functions. The solution to this multi-objective problem is based on the
-constraint method that selects one of the objective functions as the main function, while the other objective functions are considered as new constraints of the problem and, through fuzzy decision making, gives priority to one of the objective functions to find a single solution to the whole problem.
In [
19], the ORPD is solved using a fuzzy adaptive particle swarm optimization configuration, which is an improvement of the classical particle swarm algorithm. The improvement of this algorithm is applied to a large-scale EPS by considering two objective functions to minimize active power losses and voltage variations, showing the supremacy of this algorithm in solving complex optimization problems and achieving improved computational efficiency.
On the other hand, in [
20], the ORPD is performed with emphasis on the integration of renewable energy resources, seeking to reduce the dependence on conventional energy resources, taking into account the uncertainties of solar and wind energy resources as well as the power demand, of which it uses an improved version of the optimization technique conceptualized from lightning phenomena (LAPO, Lightning attachment procedure optimization), which seeks to minimize two objective functions such as active power losses and voltage variations in the PQ load bars.
In [
21], the authors seek to improve the solution of the ORPD via the optimal placement of a Static Synchronous Series Compensator (SSSC), where the main objective of the SSSC is to provide a voltage control in series with the transmission line to control the active and reactive power flows in them, where the authors solve the ORPD with and without the SSSC controller to observe the improvements in each of the scenarios, minimizing active power losses and voltage variations and improving voltage stability.
Generally, the optimization problems are single objective, as the main proposal of this research is a multi-objective analysis for the solution of the optimal real and reactive power dispatch (ORRPD) problem, which considers the minimization of losses in the transmission lines and the minimization of generation costs to solve the optimization model using the epsilon constraint method. The results obtained will be compared with those provided via Digsilent Power Factory version 2023 SP5, considering this software can only perform single-objective studies.
3. Problem Formulation
Thus, the objective functions to be considered in the problem correspond to the active power losses in the transmission lines and the operating costs of the generators. Both objective functions are delimited via restrictions that keep the electrical system stable, such as the active and reactive power balance, the minimum and maximum limits of active and reactive power delivered via generators, and the voltage magnitude, angle, and loadability of transmission lines. For the minimum and maximum voltage magnitude limits, a range of 0.9 to 1.1 pu is considered, while a range of −0.6 to 0.6 rad, respectively, is considered for the angles.
To verify the proposed methodology, the IEEE 30-Bus test system will be used to address the reactive power minimization problem via four alternatives. The first alternative, case 1, will involve solving the Optimal Power Flow (OPF-AC). The second, case 2, will focus on minimizing losses in the system. The third, case 3, will aim to reduce the costs associated with power generation. Finally, a multi-objective optimization proposal will be implemented in case 4. The results obtained via the GAMS platform will be compared with simulations conducted in Digsilent Power Factory. This study will provide a comprehensive assessment of different optimization strategies in a 30-bus system, enabling the validation and comparison of the results obtained in both environments. These findings will be crucial for making informed decisions in the management of electrical systems.
The mathematical model of multi-objective optimization will be implemented for the IEEE 30-Bus System. Regarding the slack bus (reference bus), a voltage of 1.06 pu and an angle of 0 rad is considered. On the other hand, to transform the real values to pu or vice versa, a base power of 100 MVA is used.
Multi-objective mathematical programming considers more than one objective function. Usually, in its resolution, only one optimal solution is found that simultaneously satisfies all the objective functions to their minimum values in the case of a minimization problem.
3.1. -Constraint Method
Thus, a decision maker helps search for an optimal solution within a set of solutions, called the Pareto solution set, that shows the different feasible solutions [
25]. To generate the Pareto solution set, the
-constraint method is used, and for the selection of the best solution, the fuzzy satisfiability approach method is used. The mathematical formulation is posed as a mono-objective function (
17) subject to (
18).
where
is the primary objective function,
is the objective function added to the constraint set, and
is the value that constrains
according to the following Equation (
19).
where
and
are the minimum and maximum values of the objective function,
, when optimizing the objectives
and
individually, while
is the number of Pareto optimal solutions.
3.2. Fuzzy Satisfying Approach
This method allows us to find the best compromise solution from the Pareto solution set by assigning a linear membership function for the
solution of the
objective according to (
20) [
18], whose values are between 0 and 1.
Finally, to make the final decision, we try to maximize the minimum satisfaction of all the solutions, or in turn, we try to minimize the maximum dissatisfaction [
26]. In this way, the final solution can be found with the expression (
21), where
is the best compromise solution to the problem, simultaneously satisfying each objective function considered in the multi-objective optimization problem.
To solve the ORRPD problem, the General Algebraic Modeling System (GAMS) was used for the optimization, in which all the data of the power system under study and the different objective functions to be optimized were entered. The proposed multi-objective methodology sets the active power values via a traditional dispatch using an OPF to have a reactive dispatch of the generators that considers the minimization of losses in the lines and the minimization of costs.
As a next step, the problem was solved by first minimizing the objective function
, then minimizing the objective function
. By optimizing
and
separately, the optimal and unfavorable values for each objective are obtained, which allows us to establish a limit to restrict
. With
constrained,
is optimized again to form the Pareto optimal front. Finally, using the fuzzy satisficing method, a single compromise solution is selected that simultaneously satisfies the objective functions
and
, respectively, as shown in Algorithm 1.
| Algorithm 1 Multi-Objective Optimal Real and Reactive Power Dispatch |
- Step: 1
Input data EPS parameter setting Lines: and Generators: ,, and Loads: - Step: 2
Set active power dispatch save results - Step: 3
Minimize losses save results - Step: 4
Minimize cost save results - Step: 5
Find CS for
end for - Step: 6
Show results
|
4. Analysis of the Results
The multi-objective optimization of the ORRPD problem was performed in GAMS software version 27.3.0 and simulated in Digsilent Power Factory version 2023 SP5 to verify the results obtained, making use of an HP Intel(R) Xeon(R) CPU E3-1535M v5 @2.90 GHz 2.90 GHz computer with 64.00 GB RAM and a 64-bit operating system. A BONMIN solver using MINLP was used to solve the problem in GAMS.
ORRPD was analyzed in the IEEE 30 bus-bar test system. In the first instance (Case 2), the minimization of active power losses in transmission lines was analyzed. After that, the minimization of generation costs was analyzed (Case 3) in order to implement the then proposed methodology, which is the multi-objective optimization minimizing active power losses and generation costs (Case 4). All of these cases were compared with the traditional OPF-AC methodology (Case 1).
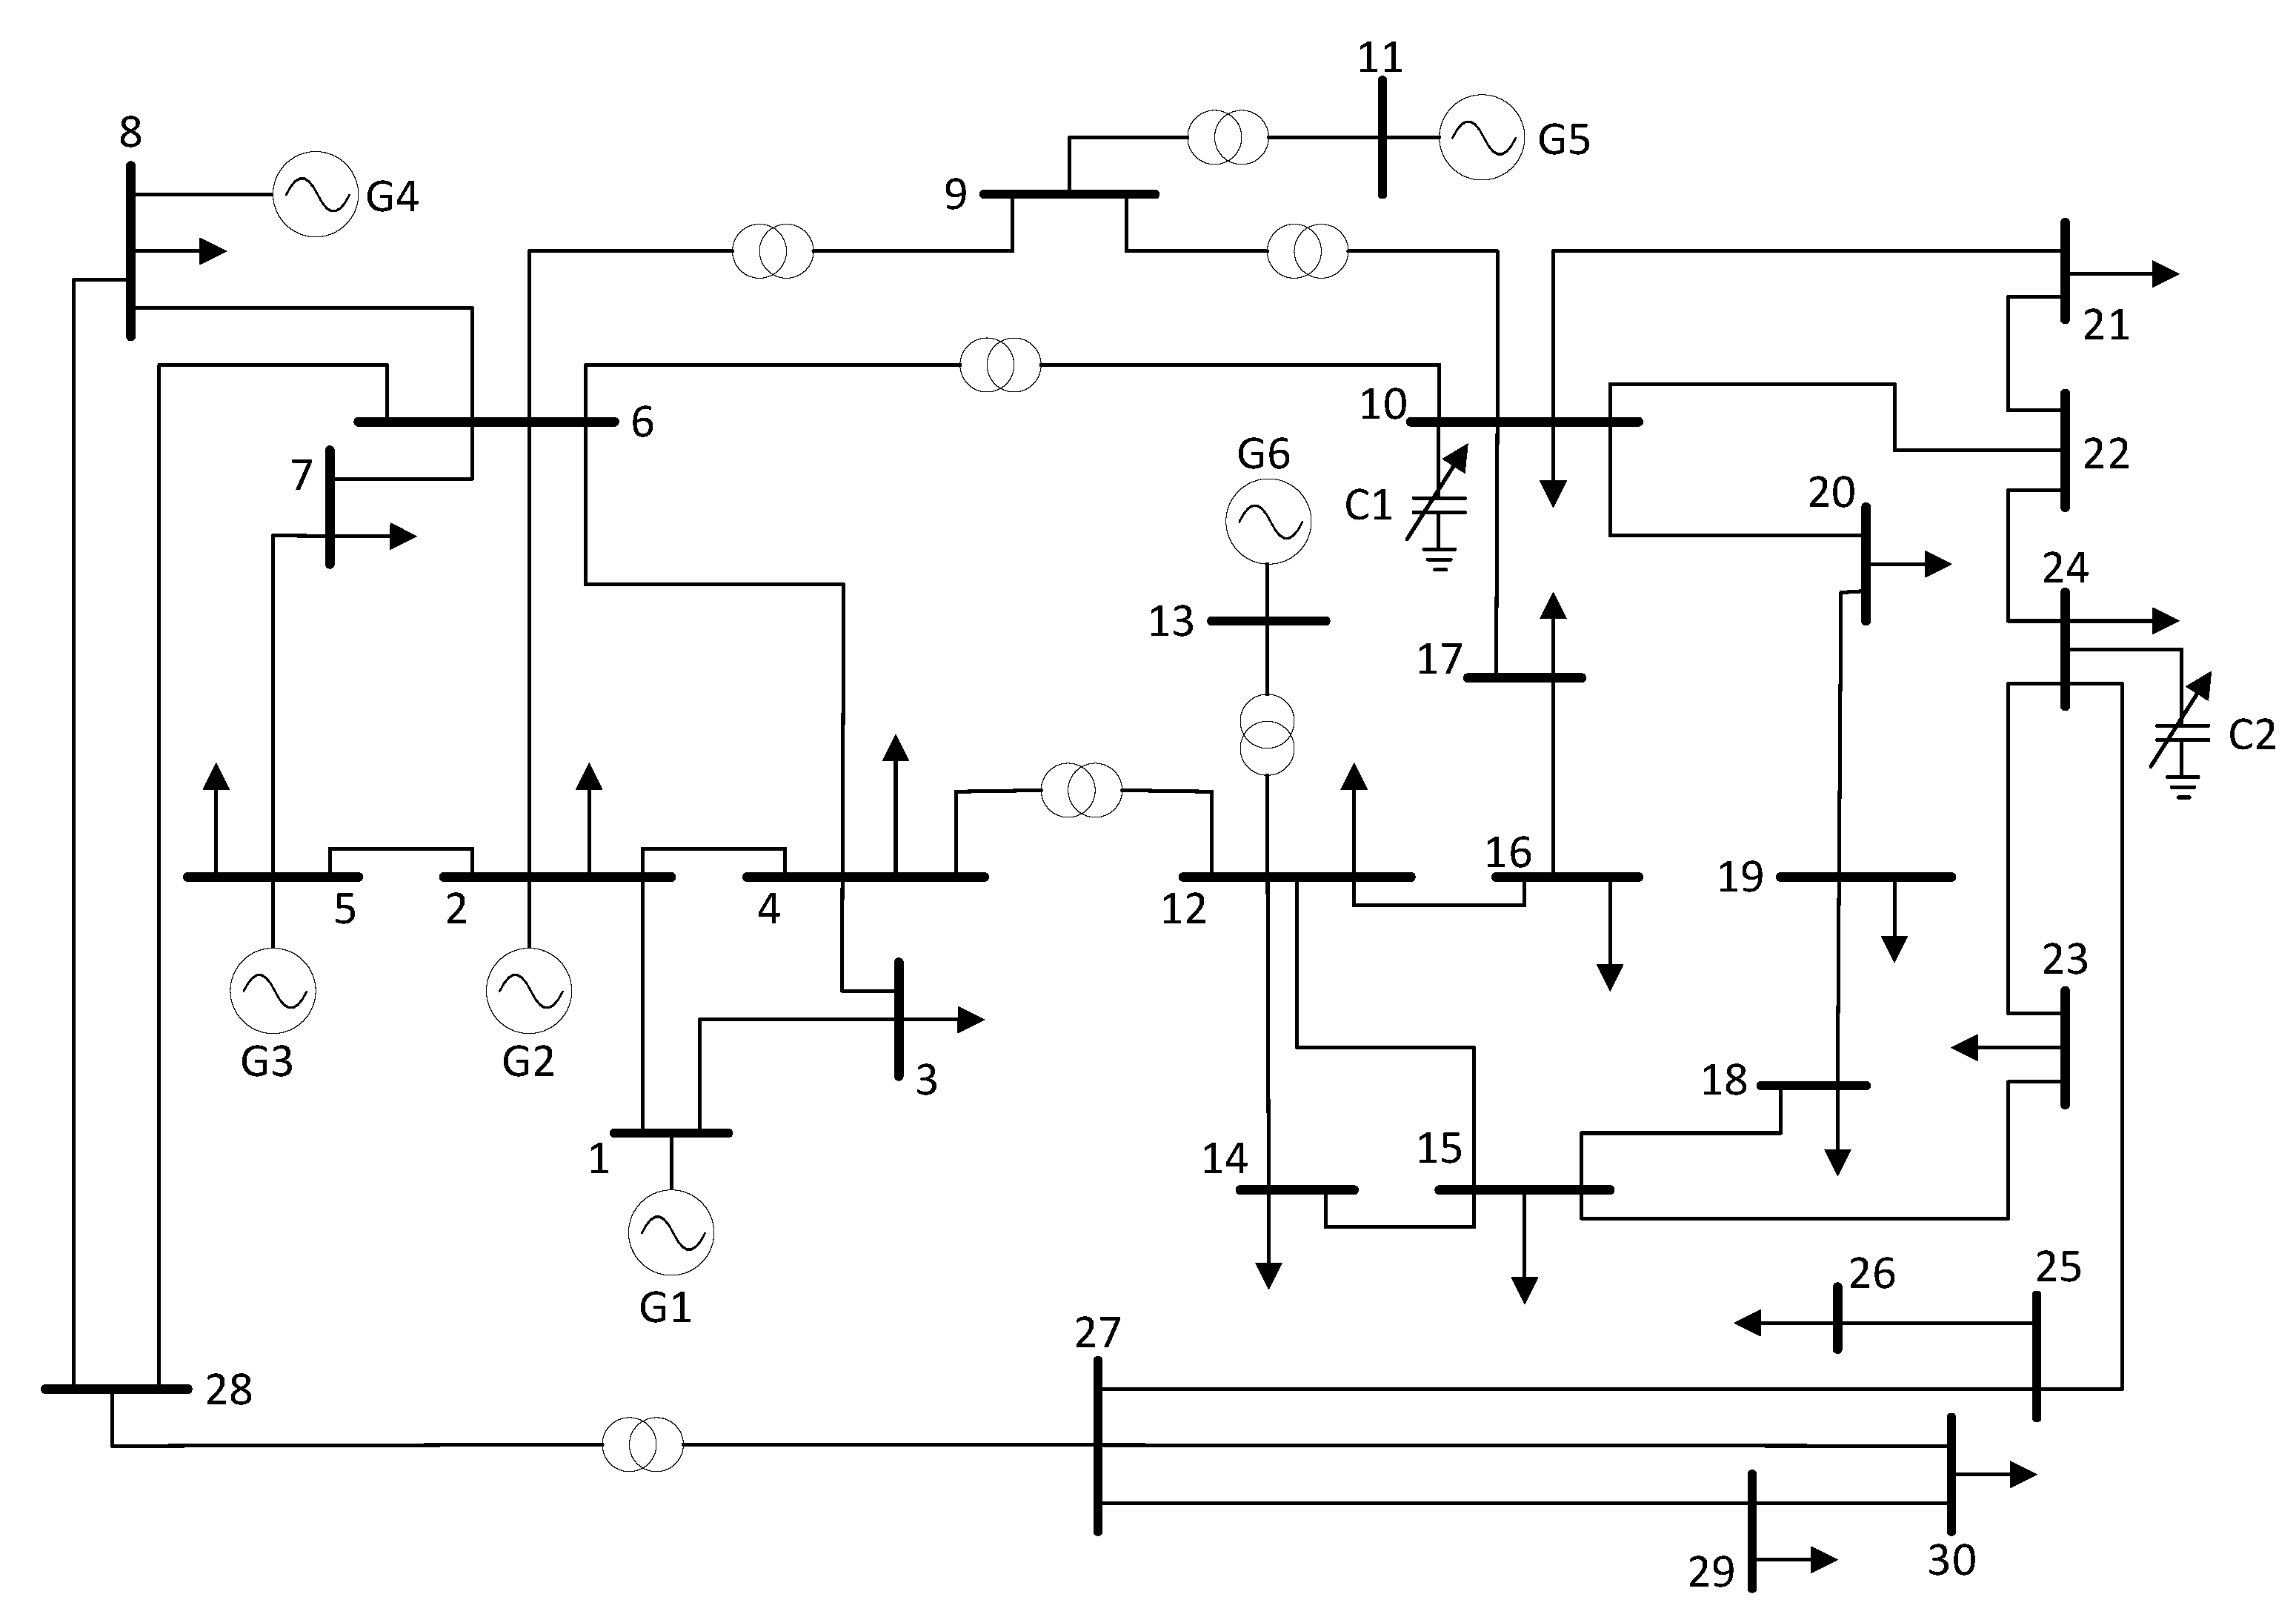
The IEEE 30-bus test system consists of a total of six generators, which are connected to busbars 1, 2, 5, 8, 11, and 13, respectively. In addition, it has 41 branches, of which 34 correspond to the transmission lines, while the remaining seven correspond to the transformers. There are also two shunt capacitor banks connected to busbars 10 and 24, where a capacity of 0.3 pu is considered, as in the 14-bus system.
Figure 2 shows the one-line diagram of the IEEE 30-bus test system, and their technical and economic data are shown in
Appendix A in
Table A1,
Table A2 and
Table A3.
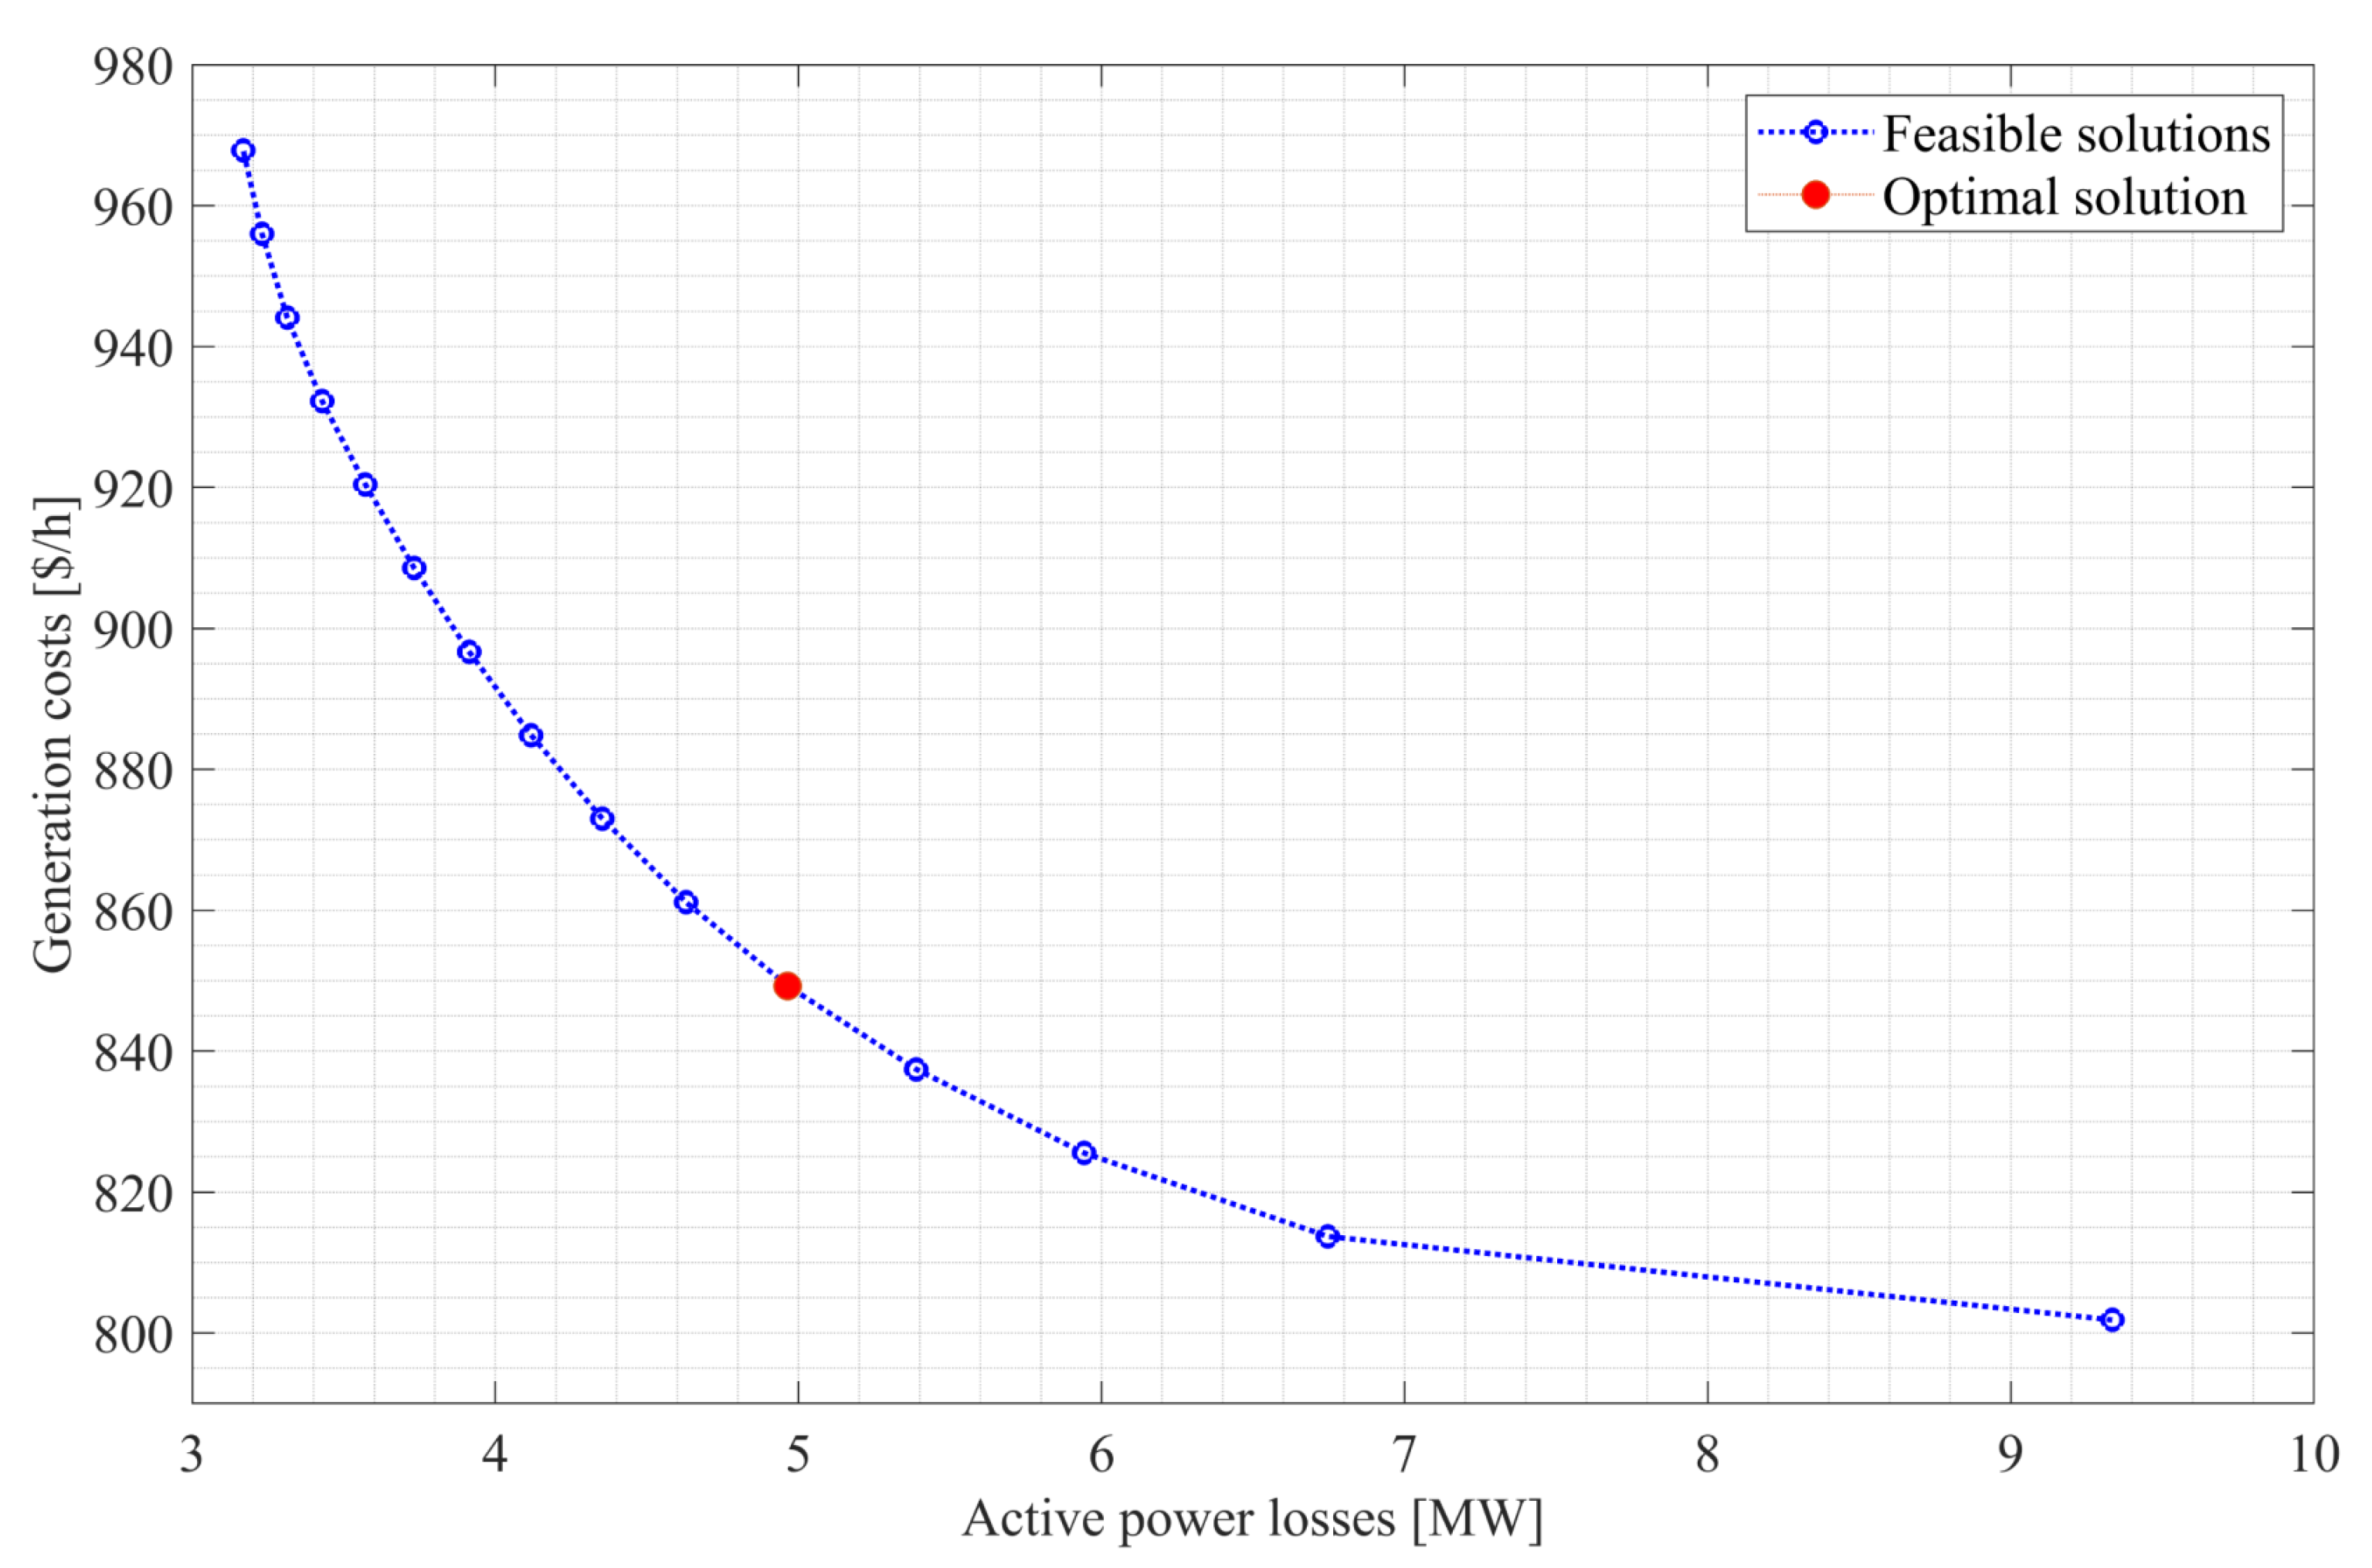
Table 1 shows the results of the multi-objective optimization for the 30-bus system that makes up the Pareto optimal front, where maximizing the minimum satisfaction of all solutions yielded a value of 0.709, corresponding to solution s5.
Figure 3 shows the Pareto optimal front where it can be observed that the optimal solution equitably satisfies both objective functions, resulting in total losses of 4964 MW and total generation costs of 849,266 USD/h. According to
Figure 3 of the Pareto optimal front for the case of IEEE 30-Bus System, the central system operator can select some other feasible solution that places greater emphasis on either loss or cost reduction. Thus, if solution s6 is selected, the losses would be 4.629 MW, reducing to 0.335 MW concerning solution s5, but increasing the cost by 11,856 USD/h. On the other hand, if solution s4 is selected, the cost would be reduced to 11,856 USD/h, but the value of the losses would increase by 0.425 MW. However, this study seeks to give equal importance to the two objectives.
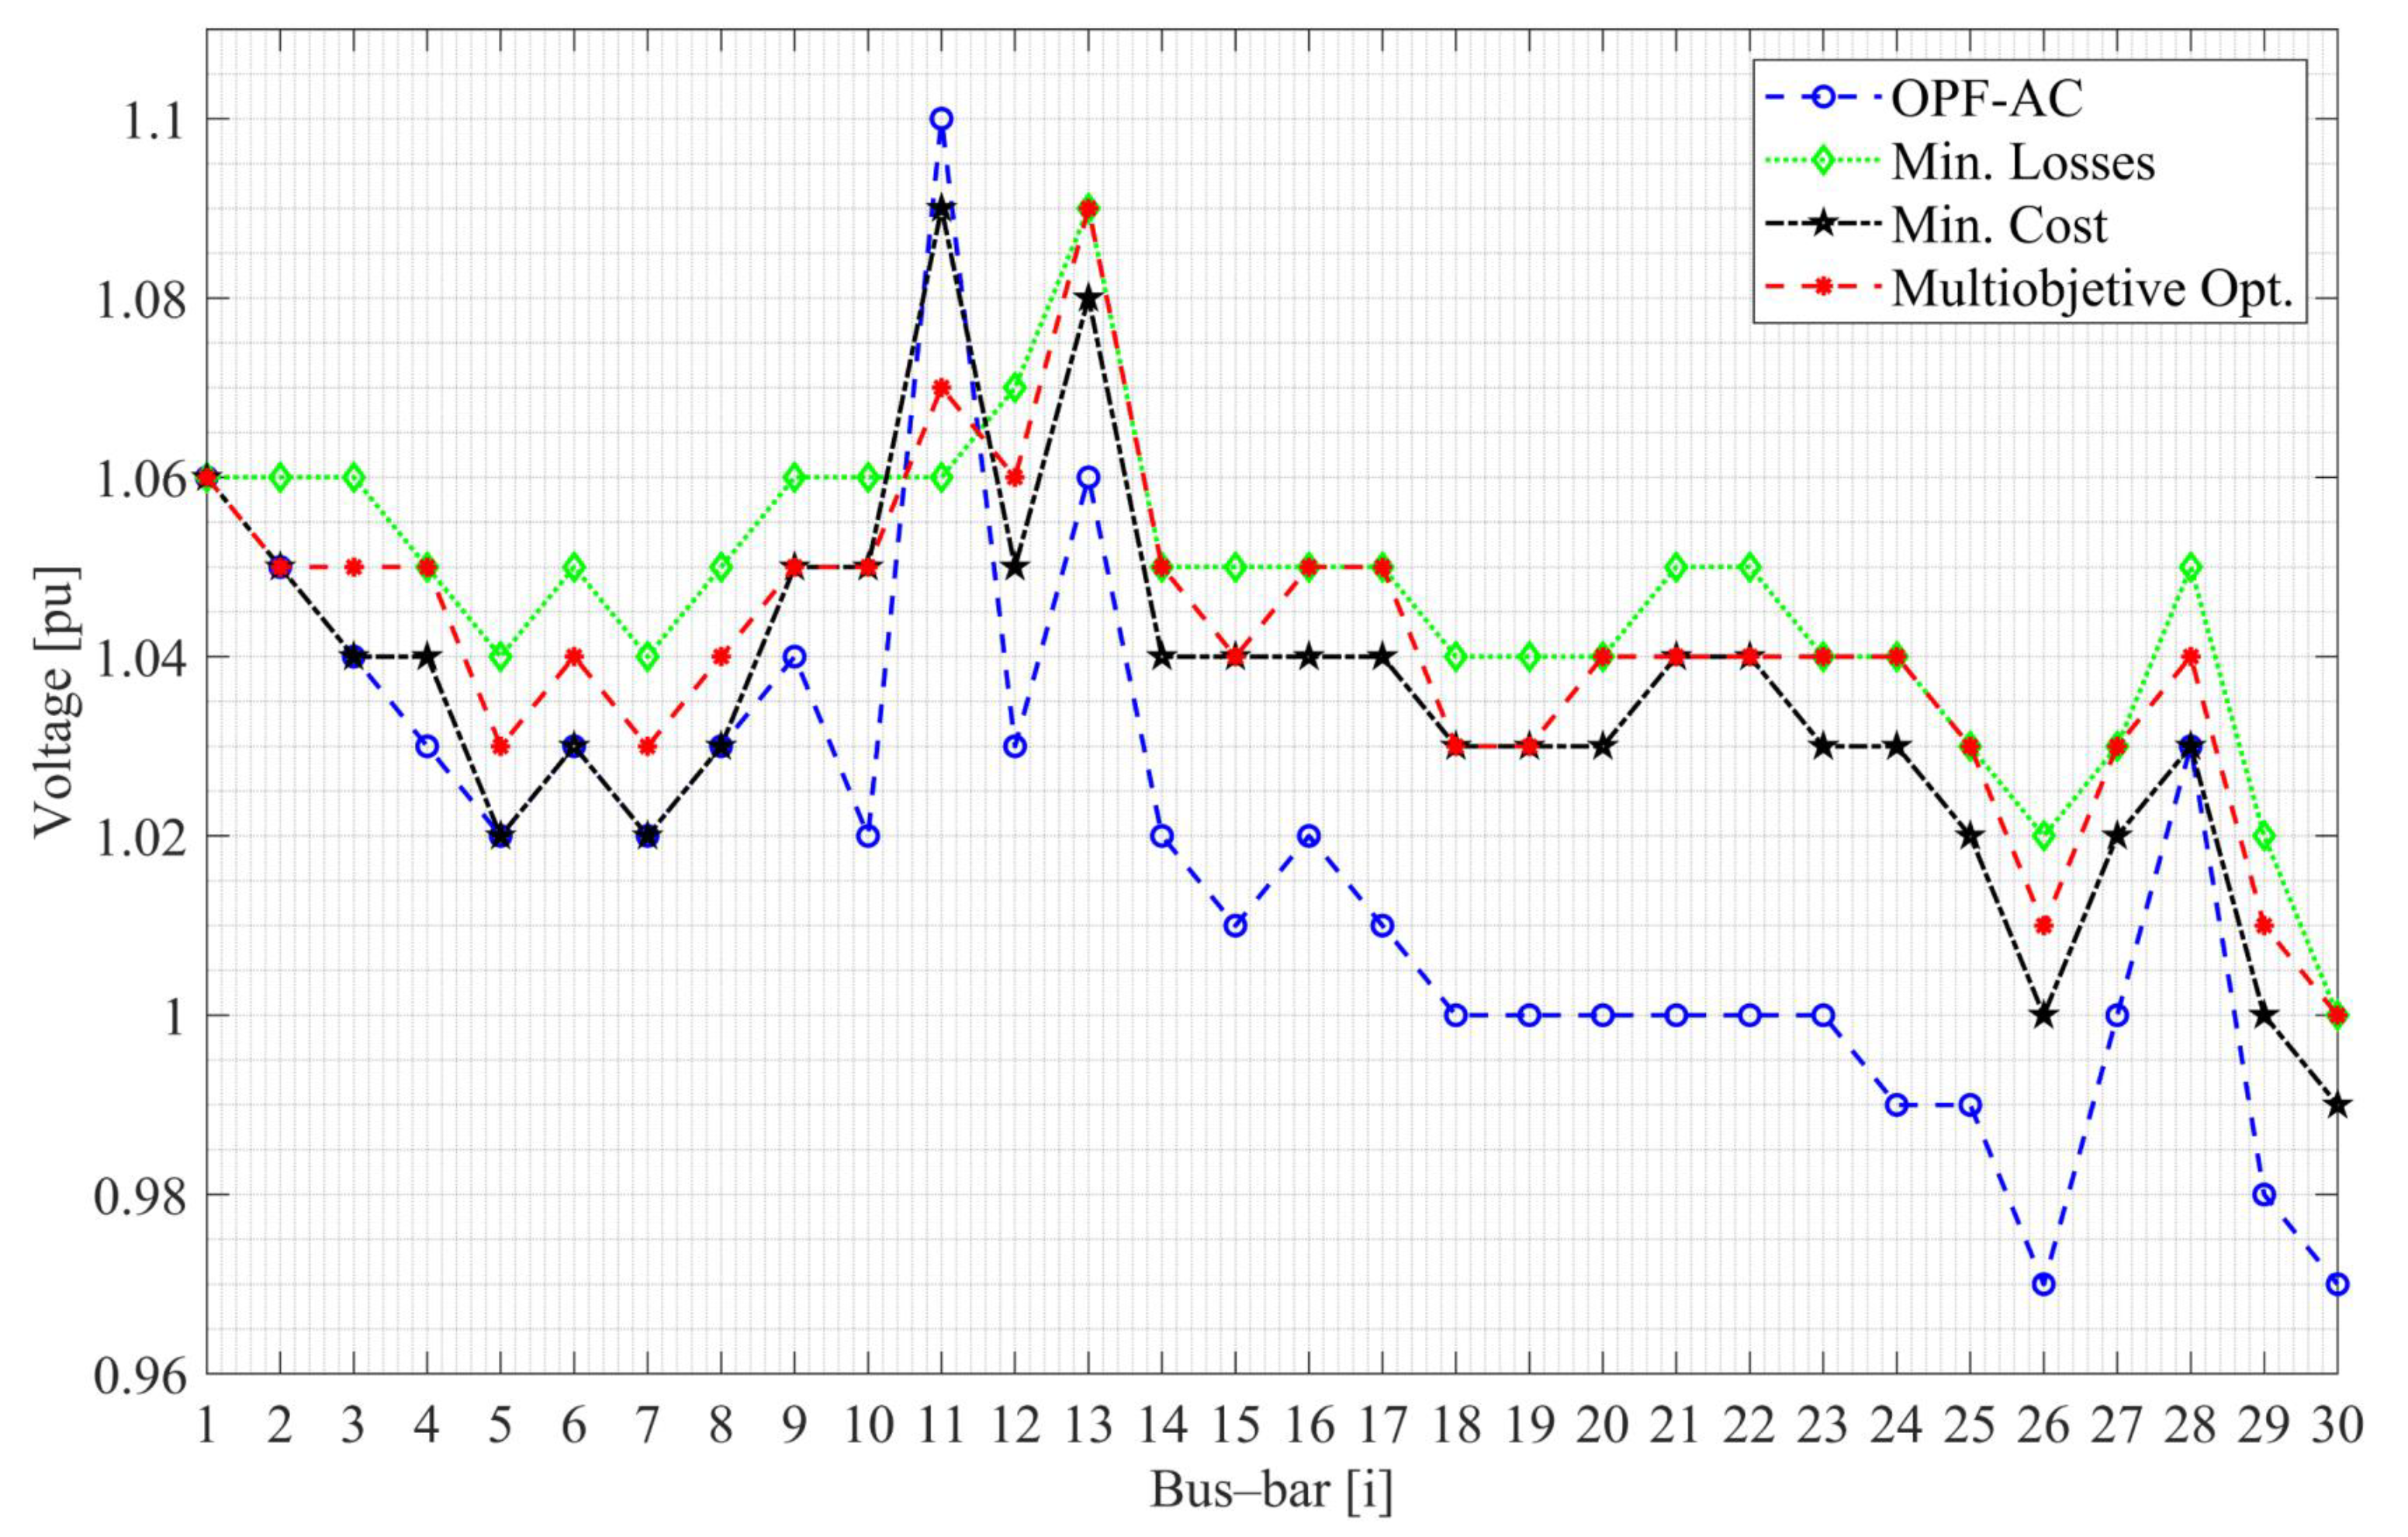
Figure 4 shows the voltage profiles, where it can be observed that in each case, the values obtained in GAMS are equal or similar to the voltage profiles simulated in Digsilent. Analyzing the GAMS results, in
Figure 4 for case 1 shows a voltage with a magnitude of 1.1 pu at bus 11, which is the maximum limit that was defined in the voltage restrictions if there were an increase in voltage at this bus. In turn,
Figure 4 for the same case also shows voltages below 1 pu, with the most pronounced being the voltages of bars 26, 29, and 30 with values of 0.97, 0.98, and 0.97 pu, respectively. For case 2, the voltage profile for all the busbars is increasing compared to cases 1, 3, and 4, with the highest value at bus 13, which has a value of 1.09 pu.
Case 2 increases its voltage profiles compared to the others since the active power losses are minimized, and the compensation elements not considered in case 1 are included. Regarding case 3, which considers the same objective function as case 1, its voltage profiles are also improved in comparison with case 1 due to the same fact of compensation performed by the capacitor banks connected to bus bars 10 and 24.
Finally, in case 4, the voltage profiles remain within the values of cases 2 and 3 because the multi-objective optimization is performed by considering the objective functions of cases 2 and 3. According to the results analyzed in
Figure 4, it can be seen that in case 1, by not improving or optimizing any technical variable nor considering the capacitor banks, the voltage profiles present very pronounced variations concerning the other cases, where technical parameters such as the reduction in active power losses are improved, as well as the inclusion of capacitor banks which help to enhance the voltage profiles of the SEP.
Table 2 shows the results of the active power dispatch of the generators, and
Table 3 shows the reactive power of the generators and capacitive compensators located at nodes 10 and 24. Analyzing the total power for case 1 in
Table 2, the result obtained via GAMS generates 2.1 MW less than the generated power obtained in Digsilent.
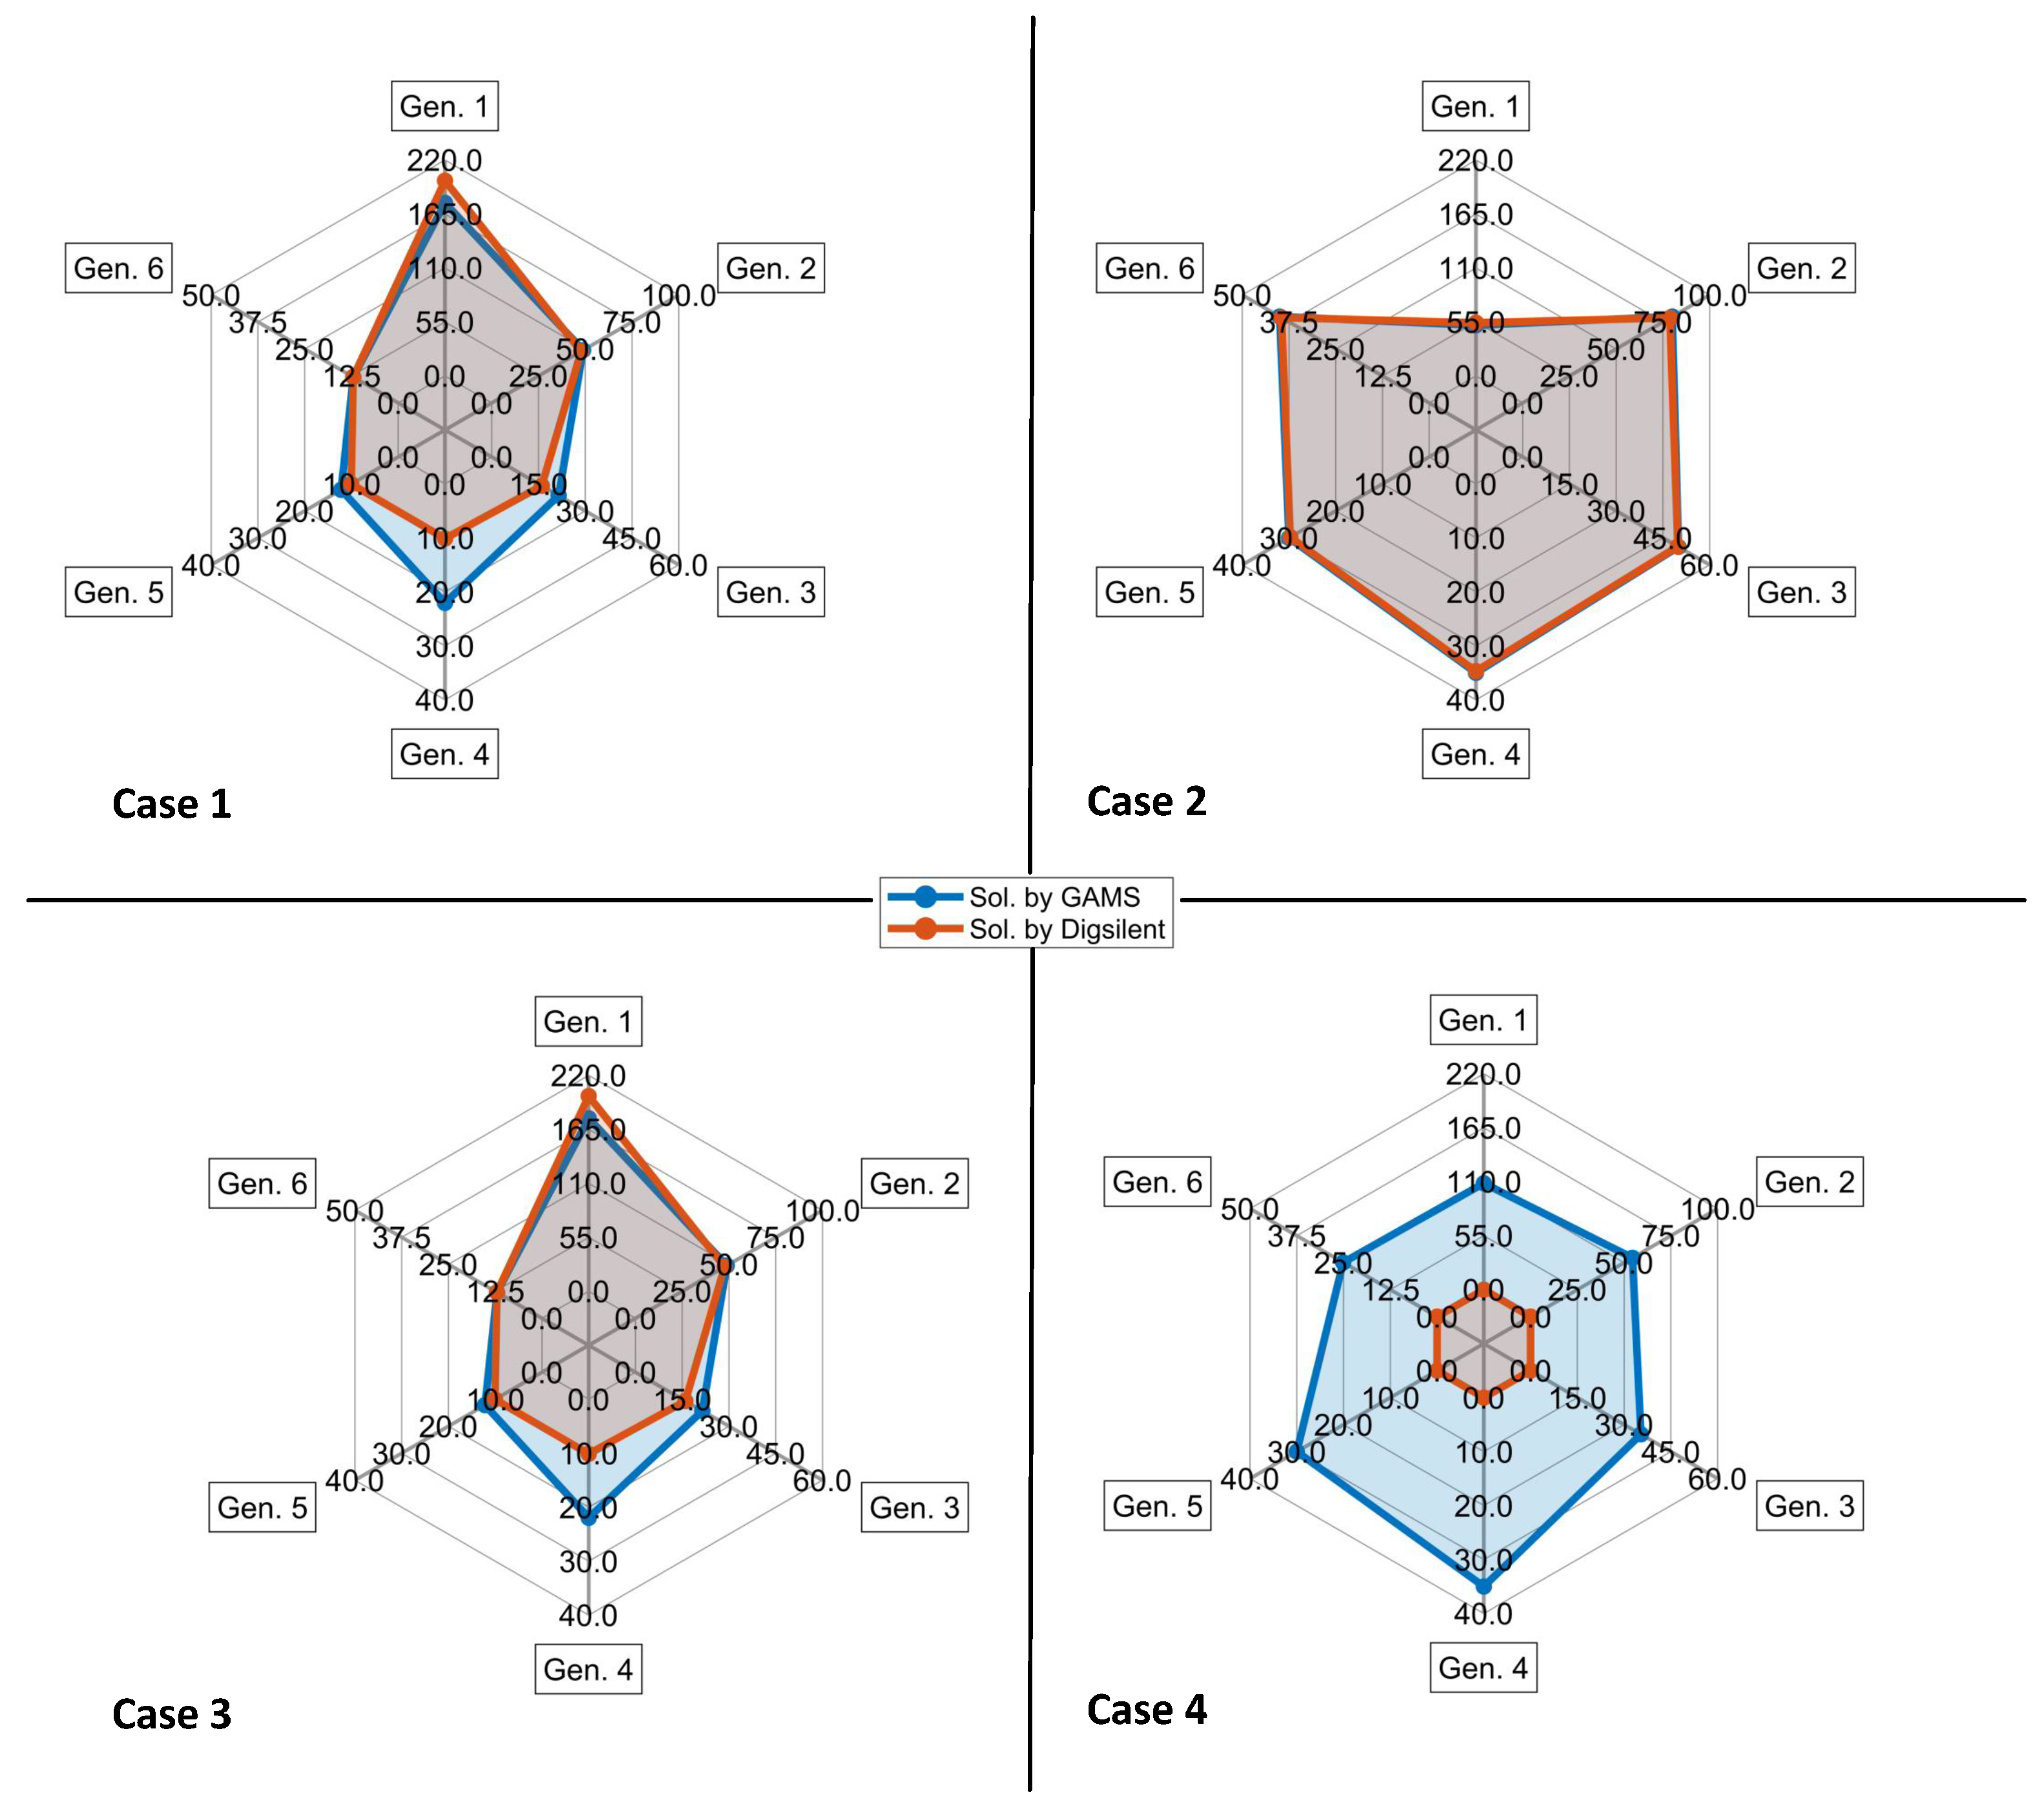
Figure 5 shows the active power dispatches, presenting the same power generation for cases 1 and 3, with generator 1 supplying more active power to the system. However, when the losses are minimized in case 2, generator 2 gives the most active power. For case 4, generator 1 again provides the most considerable amount of power; however, its generation is lower compared to cases 1 and 3, so the rest of the generators now generate more power, thus allowing us to balance the losses and costs.
When comparing the results obtained via the different methodologies, shown in
Table 2 and
Table 3, it can be seen that in case 3, which focuses on cost minimization in
Table 2, it dispatches the same amount of active power as an OPF, which is represented by case 1, but in
Table 3, the reactive power values of case 3 are different to those of the OPF of case 1. It is there where it can be verified that a real and reactive power dispatch minimizes costs, which is an ORRPD methodology.
Regarding the reactive power generated in
Table 3, cases 1 and 3 show that the total reactive power obtained via GAMS generates 5.42 MVAr and 5.06 MVAr less than the result obtained in Digsilent, while case 2 has 0.77 MVAr more in GAMS compared to Digsilent. This difference is because the reactive power is strongly linked to the network topology, and since there are higher losses in Digsilent, there is this variation in reactive power.
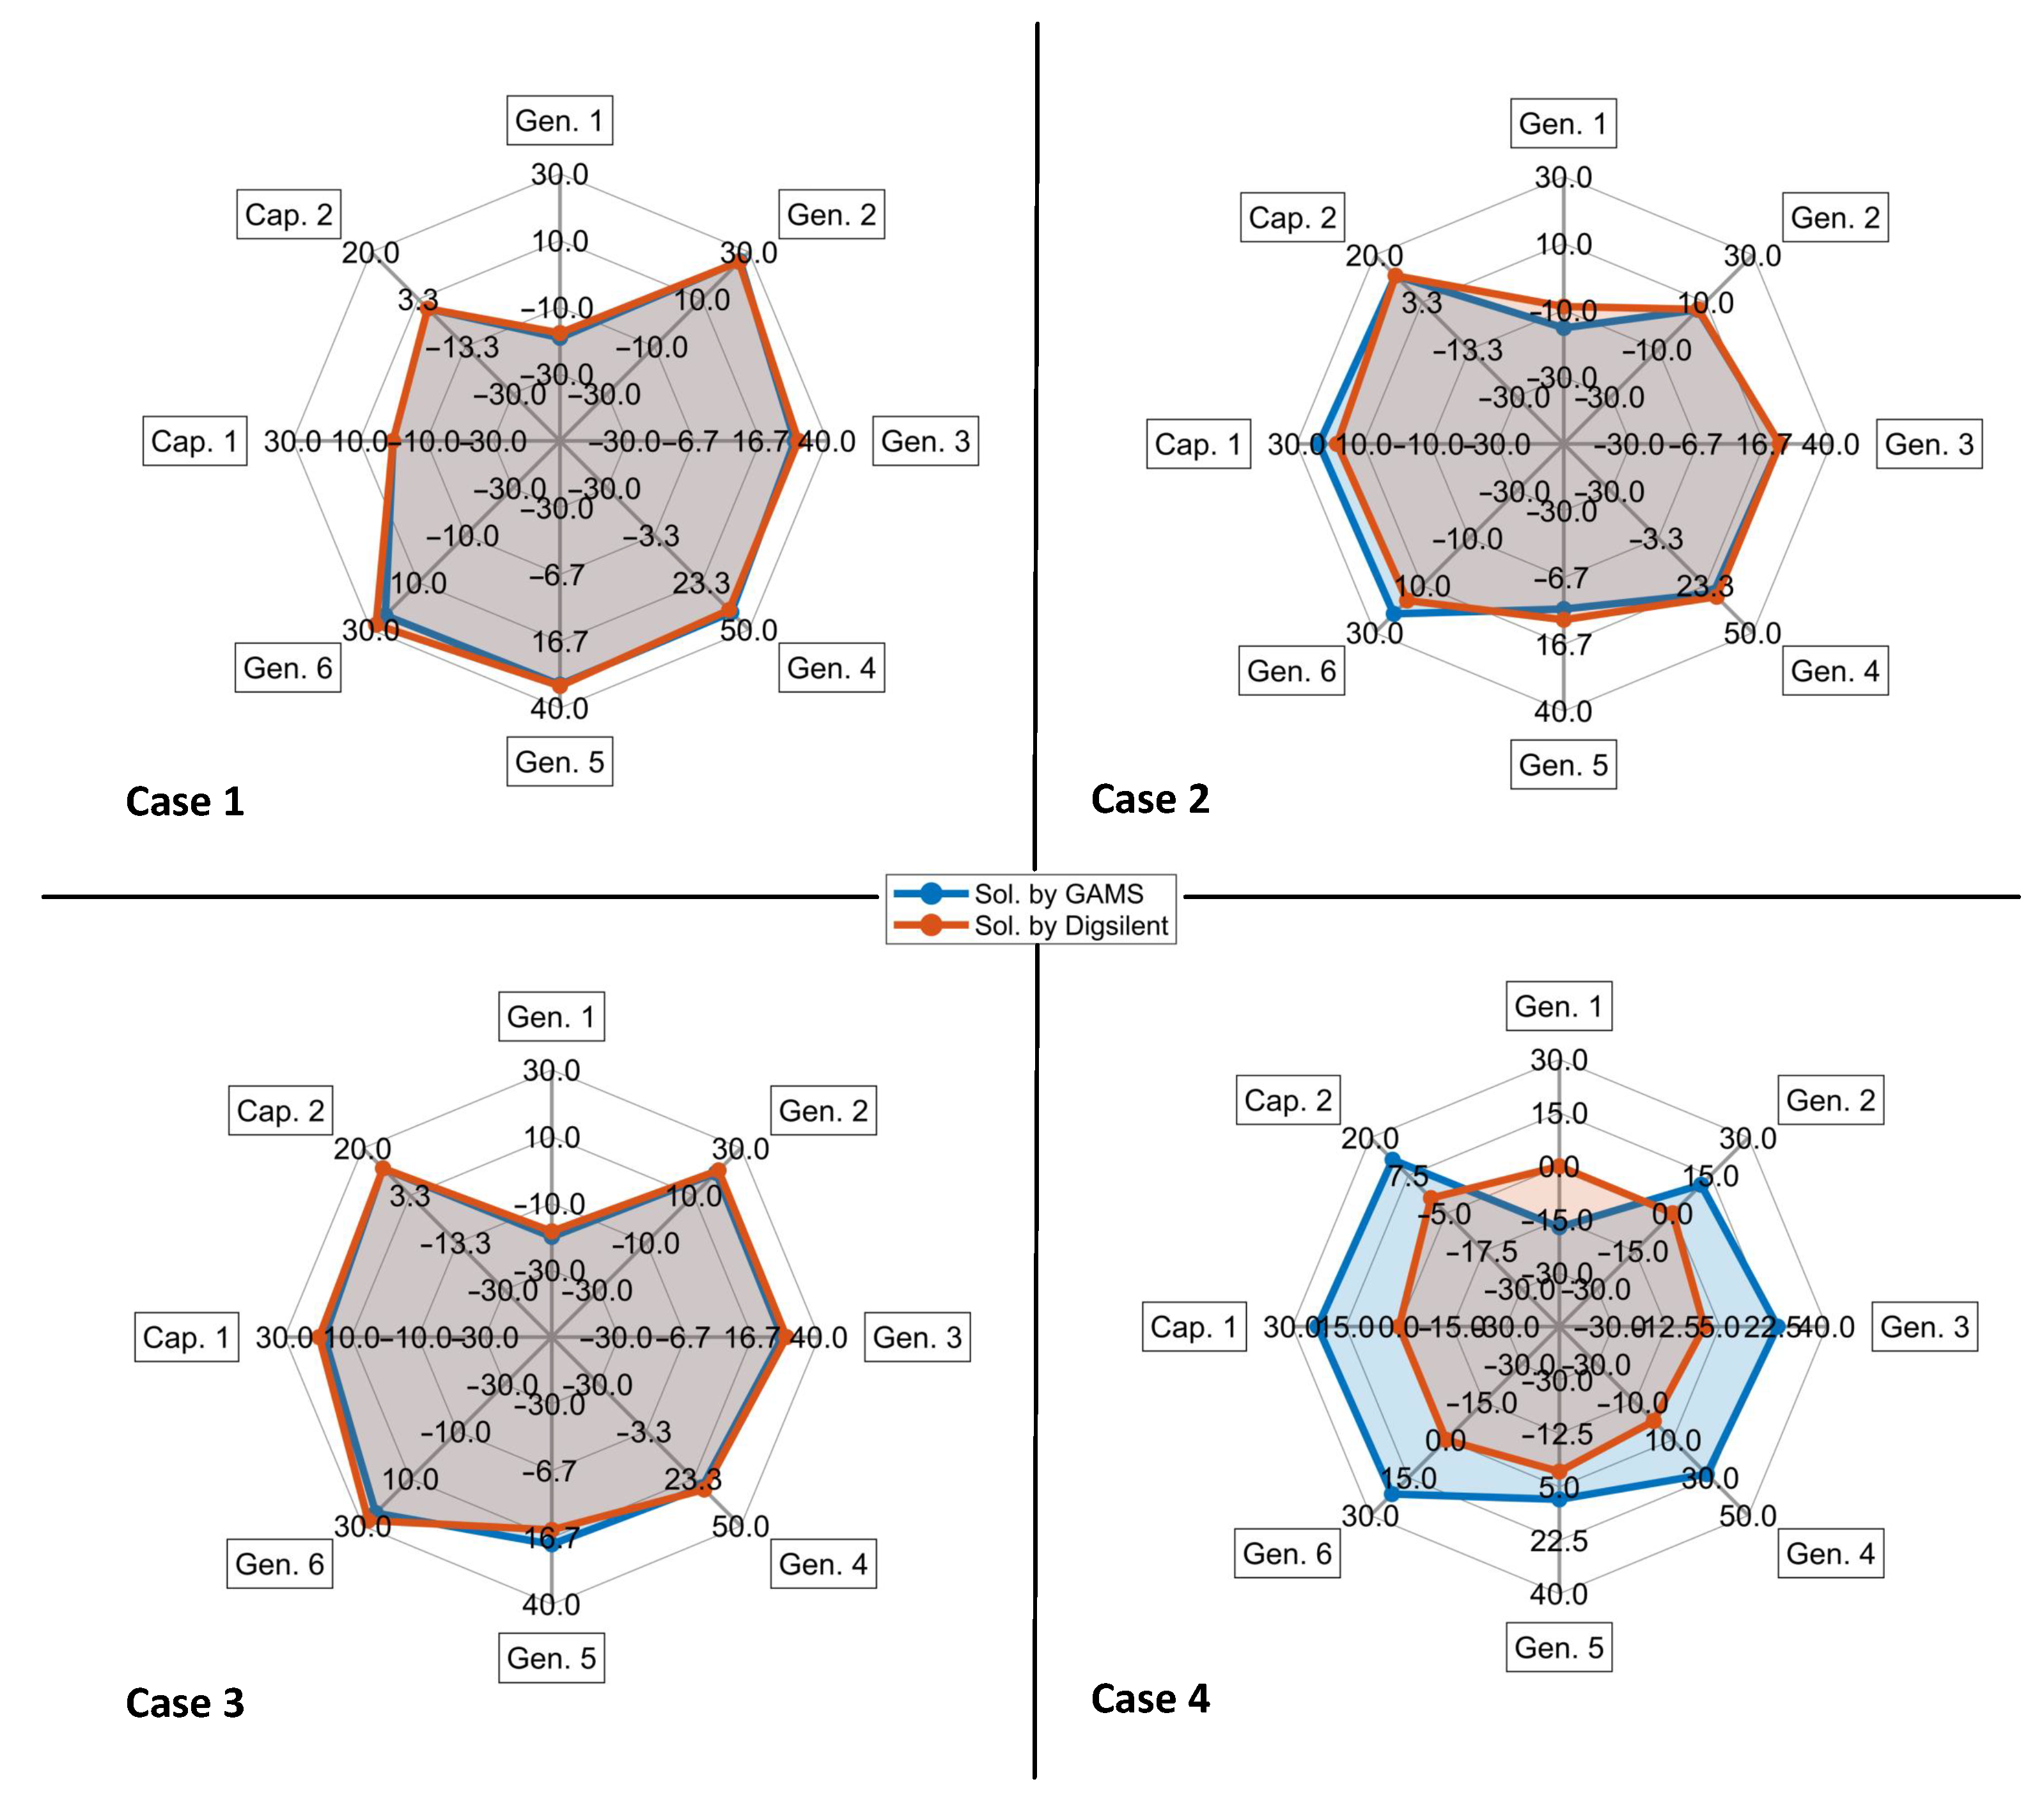
Comparing the reactive power results of each generator in
Figure 6 for cases 2 and 3, which consider the capacitor banks, it was found that by minimizing active power losses in case 2, the reactive power generated is lower than in case 3, where losses are not minimized, which indicates that by reducing losses, the reactive power dispatch is optimized.
According to
Figure 6 for case 1, the generators increase their reactive power in most cases without reactive power compensation elements. As for the reactive power compensation considered in cases 2, 3, and 4, according to
Table 3, capacitor bank 1 connected to bus 10 compensates more reactive power when losses are minimized and less reactive power when costs are minimized, while in case 4, the compensation is in the range of case 2 and 3. For capacitor bank 2 connected to bus 24, there is no pronounced variation from one case to the other. By controlling the reactive power dispatch of the capacitive compensators of nodes 10 and 24 in case 3 compared to case 1, the reactive power produced via the generators can be reduced, as shown in
Figure 6.
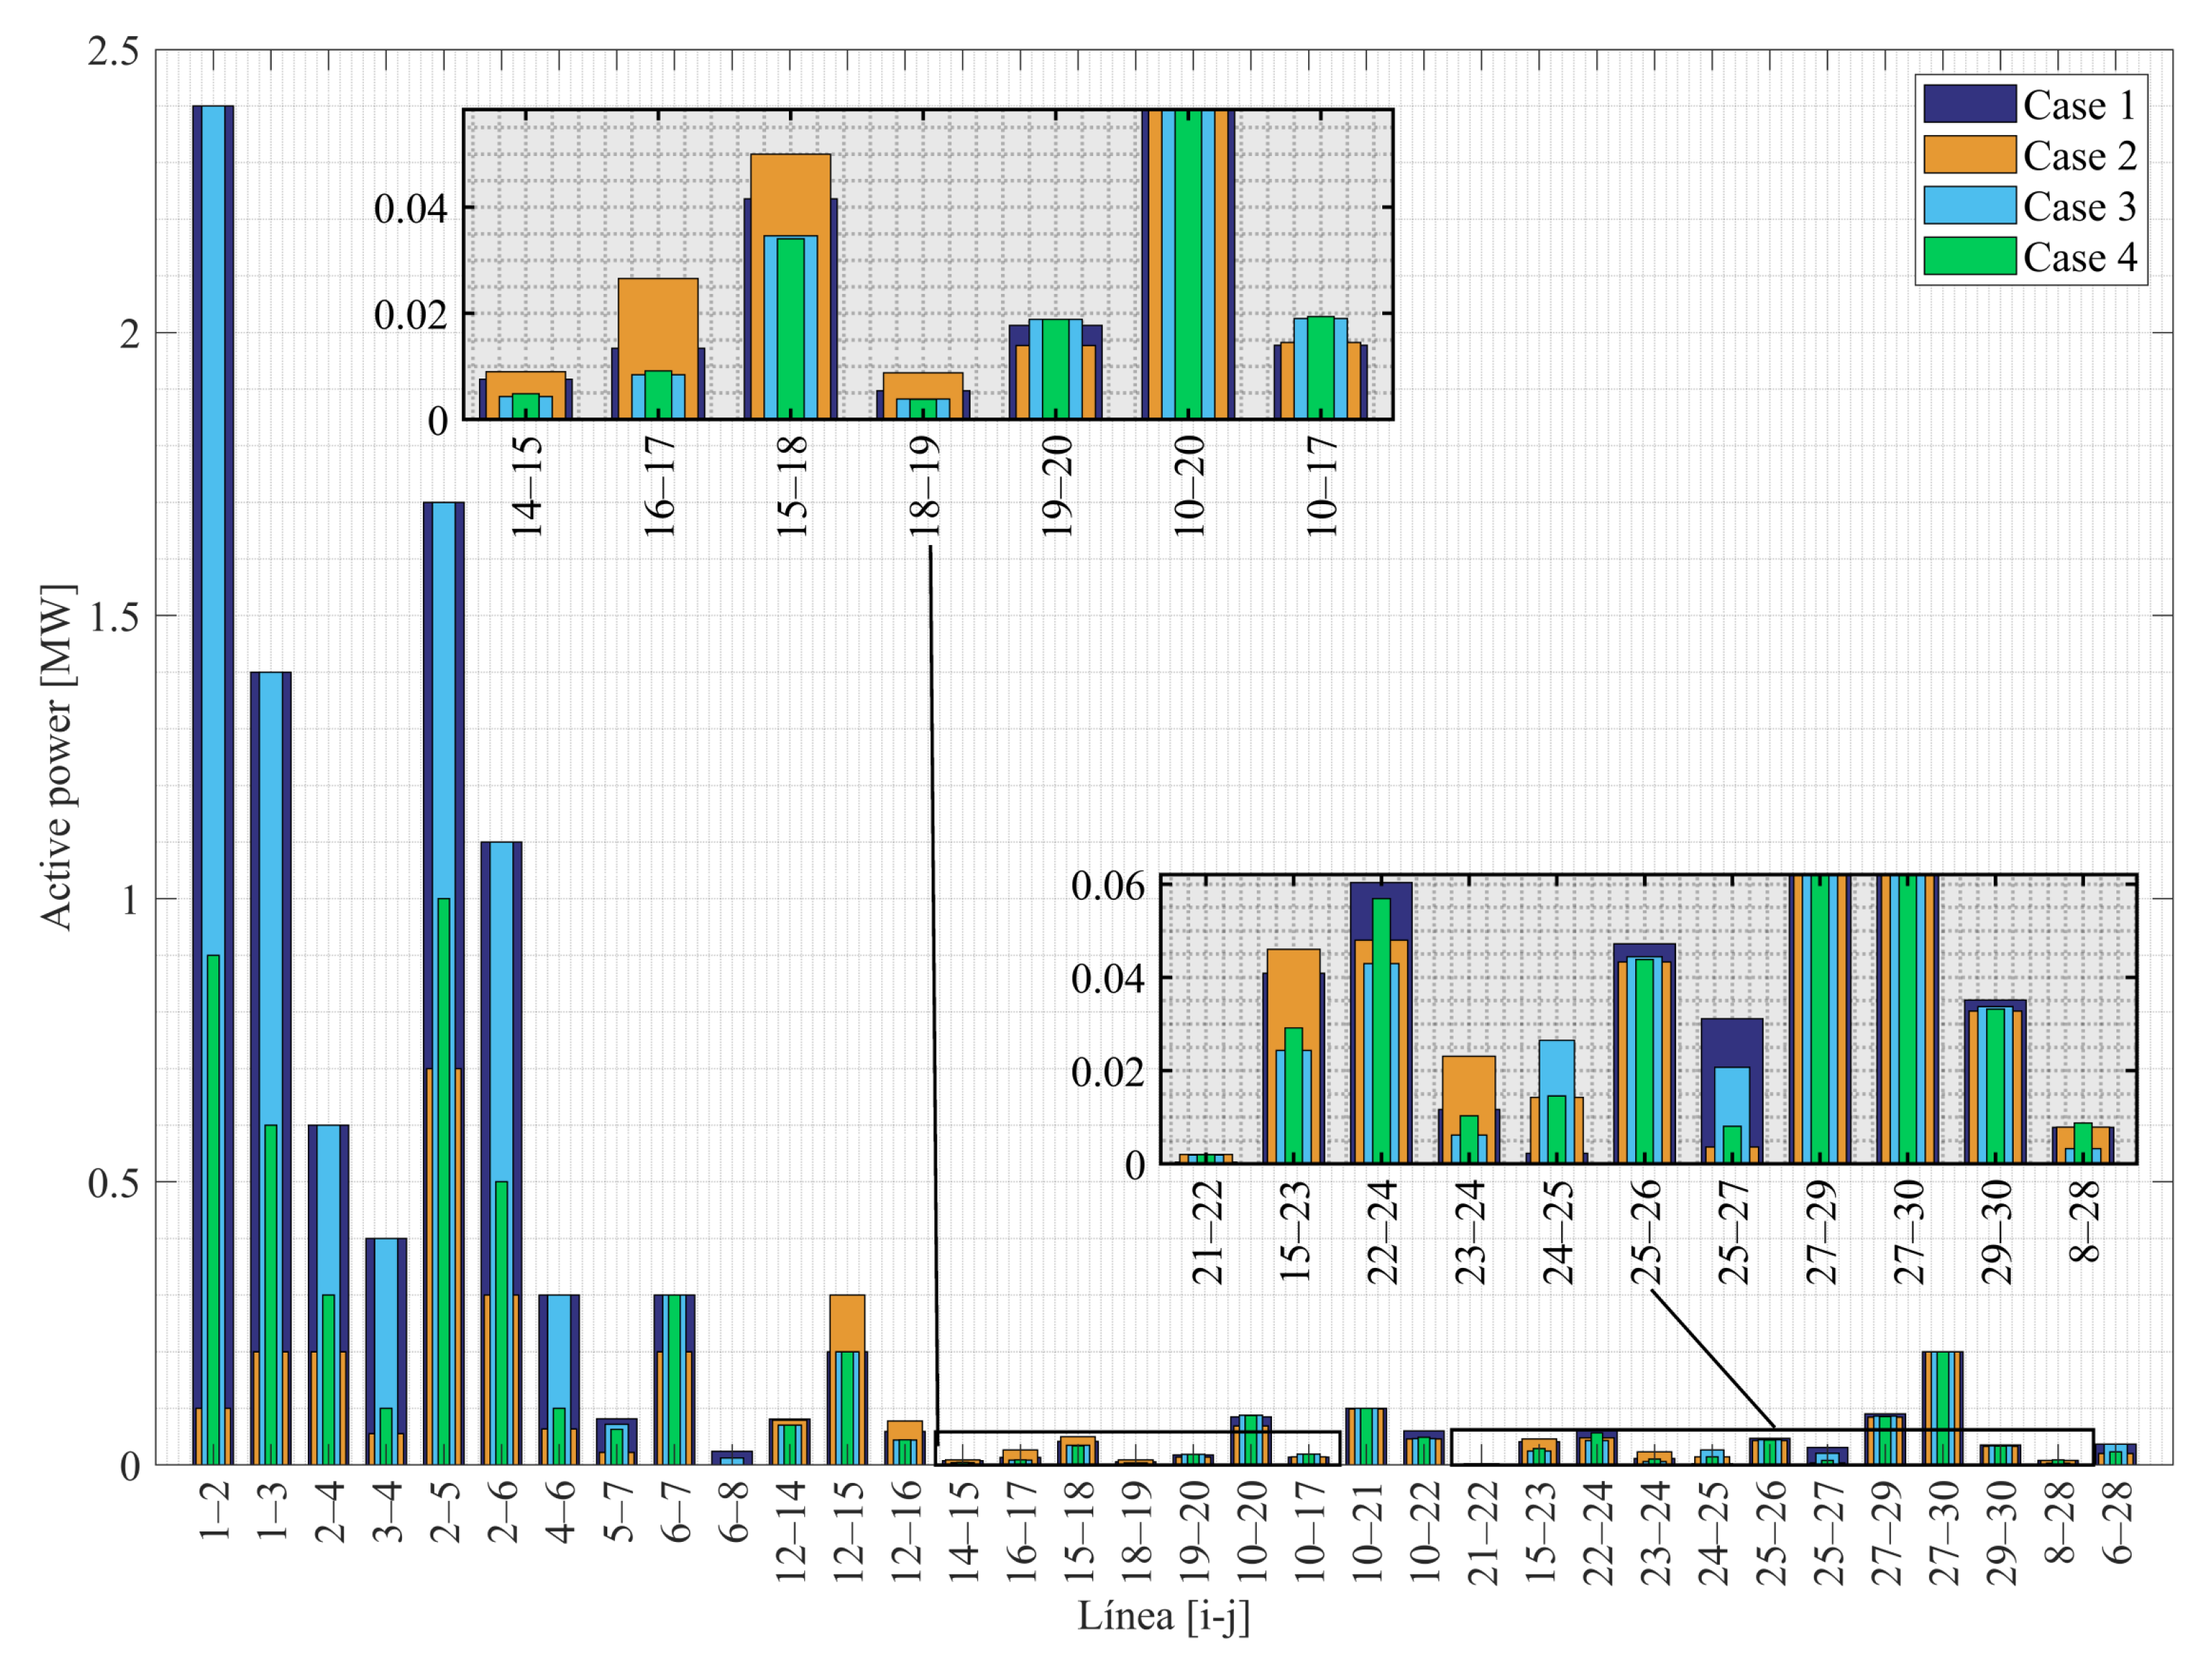
The excess active power generated in Digsilent is the product of a more significant amount of total active power losses that occur in the transmission lines, as shown in
Figure 7, and that effectively corresponds to 2.0537 MW more faults concerning the losses obtained in GAMS, so, in this case, it is demonstrated that the algorithm implemented in GAMS gave us a better optimization for Digsilent. Similarly, in case 3, 2.09 MW more are generated in Digsilent because 1.985 MW more losses are produced for the losses obtained in GAMS, according to
Figure 7. Concerning case 2, the results obtained in GAMS and Digsilent for the active power generated present an error of 0.042%. On the other hand, in case 4, only the results of GAMS are presented because Digsilent does not allow for a multi-objective study.
Figure 7 shows the active power losses in the transmission lines, while
Table 4 shows the results obtained via GAMS and compared with the simulations performed in Digsilent. As can be seen in
Figure 7 for cases 1 and 3, the highest amounts of losses are presented in lines 1–2, 1–3, 2–4, 3–4, 2–5, 2–6, 4–6, and 6–7, while in the rest of the lines, shallow losses are presented. For example, for lines 1–2, 1–3, 2–4, 2–4, 3–4, 2–5, 2–6, 4–6, and 6–7, it is possible to reduce 2.3, 1.2, 0.4, 0.3448, 1, 0.8, 0.2364, and 0.1 MW, respectively, reducing more than half of the losses produced in cases 1 and 3, except for line 6–7. In the same Figure, another point that can be highlighted is that, from line 14–15 onwards, losses for all cases become very low compared to the preceding lines, so with the help of the graphic expansion of the lines above, it can be seen that there are indeed losses.
Continuing with the analysis of case 2, there is a slight increase in losses in lines 14–15, 16–17, 15–18, 18–19, 15–23, and 23–24, due to a better distribution of losses throughout the system. On the other hand, case 4 maintains a balance of losses between cases 2 and 3, achieving a better distribution of losses concerning cases 1 and 3.
Table 4 shows the generation costs, where it can be observed that the costs obtained in GAMS for cases 1 and 3 are 5.82 USD/h and 5.85 USD/h less, respectively, compared to the costs obtained in Digsilent. The cost increase in Digsilent is due to the rise in generation needed to cover the excess losses in the system for cases 1 and 3, as shown in
Table 4. For case 2, in GAMS, there is an increase of 5.67 USD/h due to each generator’s dispatches and individual costs.
Analyzing the GAMS results obtained in cases 1 and 3, it was found that the difference between cases 1 and 3 is 0.61 USD/h, which indicates that by inserting the capacitor banks in case 3, the generation costs are not affected to a great extent. On the other hand, the prices for cases 1 and 3 are effectively lower than case 2, complying with the cost minimization proposed in the objective function. For case 4, we see that when the multi-objective optimization is performed, costs increase to 47.62 USD/h concerning case 3, but active power losses are reduced without reaching the maximum prices of case 2.
Figure 8 shows a visual comparison of the differences between the results of the optimization methods proposed and implemented in GAMS and those of Digsilent Power Factory in its algorithm.
Figure 8a shows how the OPF-AC proposed in GAMS dispatches less power from generator 1 and increases the dispatch of generators 3, 4, and 5. This results in a lower cost dispatch, which can be verified in
Table 4. In the same way, when cost minimization is analyzed, both programs provide a very similar solution, as shown in
Figure 8b, which is a situation that does not exist when the minimization of losses in transmission lines is analyzed, which is shown in
Figure 8c, and finally, it can be seen that Digsilent cannot perform multi-objective analysis, which is the main contribution of this research, as shown in
Figure 8d.
5. Conclusions
The operational planning of electric power systems is usually focused on producing electric energy at the lowest possible cost, but this is not the only way to plan the power dispatch. In the scientific literature, many authors are concerned about system efficiency and propose to minimize system losses. In this work, these two alternatives for power dispatch were taken into account, that is, a multi-objective methodology that minimizes production costs and losses of the power system was proposed. Its results were compared with those obtained via Digsilent Power Factory, which has some alternatives for analyzing optimal power flows, but with the difference that this software only allows for simulating one objective function at a time.
When comparing the different results obtained from the study cases considered, it can be verified that when analyzing the reduction in active power losses, a decrease in the reactive power dispatch is obtained, which for case 2, where only loss minimization is studied, 23.76 Mvar are reduced compared to case 3, where only production costs are minimized.
When comparing cases 2 and 3, it was estimated that the total generation costs increase when power losses are reduced, finding an increase of 165.98 USD/h for a power system. This is because priority is not given to generation costs but rather to transmission lines in which the impedance characteristics of the lines and the current flowing through them determine the losses of the power system.
Through multi-objective optimization, it was possible to improve both the technical and economic resources equitably, improving the operative conditions of the electric power systems without increasing generation costs to a great extent. As a result, the total power losses numbered 4964 MW, with an increase in the generation cost of 47.42 USD/h concerning the minimum cost.
The results obtained with the proposed algorithm implemented in GAMS, compared with the Digsilent simulations, show that the algorithm is efficient and reliable. Moreover, it can be seen that Digsilent has a limitation at the time of needing multi-objective analysis, which, using the proposed methodology implemented in GAMS, can be performed and is the main contribution of the present work.
