1. Introduction
The current industry standard treats a wind turbine at the upstream border of a modern wind farm as if standing in isolation without further effects on the atmosphere or winds in the vicinity of the wind farm. However, recent scientific results have identified numerous impacts of a wind farm as a whole acting on the atmosphere and for considering “blockage”, or combined wind farm induction zone effects, in pre-construction annual energy production (AEP) estimation. The wind farm blockage effect specifically refers to reduced wind speed well upstream of and caused by the wind farm. The reduced winds in the induction zone of upwind turbines that are part of a larger wind farm are caused by the adverse pressure gradient induced by the combined effect of the wind farm. When the wind approaches a wind farm, the atmospheric flow primarily moves through the wind farm where there are no turbines, but due to the thrust (or drag) of the turbine array, some air mass deflects upwards and over the turbine array, and some deflects to the sides of the turbine array or below the turbines. Wind farm blockage is a phenomenon that can reduce inflow wind speeds compared to the free stream winds by a substantial percentage, from a small amount to several percent. To understand the effect’s magnitude and optimize wind farm design, the detailed modeling and measurement of these effects are important.
From computational fluid dynamics (CFD) simulations, it is estimated that ignoring blockage effects might give a negative bias in expected AEP [
1]. In a study using an analytic vortex model to investigate blockage effects, the model results show a reduced wind speed of 2% upstream at the distance of 2.5 D, with D as the rotor diameter [
2]. Comparing four engineering models and a CFD model, the reported average model blockage differences are less than 1% [
3]. Furthermore, the results of large-eddy simulation (LES) show that turbine spacing is important for the blockage effect, with denser spacing causing an increase in blockage. The LES model result for neutral stratification shows a front-row power reduction of 1% at a stream-wise row separation of 7 D [
4]. Extending the LES model to include atmospheric stability [
5], the result shows that a stable stratified boundary layer leads to more pronounced blockage. The physical reason for this is that the deflection of cold, high-density air flowing over the wind farm creates a high-pressure region at the front of the wind farm. The resulting adverse pressure gradient increases in stable stratification with a concomitantly larger reduction in the upstream wind speed. Values of 4% front-row power reduction at a stream-wise separation of 7 D are reported [
5]. The LES modeling by Strickland et al. [
5] on blockage in stable stratification was performed without a capping inversion, as the model otherwise initiates gravity waves.
In case the adverse pressure gradient is as strong as in stable conditions, and the boundary layer is shallow, the wind farm blockage may trigger gravity waves [
5,
6,
7,
8]. Results from the LES model on the flow adjustment around wind farms show that thermal stratification is critical to the development of gravity waves [
9]. For a weakly stratified flow, i.e., supercritical flow, the blockage extends 0.8 km upstream of the wind farm with a velocity deficit of around 1%, while for strongly stratified flow, i.e., subcritical flow, gravity waves will emerge and give a much larger, profound impact on the upwind flow, with reduced winds extending around 7 km upstream and an AEP loss of around 35% in the front-row turbines [
9].
The predominant condition of concern with respect to blockage is supercritical flow. Further downstream in the far-field wake, cluster wakes prevail. For inflow wind speeds in the range from 7 m s
−1 to rated speed, pronounced and long wind farm cluster wakes were observed from a satellite Synthetic Aperture Radar (SAR) [
10,
11]. Cluster wakes between neighboring large wind farms were observed to cause lower AEP at downstream wind farms [
12]. SAR observations [
13] and Weather Research and Forecasting (WRF) model results at wind farms and clusters in the North Sea [
14] identify long wakes and blockage effects.
Although the effects were seen in wind farm power production data, atmospheric observations of wind farm blockage, particularly of its adverse pressure gradient and gravity waves or induced lift upwind, are sparse. Observing wind farm blockage is a technical challenge due to only a few percent difference between the free stream wind speed and the reduced winds in front of wind farms. Observations that have been collected to characterize and quantify blockage effects include pre- and post-construction wind data from meteorological masts and wind lidars. In some studies, the wind data were combined with turbine production data to assess the wind farm blockage. In the onshore environment, Bleeg et al. [
1] used wind observations from masts pre- and post-construction near three onshore wind farms and the turbine power production to quantify the blockage effect. Their finding is, on average, a 1.9% wind speed reduction upstream at a distance of 7 to 10 D of the wind farms and 1% at a 2 km upwind distance. The results compared well with the Reynolds–Averaged Navier–Stokes (RANS) model results [
1]. Blockage at another onshore wind farm was quantified by [
15] from analysis of wind lidar data collected pre- and post-construction and observed at variable distances to the wind farm. The results show that blockage remains significant beyond 10 D. For daytime in unstable conditions, the wind speed reduction is 1.5% at 3 D upstream, and the model simulation result agrees with the observations [
15].
In the offshore environment, observations on wind farm blockage are available. At the Lillgrund wind farm, a 2% power loss was found to originate from wind farm blockage. The result compared actual turbine production data with expected production based on pre-construction wind resource statistics [
16]. The Lillgrund wind farm production reduction due to blockage is supported using three different simulation models suggesting a 2% to 4% power loss due to wind farm blockage [
16]. The turbine data analysis from the wind farm Gunfleet Sands was compared to results from a coupled engineering wake model with a simple wind farm blockage model. The results indicate an upstream area wind speed reduction and a significant variation of power among the front-row turbines [
17]. The blockage effects at the Global Tech 1 wind farm were quantified using scanning wind lidar observations [
18]. Reduced wind speeds of 4% over a distance of around 25 D or 2.9 km are observed for stable stratification. This result is for wind speeds in the range of high thrust when turbines operate in the partial load range. A high turbine thrust coefficient occurred from cut-in to rated wind speed, which increased the blockage effect, while for lower thrust coefficients outside this wind speed range, the blockage effect was smaller [
18].
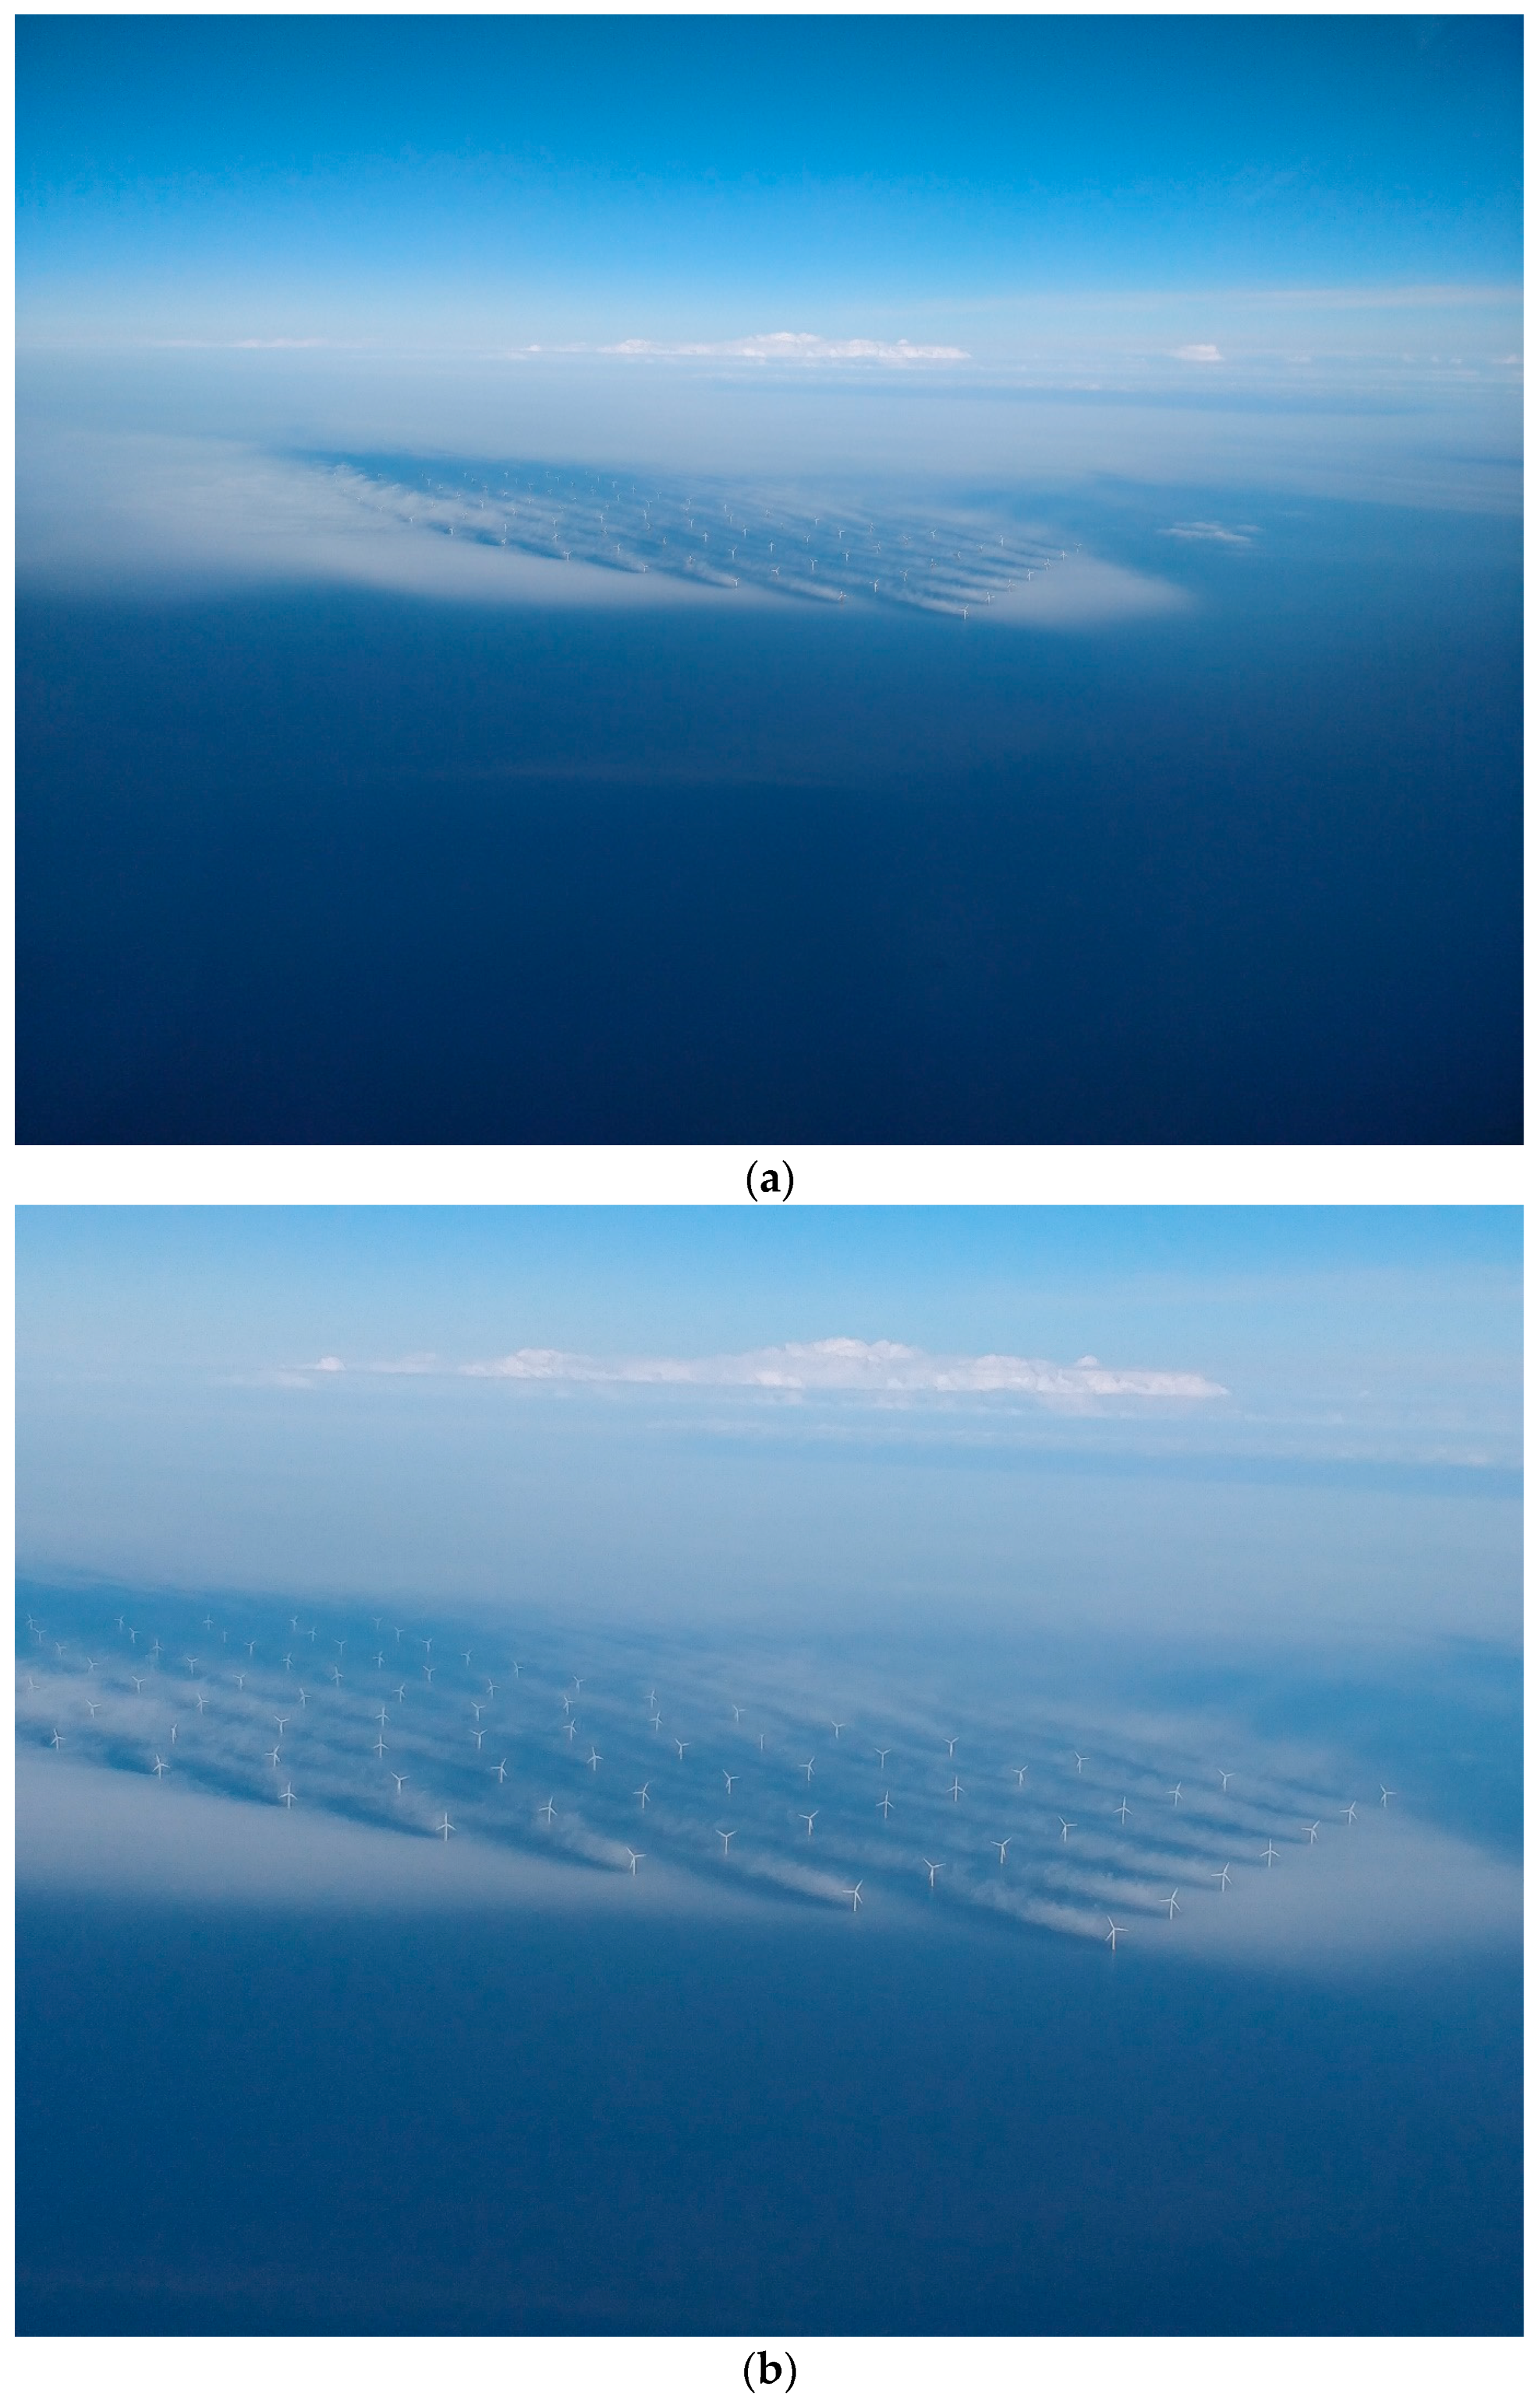
Photographs of the offshore wind farm Horns Rev 2 in foggy conditions observed on 16 April 2018 at 15:13 UTC are complementary to a case in 2008 at the Horns Rev 1 wind farm [
19] and another case in 2016 at the Horns Rev 2 wind farm [
20]. The photographs are fascinating due to the wind farm effects becoming visible in those particular moments where atmospheric water transforms between gaseous and liquid phases through condensation and dispersion. The transitions from water vapor to fog, and vice-versa, are governed by the moisture–temperature structure, wind speeds and wind shear, vertical motion, mixing processes, and turbulence intensity [
21] that wind farms partly modify, hence triggering the exceptional fog features.
Causative factors for marine fog have different origins, but once sea fog is formed, it tends to persist due to counteracting generative and destructive processes. Advection of cooler air over a surface layer of warmer and near-saturated air and mixing of the two air masses will cause warm sea fog to form, more commonly during periods of low wind speed. In addition, long-wave radiative cooling upward from the fog will further enhance the forming of warm sea fog [
21]. Advection of warm and moist air over a colder sea surface will cause cold sea fog. The cold sea fog forms in the very shallow marine layer over the sea, not up in the warm, advected air mass. The cold sea fog is a persistent, moist, and very shallow layer [
21].
Warm sea fog is associated with unstable stratification, while cold sea fog is associated with stable stratification. Unstable conditions favor short and wide wakes, while stable conditions favor long and narrow wakes [
22]. Wind speed, atmospheric stability, turbulence intensity, and turbine operation influence the wake development. The new photo case from 2018 shows long, narrow fog wakes similar to the case from 2016. The photo cases from 2016 and 2018 show a clearing of the fog in the far field, possibly due to the entrainment of drier air from aloft. In contrast, the case from 2008 shows short and wide fog wakes.
Compared to the previous two cases, the novelty of the 2018 case is the occurrence of sea fog located in an arc shape upwind of the wind farm; this phenomenon may be related to wind farm blockage. There is a gap in the literature on the blockage effect revealed by fog at offshore wind farms. The iconic photographs of offshore wind farm wake [
19,
20] are often shown in the wind industry. The new photographs might be supportive of learning about blockage effects.
The aim of our study is to investigate whether wind farm blockage is a likely cause for fog formation upstream of the wind farm. The methodology to achieve this aim is firstly a quantification of the local ambient meteorological conditions from observations, and secondly a characterization of the blockage effect on wind farms and model results from an engineering wake and blockage model simulating the conditions at the time of the photos.
The structure of the study starts with a presentation of the photographs and the wind farm in
Section 2 and the ambient meteorological conditions in
Section 3.
Section 4 presents the results from an engineering wake model, including blockage effects and comparison to wind turbine data at the time of the photos. The Discussion and Conclusion are given in
Section 5 and
Section 6, respectively.
4. Modelling the Wake Deficit and Blockage Effect
The wake deficit and blockage effect were modeled at the time of the photos with the coupled engineering models for wind farm wake and blockage effect as presented in [
17]. The wake model predicts the downstream conditions, while the blockage model predicts the upstream conditions. The thrust coefficient of every turbine from the wake model was input to the blockage model. The blockage from other wind turbines changes the incoming wind; thus, an iterative calculation was performed. In this way, a coupling between the wake and blockage models was done. The blockage model includes the accumulation of single-turbine induction effects described by a potential flow model. The results obtained with the coupled models were based on input wind direction from the wind lidar measurement at hub height, while the input wind speed was derived from the unwaked front-row turbines.
The wake model predicted long and narrow turbine wakes (
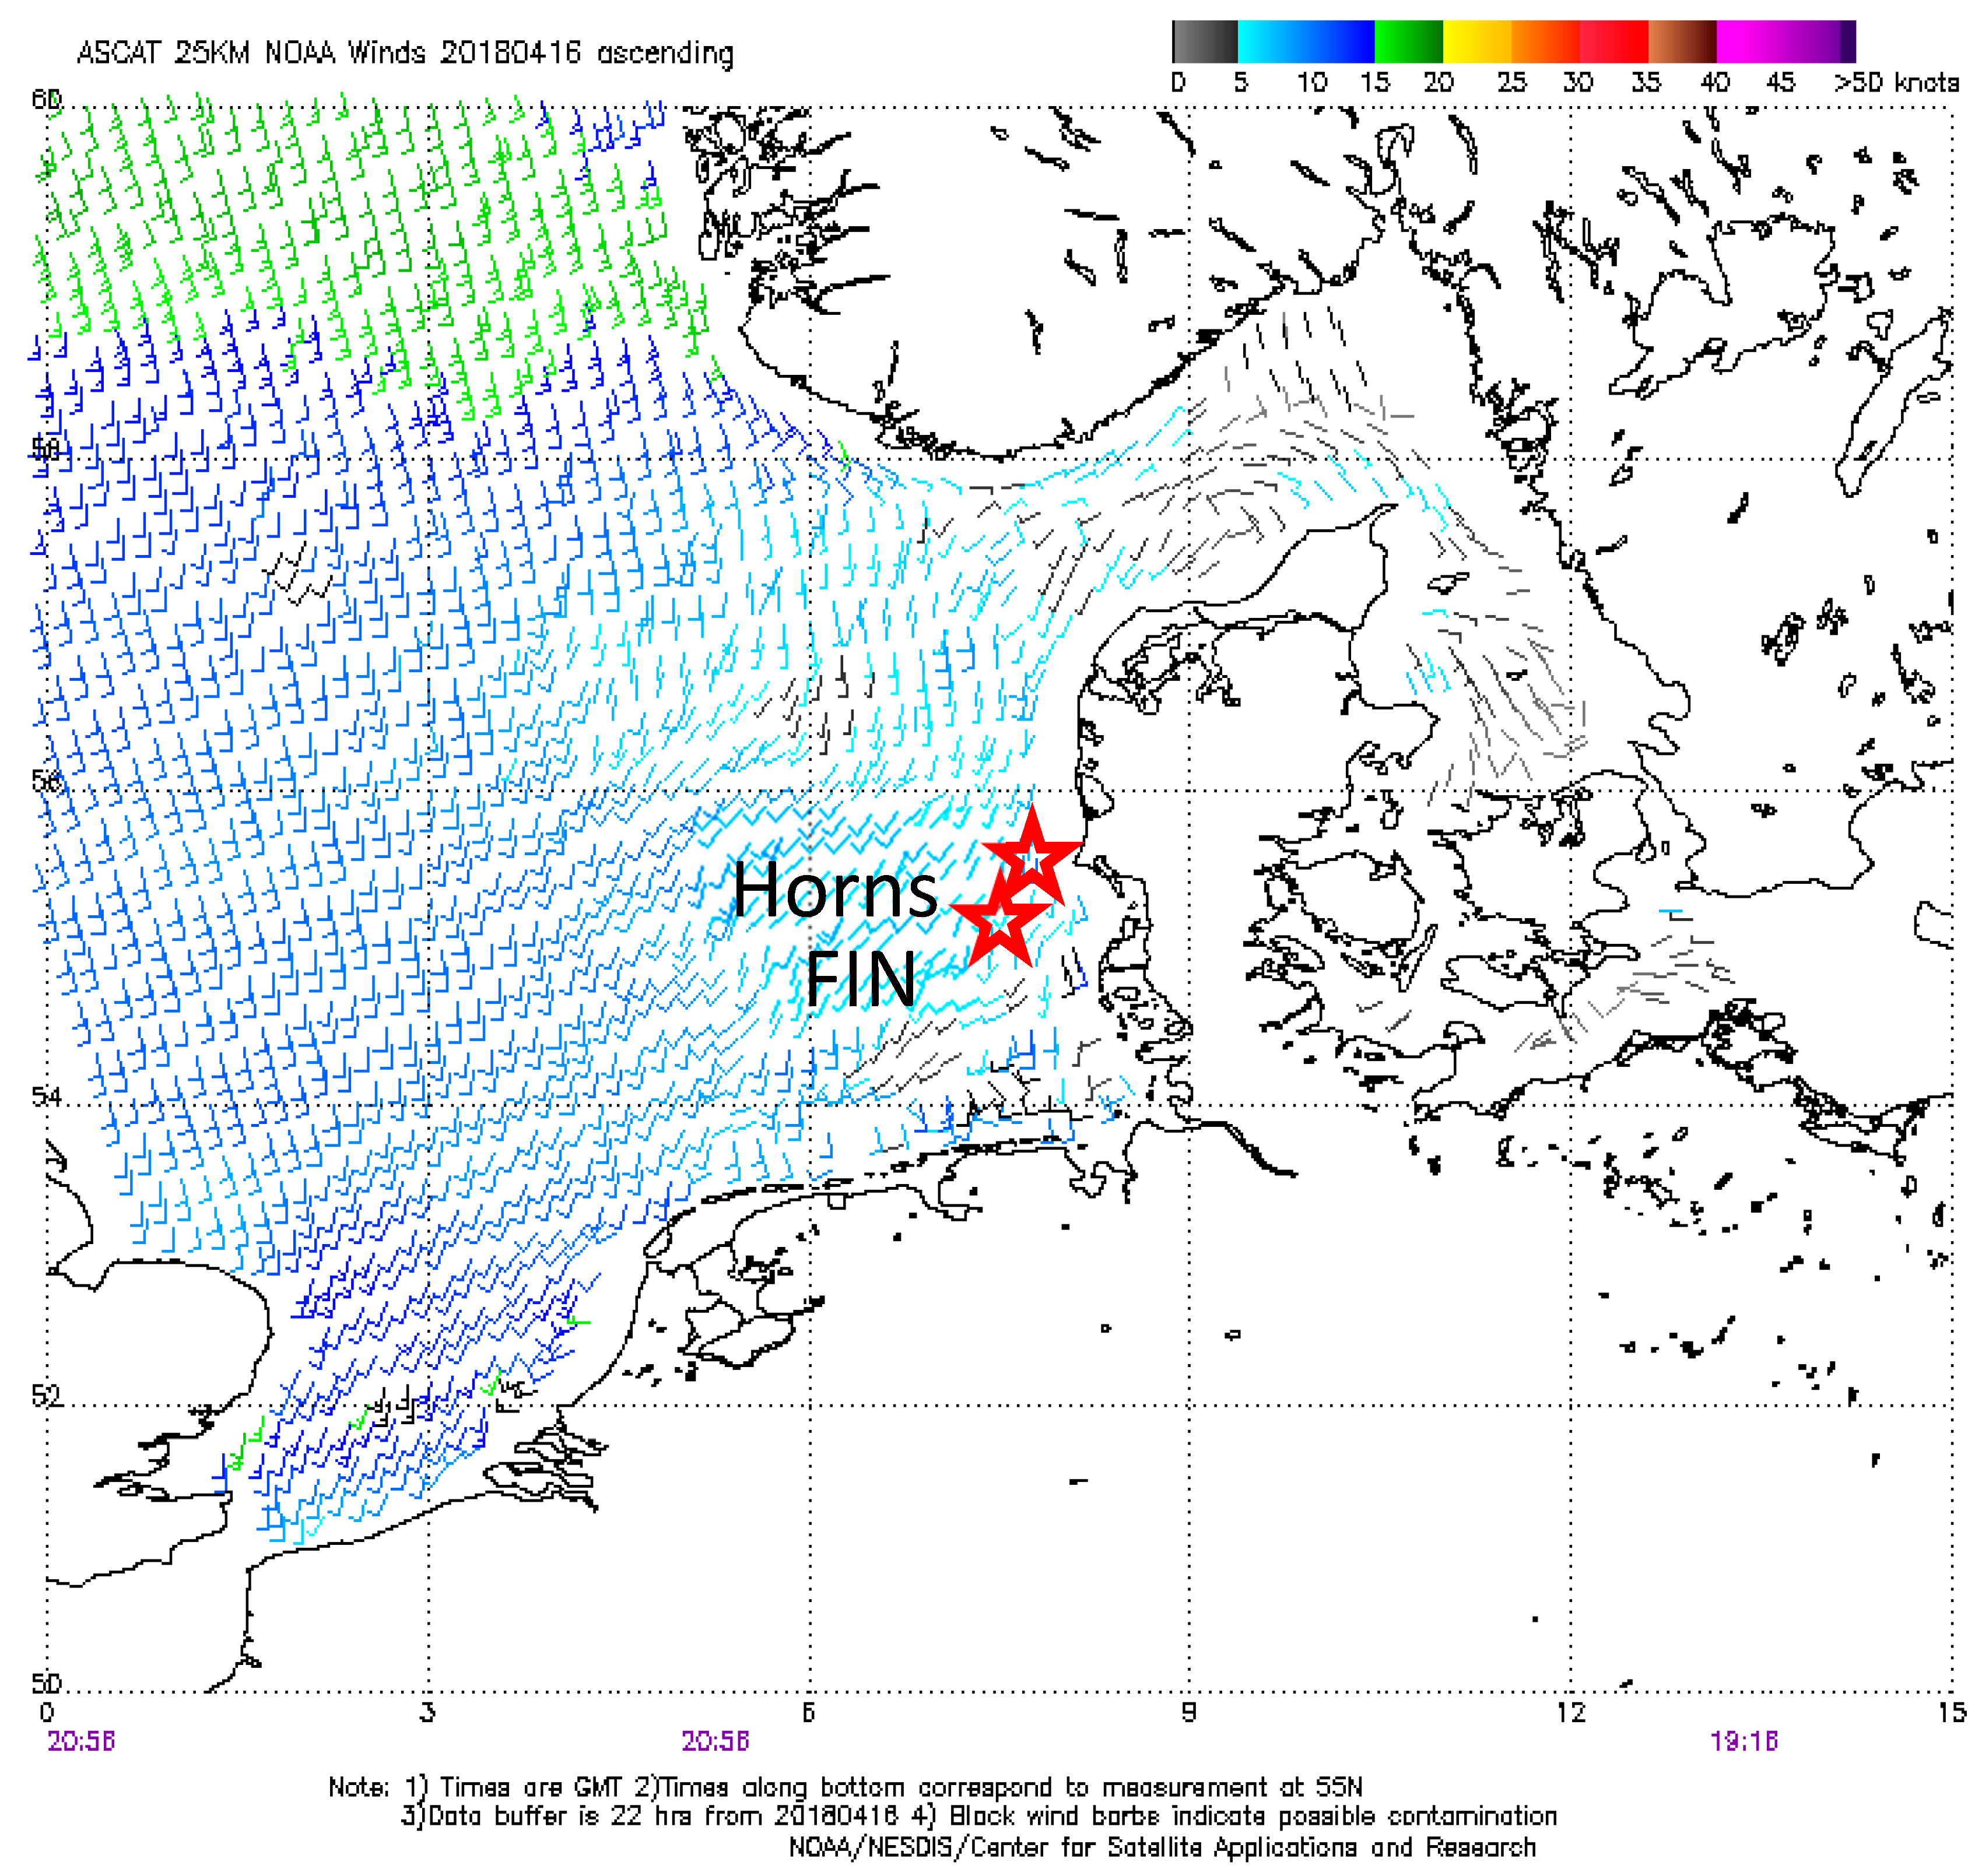
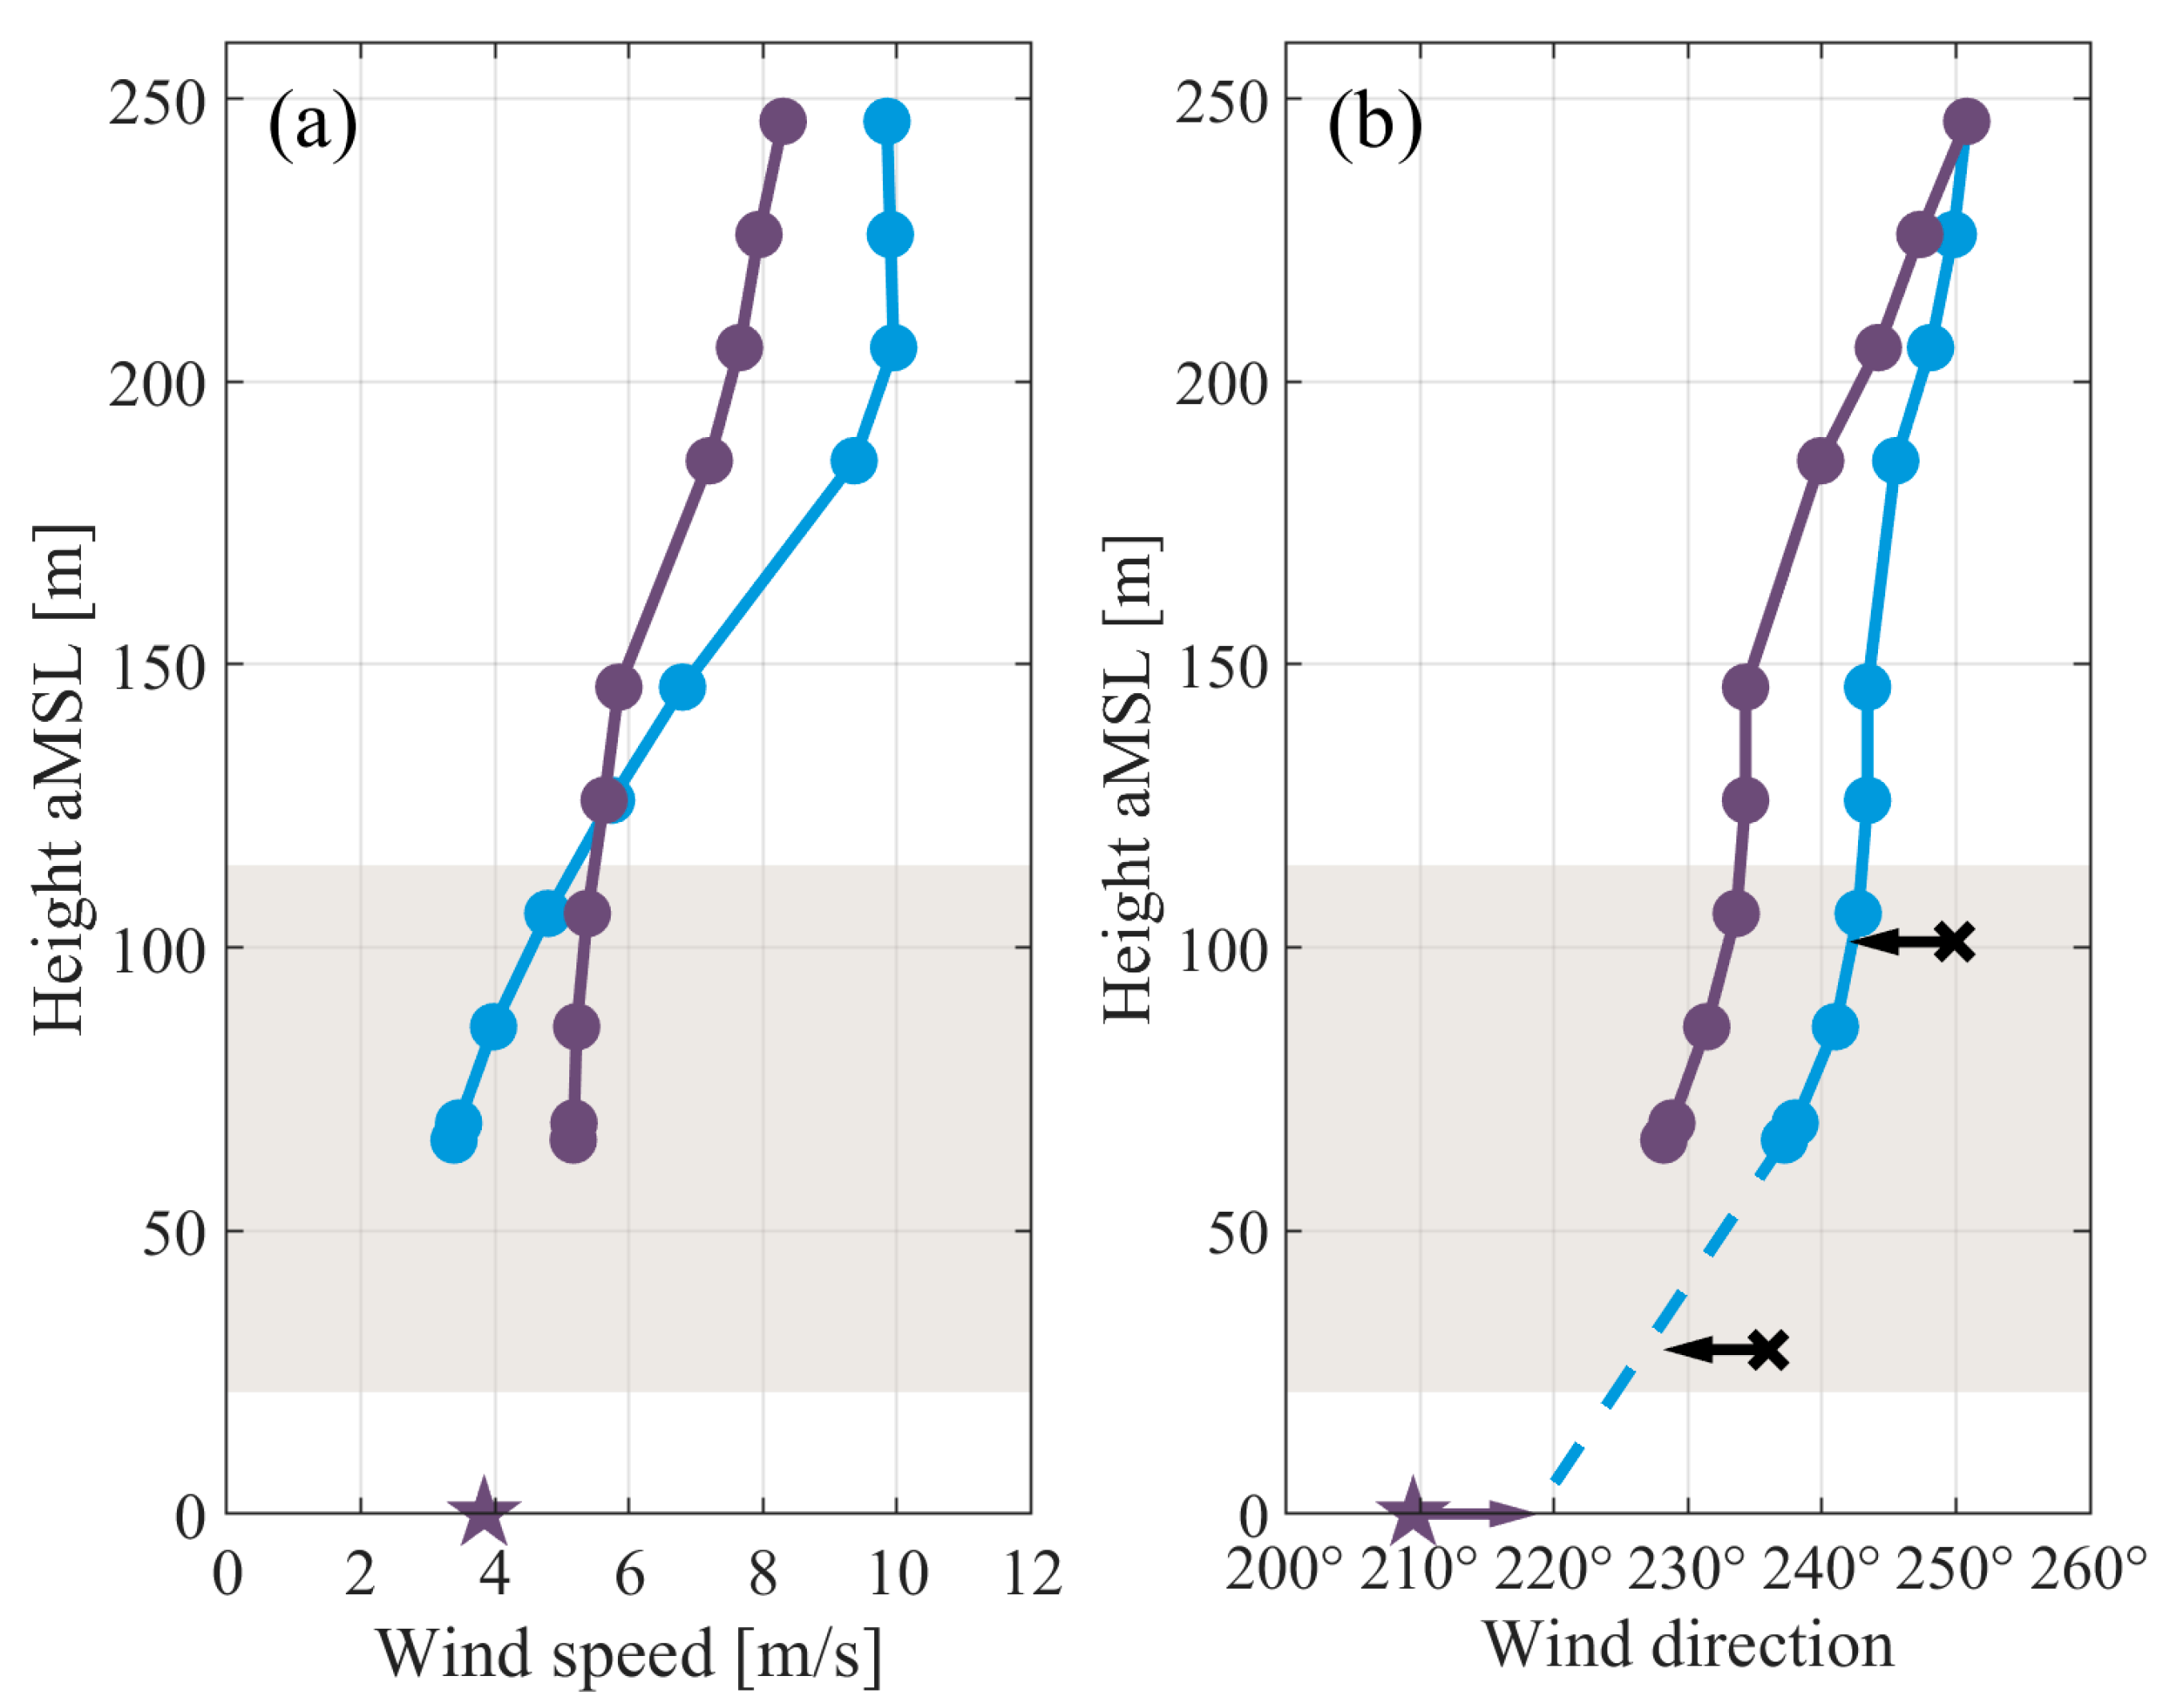
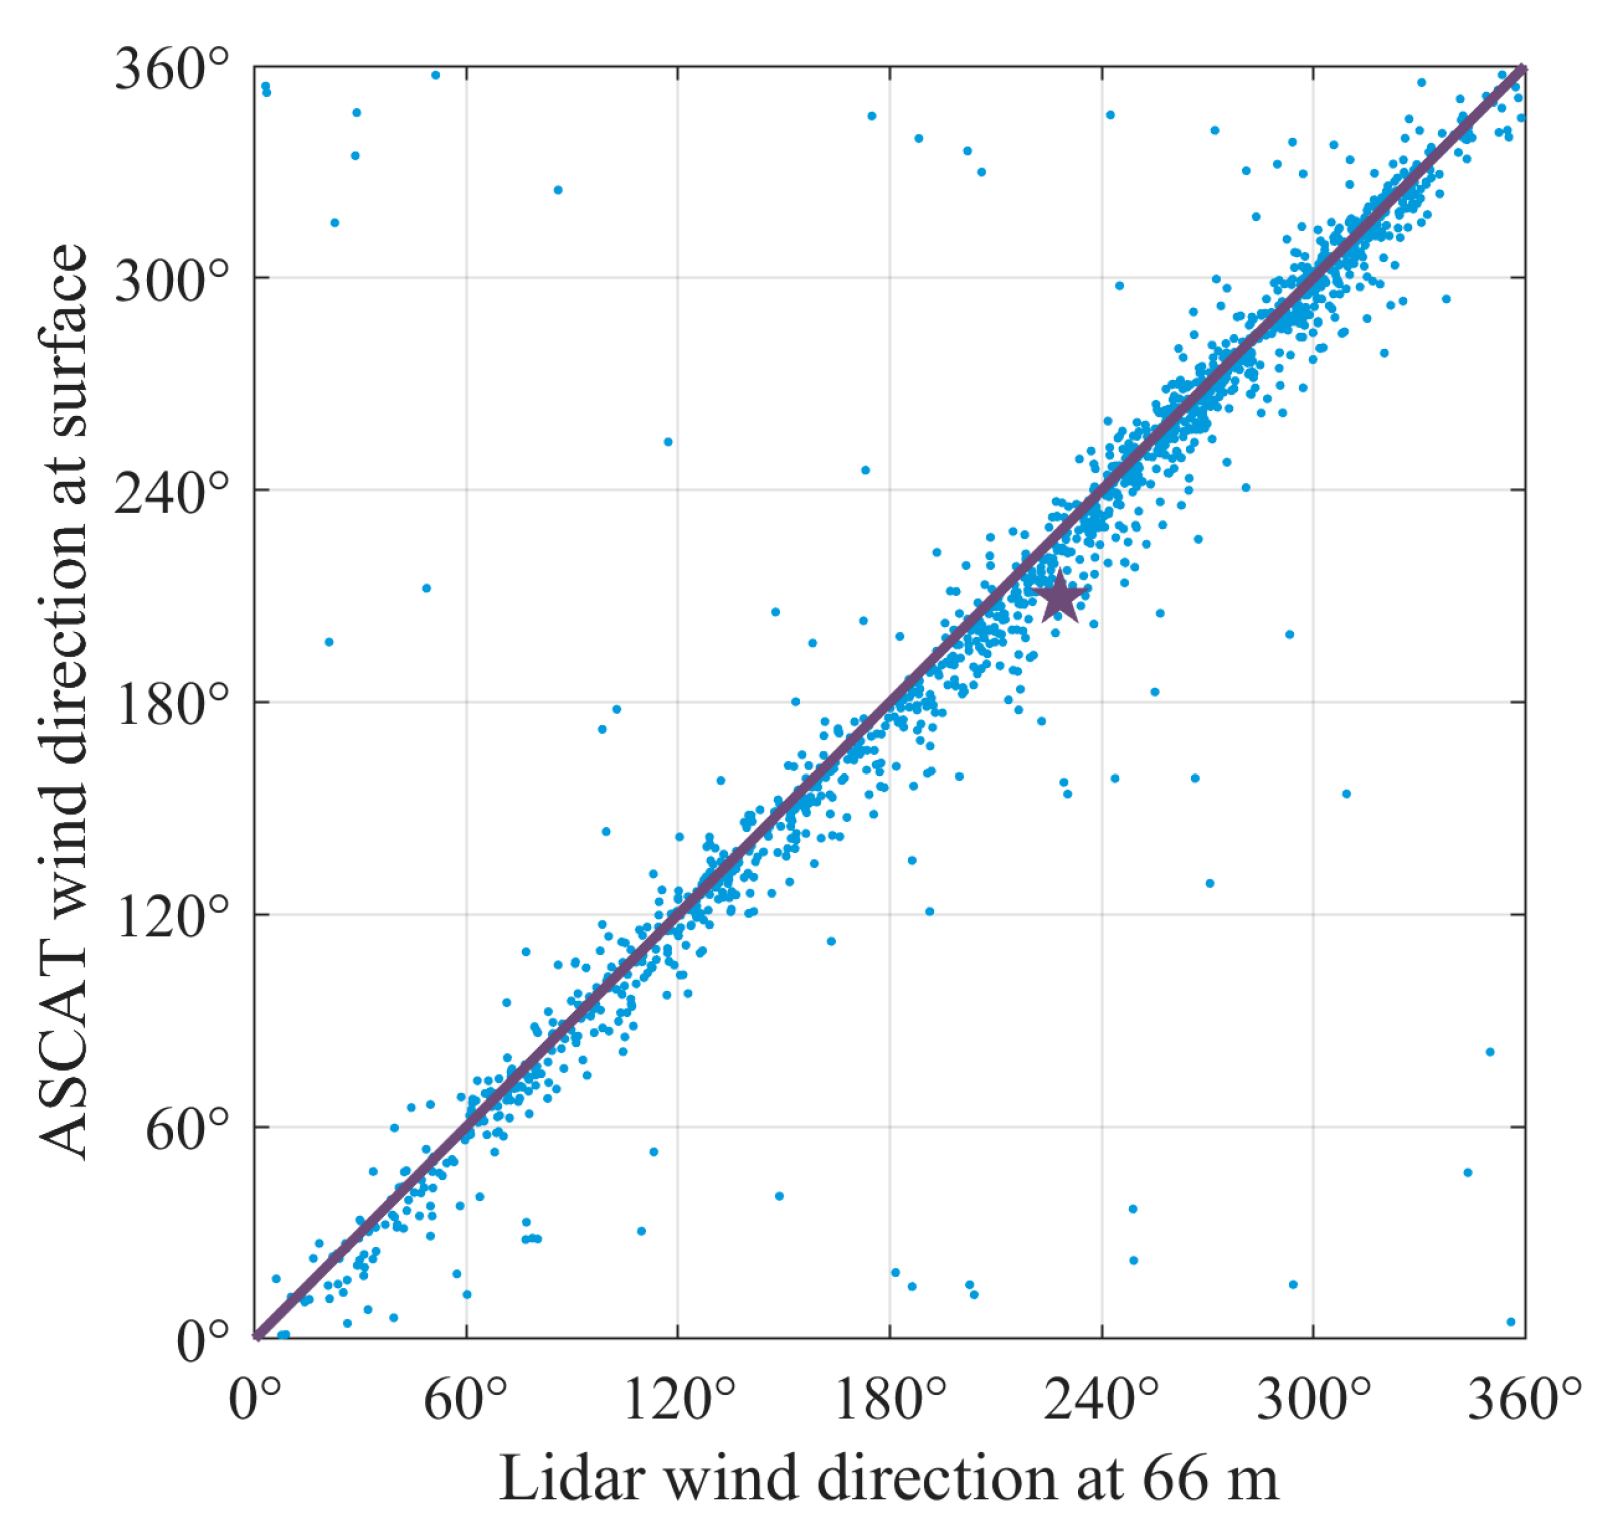
Figure 11a). This is also observed in the photos. However, there is a difference in the directional alignment of the turbine wakes between the model results and the photos. According to the engineering model, straight wakes were predicted, while in the photographs, a slight clockwise curving is noticed. The wind veer was 0.14°/m in the upper swept area. Based on surface observations from ASCAT and measurements from FINO3, the veer in the lower part of the rotor swept area is believed to be even stronger. In strong veer, the turbine wakes turn clockwise [
31]. The model does not resolve the veer, but for comparison, the model output using an inflow wind direction of 219° estimated near the surface is shown in
Figure 11c. The orientation of the resulting wake pattern matches the fog trails in the photographs better. The agreement with the observed pattern of production is slightly better when the wake simulation is based on the observed wind direction at hub height.
The model results predicted blockage effects in an arc curve in the local area upwind south and west of the wind farm, see
Figure 11a. The fog in the photographs was located approximately in the same local area. In areas with lower winds (stagnant air), condensation processes could be the causal reason for the warm, moist air transforming to fog. The condensation is dependent upon a delicate balance between humidity, temperature, and air movements. Higher winds will dissolve the fog. Thus, the areal extent of the fog is likely to reveal the low wind speed region.
The measured production per turbine at 15:10 UTC is shown in
Figure 11b. All but three turbines produced power. Some produce below 100 kW, most between 100 and 400 kW, and few above 400 kW. The turbines with the highest production are located along the western front row. The large variation in power production is due to wind speeds just above cut-in and the wake effects.
The wind speed deficit in
Figure 11a,c differs slightly in the upwind area affected by the blockage effect as well as accelerated flow along the sides of the wind farm and between turbines. As already said, the power production compared best in
Figure 11a based on the wind direction at hub height, while the fog trails were better matched in
Figure 11c with wind direction near the surface. The slightly accelerated flow from between turbines is present in both
Figure 11a,c and is expected to be more pronounced closer to the surface than at hub height. The accelerated flow below and between turbines is due to the deflection of some air mass below the turbine rotors. This has been observed at wind farms offshore in SAR [
11,
32] and wind farms on land by lidar [
33] and modeled by WRF [
14] and LES [
34]. The accelerated flow would explain the overall dominant clearing of sea fog near the surface between the turbines, as visible in the photos.
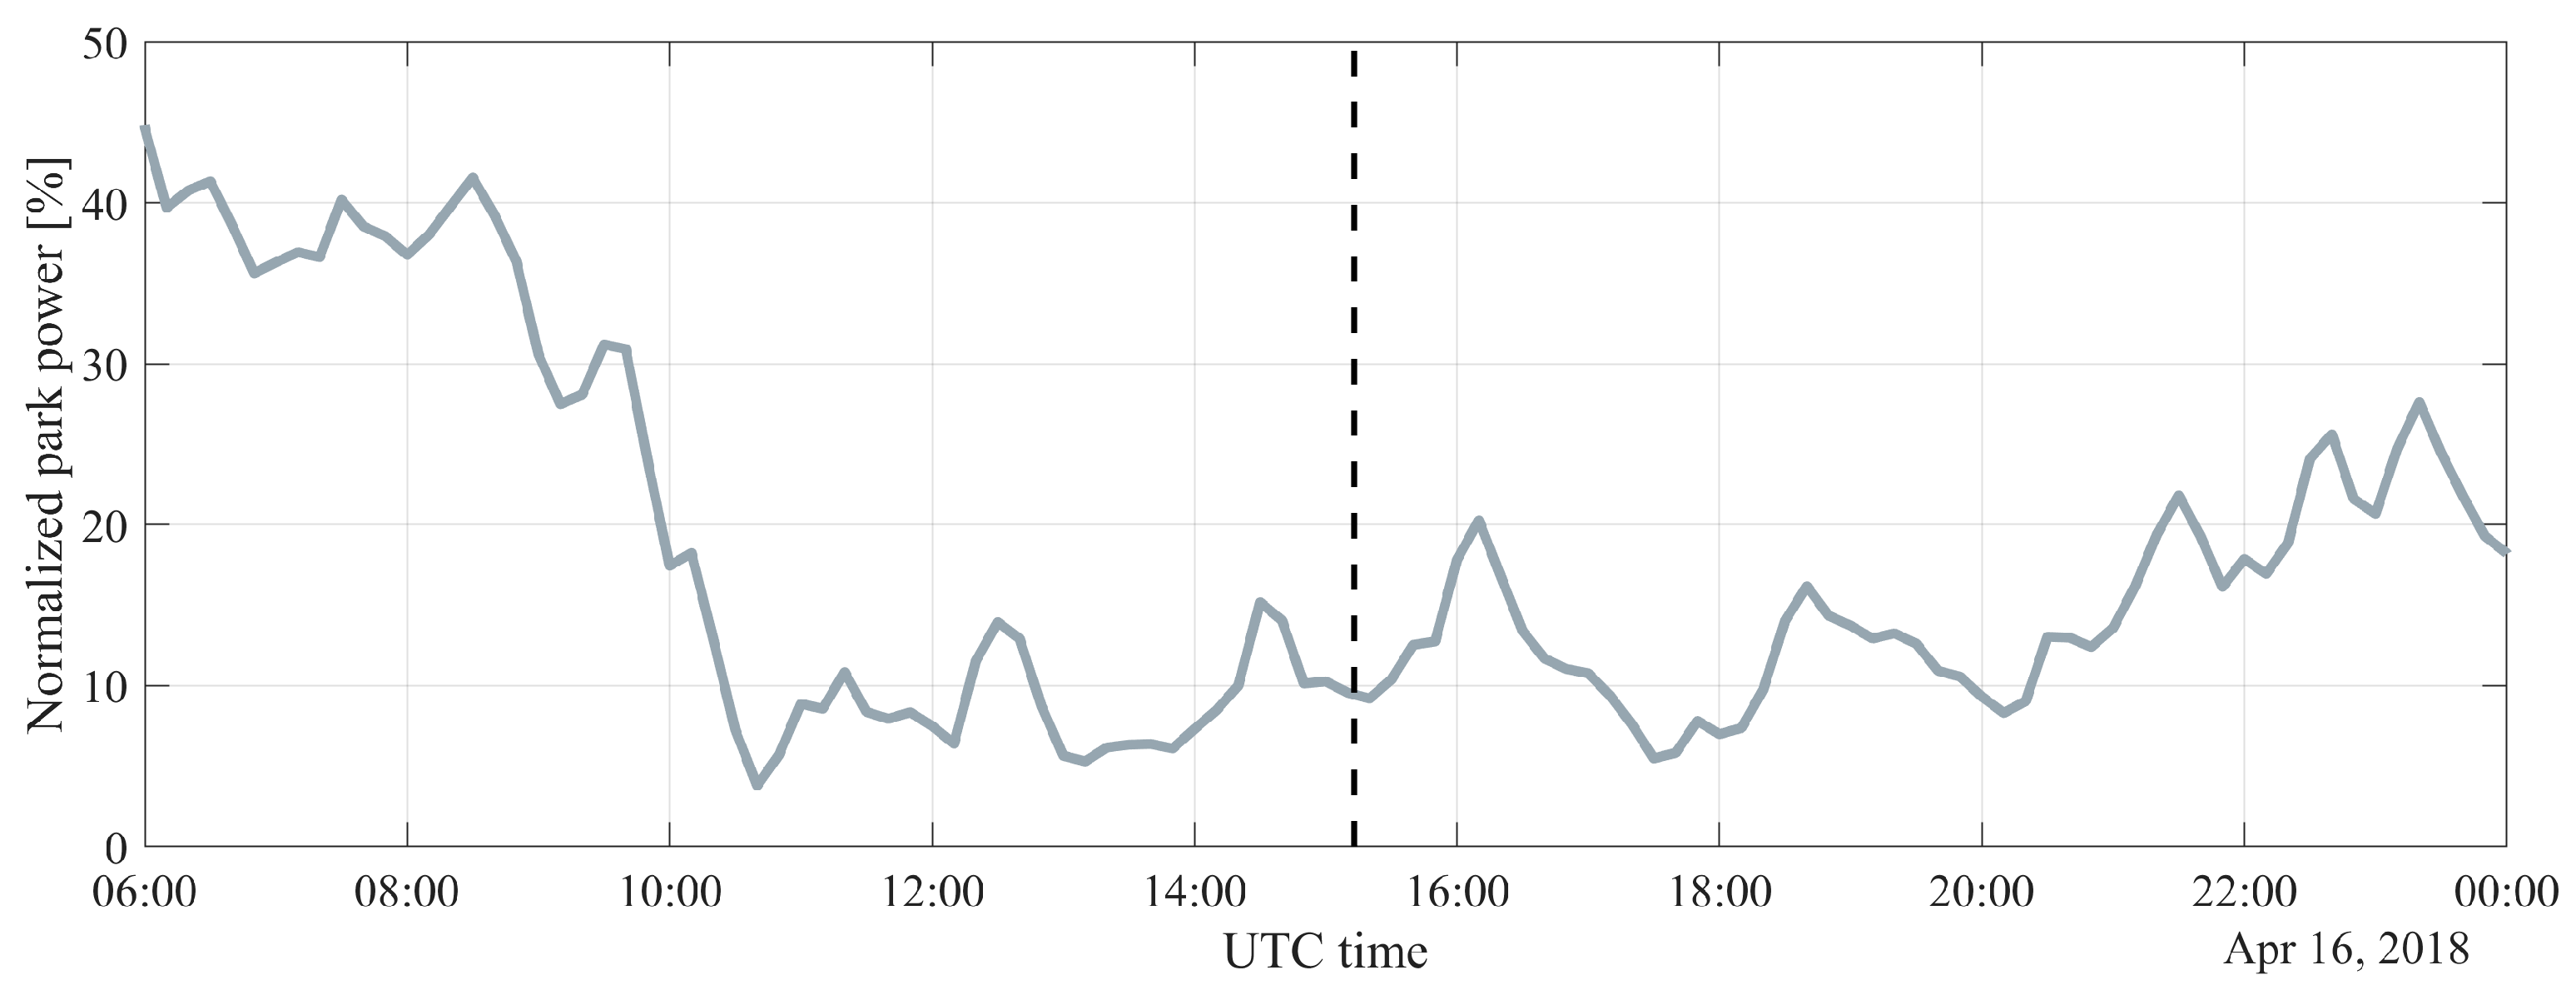
The production of power at the Horns Rev 2 offshore wind farm on 16 April 2018 from 6:00 to 24:00 is shown in the form of the normalized park total power in
Figure 12. At the time of the photographs, the normalized park total power was 10% of the installed capacity.
5. Discussion
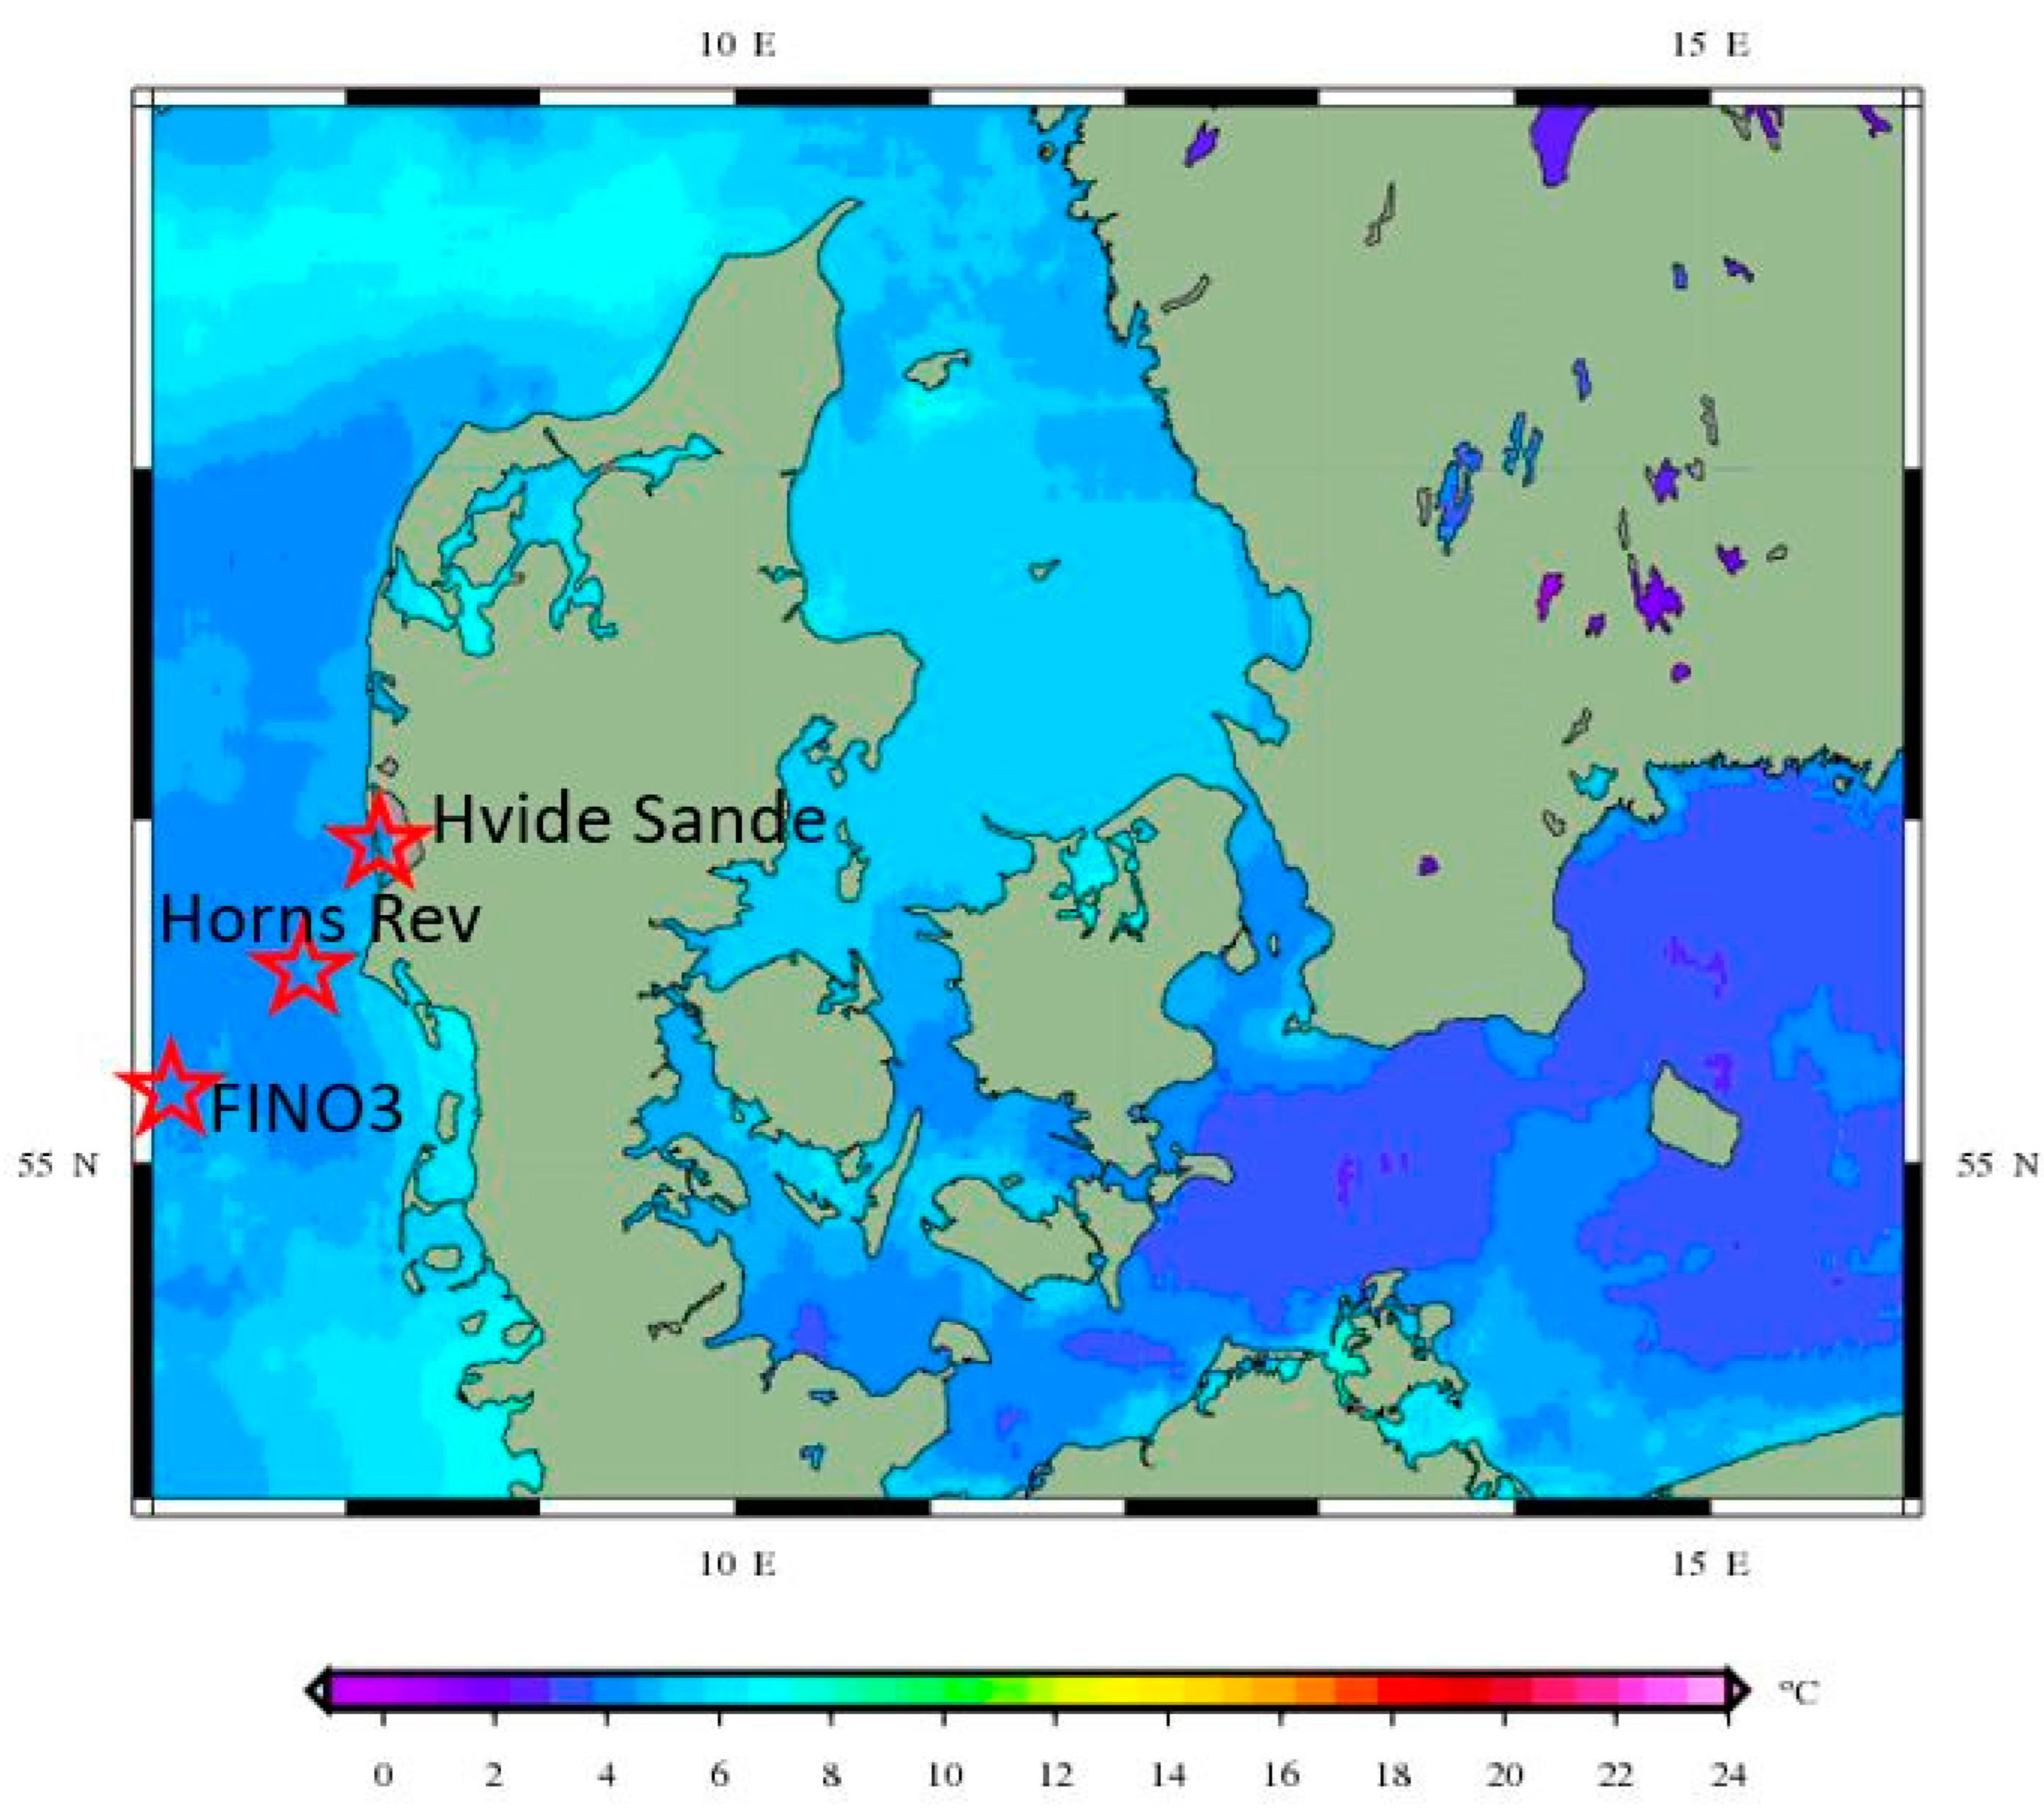
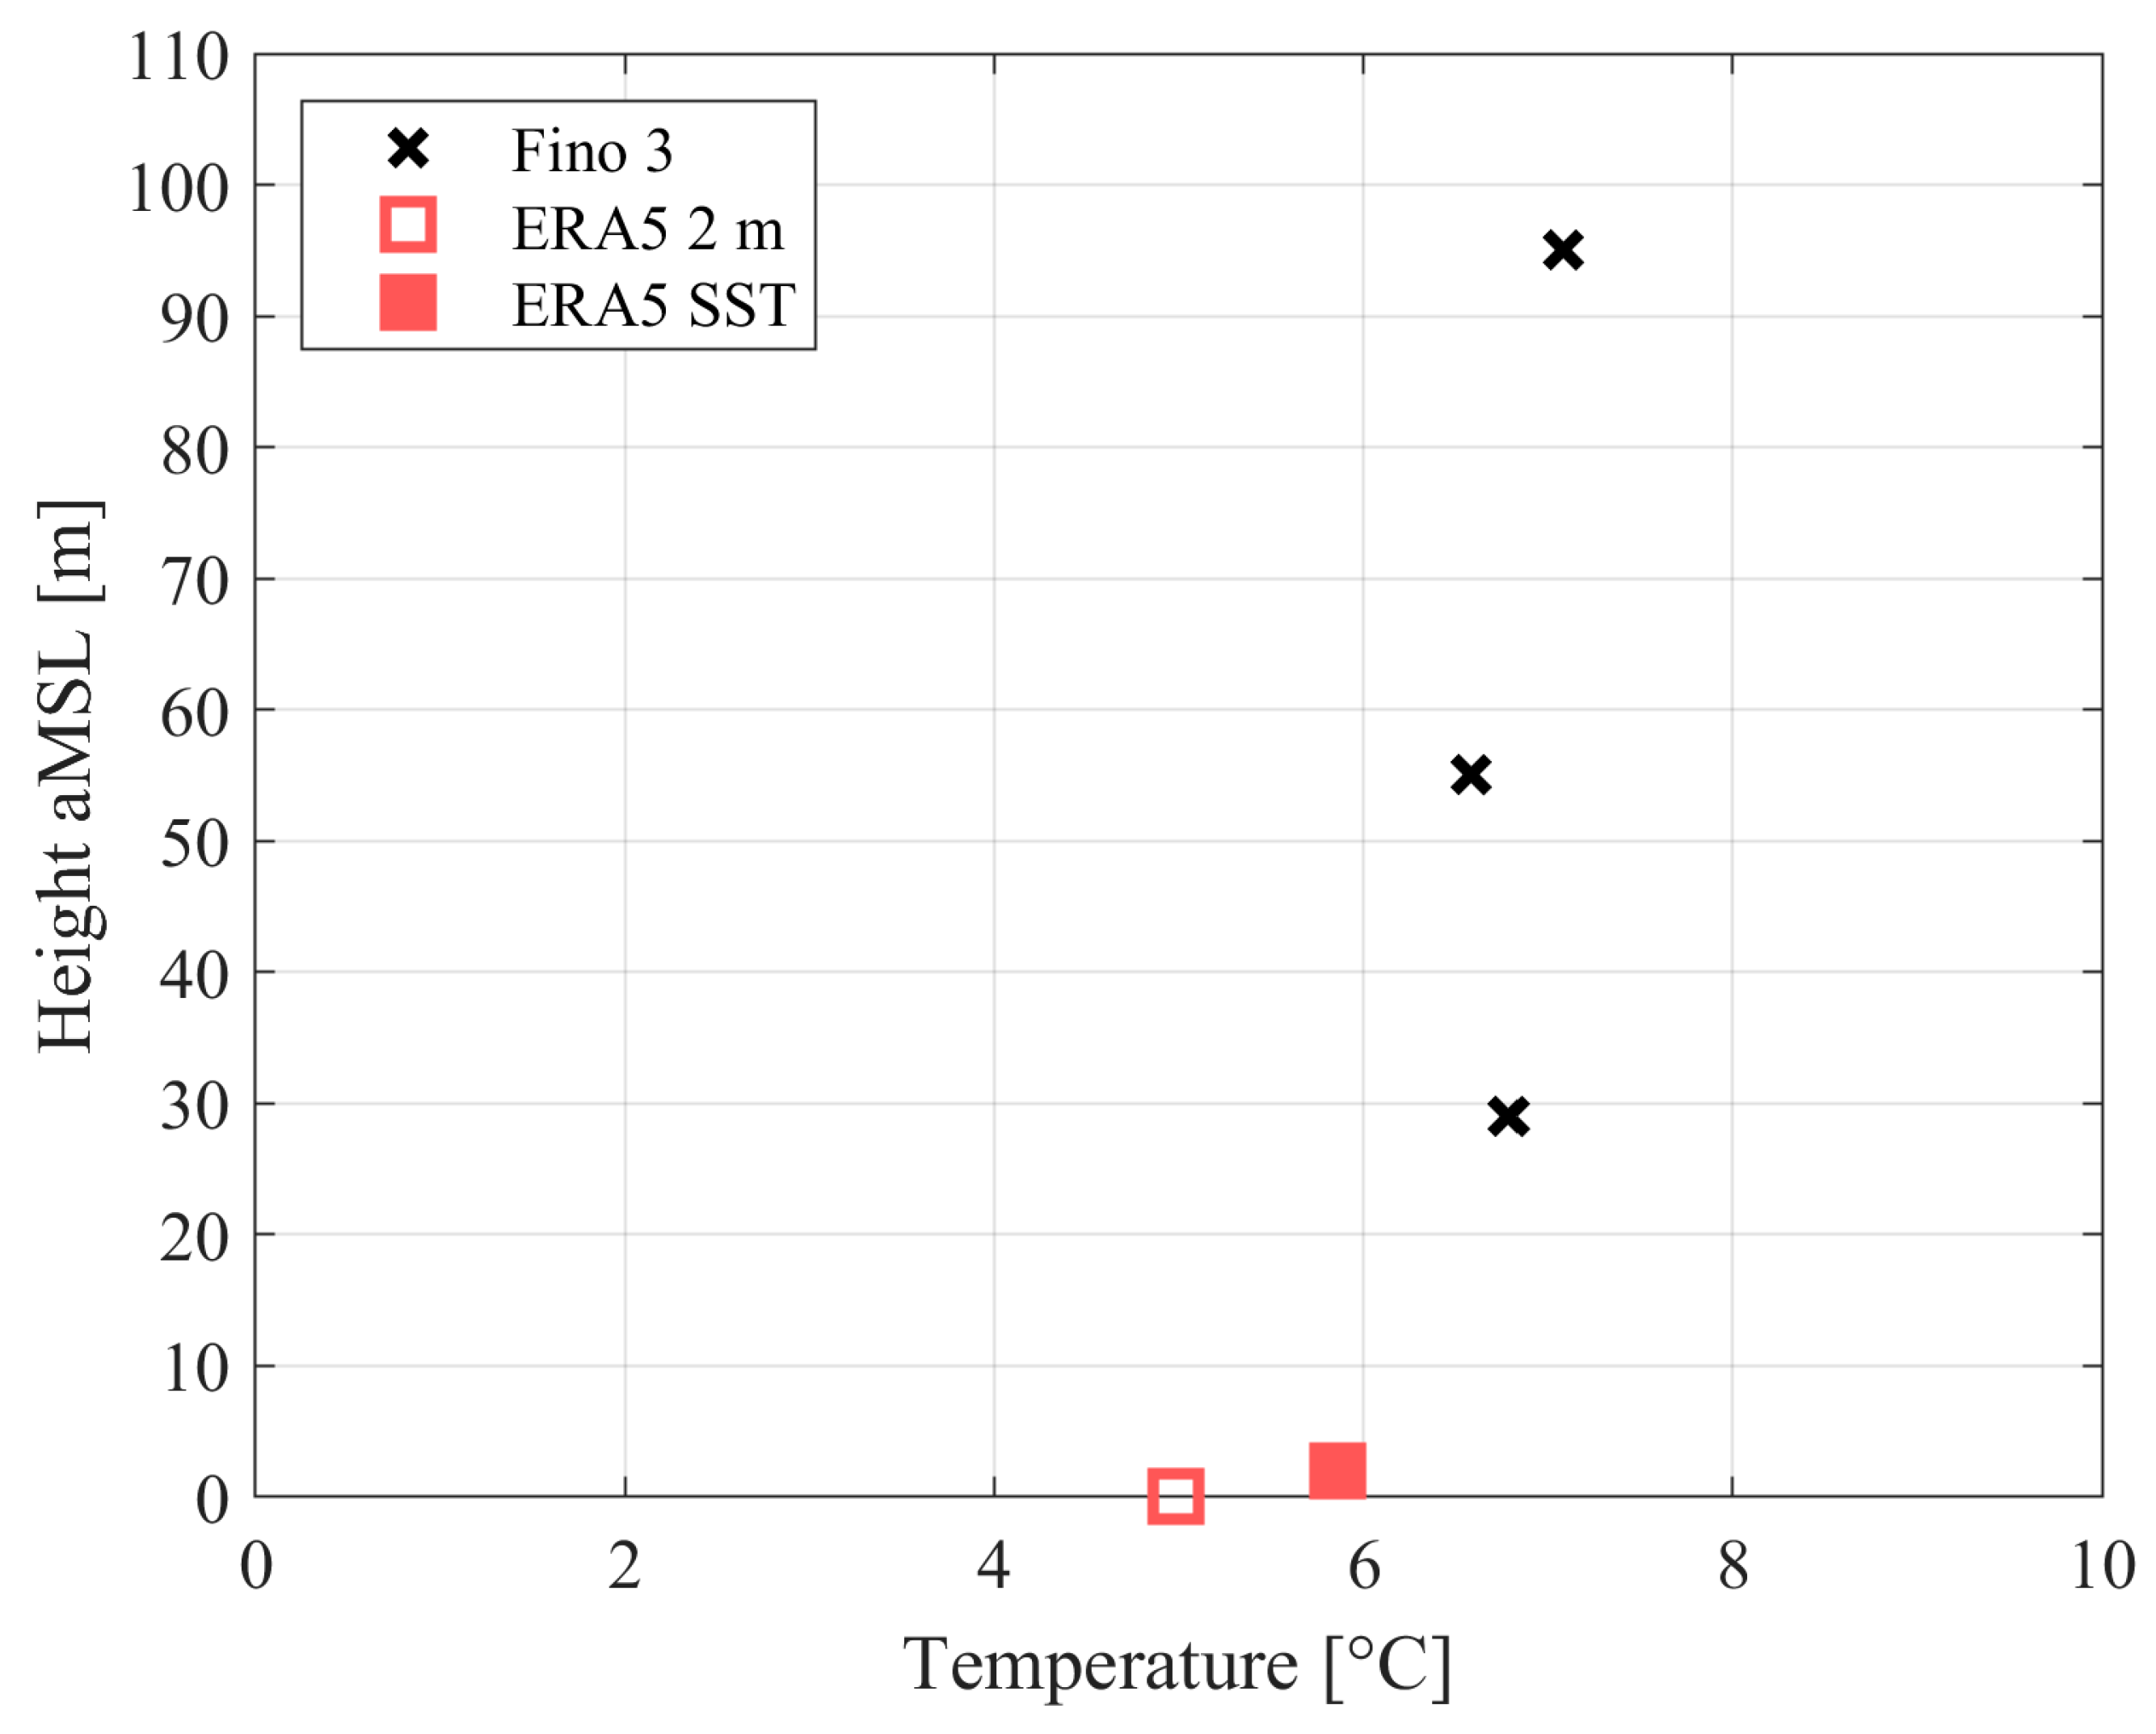
At the time of the photos, the local ambient meteorological conditions at Horns Rev were characterized by wind speed around 6 m s
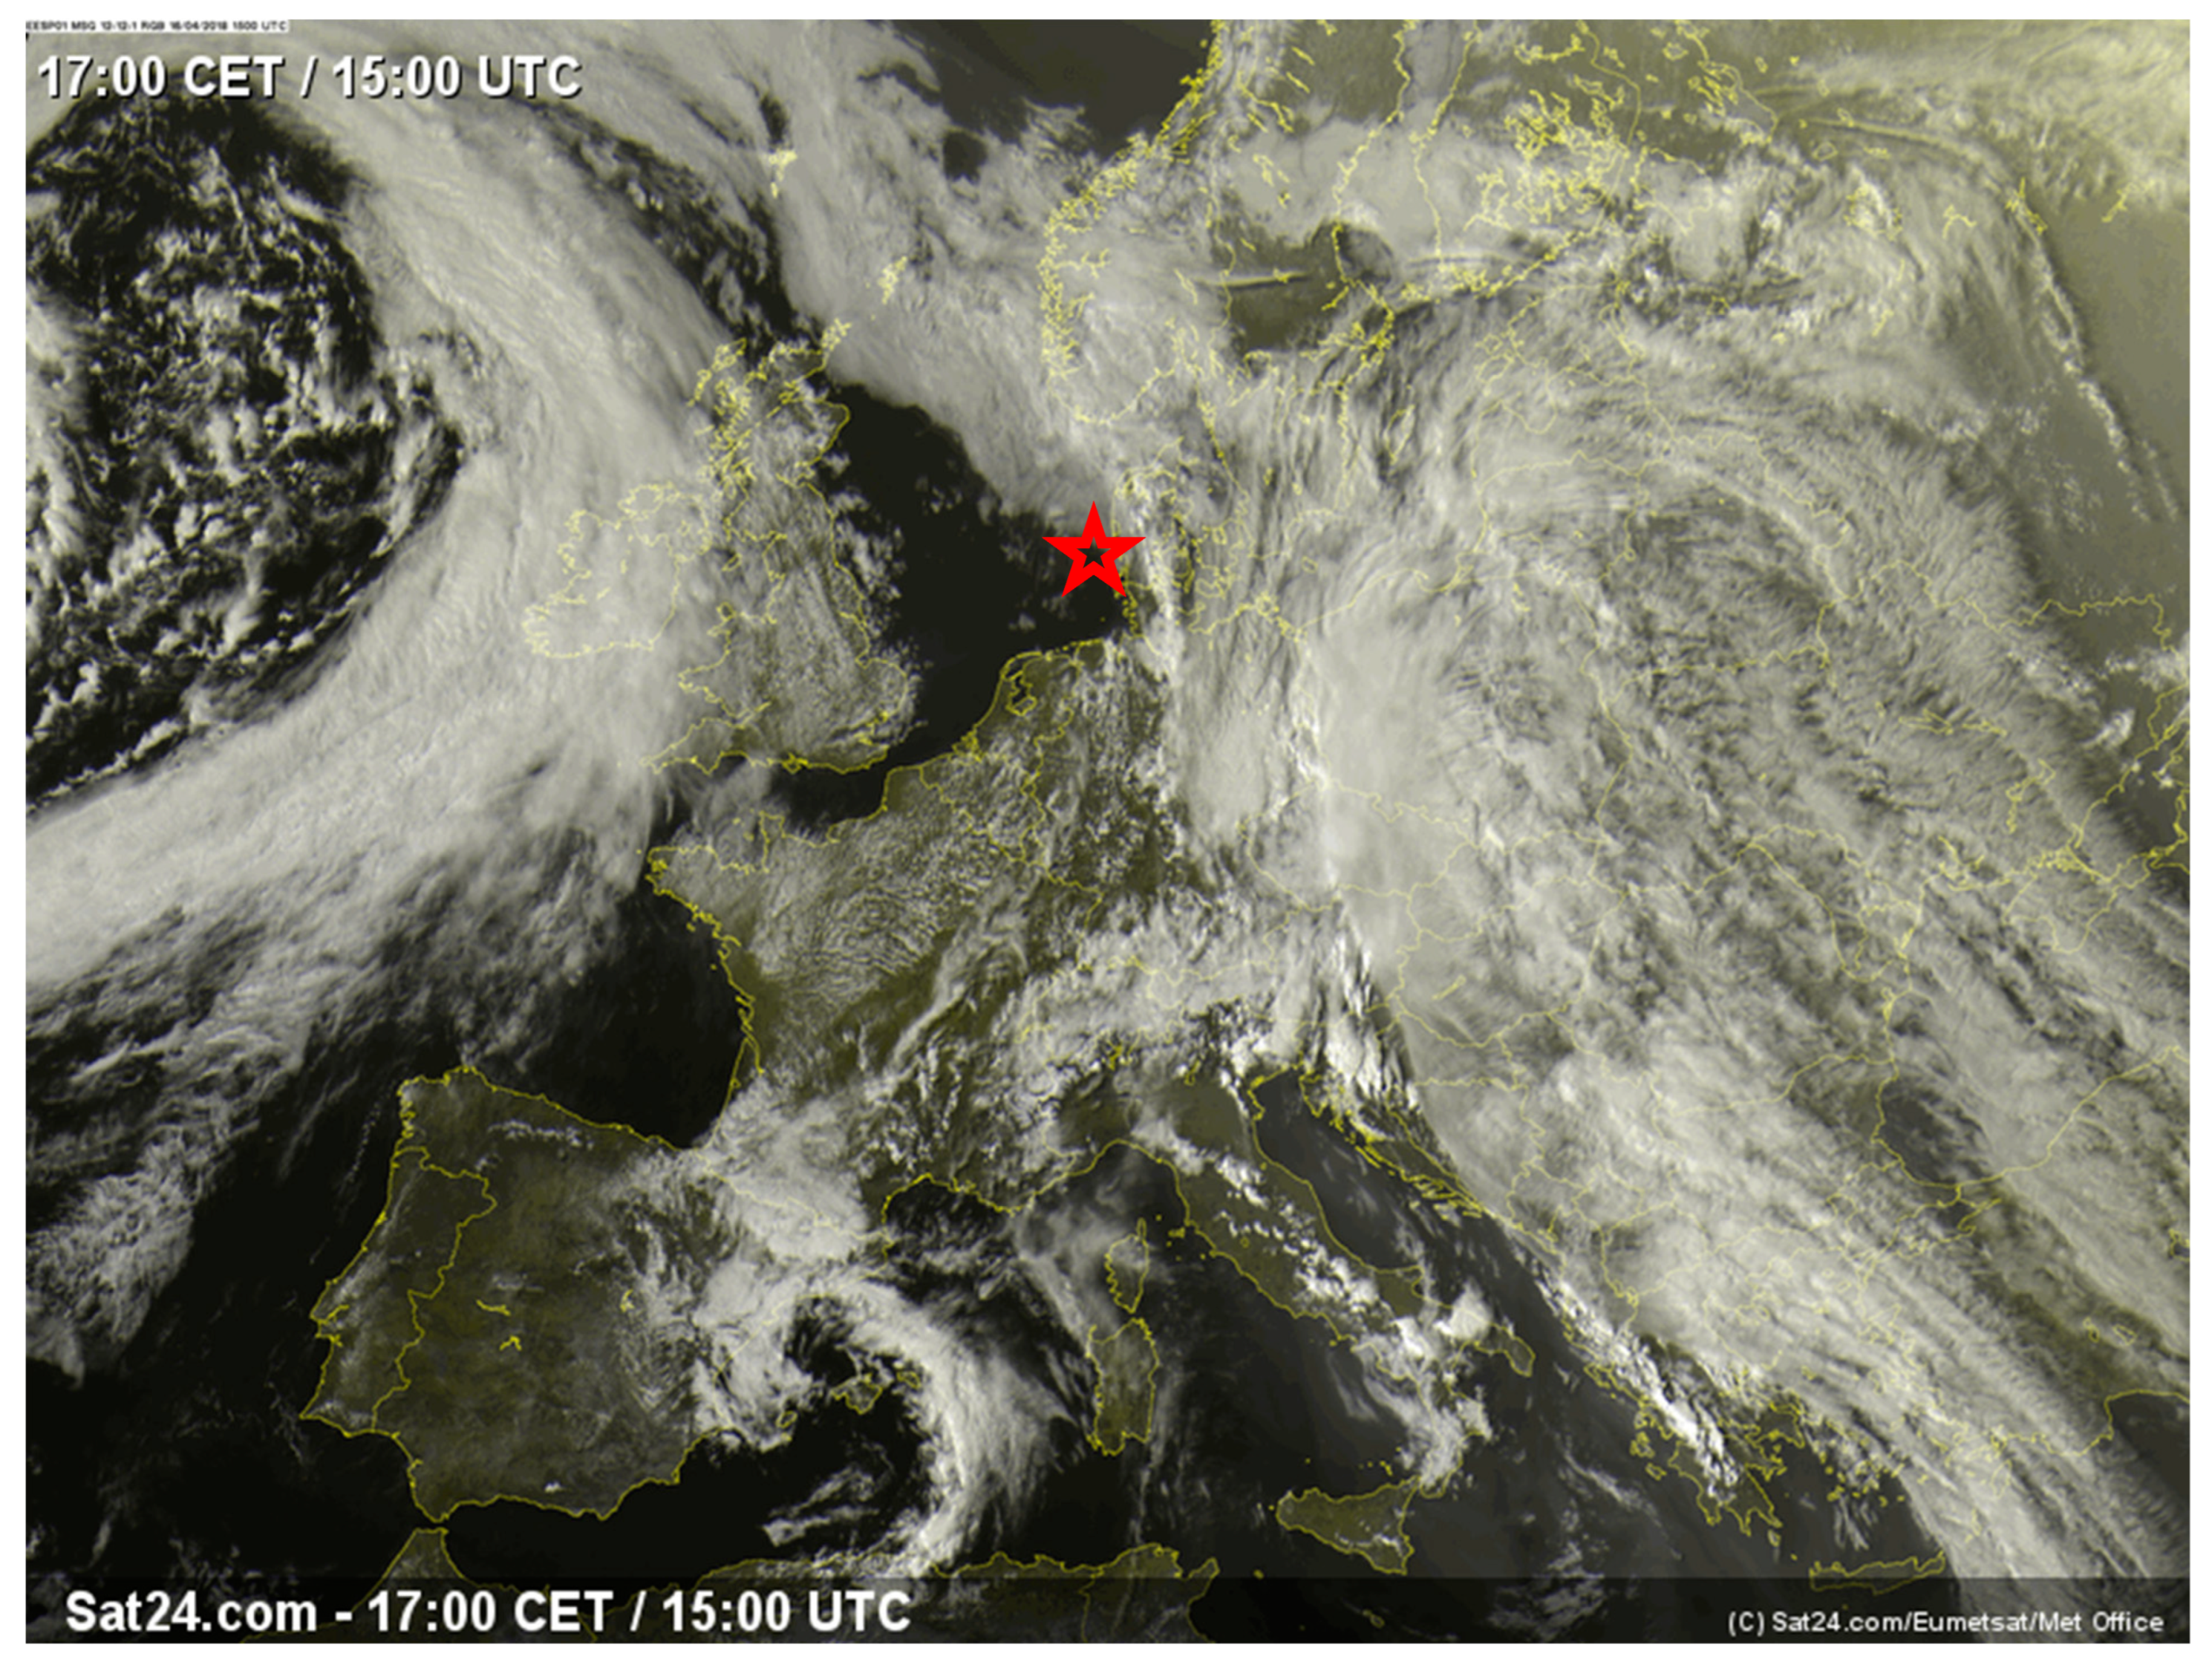
−1 at hub height, wind direction from SW, a shallow boundary layer, stable stratification, a strong veer, low turbulence, and high relative humidity. Advection of warm and moist air mass over the cool sea caused cold sea fog. This is supported by satellite, lidar, and meteorological observations and reanalysis model results. Stable stratification is frequently observed during spring at Horns Rev [
35]. 16 April is in the midst of this season.
The Horn Rev 2 wind farm produced 10% of rated power at the time of the photos. The highest power production was at the turbines located on the western edge, while turbines in the deep array produced very little due to the low winds near cut-in. Results from the engineering wake and blockage model of Horns Rev 2 predict a strong velocity deficit in the downwind area, around 10% to 20% velocity deficit. This corresponds to low power production as the turbine cut-in wind speed is 4 m s
−1. In stable stratification, wakes are long and narrow as the mixing process is suppressed. Long and narrow wakes are observed in the photos. The wakes reach from one turbine to the next without much widening. There was a clockwise rotation due to a strong veer. The foggy wakes most likely were caused by the upward movement of humid air condensing in the wakefield where the dew point temperature was reached, a process previously supported by LES modeling of the wake dynamics in stable conditions with a shallow cold fog layer in the photo case in January 2016 [
20].
Looking at the far end of the wind farm, a clearing of the foggy wakes is noticed at the last few rows of turbines and beyond. A plausible cause for the fog dissolving in this region could be due to the entrainment of drier air from aloft mixing down into the shallow boundary layer. A similar entrainment effect was explained to clear the fog downstream of the wind farm in the photo case in January 2016 [
20]. For that case, the entrainment process was modeled from a mesoscale model, including an explicit parametrization of the wind farm effect on the atmospheric flow, and the entrainment drying effect was predicted to reach many kilometers downstream [
20], which also appears to be present in the photo case from 16 April 2018 as the clearing stretches far downstream.
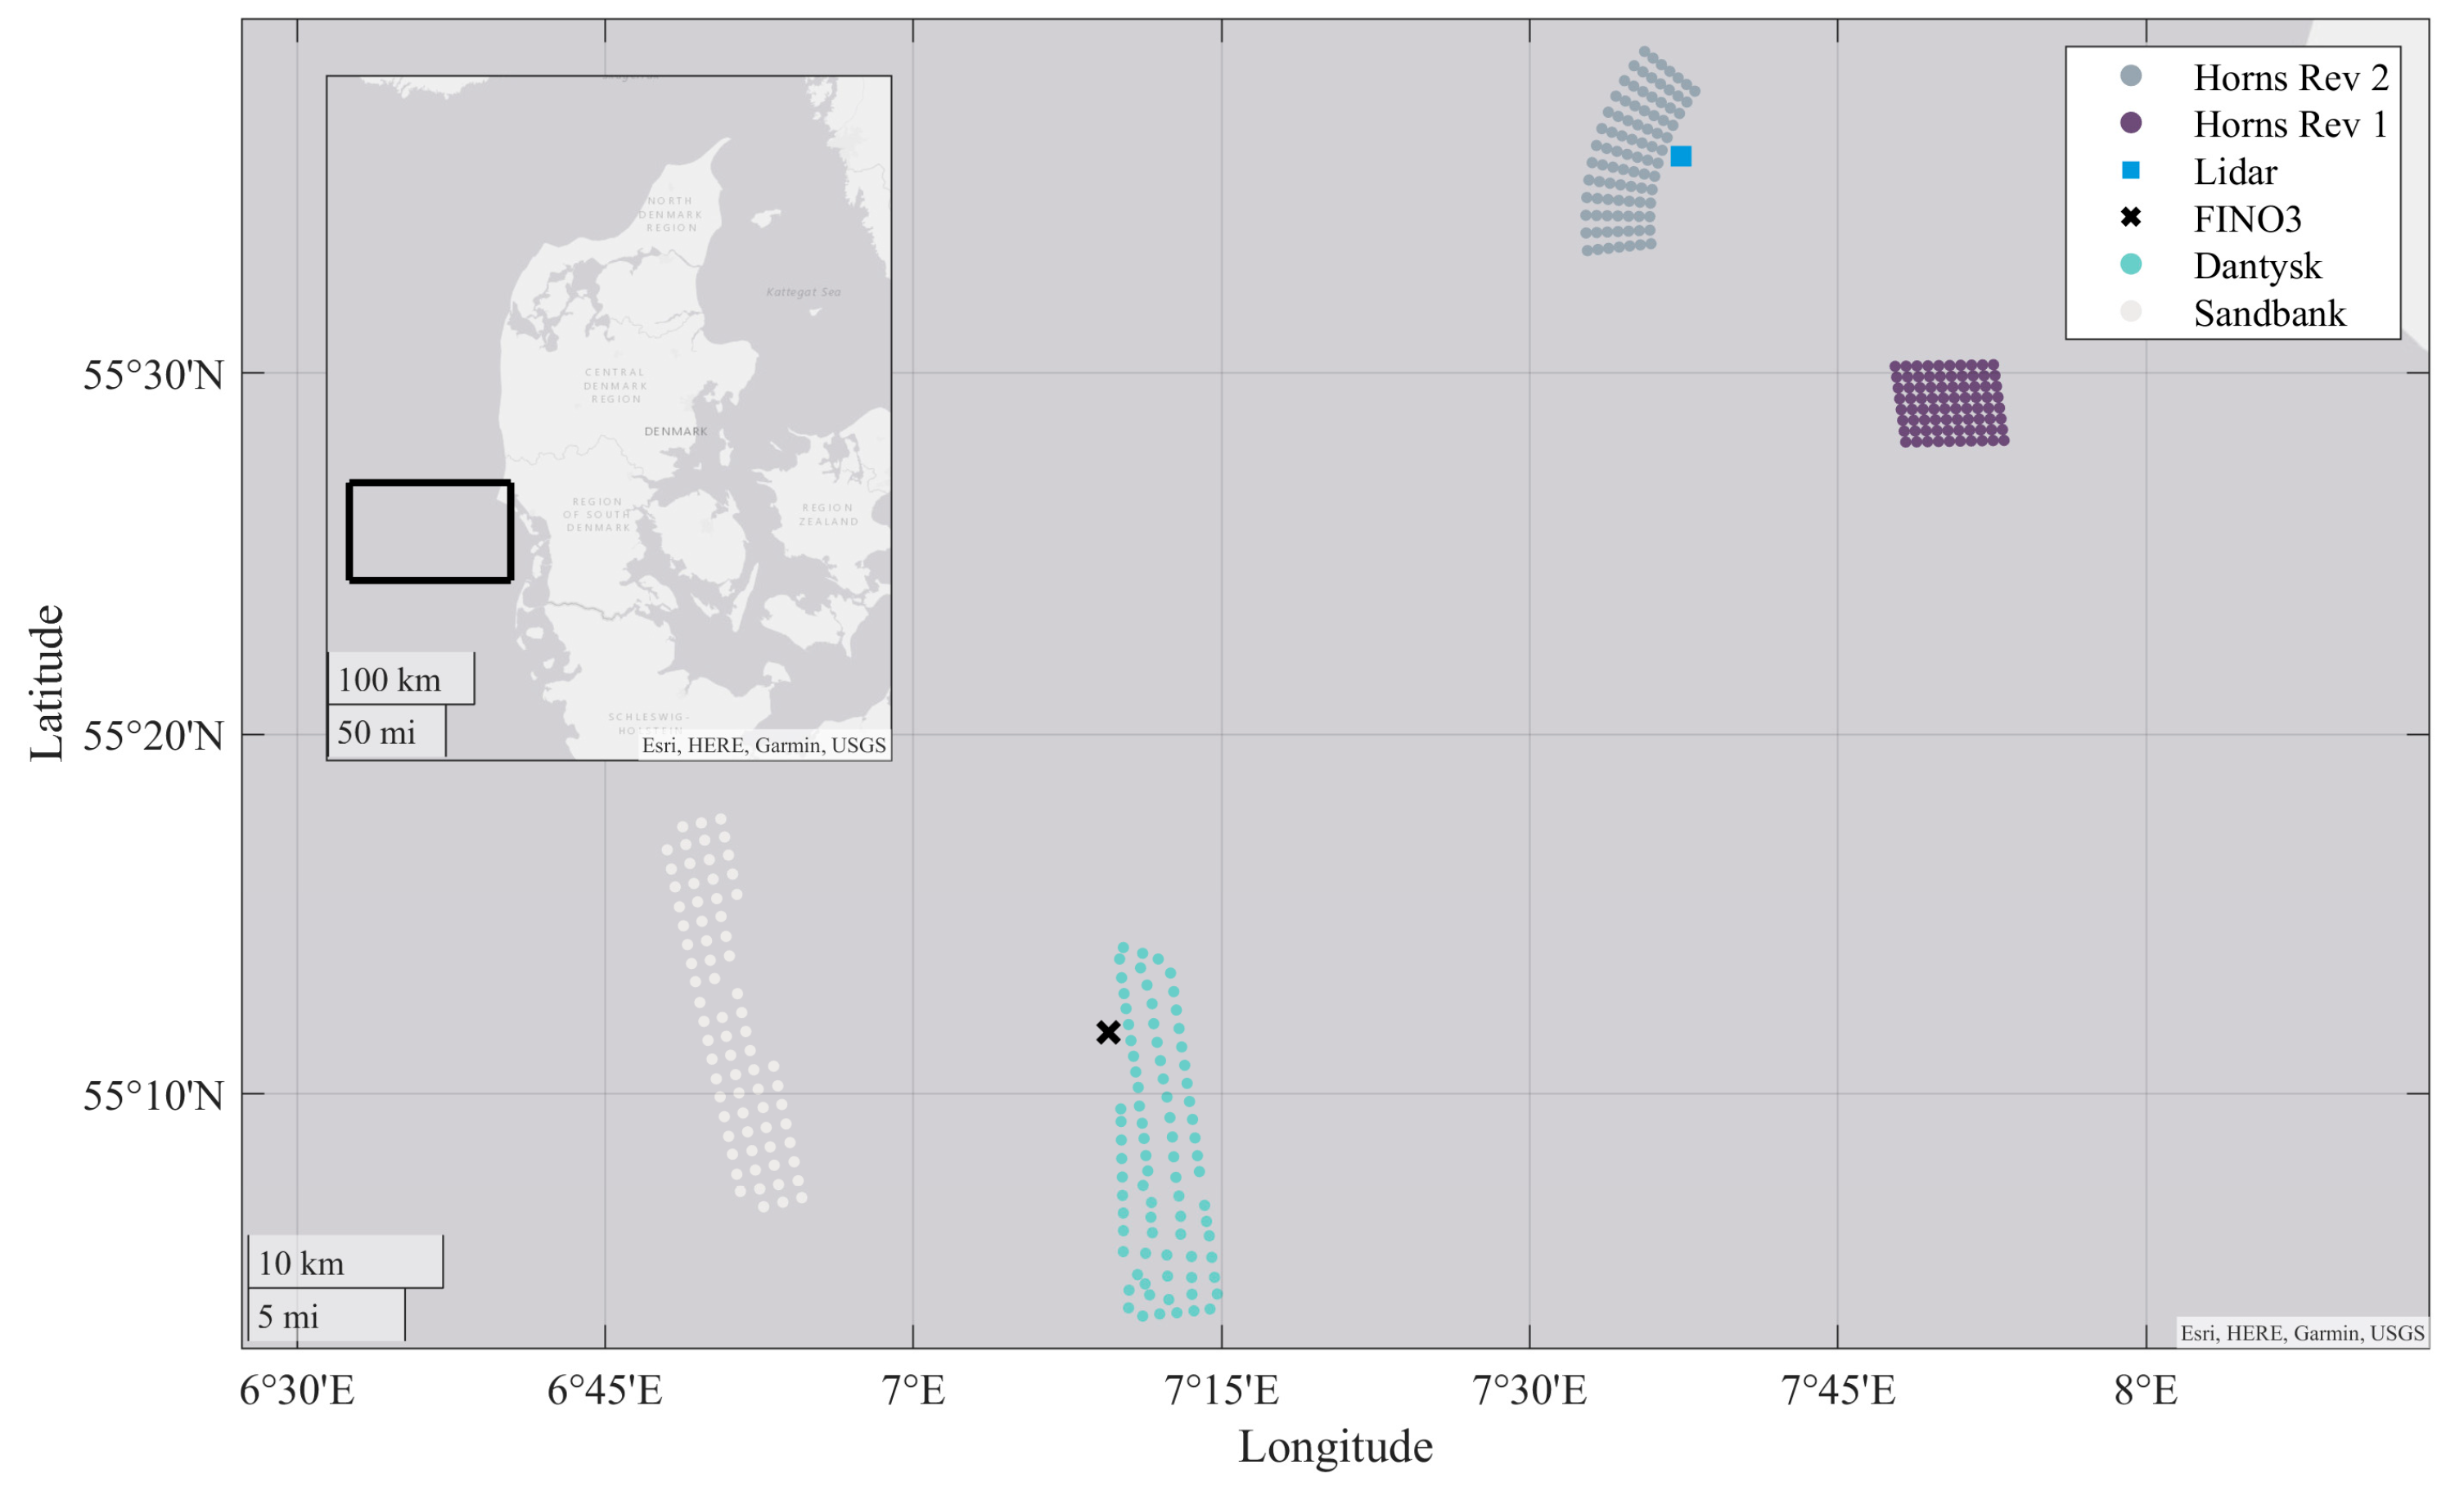
Four hours before the photos, a Sentinel-2 image from the European Space Agency observed at 10:53:33 UTC over DanTysk and Sandbank wind farms southwest of Horns Reef showed visible wakes [
36]. Sentinel-1 is an optical sensor, and the “true color” image shows bright clouds, darker seas, and, in light gray, the complex wake structures in DanTysk and Sandbank. This is likely due to cold sea fog in this area, but it is outside our study area and scope. Horns Rev was covered in clouds at this time.
Moving on to study the blockage effect at Horns Rev, the engineering model predicted a large arc shape region upwind SW of the wind farm. The velocity deficit due to blockage was much smaller than the wake velocity deficit. This corresponds well with other model studies on blockage and wake velocity deficit [
1,
2,
3,
4,
5]. The reduced wind speed of 1% extended around 1000 m, or around 10D. Closer to the wind farm, a higher velocity deficit of up to 2% was predicted. The model results were for hub-height winds. Blockage and wake effects depend upon turbine layout, size and spacing of turbines, and their operation [
4,
5,
13,
33]. For turbines in closely spaced grid layouts, more pronounced wake effects were found than for curved layouts [
37]. Horns Rev 2 with a curved layout is expected to have less wake loss and lower blockage effect than wind farms in grid layout.
The variation of the blockage effect with vertical distance from surface to hub height needs consideration. CFD model results suggest a rather constant blockage effect from surface to hub height [
1]. Furthermore, analysis of meteorological mast data near a wind farm showed only small variations in blockage effect comparing between 70% of hub height versus hub height [
1] and analysis of lidar observations at 25 m for a wind farm with turbines hub height at 92 m, i.e., 27% of hub height, showed blockage effects of 4% at a distance of 25D (2.9 km) in stable conditions offshore [
18]. From visual inspection of the photos, the cold sea fog horizontally stretches ~ 1000 m upstream, i.e., ~10D, south of the wind farm, and ~2000 m, i.e., ~20D, west of the wind farm. The cold sea fog reached a vertical extent slightly below the lower tip height (21.5 m). This corresponds to heights less than 30% of hub height.
Turbines operating in the partial load range and stable stratification appear to cause reduced winds far upstream ~20 D or more from scanning lidar data analysis [
18] and from visual inspection of the fog in the current case. The blockage effect has a long horizontal extent.
As mentioned in the introduction, fog formation is governed by the moisture–temperature structure, wind speeds, wind shear, mixing processes, and turbulence intensity. From the analysis, it can be assumed that the wind speeds were some percentage lower upstream due to the blockage effect. Lower winds in the area, possibly affected by wind farm blockage, might explain the fog condensation. Fog tends to form in low winds, while higher winds tend to thwart condensation. In the SW corner of the wind farm, winds may be slightly higher, and the blockage is only weak; therefore, we do not see fog condensation in this region. This might be ascribed to spatial inhomogeneity in the flow locally.
At the time of the photos, a strong veer was present. Data from the wind lidar shows a veer at 0.14°/m in the upper swept rotor area, and using a combination of lidar and ASCAT, a possible veer at 0.48°/m (or less) was inferred in the lower rotor swept area and down to the surface. Comparing this extraordinarily strong veer to other studies reveals it is not unrealistic. LES model simulation of the blockage effect showed the strongest veer for very stable conditions [
5,
38]. Observations of winds at 10 m and 116 m height at a mast in Texas, US, showed veer in stable conditions with values slightly above 0.4°/m at the extreme end of the distribution [
39]. Furthermore, [
40] reported meteorological mast observations from 10 m and 98 m height with a veer at 30°/m for a shallow stable nocturnal boundary layer on land. At the coastal site, Høvsøre, 55 km north of Hvide Sande, wind profile lidar data showed a strong veer in stable conditions [
41,
42]. Also, offshore data supported strong veer to exist. According to [
43] observations at 40 m and 200 m height at the US East Coast documented veer to reach 0.4°/m based on lidar observations. It is realistic that a strong veer was present from the surface and within the rotor-swept area. In general, strong veer reduces AEP compared to winds with negligible veer. An indication of the veer is the clockwise turning of the wakes at Horns Rev seen in the photos.
6. Conclusions
Our study aim was to investigate whether wind farm blockage is a likely cause for the observed fog formation. The approach is novel. Our study is the first on offshore wind farm blockage effect revealed by fog.
The foggy conditions in the photos from 16 April 2018 visually outlined an area with shallow sea fog upwind of the Horns Rev 2 wind farm. The area extent reached ~10D south and ~20 D west upstream of the wind farm.
It is the first time a visual imprint of the blockage effect has become visible due to fog formation in the reduced wind speed area upwind of a wind farm.
Analysis of the ambient meteorological conditions and results from an engineering wake and blockage model for the wind farm supported the idea that a blockage effect might occur. The atmosphere was stably stratified with winds around 6 m s−1 at hub height, wind direction from SW, and a warm, moist air mass over a cooler sea. The precursor for cold fog formation is present with such ambient conditions, and sea fog could materialize when the wind speed is sufficiently low. Reduced wind speed upstream ~10 D south and ~20 D west of the wind farm could be caused by blockage, and therefore, blockage could have triggered the fog formation.
Wind farm wakes were long and narrow, as visually seen in the photos, and predicted by the wake model for stable stratification. Clockwise turning of the wakes was ascribed to veer in the rotor-swept area and below.
In conclusion, based on the available meteorological observations and results from an engineering wake and blockage model, it is plausible that the fog revealed a blockage effect at the Horns Rev 2 wind farm.
The implications of the study for researchers could include a comparison to LES modeling, adding atmospheric stability and veering to the flow equations to achieve results on the blockage and wind farm wake effects with greater detail near the wind farm. WRF modelers could use and test wind farm parametrizations to capture the formation of fog as well as the blockage effect, wind farm wake, and entrainment at the far field for the case. Wind farm developers and operators could gain further insight into flow phenomena at large offshore wind farms, such as blockage upstream and veering of the wake.
