Abstract
This study provides insights into the experience gained from the investigation of the dynamic behavior of a mature sour hydrocarbon reservoir modeling under an acid gas re-injection process production strategy. The primary objective was to analyze and evaluate the production behavior of proposed injection zones by assessing various injection scenarios and obtaining oil production over time. To achieve that, a workflow was developed to prioritize potential injection areas, select the optimal wells, determine the optimal operational parameters and optimize a pilot application design based on expected performance. Within this framework, the study encompasses diverse acid gas injection schemes on a pilot scale approach, including acid gas combined with waterflooding. The outcome of this analysis will eventually lead to the identification of the most promising and highest-performing injection scheme, elucidating the optimal range of operating parameters. This optimal combination forms the basis for the economic analysis of the venture and the subsequent detailed design of a full-scale application, where real-world implementation will validate the projected results.
1. Introduction
In the oil and gas industry, mature hydrocarbon reservoirs, often referred to as brownfields, require a thorough and well-planned production management strategy, as they have already undergone significant production, often spanning several decades. These reservoirs have reached an advanced stage of depletion in terms of reservoir pressure and are characterized by several key challenges. First and foremost, they face a decline in primary production rates, which implies that extracting hydrocarbons from these reservoirs becomes progressively more difficult and less economically viable, despite the original Capital Expenditure (CAPEX) depreciation. As the natural pressure that once facilitated the flow of hydrocarbons decreases (primary recovery), operators encounter issues such as increased water production, reduced oil recovery rates, and the risk of reservoir coning or gas and water breakthroughs. Moreover, mature reservoirs often exhibit changes in fluid properties over time that can include increased oil viscosity, varying gas-to-oil ratios (GOR), and changes in rock and fluid interaction, as well as a multitude of operational challenges, such as blockages in productive layers, liquid accumulation, and sand production [1,2,3].
Conventional primary recovery relies on natural drive mechanisms (e.g., oil, gas, and water expansion) and typically recovers only a fraction of the Original Oil In Place (OOIP), leaving a substantial volume of hydrocarbons trapped in the reservoir. When the reservoir pressure drops significantly low for hydrocarbons to be recovered economically, secondary recovery is typically employed to boost pressure back to an acceptable level and simultaneously improve the sweep efficiency of oil. This production stage relies on reservoir pressure maintenance through the injection of external fluids, such as waterflooding, where the water injected into the reservoir can act as a displacing agent, sweeping through the formation and mobilizing stranded oil, making it more susceptible to extraction [4]. This pressure maintenance enhances production rates and mitigates the risks of reservoir damage and conformance issues.
Waterflooding has been extensively employed to maintain reservoir pressure, thus aiding in additional hydrocarbon recoveries. However, it exhibits certain limitations that have become apparent in the face of modern reservoir demands and environmental considerations. Firstly, it can induce unwanted water production, which interferes with oil production, and, in the case of early water breakthrough, it may lead to premature well abandonment [5]. Secondly, waterflooding often leads to uneven oil displacement due to variations in reservoir rock permeability, leaving significant quantities of oil unrecovered. Lastly, the introduction of water can cause issues such as formation damage, scale deposition, and corrosion of production facilities, leading to increased operational costs [6].
Although primary and secondary production stages rely on pressure as the main production mechanism, maintained either naturally or by an external source, tertiary oil recovery methods, also known as Enhanced Oil Recovery (EOR), function by altering the chemical composition and properties of hydrocarbons to make them easier to extract. EOR is crucial for mature reservoirs since it offers innovative methods to extract more hydrocarbons, ultimately revitalizing their economic potential, and includes techniques like gas injection (e.g., natural or acid gas), chemical injection (e.g., polymers or surfactants), and thermal processes (e.g., steam injection), all designed to address these evolving conditions by altering the reservoir’s fluid dynamics. Furthermore, these methods can enhance sweep efficiency, ensuring that a larger portion of the reservoir’s oil is effectively displaced and produced, and can alter the properties of the remaining oil, reducing its viscosity and residual saturation, and improving its mobility, making it easier to extract. Each EOR technique is designed to address specific reservoir challenges (e.g., hydrocarbon sweep, viscosity reduction, etc.) and must be treated differently [7,8].
Sour resources refer to hydrocarbon reservoirs characterized by a significant presence of H2S and, to a lesser extent, CO2, which must be removed at onshore gas plants before the treated gas can be utilized onsite for operational needs or transported to the sales line [9,10,11]. To achieve this, the sour gas undergoes a process commonly known as “sweetening”, during which its H2S and/or CO2 components are separated in amine units, enabling the resulting natural gas product to meet the necessary specifications for transportation to various end users. Traditionally, the byproduct of this process, referred to as the acid gas stream, primarily consists of H2S and CO2 and is conventionally managed through sulfur recovery units (SRUs), like the Claus unit, which convert H2S into elemental sulfur [10,12]. However, SRUs do not significantly contribute to revenue due to the unattractive market price of sulfur, and their installation is primarily driven by environmental compliance. Additionally, the tightening of air emission standards and regulations places growing economic pressure on oil and gas companies, prompting them to seek environmentally sustainable and cost-effective alternatives for handling acid gases produced alongside sour natural resources [9,11].
One potential solution is an acid gas injection (AGI) into suitable subsurface reservoirs. This approach offers several advantages, including cost savings from deactivating Claus units, reduced sulfur emissions into the atmosphere, and increased oil recovery [10]. Acid gases primarily consist of H2S and/or CO2, water vapor resulting from the sour gas sweetening process, and other impurities, including methane and heavier hydrocarbons [11,13]. In a typical AGI process (Figure 1), the sour gas produced undergoes a one or two-stage absorption, during which it comes into contact with an amine solution. After the removal of H2S and CO2, the resulting water-saturated acid gas mixture is separated from the amine unit at low pressures (ranging from 35 to 70 kPa) and relatively high temperatures. Subsequently, it is typically compressed in three or four stages to achieve supercritical fluid properties and the necessary pressure for injection into the subsurface formation [14,15]. High-pressure acid gas is transported through pipelines to the well site, where it reaches the wellbore in a dense-fluid state (either liquid or supercritical) before being injected into the reservoir through the well tubing [15]. Depending on the composition and operator specifications, it may also be necessary to dehydrate the acid gas to prevent hydrate formation within the pipeline and wellhead and to mitigate corrosion [11,16,17].
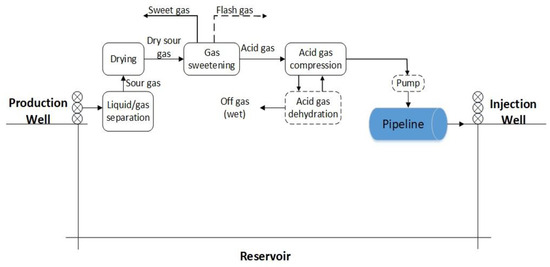
Figure 1.
Typical flow of an acid gas treatment and reinjection process.
In cases of mature reservoirs containing highly soured resources that have already been produced through primary and secondary recovery, AGI presents a compelling EOR alternative that can potentially circumvent the limitations of waterflooding, as well as provide an eco-friendly option, aligning with global trends towards more sustainable and environmentally friendly industrial practices. Note that AGI and normal gas injection are two distinct oil recovery techniques that differ in their objectives. Normal gas injection, often involving natural gas like methane, primarily focuses on enhancing waning pressure within the reservoir under immiscible flow conditions. On the other hand, AGI, from a technical standpoint, allows injected gas to be mixed with the existing oil, thus causing its swelling, a reduction of its viscosity, and an enhancement of its mobility. Eventually, oil mobilization after a long waterflooding period is reinitiated, thus leading to increased hydrocarbon production and the reduction of the residual oil saturation. Additionally, the dissolved acid gas is produced and separated at the surface, thus allowing for its recycling at a continuously increasing quantity. High enough reservoir pressure is a prerequisite to ensure single-phase mixing, known as miscibility [18,19,20].
As the global energy industry transitions toward reduced carbon and/or H2S emissions, there has been a notable rise in the number and scale of AGI facilities [21,22]. This growth is exemplified by the successful implementation of various AGI projects, particularly for sour/acid gas storage or EOR purposes, which have significantly enhanced the industry's expertise in safely transporting and injecting sour or acid gases [12]. While AGI production schemes have been implemented worldwide, their application remains somewhat limited, resulting in a lack of extensive expertise. The first AGI project, although relatively small, was initiated by Chevron near Edmonton, Canada, in 1989 [23]. Subsequently, larger projects emerged, including AGI initiatives at Sleipner West in the North Sea, In-Salah in Algeria, and LaBarge in Wyoming, USA [16]. Beyond these well-established sites where the injection of sour and acid gas mixtures is common practice [24,25], AGI is now applied to numerous sour oil and gas reservoirs worldwide, such as the North Caspian basin’s Tengiz field in Kazakhstan [26,27,28] and the Middle East [29,30,31].
In order for engineers to obtain a comprehensive view of the reservoir performance under any production strategy, reservoir simulation must be employed. Reservoir simulation is a multidisciplinary approach that integrates principles from physics, mathematics, reservoir engineering, geoscience, and computer programming with its primary purpose being to build computational models that replicate the dynamic performance of hydrocarbon reservoirs under varying operational strategies, carefully considering the unique characteristics and production conditions of each reservoir. The output of a reservoir simulator typically comprises spatial and temporal data, illustrating the distribution of pressure and phase saturation within the reservoir. This output is then integrated into simulation models that represent physical components within the hydrocarbon production chain, which encompass systems responsible for producing fluids at the surface (wellbore) and their subsequent processing (surface facilities). This comprehensive modeling approach extends all the way to the final sales point, ensuring a thorough representation of the entire production system and allowing its detailed study and optimization [32,33].
To accomplish this task, it is essential to first establish a static and a dynamic reservoir model. The former serves as a three-dimensional representation of the reservoir’s geological attributes, such as porosity, permeability, and rock type. Its development involves geological, well, and seismic data, coupled with meticulous interpretation, which collectively provides a “snapshot” of the actual reservoir at a specific point in time [34,35]. Contrariwise, a dynamic reservoir model operates as a transient, time-dependent simulation of fluid flow within the reservoir and builds upon the static model by integrating production history, fluid properties, and reservoir management strategies. Dynamic models are essential in predicting reservoir behavior, optimizing production, and evaluating diverse development scenarios, such as EOR strategies and the effects of new wells on production [32,33].
In the case of an acid gas injection operation for EOR purposes, reservoir simulation serves as an essential tool in understanding the comprehensive dynamics of acid gas injection processes, as it provides a holistic view of the subsurface environment, enabling engineers to predict the behavior of the reservoir over time under different operating conditions and production schemes. Reservoir simulation allows engineers to predict how the reservoir will respond over space and time, helping optimize acid gas injection strategies for maximum oil recovery. The simulation models help in understanding the complex interactions between the acid gases and the reservoir rock and fluids, including phase behavior, solubility, reactions, and changes in reservoir properties. Furthermore, they assist in predicting long-term effects like the movement and distribution of acid gases, changes in reservoir pressure, and potential risks such as leakage or containment failure. These insights are crucial for optimizing the injection strategy, ensuring the environmental safety of the operation, and maximizing economic returns.
In this work, we investigate the implementation of AGI technology for EOR in the “Prinos” oil field located in Northern Greece, which has so far undergone waterflooding as its secondary recovery process, almost from the beginning of the production. Despite considerable amounts of oil being produced from this reservoir, the recovery factor remains moderate, underlining the need for a more efficient recovery mechanism. Note that the oil field contains highly soured resources, making acid gas re-injection an ideal candidate for miscible displacement and improving oil recovery factors.
Implementing acid gas EOR in the “Prinos” oil field poses two significant challenges due to AGI being a relatively new technology with limited field application. Firstly, substantial uncertainty surrounds the subsurface system, with monitoring options restricted to data collected at a few drilled wells. Consequently, the estimation of all flow and fluid properties of interest relies heavily on mathematical inference, involving modeling and simulation. Secondly, the anticipated cost is so high that no Final Investment Decision (FID) can be taken unless thoroughly analyzed simulated results have demonstrated a satisfying Internal Rate of Return (IRR) and future Net Present Value (NPVs). To that extent, a pilot-scale application was considered first before the full-scale process was attempted.
This paper examines and analyzes the production behavior of the proposed injection zone in the “Prinos” field, evaluating different injection scenarios and the estimated resulting oil production over time. The rather limited available quantity of acid gas renders this study very challenging with respect to the economic objective of the proposed operations. The scope of this paper is to provide a detailed account of the steps taken to arrive at a realistic, representative simulation result of the AGI pilot scale in the “Prinos” field, intending to serve as a guide for similar applications in brownfields globally.
To ensure realistic results, the dynamic model utilized has been validated against the 40-year-long production history of the oil field. The examined reservoir exhibits various peculiarities as it is medium to small sized, highly faulted and it exhibits complex subsurface structure. In this context, our work provides valuable information to operators who are interested in investigating the possibility of applying AGI by considering this work as an analog on which their own case can be based, alongside similar experiences documented in the literature.
To evaluate the potential of this technology for enhancing oil recovery in the “Prinos” oil field, a dynamic reservoir simulator was developed to run several scenarios. The first scenario involved no further intervention, allowing the reservoir to keep producing using its natural energy. This scenario served as a benchmark against which the responses of the simulator for a simplified, exploratory AGI scenario were compared to establish the advantages of implementing such a scheme. Subsequently, a more realistic AGI scenario was simulated, where all available acid gas, including the recycled gas, was injected into the reservoir. Results for all scenarios are presented in a pilot scale for the two optimally selected injector–producer pairs. Finally, a miscibility investigation was conducted for the realistic scenario to further assess the effectiveness of AGI in EOR terms.
The rest of this paper is organized as follows: Section 2 serves as an introduction to the “Prinos” reservoir, providing an overview of the reservoir’s history and characteristics, and Section 3 explains the reservoir model development and the history matching procedure that was performed to ensure an accurate model that reflects the behavior of the actual reservoir, and provides further a description of the compositional fluid model. Section 4 presents the acid gas injection simulation results of all examined scenarios by focusing on reservoir performance in terms of wells and field production and by looking in detail into the miscibility phenomena, in response to the full implementation of the acid gas injection process. Finally, Section 5 offers a discussion of the findings, highlighting the significance of the results and the paper concludes in Section 6, summarizing the key findings.
2. AGI in “Prinos” Reservoir
The “Prinos” hydrocarbon field (Figure 2) is situated within the Prinos–Kavala offshore basin, located in the North Aegean Sea region, Greece. This geological complex emerged as a tectonic rift during the post-Alpine period, encompassing the “Prinos”, “Epsilon”, and “Prinos North” reservoirs, geographically positioned 8 km west of Thasos Island and 18 km south of Kavala’s primary coastline, within water depths ranging from 30 to 38 m [11,36,37].
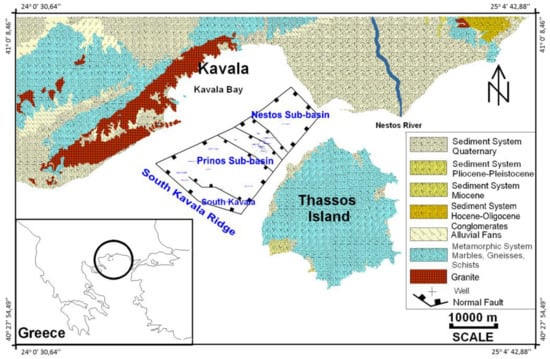
Figure 2.
Prinos–Kavala Offshore basin [38].
The “Prinos” reservoir is formed by a fault-bounded low-relief anticline structure with oil reserves at depths from 2490 m to 2790 m True Vertical Depth Subsea (TVDSS). The operational infrastructure, both offshore and onshore, facilitates a daily oil production capacity of up to 30,000 barrels per day (bbl/day). The offshore facilities are interconnected through a subsea pipeline to the onshore processing plant responsible for the production stream’s treatment. The “Prinos” reservoir produces sour crude oil with an API gravity ranging between 27 and 30 degrees and a sour gas phase with H2S concentrations of up to 60%, alongside substantial CO2 volumes. Following treatment within the amines unit, the gas is rendered H2S free and sweetened, serving various energy and operational requirements, including gas lift procedures. The AGI design incorporates the redirection of the acid gas directly to a compressor, rather than the conventional Claus unit, which then leads the acid gas via a seabed pipeline, ultimately reaching the offshore site for its injection into the designated wells [11].
The “Prinos” field comprises three oil reservoirs (A, B, and C), with a total thickness of approximately 300 m. The porosity within these reservoirs varies from 12% to 22%, with an average net-to-gross ratio (NTG) of approximately 60%. Notably, permeability values can reach up to 440 mD. The reservoirs are distinguished by unique oil–water contacts (OWC) located at different depths. These variations in depth allow for the separation and classification of the reservoirs, each presenting its unique challenges and characteristics. Reservoir A, in particular, exhibits an additional level of distinction due to significant heterogeneity in its petrophysical properties and variances in oil characteristics, leading to the further segmentation of Reservoir A into two sub-reservoirs, identified as A1 and A2, with the latter being the reservoir under evaluation for the acid gas injection process. The heterogeneity of the petrophysical characteristics mentioned above further defines distinct layers within reservoirs A1 and A2, four layers for each one. The pore volume of the A1 reservoir is 41.9 MMm3, while that of the A2 reservoir is 22.7 MMm3.
The acid gas composition under this study was determined through a series of process simulations based on the production history and future forecast of the “Prinos” field. The runs simulate the complete surface processing system of the produced multiphase sour stream. Initially, reservoir streams collected from all wells originating from each separate reservoir are commingled in a common processing separator unit located offshore where the resulting separated sour gas stream (Stream 1), along with the sour oil, is directed to the onshore processing unit through a subsea pipeline system. Onshore, the sour oil passes through a second separation unit resulting in a dryer sour gas stream (Stream 2) and a liquid stream that is directed to the final oil stabilization unit. From the stabilization unit, the final liquid oil product is obtained, along with its accompanying sour gas stream (Stream 3). The sour gas stream enters the amines unit where the resulting acid gas stream, with a composition of 83.8% H2S, 14.9% CO2, and 1.3% CH4, is produced.
For the acid gas injection rate, based on the operator’s production and composition forecast from the main processing units (first separator on the platform, second separator, and stabilization units onshore), an estimation of the volume of the acid gas resulting from the amines unit was attempted. The acid gas volumes were estimated based on three envisaged field production scenarios corresponding to the minimum, average, and maximum acid gas supply forecast which in turn were obtained using Decline Curve Analysis (DCA) forecasting. It must be noted that acid gas recycling within the reservoir is expected to lead to cumulatively increasing acid gas volume production that will be constantly added to the injected stream. To account for that effect, the injection rate considered in the proposed workflow is set at three times the calculated maximum value, thus emulating a 30% acid gas stored permanently in the reservoir and full recycling of the remaining 70% (after breakthrough).
3. Reservoir Model Setup Workflow
The development of the dynamic reservoir model began with the construction of a detailed geological model of the entire “Prinos” field. This static model was built using a combination of three-dimensional seismic data, core data, and well logs. Seismic data interpretation established the reservoir’s structural framework, while core data provided information regarding lithology, porosity, and permeability at specific well depths. Well log data, acquired using wireline logging tools, gave insights into the rock’s petrophysical properties, including lithology, porosity, water saturation, zone thickness, and permeability.
Utilizing this comprehensive dataset, facies, porosity, and permeability values were propagated across each layer. The spatial distribution of facies rock types within each stratigraphic layer was modeled independently, while the porosity distribution within the facies model was based on the facies model itself. Regarding permeability, it was determined by both facies and porosity distributions.
For the purpose of this study, the final static model, which served as input for the dynamic reservoir simulation, consisted of 153,928 grid blocks with an average size of 50 × 50 × 4 m. The model accounted only for reservoirs A1 and A2 as those are fully isolated from B and C, and they have been pointed as the ones where AGI is directed. To capture the thermodynamic behavior of the reservoir oil, a black oil model was initially developed, using IMEX by Computer Modelling Group (CMG) [39], based on available PVT data for a reservoir fluid sample obtained through bottomhole sampling. The oil in the field’s reservoirs exhibits an API gravity ranging from 25 to 28 degrees and a GOR of approximately 800 scf/stb. Finally, the dynamic model of the A1 and A2 reservoirs in the “Prinos” field was built using eight rock types, with petroleum fluid–rock interaction properties, such as relative permeability and capillary pressure curves, determined through special core analysis (SCAL) for accurate fluid flow simulation.
The obtained relative permeability curves (Figure 3) show that water-wet rock formations, such as the ones in the “Prinos” field, have a higher irreducible water saturation than oil-wet rocks due to water’s tendency to adhere to pore walls. Despite increased water saturation, water’s relative permeability remains comparatively low, as water tends to spread and stick to the rock surface, reducing its effective permeability. Furthermore, water-wet rocks cannot achieve full water saturation due to the trapping of oil in larger pores, leading to notable residual oil saturation. As water saturation increases, oil’s relative permeability decreases gradually, without abrupt declines, due to the water-wet nature of the rocks. This characteristic enables sustained oil production, even at high water cuts.
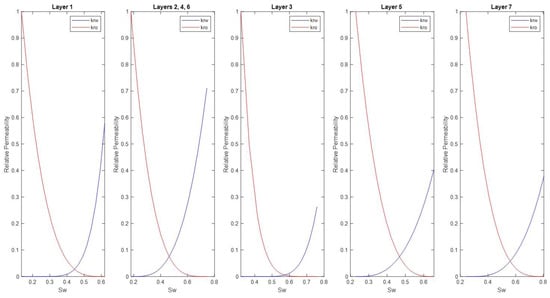
Figure 3.
Relative permeability curves (oil–water) for all rock types.
To ensure that the model accurately replicates the behavior of actual wells under the specific production constraints experienced by the “Prinos” field over the past 40 years, the initial dynamic reservoir simulation model of the “Prinos” hydrocarbon field was history matched. History matching is an essential step in the reservoir simulation process, as it validates the model’s alignment with established reservoir engineering principles and ensures that it will behave similarly to the actual wells under future production scenarios. For that task, the CMOST software by CMG (v. 2023.30) [40] was used.
The history-matching process involves a series of key steps. The first step is the acquisition of historical data, which forms the basis for the comparison between the model and real-world well behaviors. Note that the reservoir fluid has remained undersaturated throughout this period due to the waterflooding scheme applied which ensured a Voidage Replacement Ratio (VRR) close to unity. Once these data are collected, an objective function is defined, which quantifies the discrepancy between the observed historical data and the model’s predictions, and further guides the adjustment of the model parameters. Since the number of parameters controlling the objective function is huge (i.e., porosity, permeability, pore volume multipliers, relative permeability curve shape, etc.), a sensitivity analysis is required to identify the ones exhibiting the most significant impact on the matching process, i.e., the ones that the model’s objective function is most sensitive to. By adjusting these parameters, the model can be “tuned” to better match the historical data. Finally, the quality of the history match is evaluated by assessing the degree to which the adjusted model replicates the actual well behavior, and hence, whether it can be used to forecast future well performance under various production scenarios. If not, the model parameters may need to be further adjusted and the history match be reevaluated.
In the case of the “Prinos” field, the history matching process began with an extensive compilation of historic production data, encompassing pressure records, observed oil production and water injection rates, GOR, water–oil ratio (WOR), and their temporal fluctuations for each well. This comprehensive dataset served as the benchmark against which the simulated results were compared and evaluated. Subsequently, the objective function was defined, serving the crucial role of quantifying the error between the simulated results generated by the model and the actual field data, as a function of the adjustable model parameters. The objective function comprises four distinct error components (shown in Figure 4) which were strategically selected to represent the key aspects of the reservoir’s dynamics and performance. These errors include daily average oil rate production on a monthly basis, daily average water production on a monthly basis, daily average water injection rate for each month, and the pressures measured in all wells (Bottom Hole Pressure—BHP) during the production of the reservoir. By minimizing these error norms, the model parameters were adjusted, thereby improving the match between the simulated results and the actual field data.
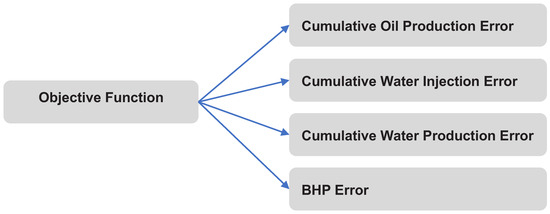
Figure 4.
Composition of the objective function to be minimized in the history-matching process.
In this work, the sensitivity analysis was carried out using the Response Surface Methodology (RSM) [41], according to which multiple parameters are perturbed simultaneously and the system response is recorded. This step is repeated a certain number of times, each with a different parameter combination, and the results are analyzed and fitted with a polynomial function, known as the response surface. The response surface serves as a mathematical model that locally approximates the relationship between the perturbed parameters and the response variable, in this case, the history matching error function, using its derivatives. For the Prinos dynamic model, 210 simulations were performed in total for various parameter values. The effect of these parameter values on the error function was recorded and assessed, allowing for the identification of the uncertain reservoir model parameters mostly affecting the reservoir behavior. It was found that the parameters with the biggest impact on the error function were 17. The optimizer then optimized the objective function with respect to these 17 parameters. This strategy of conducting a sensitivity analysis using RSM not only made the history-matching process more manageable but also more efficient, enabling the generation of an accurate reservoir simulation model.
To enhance the thermodynamic modeling of the reservoir fluid, the full-field history-matched black oil model needed to be converted into a compositional one using suitable EoS models. The incorporated EoS models need to accurately reproduce the phase and volumetric behavior of both the injected acid gas and the A1 and A2 reservoir fluids, allowing for a more precise simulation and understanding of the interactions that occur when the injected acid gas comes into contact with the reservoir fluid (i.e., miscibility and swelling).
To address the challenges associated with developing common EoS models for multiple fluids (i.e., A2 reservoir fluid and available acid gas), a two-step approach was followed [11]. The first step focused on the development of the acid gas thermodynamic model to ensure its accuracy in describing acid gas components solely. In the subsequent step, the fluid model developed for the acid gas was extended to encompass the H2S-rich reservoir fluid as well. This was achieved through the application of pseudoization and the implementation of the necessary splitting and lumping schemes for the heavy fraction [42]. In particular, the initial EoS model was extended by mathematically splitting the plus fraction into several single carbon number (SCN) fractions using Whitson’s generalized three-parameter gamma probability function [43]. The SCN fractions were then combined into three pseudo-components, simplifying the model while still preserving the essential characteristics of the SCN fractions. Finally, N2 was paired with C1, and C4 and C5 isomers were combined into two additional components, whereas the significant concentration of H2S in the reservoir sample justified its preservation as a distinct component. It should be noted that fine-tuning of the EoS model was performed each time a new grouping scheme was tried. This continuous adjustment process ensured that the model remained accurate and reliable, reflecting the changes introduced by the new grouping schemes.
The proposed process ended up with two 11-component Peng–Robinson (PR) equation of state (EoS) models [11], one per each of the A1 and A2 reservoirs. The simulated saturation point of the A2 zone reservoir fluid is found to be approximately 1331 psi at 245 °F which is very close to the lab value of 1317 psi, while the full predictions for the Constant Composition Expansion (CCE) and the Differential Liberation Expansion (DLE) properties are illustrated in Figure 5. The minimum miscibility pressure (MMP) predicted by the fine-tuned EoS model for the injected acid gas, which is expected to exhibit varying compositions during production, and the reservoir fluid, falls within the range of 2500 to 2600 psi.
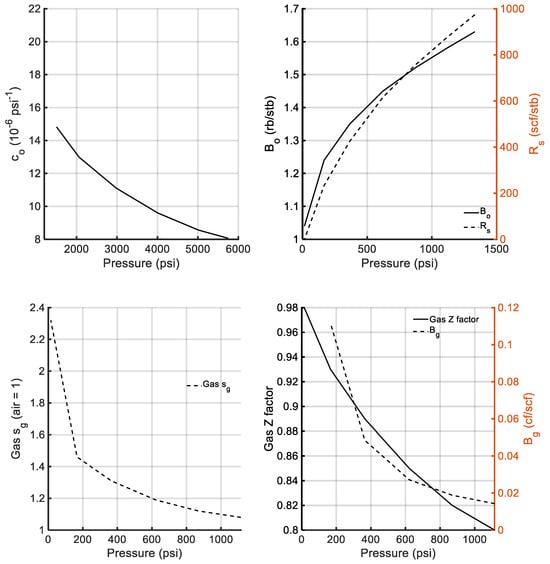
Figure 5.
EoS regenerated curves of CCE and DLE properties against reservoir pressure.
Following this conversion, a simulation run was conducted using the compositional reservoir simulator to evaluate its ability to replicate the 40-year production history of the “Prinos” field. CMG’s GEM compositional simulator [44] was utilized this time to execute the compositional runs. While a slight decline in the objective function was observed, this was readily rectified by applying a minor pore volume multiplier. Eventually, this workflow led to the successful development of a highly accurate dynamic reservoir simulator, which was then employed to run AGI simulation scenarios.
4. Simulation Analysis
4.1. Simulation Scenarios Design
Setting up a pilot-scale application of EOR to maximize the “Prinos” field’s economic potential incorporates the selection of the most suitable area for miscible acid gas injection (AGI). In this case study, two plus one predominant factors guided this selection process, namely the remaining oil saturation and reservoir pressure along with the well-established communication between the injector and the producers in the area of interest. An adequate oil saturation level is essential for the AGI process to generate enough additional oil production that will anticipate the investment costs. Reservoir pressure, on the other hand, should exceed the minimum miscibility pressure (MMP) for miscibility to be achieved, and proven communication between injectors/producers is needed to achieve as quick as possible oil rate response. Based on these screening criteria, two distinct segments, namely segments 7 and 8 of the A2 reservoir, were selected as the target sites for implementing the AGI operation.
The success of an AGI scheme also requires careful identification of the optimal injection–production well pairs for the pilot scale scheme. The injection well was selected judging from its location and connectivity (i.e., existing perforations) with the target reservoir layers, and is labeled Injector 1. Two candidate production wells, Producers 1 and 2, strategically positioned within the reservoir and with established connectivity to Injector 1 (through past water injection and tracers tests), were also designated.
Three scenarios were set up and simulations were conducted for each: a No Further Activity (NFA) scenario, an exploratory AGI, and a full implementation AGI. The three simulations were conducted with a start date of May 2023, and ending in December 2039, aligning with the AGI site’s 15-year implementation plan. The NFA scenario was chosen to establish the reservoir’s natural decline, shedding light on how oil production would likely unfold if the reservoir was left to produce on its own natural drive mechanism. This base case model serves as a useful benchmark against which to compare the potential benefits of implementing the AGI scheme and as a tool for understanding the potential production from A1 and A2 reservoirs of the “Prinos” field without any further intervention. The exploratory AGI scenario is set up to familiarize the operator with the AGI scheme by providing basic information such as the movement and dispersion of the acid gas plume, identifying whether miscibility is developed or if there are indications of immiscible flow taking place, estimating the directions in which the miscibility front moves, and the timing of acid gas breakthrough. Given the encouraging results of the exploratory AGI scenario, the full implementation scenario follows, utilizing the same wells of the pilot scale run as in the exploratory scenario. In addition, water injection via Injector 2 was initiated for a limited time interval to maintain the reservoir pressure before being discontinued and the fully available acid gas quantity, including recycling, was utilized. Note that both wells have been considered as appropriately completed, Injector 1 for AGI and Injector 2 for waterflooding. Figure 6 illustrates the selected site, the two optimal injector-producer pairs, and the water injection well.
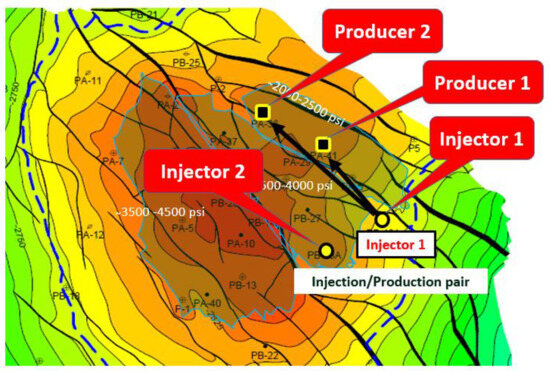
Figure 6.
Selected site, optimal acid gas injector–producer pairs, and water injection well.
The results of each scenario considering oil and gas production, pressure development, and sustainability, as well as reservoir fluid saturation and swelling will be presented in the following parts of the paper. The miscibility of the injected acid gas with the original oil will also be investigated in detail.
4.2. Reservoir Response and Production Performance
The No Further Activity (NFA) scenario was implemented first and the results obtained, presented in Figure 7 and Figure 8, provide valuable insight into the performance of Producers 1 and 2. Understanding the performance of these wells within the reservoir is crucial for evaluating the impact and benefits of the AGI scheme. Note that both producers operate under a BHP constraint equal to 1500 psi to stay above the saturation pressure during the entire simulation duration and to ensure flow to the wellhead either in a self- or in a gas lift-assisted producing mode.
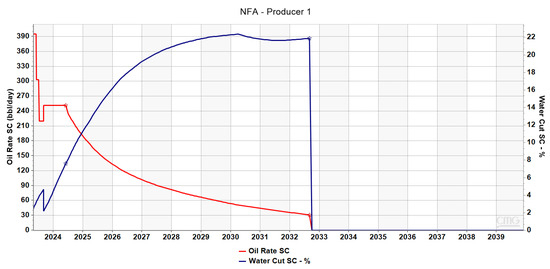
Figure 7.
NFA scenario—Producer 1.
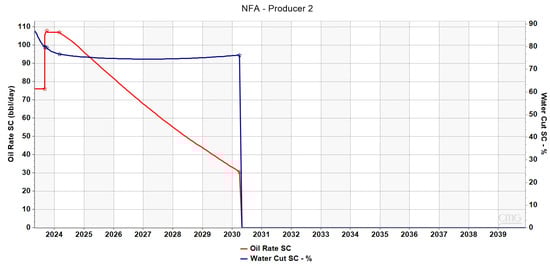
Figure 8.
NFA scenario—Producer 2.
For Producer 1, the constraints set by the operator include an upper bound of 250 bbl/day and a cut-off rate of 30 bbl/day. As oil depletion progresses, there is a noticeable decline in production rates, attributed to the diminishing energy driving the oil to the surface. Consequently, a lift failure is faced after only 10 years, despite the 15-year planning horizon for the “Prinos” field. Additionally, Producer 1 experienced an increase in water cuts over the 10 years, even without newer water injection, owing to the prior waterflooding phase, which has led to an increase in water saturation in the nearby area.
Producer 2 is also subject to production constraints, with an upper and lower limiting production of 108 stb/day and 30 stb/day, respectively. Production from this well ceases after 7.5 years. Notably, towards the end of the well’s production life, the water cut reaches approximately 75%. This is attributed to the fact that the area in the vicinity of Producer 2 became extensively waterflooded during the waterflooding period, further emphasizing the reason why Producer 1 takes precedence as the main focus well. Moreover, it further supports the investigation of EOR rather than further waterflooding.
The obtained results suggest that without further intervention, oil production from Producers 1 and 2 will decline rapidly and ultimately cease as a result of the decaying pressure in that area. Such a scenario would result in a significant loss of production, highlighting the urgent need to consider effective strategies to improve the recovery factor.
In the exploratory AGI scenario, an acid gas stream composed of 83.8% H2S, 14.9% CO2, and 1.3% CH4 is steadily injected through Injector 1 into the reservoir at a rate of 1.80 MMscf/day (Figure 9). Figure 10 and Figure 11 depict the performance of Producers 1 and 2 within the exploratory AGI framework. The production rate limits imposed on the two wells were the same as those applied to the NFA scenario. However, this time, the pressure decline in this particular scenario is more gradual and less pronounced. This slower pressure decline significantly extends the production life of both wells, exceeding the initially projected periods of 10 and 7.5 years for Producer 1 and Producer 2, respectively, according to the NFA scenario. This prolonged lifespan, consequently, sustains oil production rates for an extended period.
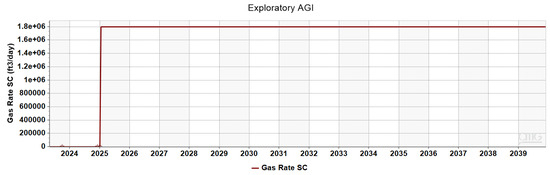
Figure 9.
Exploratory AGI scenario—Injector 1.
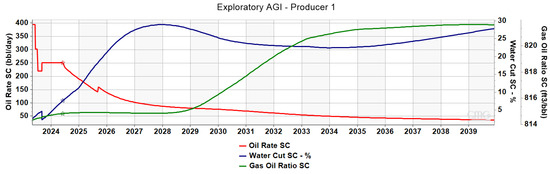
Figure 10.
Exploratory AGI scenario—Producer 1.
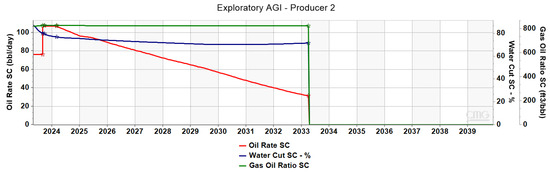
Figure 11.
Exploratory AGI scenario—Producer 2.
Again, production for Producer 1 ceases before reaching the lower production rate threshold. This observation suggests that the reservoir pressure, hence, the BHP, is insufficient to sustain production from this well for the full schedule. As BHP decreases, the pressure in the region also declines, indicating insufficient energy supply within the system. Note that, apart from the oil rate decline and the accompanying economic loss, pressure conditions also become unfavorable for miscibility to occur while keeping in mind that the estimated MMP is approximately equal to 2500 psi. As for GOR, it remains relatively constant with a slight increase for Producer 1 at the end of the simulation period, implying that the first injected acid gas bubbles, which had been dissolved in the reservoir oil, now appear at the wellhead. Conversely, there is no discernible change in GOR for Producer 2, which aligns with expectations as it is positioned farther from Injector 1 and the quantity of the available acid gas to be injected is rather limited. Finally, water cut levels do not differ significantly from the NFA scenario with Producer 1’s water cut reaching 25%, whereas that of Producer 2 arrived at 75% at the end of the 15-year period.
Figure 12 and Figure 13 quantify the economic benefit that the operator can have by implementing the AGI technology. Specifically, for Producer 1, this scheme increases the cumulative oil production from the pilot-scale application by more than 0.1 MMbbl, and for Producer 2, the increase in cumulative oil production is about 50 Mbbl. This substantial increase in oil production translates to significant profit for the operator.
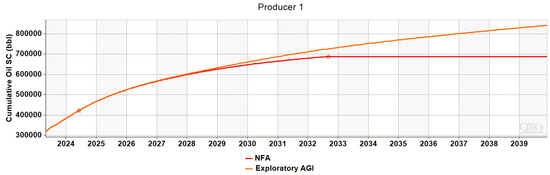
Figure 12.
Comparison of cumulative oil between the NFA scenario vs. exploratory AGI scenario—Producer 1.
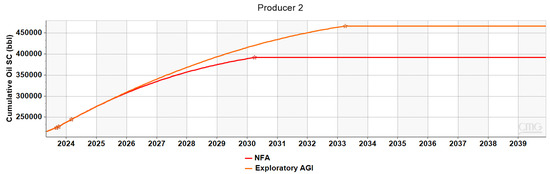
Figure 13.
Comparison of cumulative oil between the NFA scenario vs. exploratory AGI scenario—Producer 2.
The findings from the simulations of the preceding scenarios highlighted the advantages associated with the example implementation of AGI technology. However, they also revealed a limitation in the energy supply provided by the system, which was deemed insufficient to maintain reservoir pressure effectively to boost production and pursue miscibility. To address this challenge, it was decided that the full implementation scenario would incorporate a short water injection period through Injector 2 to supplement the energy supply and further stabilize reservoir pressure. Water injection was employed for approximately one year before being discontinued to prevent an excessive increase in water cut at Producer 1, which would hinder oil production.
In the second year of the simulation, AGI was initiated. This marked the commencement of the full implementation scenario, where the fully available acid gas quantity, including recycling, was utilized to optimize production outcomes. Figure 14 shows that the acid gas injection rate was increased annually, with some instances of multiple increases within the same year. Note that the production constraints, imposed by operational issues, remained the same as before for the producers under study, ensuring a consistent comparison across the various scenarios tested.
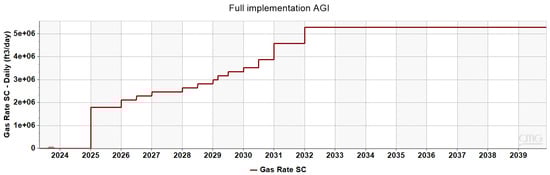
Figure 14.
Full implementation AGI scenario—Injector 1.
Based on the simulator’s predicted response (Figure 15), implementing this strategic approach has the potential to significantly increase oil production from Producer 1. Specifically, during the year that water was injected, oil was produced at a rate of 250 stb/day. In January 2025, the initiation of acid gas injection led to an increase in reservoir pressure, thereby facilitating oil production from Producer 1 at the same rate for two more years. Note that, as acid gas is more compressible than water, the increase in pressure is milder compared to the pressure rise induced by water injection. As acid gas is steadily injected into the reservoir, the oil rate begins to decline in 2027, reaching 160 stb/day in 2031, and this level of production is sustained for the following two years. At the end of that period (2033), there was an observed increase in the oil rate, attributed to the recycling of acid gas, including the portion that reaches Producer 1 in 2032. As the simulation period concludes, the oil production rate reaches 225 stb/day, closely resembling the amount of oil produced in the initial years of the acid gas injection scheme. Water cut levels remain consistent with those observed in the previous scenarios.
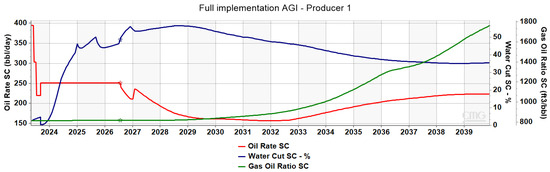
Figure 15.
Full implementation AGI scenario—Producer 1.
Producer 2 also benefits from the combined water/acid gas injection scheme, which increases oil production and extends the life of this well. More specifically, as Figure 16 suggests, the oil production rate rises from 76 to 108 stb/day in the year when water injection takes place, and with the assistance of acid gas injection, it is sustained at this level until 2027. Note that acid gas breakthrough in Producer 2 occurs in 2033, one year later than when it reaches Producer 1, which is located closer to the injection well. As pressure depletion progresses, the oil production rate gradually declines until 2033 when it reaches 74 stb/day, approximately the level observed before the implementation of the combined water/acid gas injection strategy. Within the same year, as mentioned above, the operator reinjects acid gas back into the reservoir, resulting in a resurgence in oil production rates. Interestingly, the water cut in Producer 2 becomes significantly lower in this scenario as the acid gas mobility prevails and water feed is not sustained.
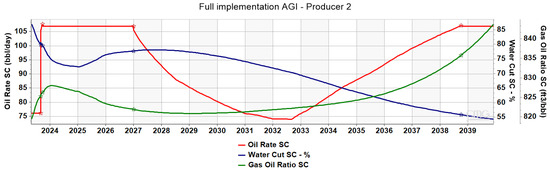
Figure 16.
Full implementation AGI scenario—Producer 2.
Figure 17 and Figure 18 suggest that in the full implementation AGI scenario, the Producer’s cumulative oil production increases by 1.2 MMbbl compared to the NFA case, while Producer 2’s increases by 0.4 MMbbl, thus arriving at a total of 2.6 MMbbl additional oil production.
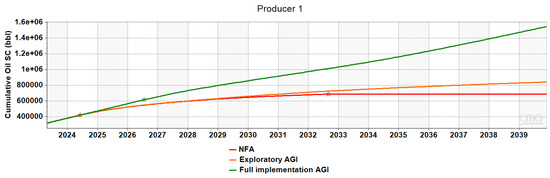
Figure 17.
Comparison of cumulative oil production between the NFA scenario, the exploratory AGI scenario, and the full implementation AGI scenario—Producer 1.
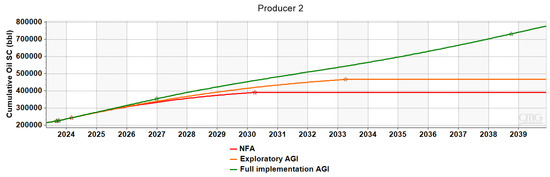
Figure 18.
Comparison of cumulative oil between the NFA scenario, the exploratory AGI scenario, and the full implementation AGI scenario—Producer 2.
4.3. Miscibility Investigation
This section presents a comprehensive miscibility investigation for the two selected injector–producer pairs within the context of the full implementation AGI scenario. The objective is to evaluate the potential of AGI technology in enhancing oil recovery from these production wells from a thermodynamic perspective.
Figure 19 and Figure 20 illustrate the state of the selected site for AGI (A1 reservoir at the top, A2 reservoir below, separated by an almost impermeable layer) at the end of the waterflooding period, showing a significant amount of remaining oil between each of the dipole pairs and reaffirming that this area is a high-potential target for production. Gas saturation is zero all around the place as no gas has been injected yet and the reservoir is undersaturated. Furthermore, the average reservoir pressure within this region now varies between 2800 to 3000 psi, indicating favorable conditions for the development of miscibility between the original oil and the injected acid gas, given that the predicted MMP is approximately 2500 psi.
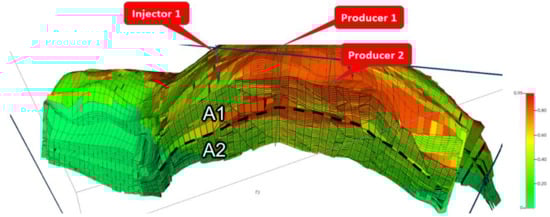
Figure 19.
Oil saturation distribution within the selected site for AGI at the end of the waterflooding period. AGI aims to produce oil from the A2 (bottom) reservoir.
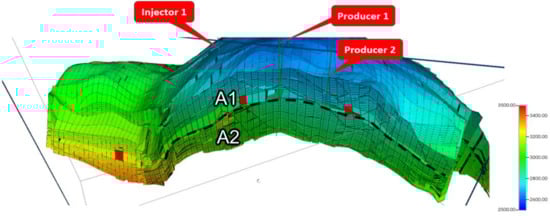
Figure 20.
Pressure distribution (psi) within the selected site for AGI at the end of the waterflooding period.
Figure 21 depicts the pressure variations, at distinct time frames, along a linear path in the highest layer of the A2 reservoir which connects the perforated top grid blocks of Injector 1 and Producer 1, covering an inter-well distance of 1350’. The selected linear path aligns with the roof of the A2 reservoir and is selected to conform with the natural tendency of acid gas to accumulate at shallow depths due to its reduced density (though supercritical). Following waterflooding, the average pressure is high upon the initiation of AGI into the selected site in Q1 2025 (red line). However, due to the limited volume of acid gas being injected, depletion effects soon affect reservoir pressure, which responds with a decline one month later (green line). This trend continues, with pressure further decreasing one year later (blue line). Throughout this period, the cells along the path under investigation are expected to exhibit zero gas saturation because pressure remains safely above the estimated MMP of 2500 psi.
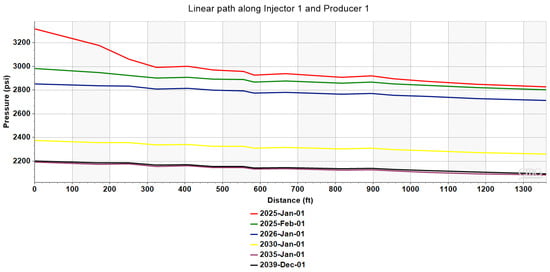
Figure 21.
Pressure variation along the linear path between Injector 1 and Producer 1 at different time frames.
Four years later, the average reservoir pressure along the path under investigation (yellow line) has reached a value of approximately 2300 psi, and the reservoir oil has been saturated in acid gas. The reason for the relatively small pressure drop is that between January 2026 and January 2030, the rate of AGI significantly increased (Figure 14), thus minimizing pressure depletion effects. This time interval is somewhat ambiguous, and there is a strong possibility that the pressure may have locally dropped below the MMP, resulting in oil becoming saturated. In the following years (purple and black lines), the pressure is maintained at around 2100 psi. Note that such pressure values are the smallest encountered in the examined region as the linear path traced lies at the top of the A2 reservoir, whereas the grid blocks below benefit from gravitational effects.
It can be concluded that the quantity of acid gas injected into the reservoir is barely sufficient to maintain pressure and miscibility conditions. As a result, miscibility has been intermittently lost, and immiscible flow occurs occasionally due to pressure dropping below the MMP. However, this situation is expected to be reverted when the volume of injected gas is further increased (due to recycling and increased dissolved gas production) after the 15-year period.
To further assess miscibility, a tailored slab (i.e., a section) encompassing solely the region between Injector 1 and Producer 1 was utilized. Figure 22 illustrates the variation of oil miscibility within the custom slab over the specified time frames discussed earlier. Note that the custom slab also incorporates the grid blocks where Injector 1 is perforated in the A1 reservoir, where the average oil viscosity stands at 0.76 cp towards the end of the waterflooding phase. However, these perforations are shut off, thus not contributing to the AGI process.
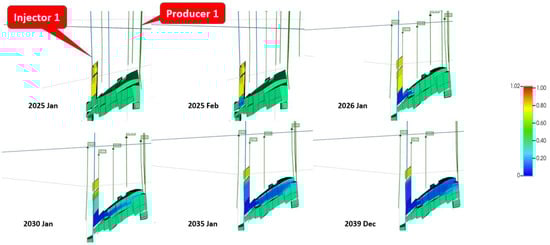
Figure 22.
Oil viscosity (cp) in the Injector 1—Producer 1 area of interest.
A sharp decline in oil viscosity is observed within the area of interest, dropping from approximately 0.40 cp to 0.20 cp. This viscosity reduction is attributed to the full dissolution of the injected acid gas into the reservoir oil, confirming that miscibility has been achieved. As time advances, the miscibility front extends further across the A2 sand as demonstrated by the blue color expansion towards the producer.
Based on Figure 21, a pressure drop below MMP occurred between 2026 and 2030. To further investigate this effect, two dates covering that period were picked, namely September 2026 and September 2028. Figure 23 presents the oil density and gas saturation at these two distinct times. As can be seen from Figure 23, gas first appears in some cells in September 2028, coinciding with the pressure drop below the MMP. Despite the presence of gas, oil continues to flow, and acid gas remains dissolved in the oil. This indicates that partial miscibility is occurring.
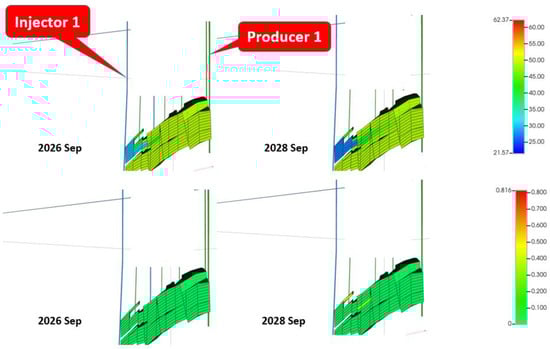
Figure 23.
Comparison of oil density (g/cc) and gas saturation in the Injector 1—Producer 1 area of interest between September 2026 and September 2028.
Miscibility plays a pivotal role in the observed oil displacement pattern. As the injected acid gas intermixes with the native oil, interfacial tension diminishes, enabling oil to flow more effortlessly toward Producer 1. This phenomenon is shown in Figure 24, which demonstrates a quick oil movement over time. The observed displacement pattern aligns with the enhanced oil mobility induced by the miscibility phenomena taking place.
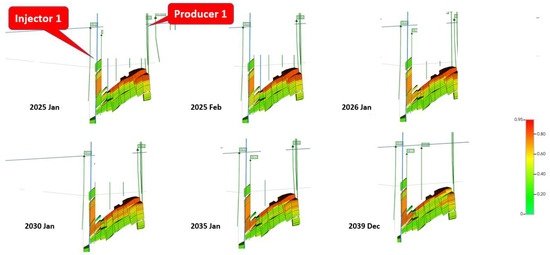
Figure 24.
Oil saturation in the Injector 1—Producer 1 area of interest.
Interestingly, oil saturation within the grid blocks surrounding the injection well exhibits an initial surge. This surge is primarily attributed to oil swelling caused by the dissolution of acid gas into the native oil and partially to the flow of the injected water during the preceding flooding period. Figure 25 illustrates the variation of oil saturation over time in the grid block of the highest layer in the A2 reservoir, where Injector 1 is perforated. As shown, oil saturation begins increasing gradually from the onset of AGI due to the forward flow of water, reaching a plateau of 0.75 towards the end of the simulated period. No gas appears thanks to the high pressure prevailing in that area.
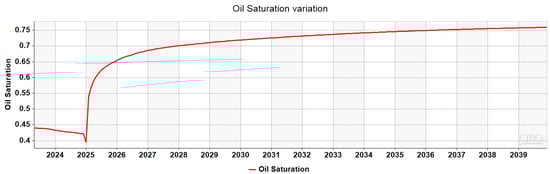
Figure 25.
Oil saturation variation over time in the gridblock of the highest layer of A2 reservoir in which Injector 1 is perforated.
Figure 26 illustrates the evolution of miscibility, focusing on the Injector 1–Producer 2 dipole region, by evaluating the swelled reservoir oil viscosity. Given Producer 2’s proximity to Producer 1, the earlier interpretation also applies to the former. The sole distinction lies in the timing of miscibility’s production benefits, which materialize later in Producer 2 compared to Producer 1 due to its greater distance from the acid gas injector. Notwithstanding this delay, the miscibility effect eventually reaches Producer 2, resulting in enhanced oil production. This underscores the efficacy of miscible gas injection in boosting oil recovery, even in areas farther from the injector.
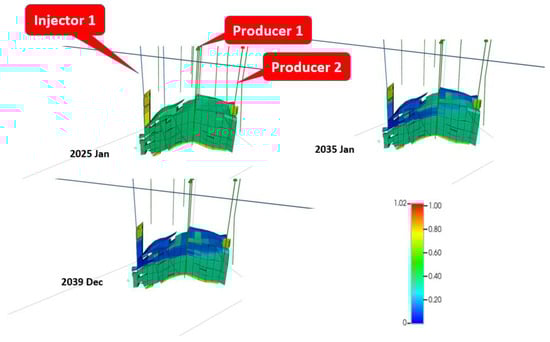
Figure 26.
Oil viscosity (cp) in the Injector 1—Producer 2 area of interest.
5. Discussion
The present study of the dynamic simulation of acid gas re-injection into a mature oil reservoir presents significant insights into the potential benefits and challenges of this Enhanced Oil Recovery (EOR) method. The primary objective of this study was to evaluate the production behavior of proposed injection zones under various injection scenarios with limited available acid gas volume. The results demonstrated a distinct pattern of reservoir response to acid gas injection, showing an increase in reservoir pressure and, thus, in oil production over time. These findings align with previous simulation studies that have highlighted the efficiency of acid gas injection in improving recovery rates in sour reservoirs [45,46,47], as well as with past field experience, such as the Zama field in Canada [48], the Tengiz oilfield in Kazakhstan [28,49] and the ARF and GAF fields located in the Gulf Arab region [28], endorsing the fact that acid gas re-injection can serve as an effective EOR technique.
However, it is worth noting that the performance of different injection schemes varied significantly, highlighting the need for careful selection and design of the injection strategy. As observed from the simulation results, the injection scheme was the key determinant of the technique’s success; however, the most appropriate zone selection also contributed to increased oil production rates, since the selected zone’s geological characteristics (oil saturation and pressure) influence the movement and distribution of the injected acid gas and the effective oil displacement. Finally, the wells’ selection is equally important since their chosen location should facilitate optimal injection and oil recovery while minimizing operational challenges. For instance, a well located too close to a production well could lead to premature gas breakthroughs, negatively impacting oil production.
Beyond the technical implications, the results of this study also have broader environmental and economic aspects. The re-injection of acid gas back into the reservoir not only enhances oil recovery, but also provides a sustainable solution for managing the byproduct of the sour gas sweetening process. It aligns with the global trend towards more environmentally friendly industrial practices, effectively reducing the emission of harmful gases into the atmosphere through flaring [50]. For example, in a case study of the Weyburn oil field in Canada, acid gas injection has resulted in the storage of over 30 million tons of CO2, equivalent to taking approximately 7 million cars off the road for a year [50]. Another case study is the Tengiz Oilfield in Kazakhstan, which is one of the largest oilfields in the world, producing significant amounts of H2S in the associated gas produced from the field. The Tengiz project handles this issue by re-injecting a big portion back into the reservoir to manage the large quantities of sulfur, preventing the release of this toxic gas into the atmosphere [45]. This dual benefit—increasing oil production while decreasing environmental harm—presents a compelling argument for wider adoption of this strategy in the oil and gas industry.
However, the implementation of acid gas re-injection as a standard practice in mature reservoirs is not without challenges. The injection and production behavior of the reservoir is influenced by several factors including reservoir pressure, rock and fluid properties, and injection parameters. This complexity necessitates a detailed understanding of the reservoir system and a carefully designed production management strategy. In this study, it was shown that when the available acid gas quantity is not abundant, special attention should be paid to the process design to arrive at an economically viable solution that would receive an NFA from the management, after carefully considering the Capital Expenditure (CAPEX) and Operational Expenditure (OPEX). In such a scenario, the CAPEX would entail costs associated with the initial setup of the project. This involves infrastructure development costs, which include re-completing injection wells, installing the necessary acid gas compression and injection systems, and potentially upgrading production facilities to handle increased oil recovery. Moreover, acid gas re-injection can lead to additional costs related to corrosion management. Acid gases can cause significant corrosion in the wellbore and surface facilities, leading to increased maintenance costs and potential production downtime. Therefore, careful material selection and corrosion management strategies are essential, adding to the project’s economic considerations. Additionally, there is a significant cost associated with OPEX, which refers to the ongoing costs of running the project. The counterbalance to these costs comes from the increased oil recovery that the acid gas injection process enables, which can provide additional revenue streams, thereby compensating for the project’s initial and ongoing costs. For instance, the aforementioned Weyburn field has seen an increase in oil recovery of approximately 15% due to acid gas injection, translating into significant additional revenue [51]. In addition, the Judy Creek field in Alberta, Canada, and also the Zama field in Canada are notable examples of acid gas injection projects involving H2S, which have extended the life of the fields and increased oil recovery, providing significant economic benefits [52]. Such counterbalancing makes the project economically viable, signifying approval and acceptance of the project’s outcomes and financial implications. However, the economic feasibility of acid gas re-injection relies heavily on the balance between the cost of injection (including infrastructure and operations) and the value of the additional oil recovered.
Looking forward, future studies could focus on addressing these challenges. For instance, more detailed reservoir characterization studies can provide better insights into the reservoir’s behavior under different injection scenarios. Additionally, the application of challenging reservoir simulation techniques, such as detailed history matching and uncertainty analysis, could improve the predictability and reliability of the simulation results, aiding in the design of more effective injection strategies. Finally, another key aspect for consideration in future studies is the development of an automated methodology dedicated to optimizing AGI production schemes. Currently, the optimization process necessitates multiple runs and specialized expertise. The ability to attain optimized AGI schemes with minimal dependence on Operator experience is a notable advancement as it holds the potential to drive enhancements in AGI simulations, ultimately leading to more informed decision making within the oil and gas sector. In scenarios where the oil recovery does not sufficiently offset the cost of the project, the acid gas re-injection rationale might be only driven by regulatory environmental requirements.
6. Conclusions
This study investigated the dynamic behavior of a mature sour hydrocarbon reservoir subjected to an acid gas re-injection process. The primary objective was to analyze and evaluate the production behavior of the proposed injection zones by assessing various injection scenarios, one representing the No Further Activity (NFA) (i.e., reservoir’s natural decline curve) and two representing the acid gas injection scenarios with limited available acid gas volume (exploratory and full implementation AGI). The optimal zones for a pilot application design were determined based on the remaining oil saturation and reservoir pressure, both essential factors for the AGI process.
The analysis entailed the rigorous examination of the different acid gas injection schemes on a pilot scale (one injector and two producers). The findings highlighted the significant potential of acid gas re-injection as an Enhanced Oil Recovery (EOR) technique in mature reservoirs, since the implementation of this strategy yields increased oil production, but also aligns with global trends towards more sustainable and environmentally friendly industrial practices, making it a promising solution for the future of the oil and gas industry. The simulation of the full implementation scenario dictated that the acid gas injection, despite the limited gas quantity available, was able to increase and maintain the reservoir pressure for several years, yielding a cumulative oil production from the field of 5.0 MMbbl by the end of the acid gas injection operation for both producers, i.e., a significant increase when compared to the 2.6 MMbbl of the NFA scenario. This corresponds to an increase of 2.4 MMbbl in 15 years. In addition, a detailed miscibility assessment was carried out for the two producers, assessing the potential of acid gas injection to improve oil recovery from these wells from a thermodynamic perspective (complex interactions between acid gas and reservoir fluid that affect each zone’s potential).
In conclusion, the optimal combination of injection zone, injection scheme, and thorough understanding of the complex interactions between the acid gas and the reservoir fluid, forms the basis for the subsequent detailed design of a full-scale application. While the study’s findings are promising, the real-world application of these results in a full-scale application is necessary to further validate these findings and advance the successful application of this technique on a larger scale.
Author Contributions
Conceptualization, S.S. and V.G.; methodology, S.S., V.G., E.K. and I.O.; software, I.O.; investigation, S.S., V.G., E.K. and I.O.; resources, P.K., I.O. and Y.T.; writing—original draft preparation, E.M.K. and A.S.; writing—review and editing, V.G.; visualization, E.M.K. and A.S.; project administration, I.D. and S.S.; funding acquisition, S.S. All authors have read and agreed to the published version of the manuscript.
Funding
This research has been co-financed by the European Regional Development Fund of the European Union and Greek national funds through the Operational Program Competitiveness, Entrepreneurship and Innovation, under the call RESEARCH CREATE INNOVATE (project code T2 EDK 03325).
Data Availability Statement
The data are contained within the article.
Conflicts of Interest
Authors Ivan Obetzanov, Yannis Tsiantis and Paschalia Kiomourtzi was employed by the company Energean. The remaining authors declare that the research was conducted in the absence of any commercial or financial relationships that could be construed as a potential conflict of interest.
References
- Lupu, D. Current trends in the exploitation of mature gas fields in the context of rehabilitation concept. MATEC Web Conf. 2019, 290, 10005. [Google Scholar] [CrossRef]
- Petrowiki. Mature Fields. Available online: https://petrowiki.spe.org/Mature_fields (accessed on 14 September 2023).
- Alshalabi, A.; Al Saadi, H.; Maire, F.; Thomas, T.; Gueye, T.; Al Amiri, F. A major shift in reservoir management strategies and best practices in a mature reservoir to overcome the current reservoir challenges: Case study. In Proceedings of the Abu Dhabi International Petroleum Exhibition & Conference, Abu Dhabi, United Arab Emirates, 9–12 November 2020. [Google Scholar]
- Vishnyakov, V.; Suleimanov, B.; Salmanov, A.; Zeynalov, E. Oil recovery stages and methods. In Primer on Enhanced Oil Recovery; Gulf Professional Publishing: Oxford, UK, 2019; ISBN 978-0-12-817632-0. [Google Scholar]
- Schlumberger. Energy Glossary. Waterflooding. Available online: https://glossary.slb.com/en/Terms/w/waterflooding.aspx (accessed on 16 September 2023).
- Adeniyi, O.D.; Nwalor, J.U.; Ako, C.T. A review on waterflooding problems in Nigeria’s crude oil production. J. Dispers. Sci. Technol. 2008, 29, 362–365. [Google Scholar] [CrossRef]
- Wikipedia. The Free Encyclopedia. Extraction of Petroleum. Available online: https://en.wikipedia.org/wiki/Extraction_of_petroleum#Primary_recovery (accessed on 15 September 2023).
- Satter, A.; Iqbal, G.M. Enhanced oil recovery processes: Thermal, chemical, and miscible floods. In Reservoir Engineering. The Fundamentals, Simulation, and Management of Conventional and Unconventional Recoveries; Gulf Professional Publishing: Oxford, UK, 2016; ISBN 978-0-12-800219-3. [Google Scholar]
- Siddiqui, M.I.; Baber, S.; Saleem, W.A.; Jafri, M.O.; Hafeez, Q. Industry practices of sour gas management by reinjection: Benefits, methodologies, economic evaluation and case studies. In Proceedings of the SPE/PAPG Annual Technical Conference, Islamabad, Pakistan, 26–27 November 2013. [Google Scholar]
- Kokal, S.L.; Al-Utaibi, A. Sulfur Disposal by Acid Gas Injection: A Road Map and a Feasibility Study. In Proceedings of the SPE Middle East Oil and Gas Show and Conference, Al Manama, Bahrain, 12–15 March 2005. [Google Scholar]
- Samnioti, A.; Kanakaki, E.M.; Koffa, E.; Dimitrellou, I.; Tomos, C.; Kiomourtzi, P.; Stamataki, S. Wellbore and reservoir thermodynamic appraisal in acid gas injection for EOR operations. Energies 2023, 16, 2392. [Google Scholar] [CrossRef]
- Burgers, W.F.J.; Northrop, P.S.; Kheshgi, H.S.; Valencia, J.A. Worldwide development potential for sour gas. Energy Procedia 2011, 4, 2178–2184. [Google Scholar] [CrossRef]
- Maddocks, J. Capacity Control Considerations for Acid Gas Injection Systems; Gas Liquids Engineering Ltd.: Calgary, AB, Canada, 2016. [Google Scholar]
- Bachu, S.; Gunter, W.D. Overview of acid-gas injection operations in Western Canada. In Proceedings of the 7th International Conference on Greenhouse Gas Control Technologies, Vancouver, BC, Canada, 5 September 2004. [Google Scholar]
- Mokhatab, S.; Poe, W.A.; Mak, J.W. Handbook of Natural Gas Transmission and Processing, 4th ed.; Gulf Professional Publishing: Cambridge, MA, USA, 2019; ISBN 978-0-12-815817-3. [Google Scholar]
- Carroll, J.J. Acid gas injection: Past, present, and future. In Proceedings of the International Acid Gas Injection Symposium, Calgary, AB, Canada, 5–6 October 2009. [Google Scholar]
- Samnioti, A.; Kanakaki, E.M.; Fotias, S.P.; Gaganis, V. Rapid Hydrate Formation Conditions Prediction in Acid Gas Streams. Fluids 2023, 8, 226. [Google Scholar] [CrossRef]
- Samnioti, A.; Anastasiadou, V.; Gaganis, V. Application of Machine Learning to Accelerate Gas Condensate Reservoir Simulation. Clean Technol. 2022, 4, 153–173. [Google Scholar] [CrossRef]
- Anastasiadou, V.; Samnioti, A.; Kanakaki, E.M.; Gaganis, V. Acid Gas Re-Injection System Design Using Machine Learning. Clean Technol. 2022, 4, 1001–1019. [Google Scholar] [CrossRef]
- Stalkup, F.I. Miscible Displacement; Henry, L., Ed.; Doherty Memorial Fund of AIME, Society of Petroleum Engineers of AIME: Richardson, TX, USA, 1992. [Google Scholar]
- Jing, Z.; Jing-yuan, C.; Pei-cheng, G.; Hong-jun, T. Wellbore flow model of acid gas reinjection. Nat. Gas Ind. 2005, 25, 76–78. [Google Scholar]
- Mireault, R.A.; Stocker, R.; Dunn, D.W.; Pooladi-Darvish, M. Wellbore dynamics of acid gas injection well operation. In Proceedings of the Canadian Unconventional Resources and International Petroleum Conference, Calgary, AB, Canada, 19–21 October 2010. [Google Scholar]
- Carroll, J.J. Acid Gas Injection—The Next Generation; Gas Liquids Engineering Ltd.: Calgary, AB, Canada, 2009. [Google Scholar]
- International Energy Agency Greenhouse Gas R&D Program. Acid Gas Injection: A Study of Existing Operations, Phase I: Final Report, PH4/18; International Energy Agency Greenhouse Gas R&D Programme: Cheltenham, UK, 2003. [Google Scholar]
- Bachu, S.; Gunter, W. Acid-gas injection in the Alberta basin, Canada: A CO2-storage experience. Geol. Soc. 2004, 233, 225–234. [Google Scholar] [CrossRef]
- Malik, Z.; Charfeddine, M.; Moore, S.; Francia, L.; Denby, P. The Supergiant Kashagan Field: Making a Sweet Development Out of Sour Crude. In Proceedings of the International Petroleum Technology Conference, Doha, Qatar, 21–23 November 2005. [Google Scholar]
- Abou-Sayed, A.S.; Summers, C.; Zaki, K.S. An Assessment of Engineering Economical and Environmental Drivers of Sour Gas Management by Injection. In Proceedings of the SPE International Improved Oil Recovery Conference in Asia Pacific, Kuala Lumpur, Malaysia, 5–6 December 2005. [Google Scholar]
- Urazgaliyeva, G.; King, G.R.; Darmentaev, S.; Tursinbayeva, D.; Dunger, D.; Howery, R.; Zalan, T.; Lindsell, K.; Iskakov, E.; Turymova, A.; et al. Tengiz Sour Gas Injection Project: An Update. In Proceedings of the SPE Annual Caspian Technical Conference and Exhibition, Astana, Kazakhstan, 12–14 November 2014. [Google Scholar]
- Miwa, M.; Shiozawa, Y.; Saito, Y.; Tarmoom, I.O. Sour Gas Injection Project. In Proceedings of the Abu Dhabi International Petroleum Exhibition and Conference, Abu Dhabi, United Arab Emirates, 13–16 October 2002. [Google Scholar]
- Haynes, B.; Kaura, N.C.; Faulkner, A. Life Cycle of a depletion drive and sour gas injection development: Birba A4C Reservoir, South Oman. In Proceedings of the International Petroleum Technology Conference, Kuala Lumpur, Malaysia, 3–5 December 2008. [Google Scholar]
- Battistelli, A.; Ceragioli, P.; Marcolini, M. Injection of Acid Gas Mixtures in Sour Oil Reservoirs: Analysis of Near-Wellbore Processes with Coupled Modelling of Well and Reservoir Flow. Transp. Porous Media 2011, 90, 233–251. [Google Scholar] [CrossRef]
- Samnioti, A.; Gaganis, V. Applications of Machine Learning in Subsurface Reservoir Simulation—A Review—Part I. Energies 2023, 16, 6079. [Google Scholar] [CrossRef]
- Samnioti, A.; Gaganis, V. Applications of Machine Learning in Subsurface Reservoir Simulation—A Review—Part II. Energies 2023, 16, 6727. [Google Scholar] [CrossRef]
- Abdelwahhab, M.A.; Radwan, A.A.; Mahmoud, H.; Mansour, A. Geophysical 3D-static reservoir and basin modeling of a Jurassic estuarine system (JG-Oilfield, Abu Gharadig basin, Egypt). J. Asian Earth Sci. 2022, 225, 105067. [Google Scholar] [CrossRef]
- Abdelwahhab, M.A.; Abdelhafez, N.A.; Embabi, A.M. 3D-static reservoir and basin modeling of a lacustrine fan-deltaic system in the Gulf of Suez, Egypt. Pet. Res. 2022, 8, 18–35. [Google Scholar] [CrossRef]
- Offshore Technology. Prinos Offshore Development Project, North Aegean Sea, Gulf of Kavala. Available online: https://www.offshore-technology.com/projects/prinos-offshore-development-project-north-aegean-sea-gulf-of-kavala/ (accessed on 18 September 2023).
- Proedrou, P.; Papaconstantinou, C.M. Prinos basin—A model for oil exploration. Bull. Geol. Soc. 2004, 36, 327–333. [Google Scholar]
- Kiomourtzi, P.; Pasadakis, N.; Zelilidis, A. Source Rock and Depositional Environment Study of Three Hydrocarbon Fields in Prinos—Kavala Basin (North Aegean). Open Pet. Eng. J. 2008, 1, 16–29. [Google Scholar] [CrossRef]
- Computer Modelling Group (CMG) Ltd. IMEX Black Oil & Unconventional Simulator. Available online: https://www.cmgl.ca/imex (accessed on 15 November 2023).
- Computer Modelling Group (CMG) Ltd. CMOST Intelligent Optimization and Analysis Tool. Available online: https://www.cmgl.ca/cmost (accessed on 15 November 2023).
- Wantawin, M.; Yu, W.; Dachanuwattana, S.; Sepehrnoori, K. An Iterative Response-Surface Methodology by Use of High-Degree-Polynomial Proxy Models for Integrated History Matching and Probabilistic Forecasting Applied to Shale-Gas Reservoirs. SPE J. 2017, 22, 2012–2031. [Google Scholar] [CrossRef]
- Ahmed, T. Reservoir Engineering Handbook, 4th ed.; Elsevier: Amsterdam, The Netherlands, 2010; ISBN 9780080966670. [Google Scholar]
- Whitson, C.H. Characterizing hydrocarbon plus fractions. Soc. Pet. Eng. J. 1983, 23, 683–694. [Google Scholar] [CrossRef]
- Computer Modelling Group (CMG) Ltd. GEM Compositional & Unconventional Simulator. Available online: https://www.cmgl.ca/gem (accessed on 15 November 2023).
- Koyanbayev, M.; Wang, L.; Wang, Y.; Hashmet, M.R. Advances in sour gas injection for enhanced oil recovery-an economical and environmental way for handling excessively produced H2S. Energy Rep. 2022, 8, 15296–15310. [Google Scholar] [CrossRef]
- Van Vark, W.; Masalmeh, S.K.; van Dorp, J.; Al-Nasr, M.A.; Al-Khanbashi, S. Simulation study of miscible gas injection for enhanced oil recovery in low permeable carbonate reservoirs in Abu Dhabi. In Proceedings of the Abu Dhabi International Conference and Exhibition, Abu Dhabi, United Arab Emirates, 10–13 October 2004. [Google Scholar]
- Kaita, A.Y.; Ogolo, O.; Wu, X.; Mohammed, I.; Akpan, E.A. Study of the impact of injection parameters on the performance of miscible sour gas injection for enhanced oil recovery. J. Petrol. Explor. Prod. Technol. 2020, 10, 1575–1589. [Google Scholar] [CrossRef]
- Smith, S.; Sorensen, J.A.; Steadman, E.N.; Harju, J.A.; Ryan, D. Zama acid gas EOR, CO2 sequestration, and monitoring project. Energy Procedia 2010, 4, 3957–3964. [Google Scholar] [CrossRef]
- Bealessio, B.A.; Alonso, N.A.B.; Mendes, N.J.; Sande, A.V.; Hascakir, B. A review of enhanced oil recovery (EOR) methods applied in Kazakhstan. Petroleum 2021, 7, 1–9. [Google Scholar] [CrossRef]
- Global CCS Institute. Weyburn Carbon Dioxide Sequestration Project. Available online: https://www.globalccsinstitute.com/archive/hub/publications/159718/weyburn-carbon-dioxide-sequestration-project.pdf (accessed on 19 November 2023).
- Malik, Q.M.; Islam, M.R. CO2 Injection in the Weyburn Field of Canada: Optimization of Enhanced Oil Recovery and Greenhouse Gas Storage with Horizontal Wells. In Proceedings of the SPE/DOE Improved Oil Recovery Symposium, Tulsa, OK, USA, 3–5 April 2000. [Google Scholar] [CrossRef]
- Identification of Enhanced Oil Recovery Potential in Alberta, Phase II Final Report for Energy Resources Conservation Board. 2012. Available online: https://static.aer.ca/prd/documents/reports/ercb-eor-report2.pdf (accessed on 19 November 2023).
Disclaimer/Publisher’s Note: The statements, opinions and data contained in all publications are solely those of the individual author(s) and contributor(s) and not of MDPI and/or the editor(s). MDPI and/or the editor(s) disclaim responsibility for any injury to people or property resulting from any ideas, methods, instructions or products referred to in the content. |
© 2023 by the authors. Licensee MDPI, Basel, Switzerland. This article is an open access article distributed under the terms and conditions of the Creative Commons Attribution (CC BY) license (https://creativecommons.org/licenses/by/4.0/).