Article

Balancing of Low-Voltage Supply Network with a Smart Utility Controller Leveraging Distributed Customer Energy Sources

by
Dumisani Mtolo
1,*,
David Dorrell
2,* and
Rudiren Pillay Carpanen
3,*
1
Gautrain Management Agency, Midrand 1682, South Africa
2
School of Electrical and Information Engineering, The University of the Witwatersrand, Braamfontein, Johannesburg 2000, South Africa
3
School of Electrical, Electronic and Computer Engineering, The University of KwaZulu-Natal, Durban 4041, South Africa
*
Authors to whom correspondence should be addressed.
Energies 2023, 16(23), 7707; https://doi.org/10.3390/en16237707
Submission received: 13 October 2023 / Revised: 8 November 2023 / Accepted: 17 November 2023 / Published: 22 November 2023
(This article belongs to the Special Issue Smart Grid Control and Optimization (Volume II))

Abstract

:
In South Africa, there has been a rapid adoption of solar power, particularly inverter-based solar sources, in low-voltage (LV) networks due to factors such as load shedding, rising electricity costs and greenhouse gas emissions reduction. In residential LV networks, the alignment between solar supply and energy demand is less precise, necessitating larger battery storage systems to effectively utilize solar energy. Residential areas experience peak energy demand in the morning and evening when solar irradiance is limited. As a result, substantial energy storage is important to fully utilize the potential of solar energy. However, increasing inverter-based, customer-generated power creates an imbalance in the utility supply. This is because utility LV supply transformers have three phases, while individual customers have single-phase connections and no load balancing control mechanism. This supply imbalance adversely affects the overall power quality, causing energy losses, damage to devices and other issues. To address these problems, the paper proposes a smart control approach to minimize power imbalances within utility LV supply transformers. The controller uses customer battery storage in residential areas to balance the utility transformer phases. A laboratory model was built to simulate a three-phase low-voltage network with single-phase customers, both with and without a smart controller. The results show that closely monitoring and controlling individual inverters through a central controller can significantly improve the balance of the supply network.

1. Introduction

The increasing deployment of green energy generation and the demand for cleaner energy sources to combat greenhouse gas emissions have brought about operational challenges in electric power networks. The integration of small-scale solar energy sources into low-voltage (LV) networks has become more prevalent globally. These renewable energy sources are typically synchronized with the utility grid using grid-tied or hybrid inverters. The grid-tied inverter is most suitable for regions with reliable utility power, as it synchronizes with the utility supply and shuts down during outages. On the other hand, the hybrid inverter offers the advantage of continued operation even when the utility supply is disrupted. In South Africa, where frequent power cuts are common, customers often prefer using hybrid inverters to fully leverage solar energy, even in the absence of utility power.
Low-voltage networks with solar generation face various operational challenges, including overvoltages and unbalanced phases (voltage and/or current imbalances). For instance, during the middle of a sunny day when the load demand is low but solar generation is at its peak, within a residential utility LV transformer zone, customers may experience overvoltages due to high solar generation despite low demand. Additionally, there may be an unbalanced situation in the utility supply transformer caused by various inverters operating in different modes (i.e., local battery mode vs. line mode). This means that in the LV network, which was previously well-balanced before the introduction of solar energy, some single-phase customers might receive local supply from their inverters while other customers on different phases are directly supplied from the grid, resulting in an unbalanced system. The main focus of this paper addresses supply current imbalances, specifically concerning hybrid inverters operating within the South African network. It is important to note that these hybrid inverters distinguish themselves from grid-tied inverters by not injecting electricity into the grid, which helps prevent voltage rise issues.
Numerous strategies have been proposed to balance the load across the three phases of the supply network. In studies such as [1,2,3,4], phase balancing is achieved by dynamically reallocating the supply phases of individual single-phase customers. This approach requires an upgrade of the low-voltage (LV) network, allowing each single-phase customer to connect to all three phases through an intelligent switch. This switch dynamically redistributes the supply phase, ensuring a balanced supply at all times. The proposed method in this paper leverages existing customer inverters and batteries to manage supply-demand dynamics. This is achieved by either storing energy in the customers’ batteries or deploying stored battery energy to balance the supply as needed. The effectiveness of this control strategy is contingent upon the availability of customer inverters and battery storage across all three phases, with a greater number of inverters and batteries enhancing its performance. In this approach, the operational challenges as a result of the integration of renewable energy sources into the power grid can be managed effectively and regulated remotely using an automatic controller capable of communicating with individual inverters in a residential LV network. The primary function of the controller is to toggle the operation modes of customer inverters on different phases, aiming to establish a balanced supply network within acceptable operating limits for a specified period.
This paper is organized as follows: Section 2 reviews prior research in the field of LV supply network phase balancing and essential communication network support. Section 3 reports on a laboratory case study aimed at replicating a real low-voltage network, along with an examination of the controller design, which incorporates cyber-security measures for the communication network. Finally, Section 4 presents conclusions and provides recommendations.

2. Related Work and Contribution of This Research

The literature review indicates a lack of publications concerning the monitoring and control of low-voltage networks with the specific goal of balancing the supply current using inverter-based generation and storage systems. The next subsection will examine various approaches to attaining load balancing within LV networks and highlight the contribution of this paper in relation to the existing strategies.

2.1. Balancing of Phases in Low-Voltage Networks

Several factors play a role in causing either voltage or current imbalances within the supply network. In [5], the authors address unbalanced voltage drops attributed to the overhead conductor geometry of the three phases and load imbalances across phases. They show that, in overhead line systems, voltage unbalances are influenced by factors such as uneven phase loading, asymmetrical line geometry (the physical positioning of phase conductors) and phase sequences. In contrast, underground cable systems typically exhibit a higher degree of source voltage balance, with voltage unbalances primarily due to uneven phase loading. If one phase carries significantly more load than the others, a voltage drop may occur in that phase, leading to a voltage unbalance. When voltage sources are balanced, an even distribution of load across phases leads to equivalent voltage drops in each phase. In the presence of unbalanced voltage sources, the voltage unbalance can worsen with increasing loading, even when the load is evenly distributed. To enhance the controller’s effectiveness in balancing current distribution across phases, it is important to balance the source voltage of the utility’s overhead system by careful consideration of phase sequencing and the use of suitable phase conductor geometry.
Numerous strategies have been put forward to balance the load on the phases of the supply network. In [1,2,3,4], phase balancing was achieved through phase re-allocation of individual single-phase customers. To implement this approach, an upgrade of the LV network is essential to enable the connection of each single-phase customer to all three phases through an intelligent switch to redistribute the supply phase dynamically, ensuring a balanced supply at any given time. The method proposed in the work takes advantage of the already installed customer inverters and batteries to control the supply-demand dynamics. This is accomplished by either storing surplus energy in the batteries or using the stored battery energy to balance the supply when necessary.
In [6], a shunt device called D-STATCOM was proposed to reduce the negative and zero sequence currents of the upstream network. This implies that the downstream network remains unbalanced, making it crucial to position the devices optimally, which might pose challenges. The proposed strategy becomes increasingly effective as the number of inverter-based generation sources increases; it relies solely on the availability of customer inverters to balance the supply.
Nonetheless, numerous publications exist that focus on the adverse effects introduced by unbalanced systems, as well as the communication protocols of inverters and smart grid networks. These publications play a vital role in this paper, instilling high confidence that the proposed solution can be readily implemented, as discussed in the following sections.

2.2. Consequences of Unbalanced System

The imbalance in voltage and current within low-voltage networks is escalating due to the incorporation of customer self-generation, involving previously utility-dependent customers. According to [7], the definition of voltage and current unbalance can be found in several standards, including IEEE Std. 936 (1987), IEEE Std. 112 (1991), and National Electrical Manufacturers Association of the USA (NEMA) Std. (1993). The true definition is provided by IEEE (1996) and the South African Power Quality Standard (NRS048). These standards outline voltage and current unbalance as follows:
V unbalance = V max Average voltage × 100 %
V max = max ( V a Average voltage , V b Average voltage , V c Average voltage )
Average voltage = V a + V b + V c 3
I unbalance = I max Average current × 100 %
I max = max ( I a Average current , I b Average current , I c Average current )
Average current = I a + I b + I c 3
Equations (1)–(6) disregard any consideration of phase differences between the three phases; they solely rely on the amplitudes of voltages and currents. In a three-phase, four-wire system, it is important to take into consideration the zero sequence currents on the neutral wire of an unbalanced system. The following equations take into consideration the phase difference and the effect of zero sequence components that may exist in a three-phase, four-wire, unbalanced system, so that
V unbalance = V neg V pos × 100 %
V pos = V a + V b 120 + V c 240 3
V neg = V a + V b 240 + V c 120 3
I unbalance = I neg I pos × 100 %
I pos = I a + I b 120 + I c 240 3
I neg = I a + I b 240 + I c 120 3
V zero = V a + V b + V c 3
I zero = I a + I b + I c 3
R M S V = V zero 2 + V neg 2 V pos
R M S I = I zero 2 + I neg 2 I pos
where Va, Vb and Vc represent phase voltages, and similarly, Ia, Ib and Ic represent individual phase currents.
Excessive levels of voltage or current unbalance can lead to elevated losses and equipment damage. In [8], the authors present a correlation between the level of supply voltage unbalance in a three-phase induction motor and the resulting de-rating factor. They highlight that a 3% voltage unbalance corresponds to a 90% de-rating factor. This incurs additional expense for the customer since they need to invest in a larger machine to offset the effects of an unbalanced power supply. According to the South African National Standard [9], it is important to adhere to a maximum unbalance limit of 3% on South African low-voltage (LV) networks, especially those serving predominantly single-phase customers.
With regards to the unbalanced supply current limit, the authors of [10] recommend that, in specific distribution transformers with Yyn0 (or YNyn0) and Yzn11 (or YNzn11) configurations, the neutral current should not exceed 25% and 40% of the rated transformer current, respectively. According to [7,11], harmonic currents cause extra heat on the transformer primary winding of a delta-star connected transformer.

2.3. Monitoring of Low-Voltage Networks

The introduction of distributed energy resources (DERs) into distribution grids necessitates the implementation of reliable and precise monitoring systems to improve both grid performance and the overall quality of power supply. Many utility companies have taken the initiative to install phasor measurement units (PMUs) within medium-voltage grids (MVDGs) and low-voltage distribution grids (LVDGs) for active network monitoring and subsequent performance improvement. The effectiveness of this monitoring approach was validated successfully through numerical simulations in [12]. Aligned with this initiative, this study investigates the utilization of a fast reporting measurement and control device situated in the MV/LV transformer zone, specifically on the LV side of the transformer. This device takes advantage of the existing grid-tied and hybrid inverters connected on the customer side, eliminating the need for the utility to install additional measurement devices. The objective is to harness the customer devices, which already provide essential measurements, to enhance the performance of the supply network. It is important to highlight that, since MV/LV transformers are distributed along the MV feeder, enhancing load flow monitoring and control at the LV side also improves the load flow performance of the upstream MV network. Due to their design, the footprint of LVDGs is nearly 100 times larger than that of MVDGs. Consequently, monitoring and controlling the LVDG using a strategy similar to that of the MVDG can be costly. Hence, this paper proposes a different approach. Much like the methodology employed in this paper, the authors in [13] introduced a weighted least-squares (WLS) distribution system state estimation (DSSE) specifically designed for low-voltage distribution grids (LVDGs). This particular approach leverages the rapid growth of the installation of smart metering devices within LVDGs. Smart metering encompasses four essential components: the meter itself, a communication network, a data concentrator and a control center, aligning with the framework proposed in this paper. The study showcased that this DSSE technique can achieve an exceptionally high level of accuracy, which remains unaffected by the quality of the smart meter. Correspondingly, this paper builds upon the rapid proliferation of inverter-based energy resources, featuring a central controller responsible for remote monitoring and control of customer inverters. In [14], the authors introduced a real-time simulation platform that seamlessly integrates the electrical power system with the information and communication technology (ICT) components of medium-voltage/low-voltage (MV/LV) grids. This system is constructed using cost-effective, readily available, commercial off-the-shelf (COTS) devices like Raspberry Pi and Arduino boards. The primary purpose of this platform is to facilitate simulations of MV/LV grids and analyze diverse control strategies for extended networks, which encompass PV inverters, energy storage systems, electric vehicles and more. This study aligns with the strategy outlined in this paper, which includes the creation of a laboratory hardware demonstration utilizing Raspberry Pi and hybrid inverters (COTS devices). This hardware is specifically designed for simulating a low-voltage system (with high penetration of hybrid inverters) and for conducting tests of control strategy aimed at balancing the supply current across different supply phases. The authors in [15] assert that the most efficient method for detecting faults in the low-voltage system is through current measurements on MV/LV transformers, as opposed to distributed voltage measurements. The insights gained from this study can be applied to enhance the proposed controller, enabling it to identify network faults by distinguishing between normal and faulty conditions within the network by making use of the controller current measurements of the supply. In [16], the authors introduced an algorithm for the optimal placement of smart meters within distribution networks, encompassing both medium-voltage (MV) and low-voltage (LV) grids. This algorithm facilitates state estimation of the low-voltage network and is applicable in regions where smart meters are already in use as well as in areas where they are not yet deployed. However, it is important to note that the algorithm is based on the assumption of a balanced low-voltage network, which may not always hold true, especially in networks with single-phase customers within the three-phase supply system. While the paper suggests the need for further exploration of unbalanced network scenarios, the current findings from this study can still prove valuable when integrated with the strategy outlined in this paper, which aims to achieve a balanced supply system. In [17], the authors explored the potential utilization of the existing smart metering infrastructure in conjunction with other sensors to improve data collection and enhance the capabilities of the smart grid. The proposed controller of this paper can be highly beneficial in initiatives such as [17] in providing valuable data, including the storage capacity of individual households and the total available energy stored within the local network to support the operation of LV networks. In the paper [18], a monitoring device designed for overhead transformers was described. The study’s objective was to minimize overhead transformer failures by calculating the hot spot temperature of the transformer and preventing failures proactively. This aligns with the goals of the proposed controller, which aims to balance supply currents across the phases to reduce transformer heating caused by imbalanced currents. There is potential for information exchange between these two devices to enhance the efficiency of the proposed controller. In the study described in [19], the authors put forth an economical communication technology that integrates both wireless, low-power wide-area network (LP-WAN), and wired, power-line carrier (PLC) technologies for real-time monitoring of power system equipment. This technology could prove highly beneficial for the expansion and deployment of the proposed controller.
However, none of these studies proposed an MV/LV network infrastructure that enables the monitoring and control of these networks for effective grid management.
In Eskom (the national power company of South Africa) and numerous South African municipalities, it is customary to forgo the monitoring and control of LV networks using SCADA systems due to the substantial costs involved. However, this practice leaves LV networks with embedded generators vulnerable to various risks, including overloading, unbalanced utility supply and overvoltages. The root cause lies in the fact that LV networks were not initially designed to accommodate small-scale solar PV generation, resulting in their radial configuration.
In a small area within a specific individual MV/LV transformer zone, distributed PV systems tend to generate power simultaneously, with a nearly 100% coincident factor. In contrast, LV networks in residential areas are typically designed to handle a coincident factor of load demand ranging from 20 to 40% (this means customers are not expected to utilize their Notified Maximum Demand simultaneously). As a result, the NRS guidelines recommend that small-scale generators limit their generation to 25% of the customer’s Notified Maximum Demand (NMD) capacity, as indicated in Table 1. This restriction is designed to mitigate the risk of overload, over-voltage and unbalanced problems in low-voltage (LV) networks featuring grid-tied inverters, whereas hybrid inverters predominantly contribute to current imbalances (and not overload or over-voltage) in the supply, and none of the South African utility standards impose restrictions on the supply current imbalance aspect.
In the absence of SCADA monitoring systems on LV networks, certain customers may surpass the NRS requirements, thereby posing a risk of overloading, over-voltages (in cases of grid-tied inverter customer generation) and supply unbalance in the LV network, particularly during the middle of the day when the load demand is low and PV generation is high. To address these potential issues and ensure the stability of the LV network, this study proposes the implementation of centralized control over generators within the LV transformer zone. This centralized control mechanism aims to enhance the utility’s power supply quality and mitigate any potential risks associated with utility supply unbalance.

2.4. Understanding Inverter Communication

In this paper, inverter communication refers to the exchange of data between the inverter and other devices in the system (low-voltage utility network). Data exchange between devices occurs through a standardized communication protocol such as Modbus, CAN bus and serial CRC.

2.5. Smart Grid Communication Networks and Protocols

According to [20], there are various cheaper methods to enable communication between the customer device and the utility control device on LV networks without the involvement of third-party telecommunication companies. These include the following:
  • Power-line carrier (PLC), which provides two-way communication through existing LV network infrastructure.
  • LoRa, which is a wireless technology that provides secure, low-power data transmission over long distances.
  • ZigBee, which is a wireless communication protocol specifically designed to facilitate low-power, short-range connectivity between devices.
The advantage of using PLC technology is that it is not dependent on a third party network like other RF/wireless technologies, and therefore it is cost effective over its lifespan. Figure 1 shows a typical PLC communication layout within a MV/LV transformer zone. Each phase of the network supply necessitates a pair of PLC modems. One modem is directly connected to the controller on the utility side, while the other modem is connected to an inverter at the customer’s installation.
Like many other communication technologies, PLC includes a sender at one end of the communication channel and a receiver at the other end, who are responsible for the modulation and demodulation of information, respectively.
According to [21], LoRa wireless technology utilizes an unlicensed frequency band. It is prone to interference from any user, which can negatively impact its performance. To address this challenge, it is possible to integrate LoRa with power-line communication (PLC) technology whenever feasible.

2.6. Comparable Energy Systems

Buildings equipped with heating, ventilation and air conditioning (HVAC) systems demonstrate flexibility in energy consumption, primarily due to their considerable thermal inertia. This thermal inertia is similar to battery storage systems, allowing both systems to allocate input electric energy for secondary purposes without compromising their primary function. Notably, an HVAC system can briefly suspend electrical supply without significantly impacting the overall temperature regulation within the building. Similarly, battery storage can briefly disconnect from the grid and supply a local load through an inverter and a battery. The authors in [22] highlight the use of HVAC systems to deliver ancillary services, which are critical for maintaining a continuous balance between power demand and supply of the grid. Furthermore, the authors in [23] demonstrate that using a central control system to coordinate different technology combinations can potentially improve energy utilization efficiency. In each of these systems, the key feature is the presence of an intelligent controller for localized energy management, much like the controller proposed in this paper.

3. Case Study

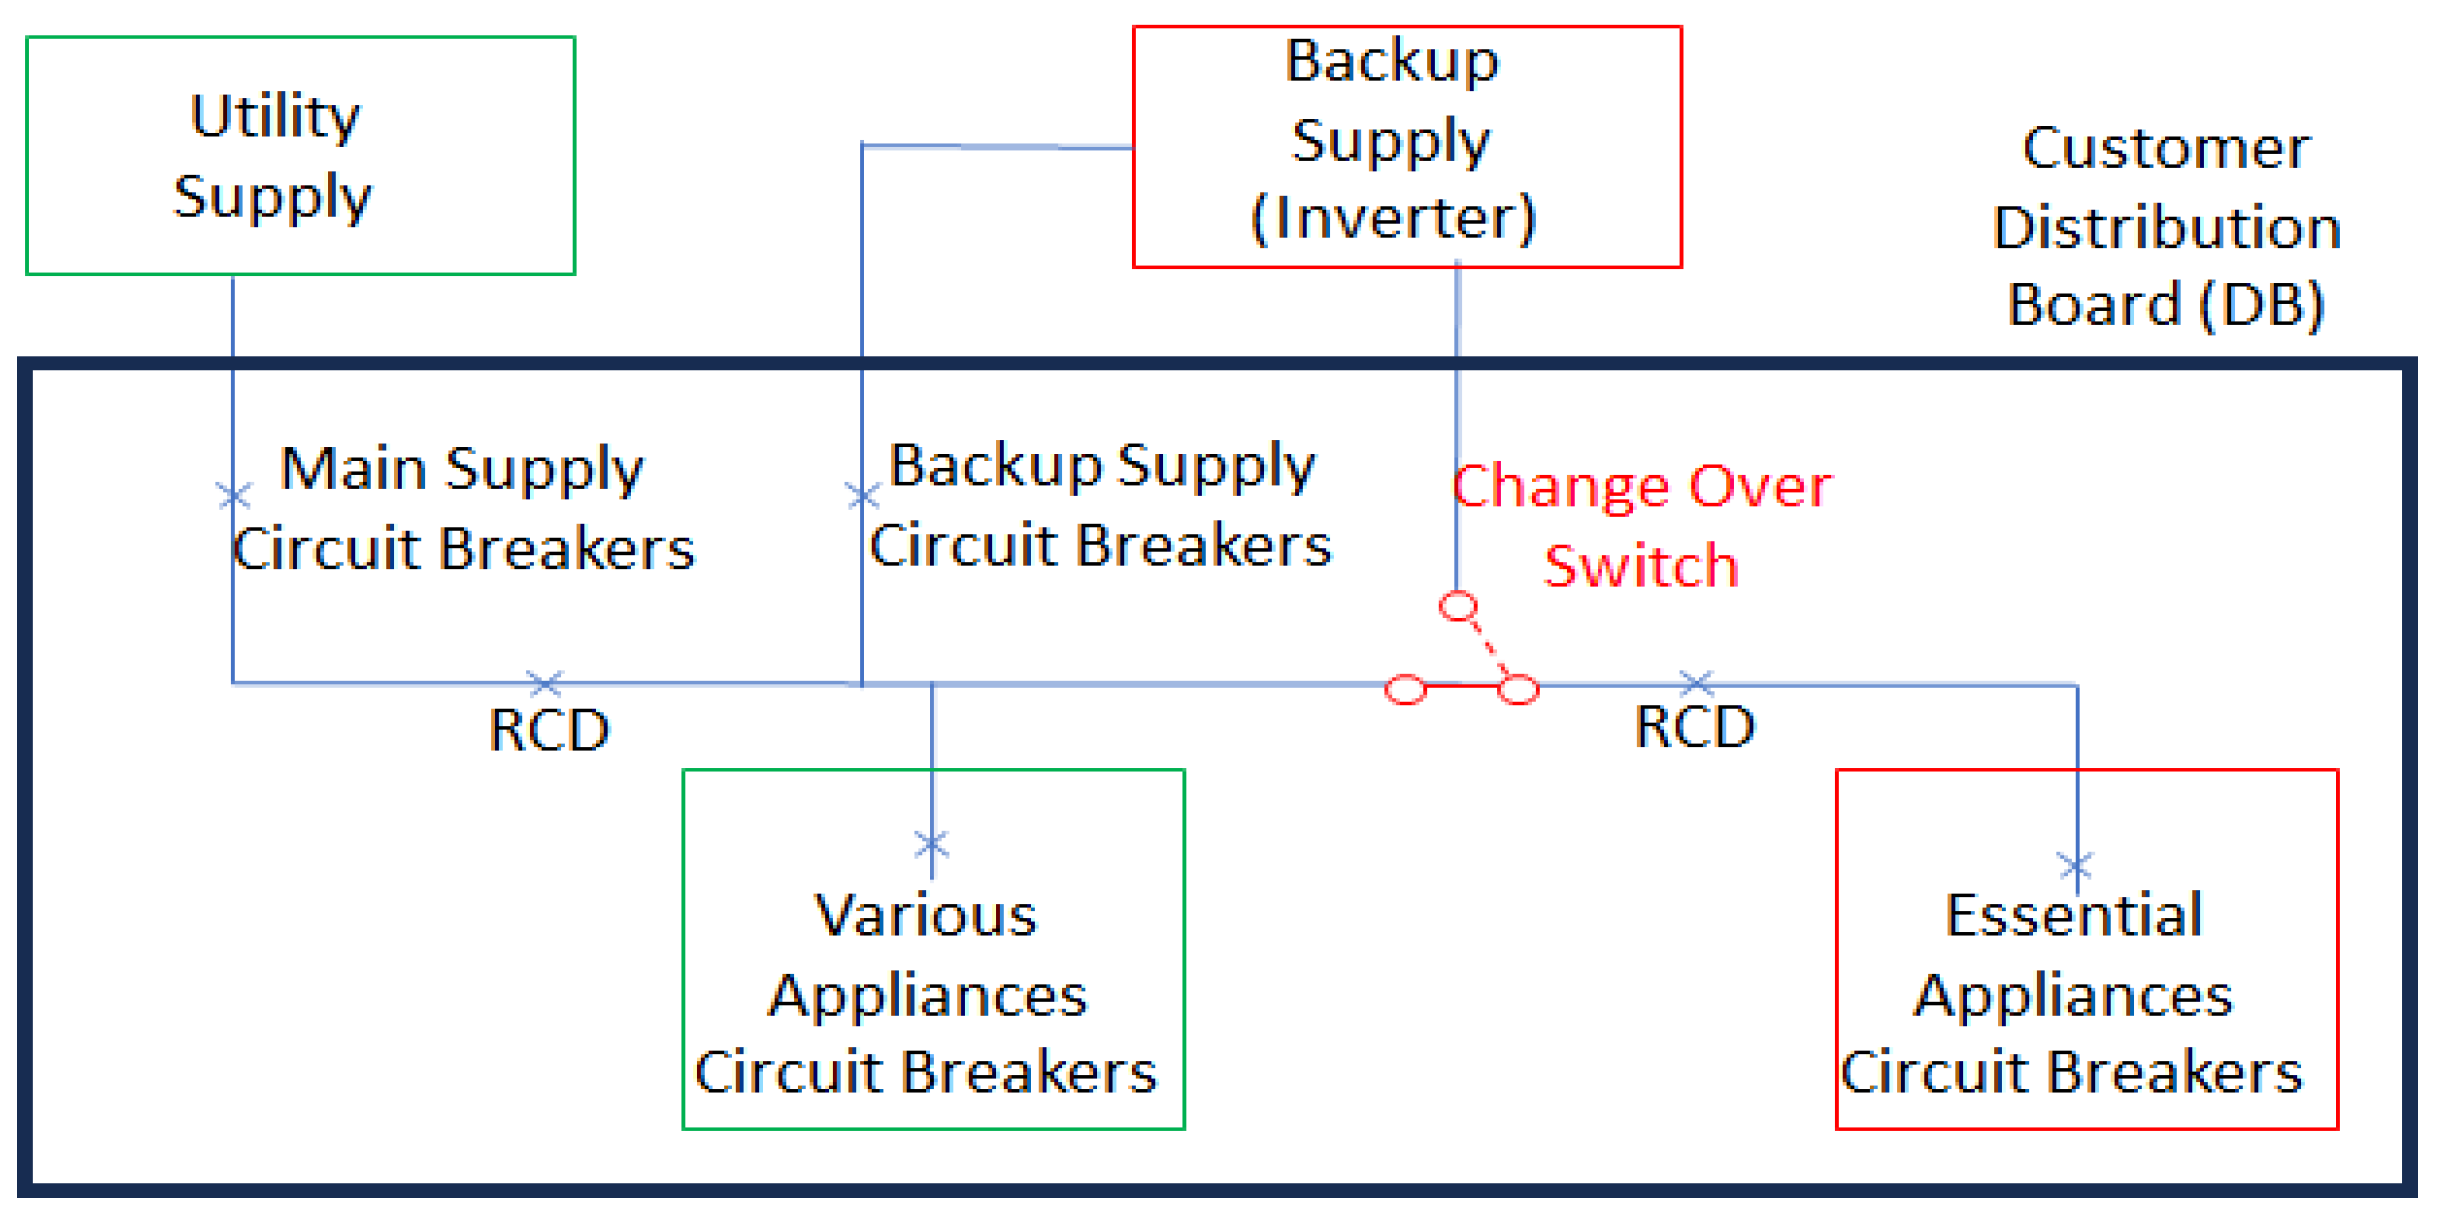
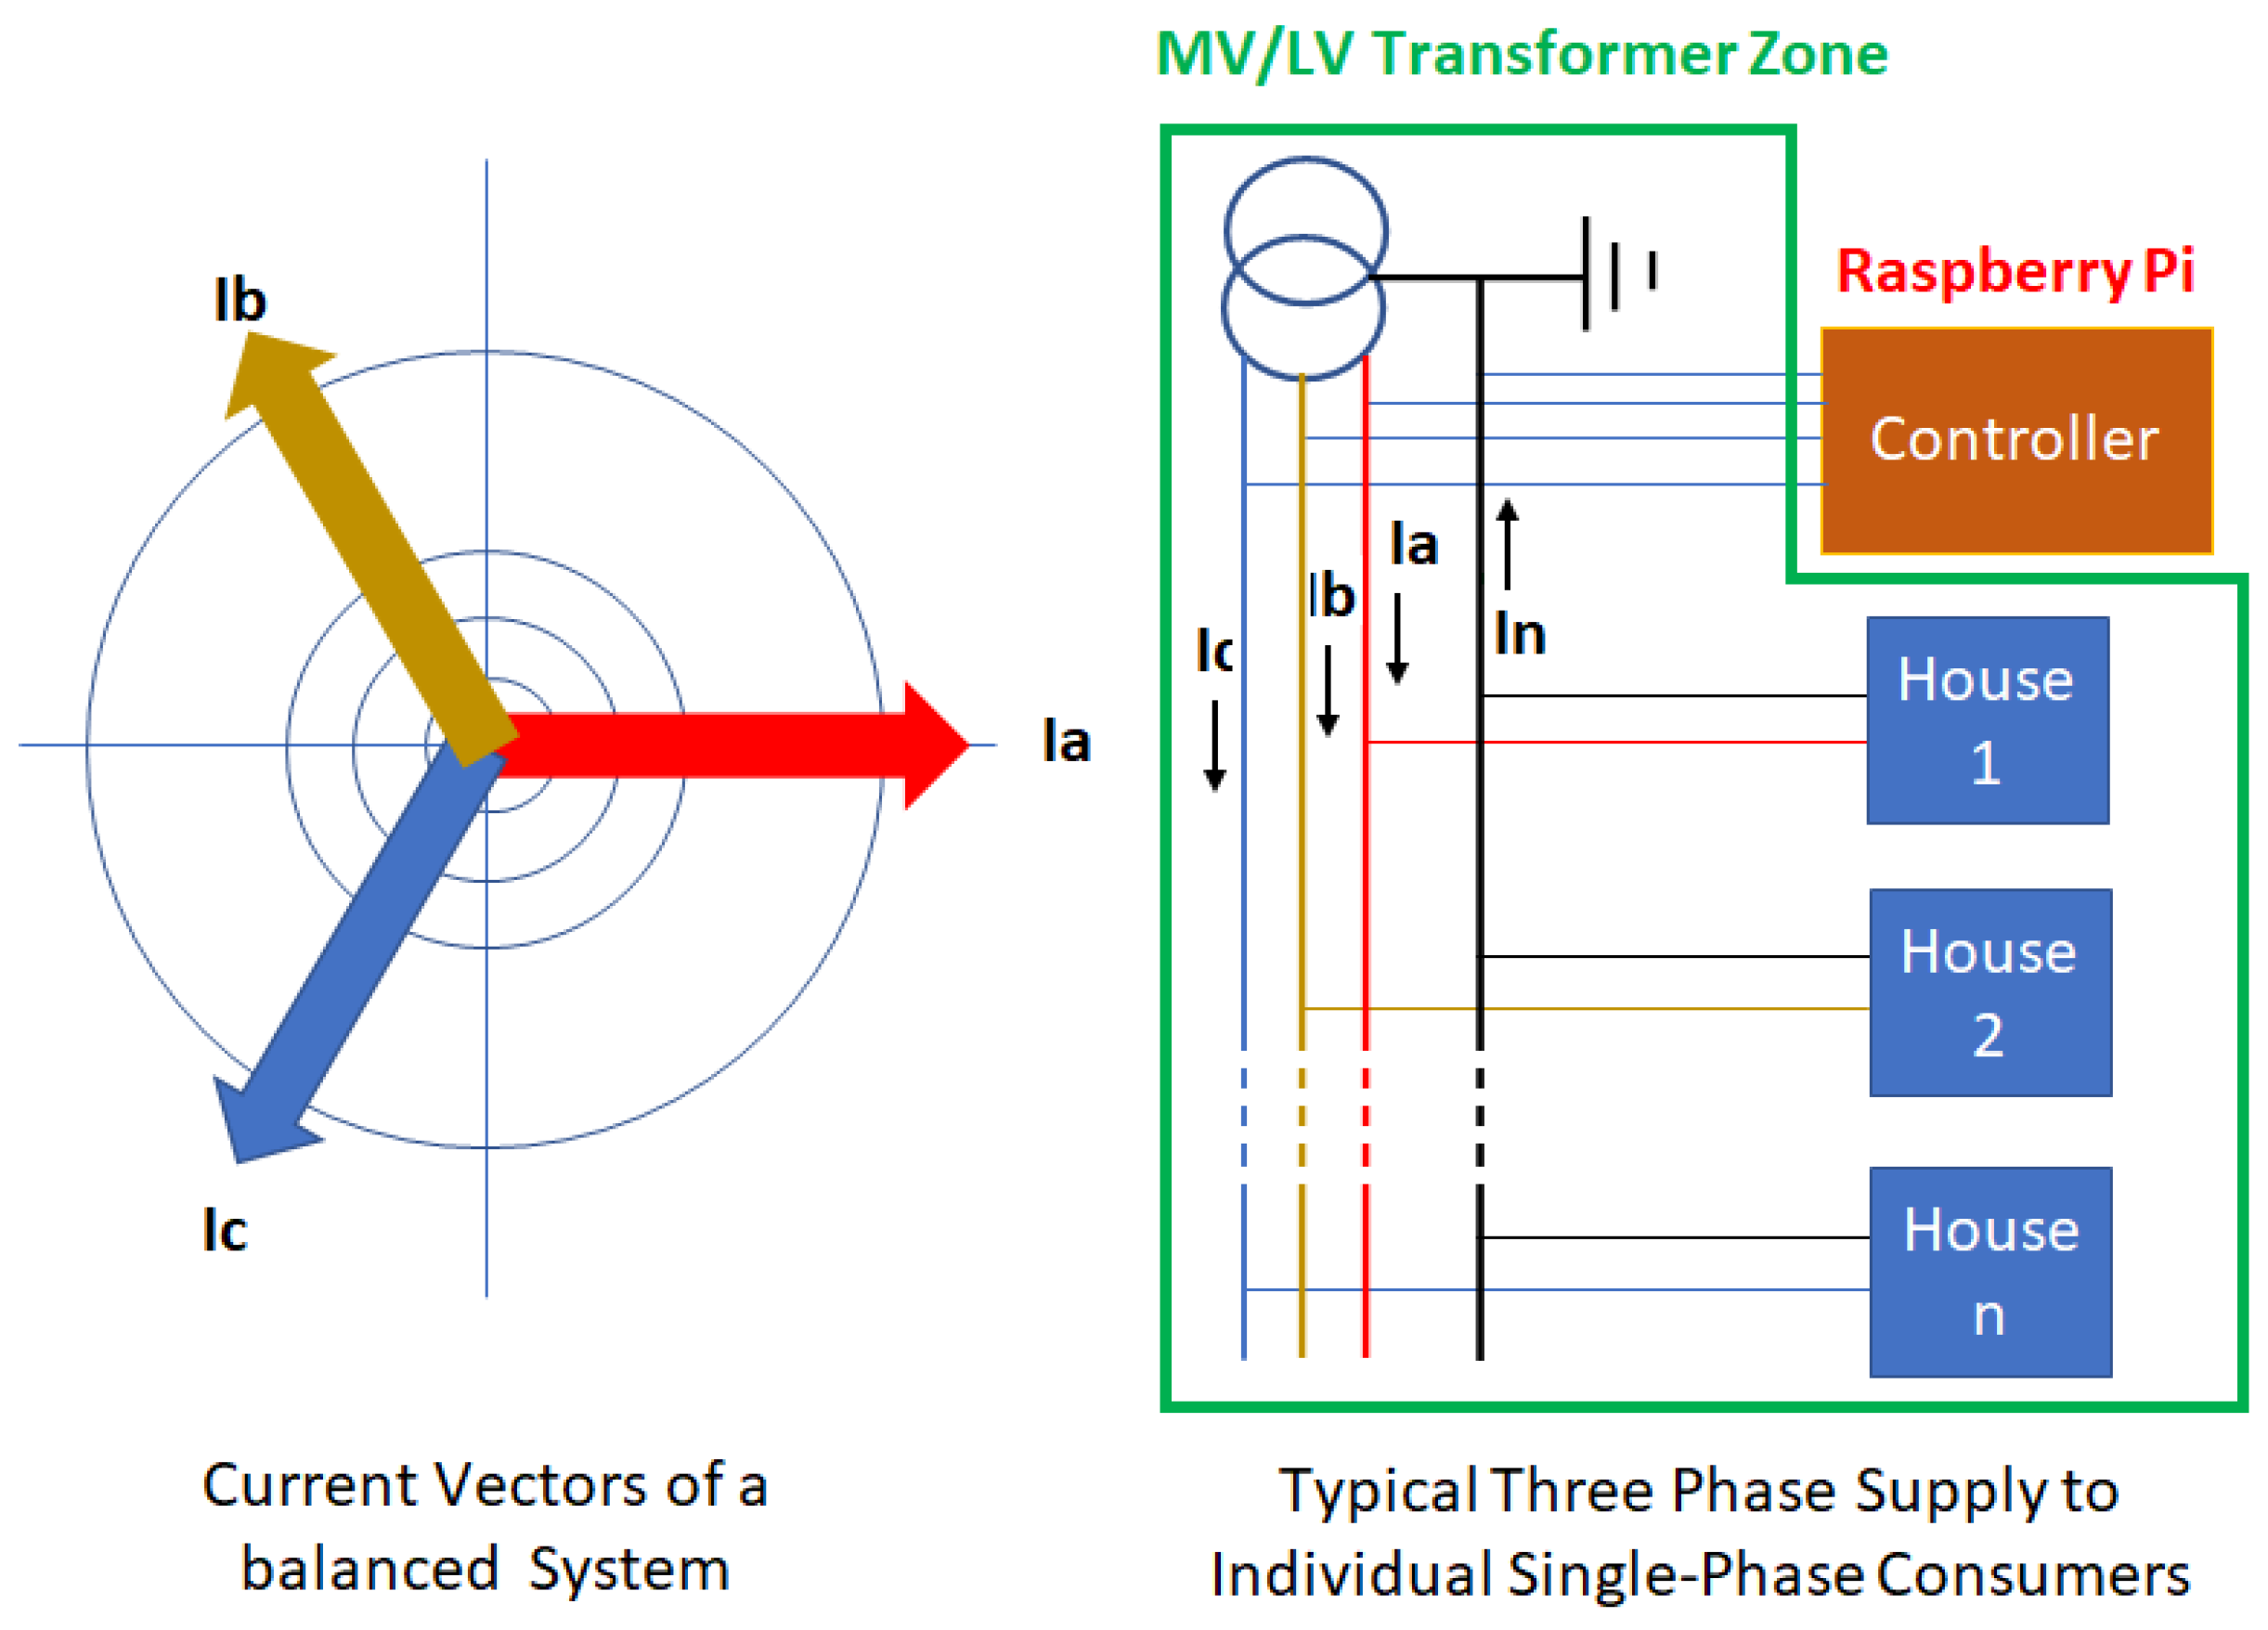
3.1. Description of a Typical LV Customer Installation

According to [24], low-voltage single-phase customers with a backup supply (alternative supply) can choose either a full or partial backup supply, as illustrated in Figure 2 and Figure 3. The backup inverter, which is of the hybrid type, features two AC terminals: one for the grid connection and another for the load. Additionally, it has two DC terminals: one for battery connection and the other for solar PV. The AC load side of the inverter is connected through a selector switch (known as a change-over switch) before the load supply circuit breaker. The primary purpose of the change-over switch is to provide a bypass option in case the inverter is either malfunctioning or not in use. In this configuration, the inverter is limited to supplying power to the load and cannot transfer power back to the utility, thereby ensuring the installation remains protected from causing over-voltage situations and from becoming dangerous to utility personnel who might be working on the network.

3.2. Description of Devices Used in the Laboratory

The laboratory setup incorporates the following devices:
  • Rapberry Pi;
  • Schneider Powerlogic meter;
  • Mercer hybrid inverter.

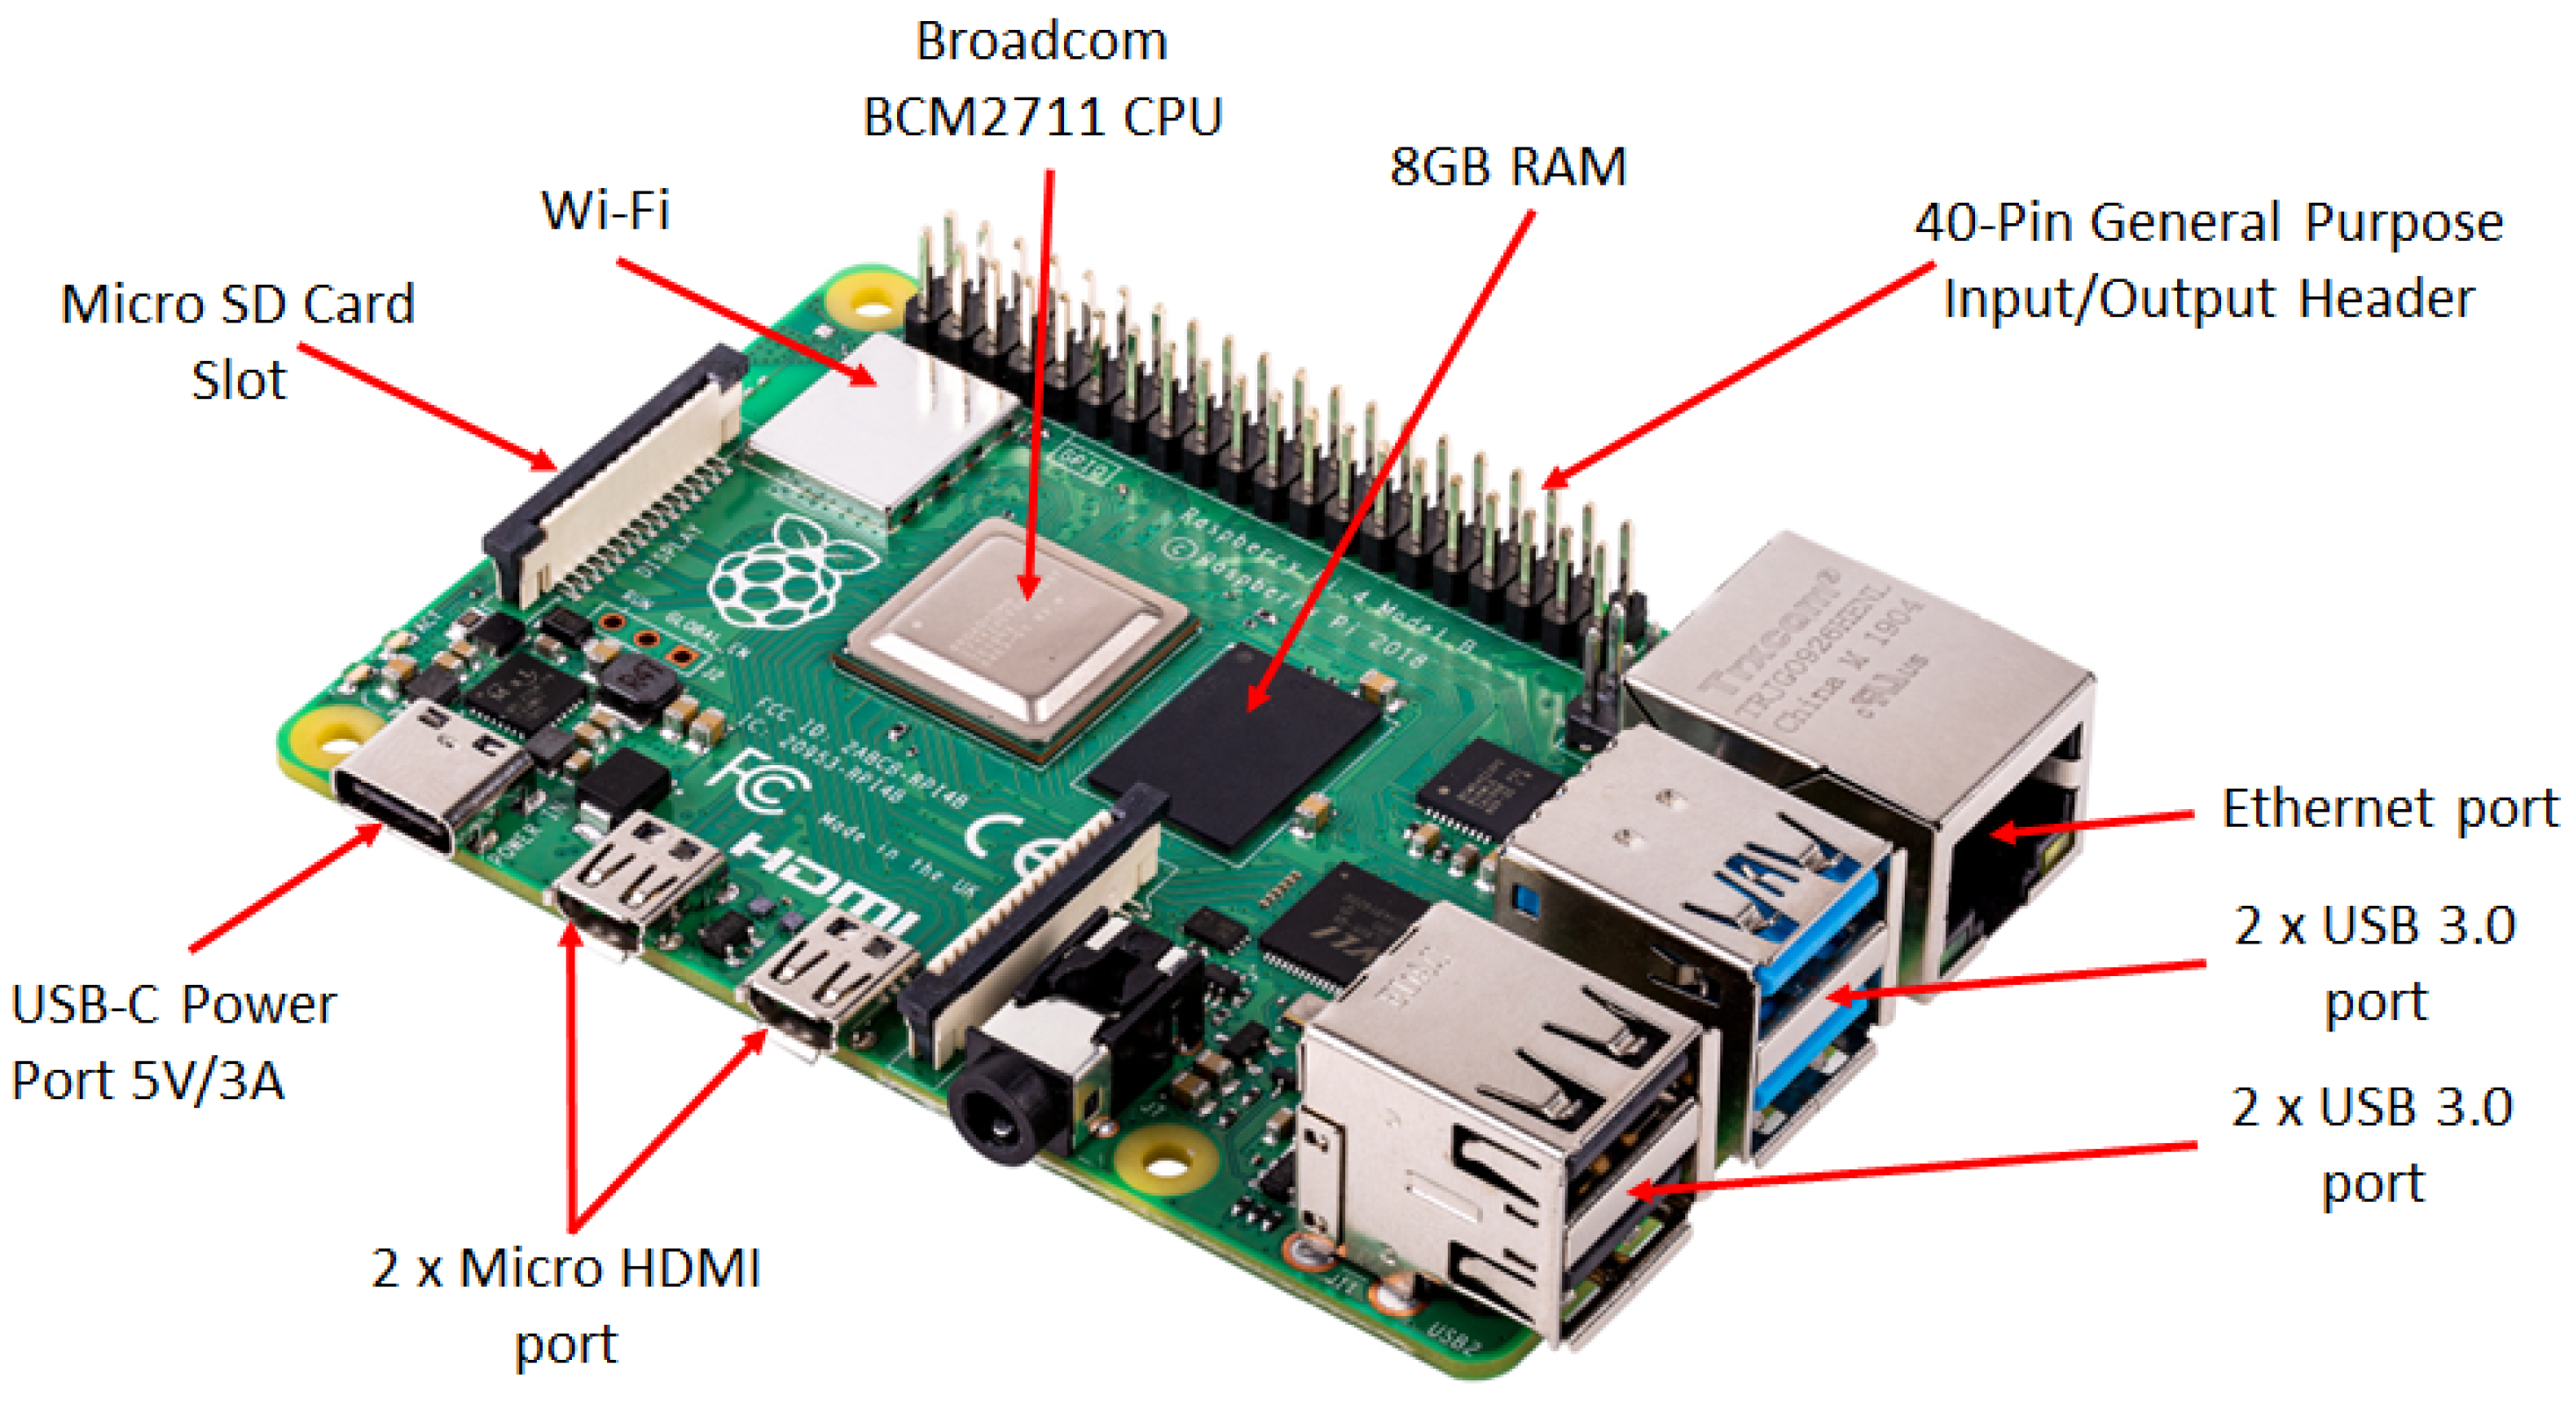
3.2.1. The Raspberry Pi

The Raspberry Pi, shown in Figure 4, is a programmable compact computer developed by the Raspberry Pi Foundation. It is widely used for various purposes, including home automation, robotics, etc.

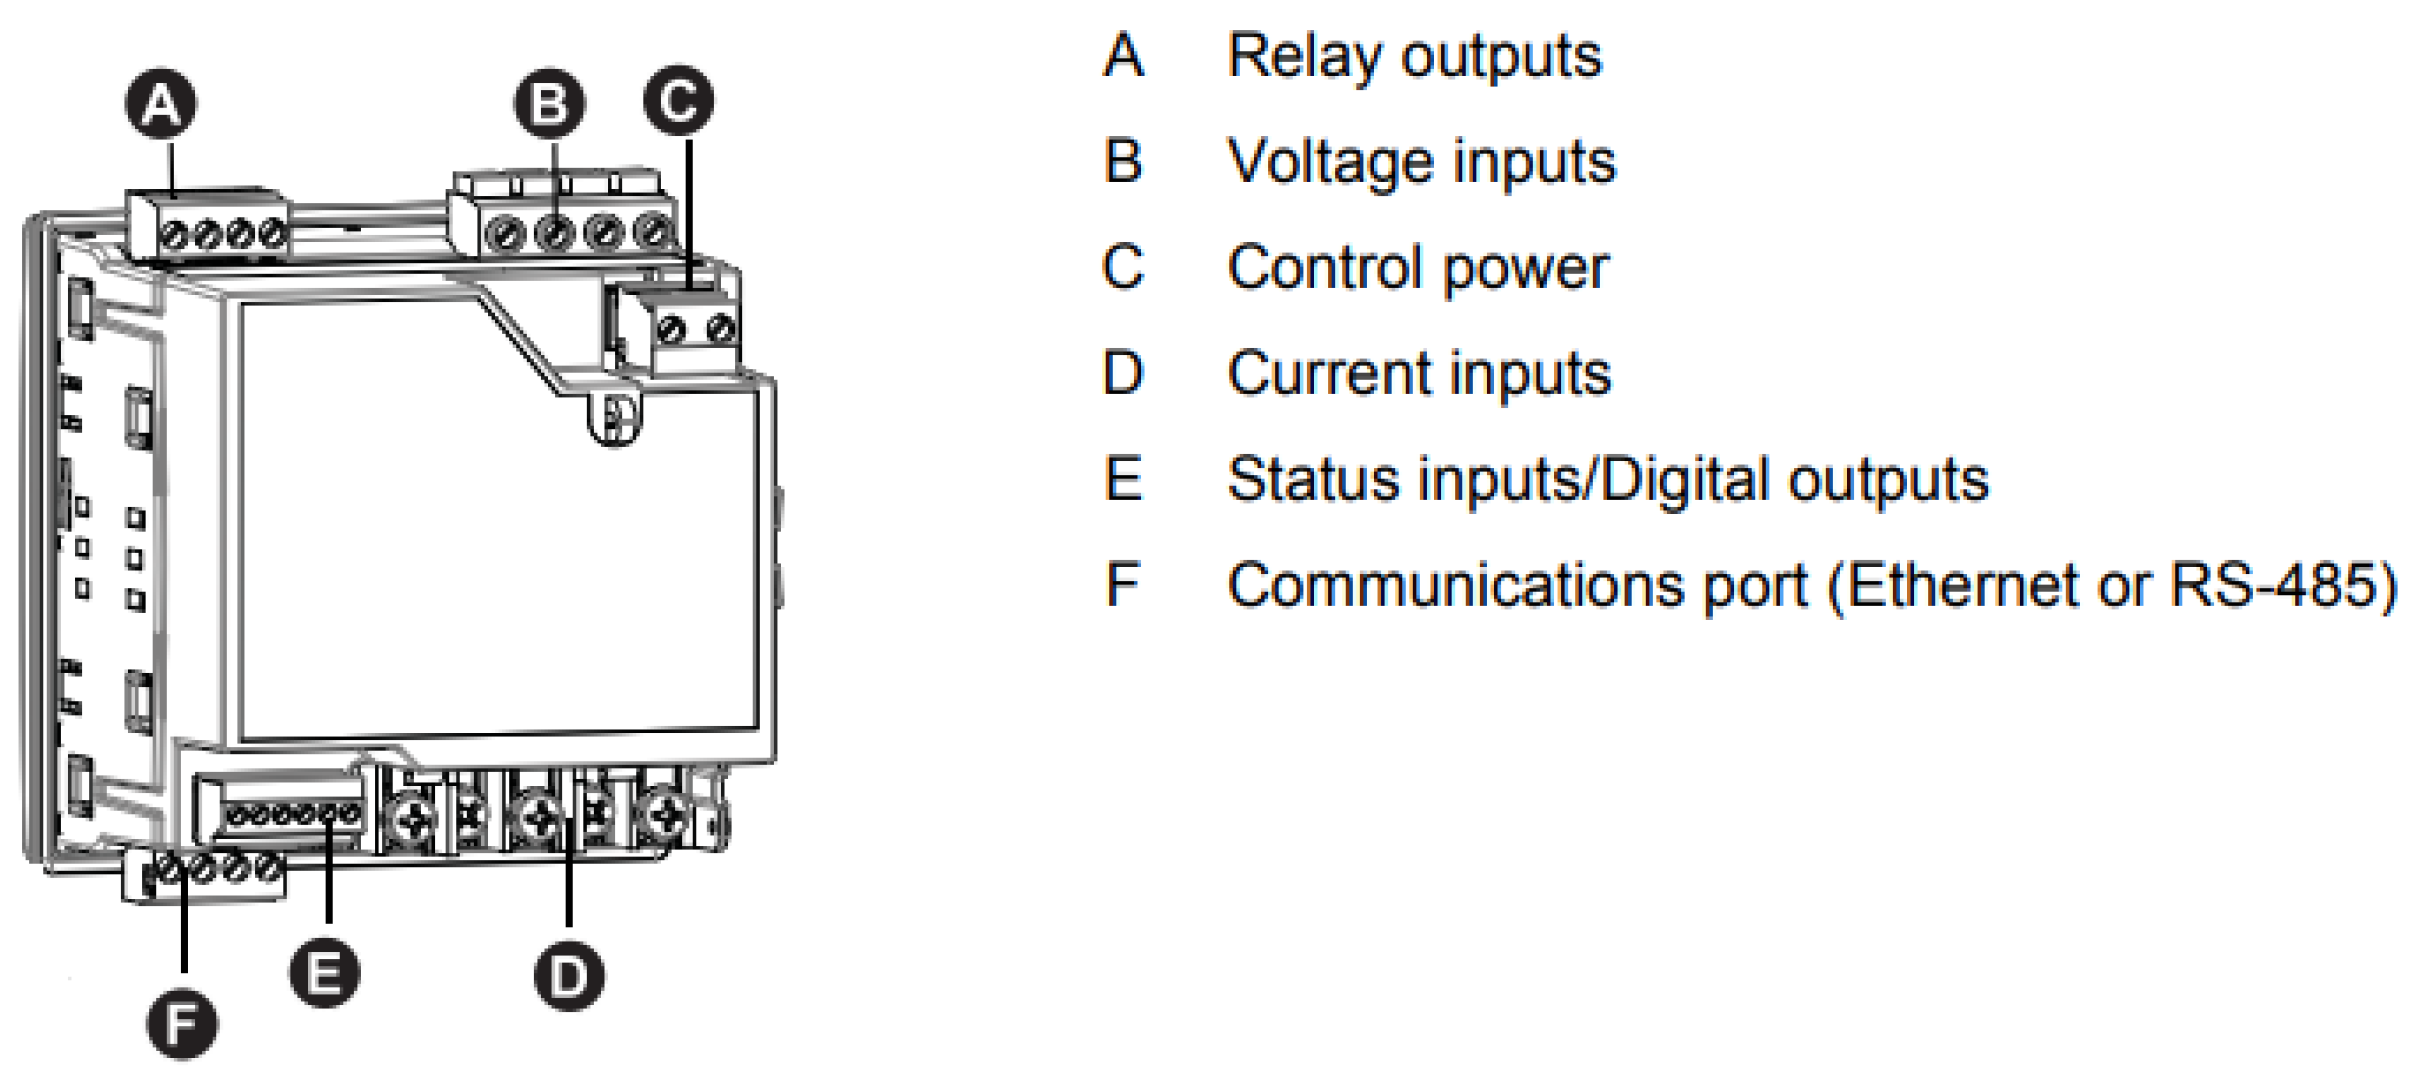
3.2.2. The Power Meter

Figure 5 displays the Schneider Powerlogic Meter, which serves as a three-phase power meter utilized for measuring the supply RMS voltages, currents, frequency and power. Moreover, the meter data can be accessed through the MODBUS protocol.

3.2.3. The Hybrid Inverter

Figure 6 shows the hybrid inverter, which serves as an integration interface connecting DC-generated solar power, the utility grid and battery storage. The hybrid inverter has the ability to identify supply interruptions in the utility grid and seamlessly switch to an alternative power source based on predefined internal settings of supply priority. Furthermore, the inverter can be controlled via serial communication to execute specific functions whenever needed. This communication employs the cyclic redundancy check (CRC) protocol, which ensures a high level of data integrity by performing error checks. The inverter has two operational modes: line mode and battery mode. In line mode, the inverter can function in bypass mode, directly supplying power to the load from the utility while also charging the battery via solar PV panels, as shown in Figure 7a. In cases where there are no solar PV panels, the battery will be charged by the utility, as illustrated in Figure 7b. In the battery mode, the load can be supplied either from solar PV, the battery or both sources simultaneously, as shown in Figure 7c,d. In the absence of solar PV, the load can only receive power from the battery. The laboratory simulation is conducted using Figure 7b,d since there is no solar PV connection to the inverter.

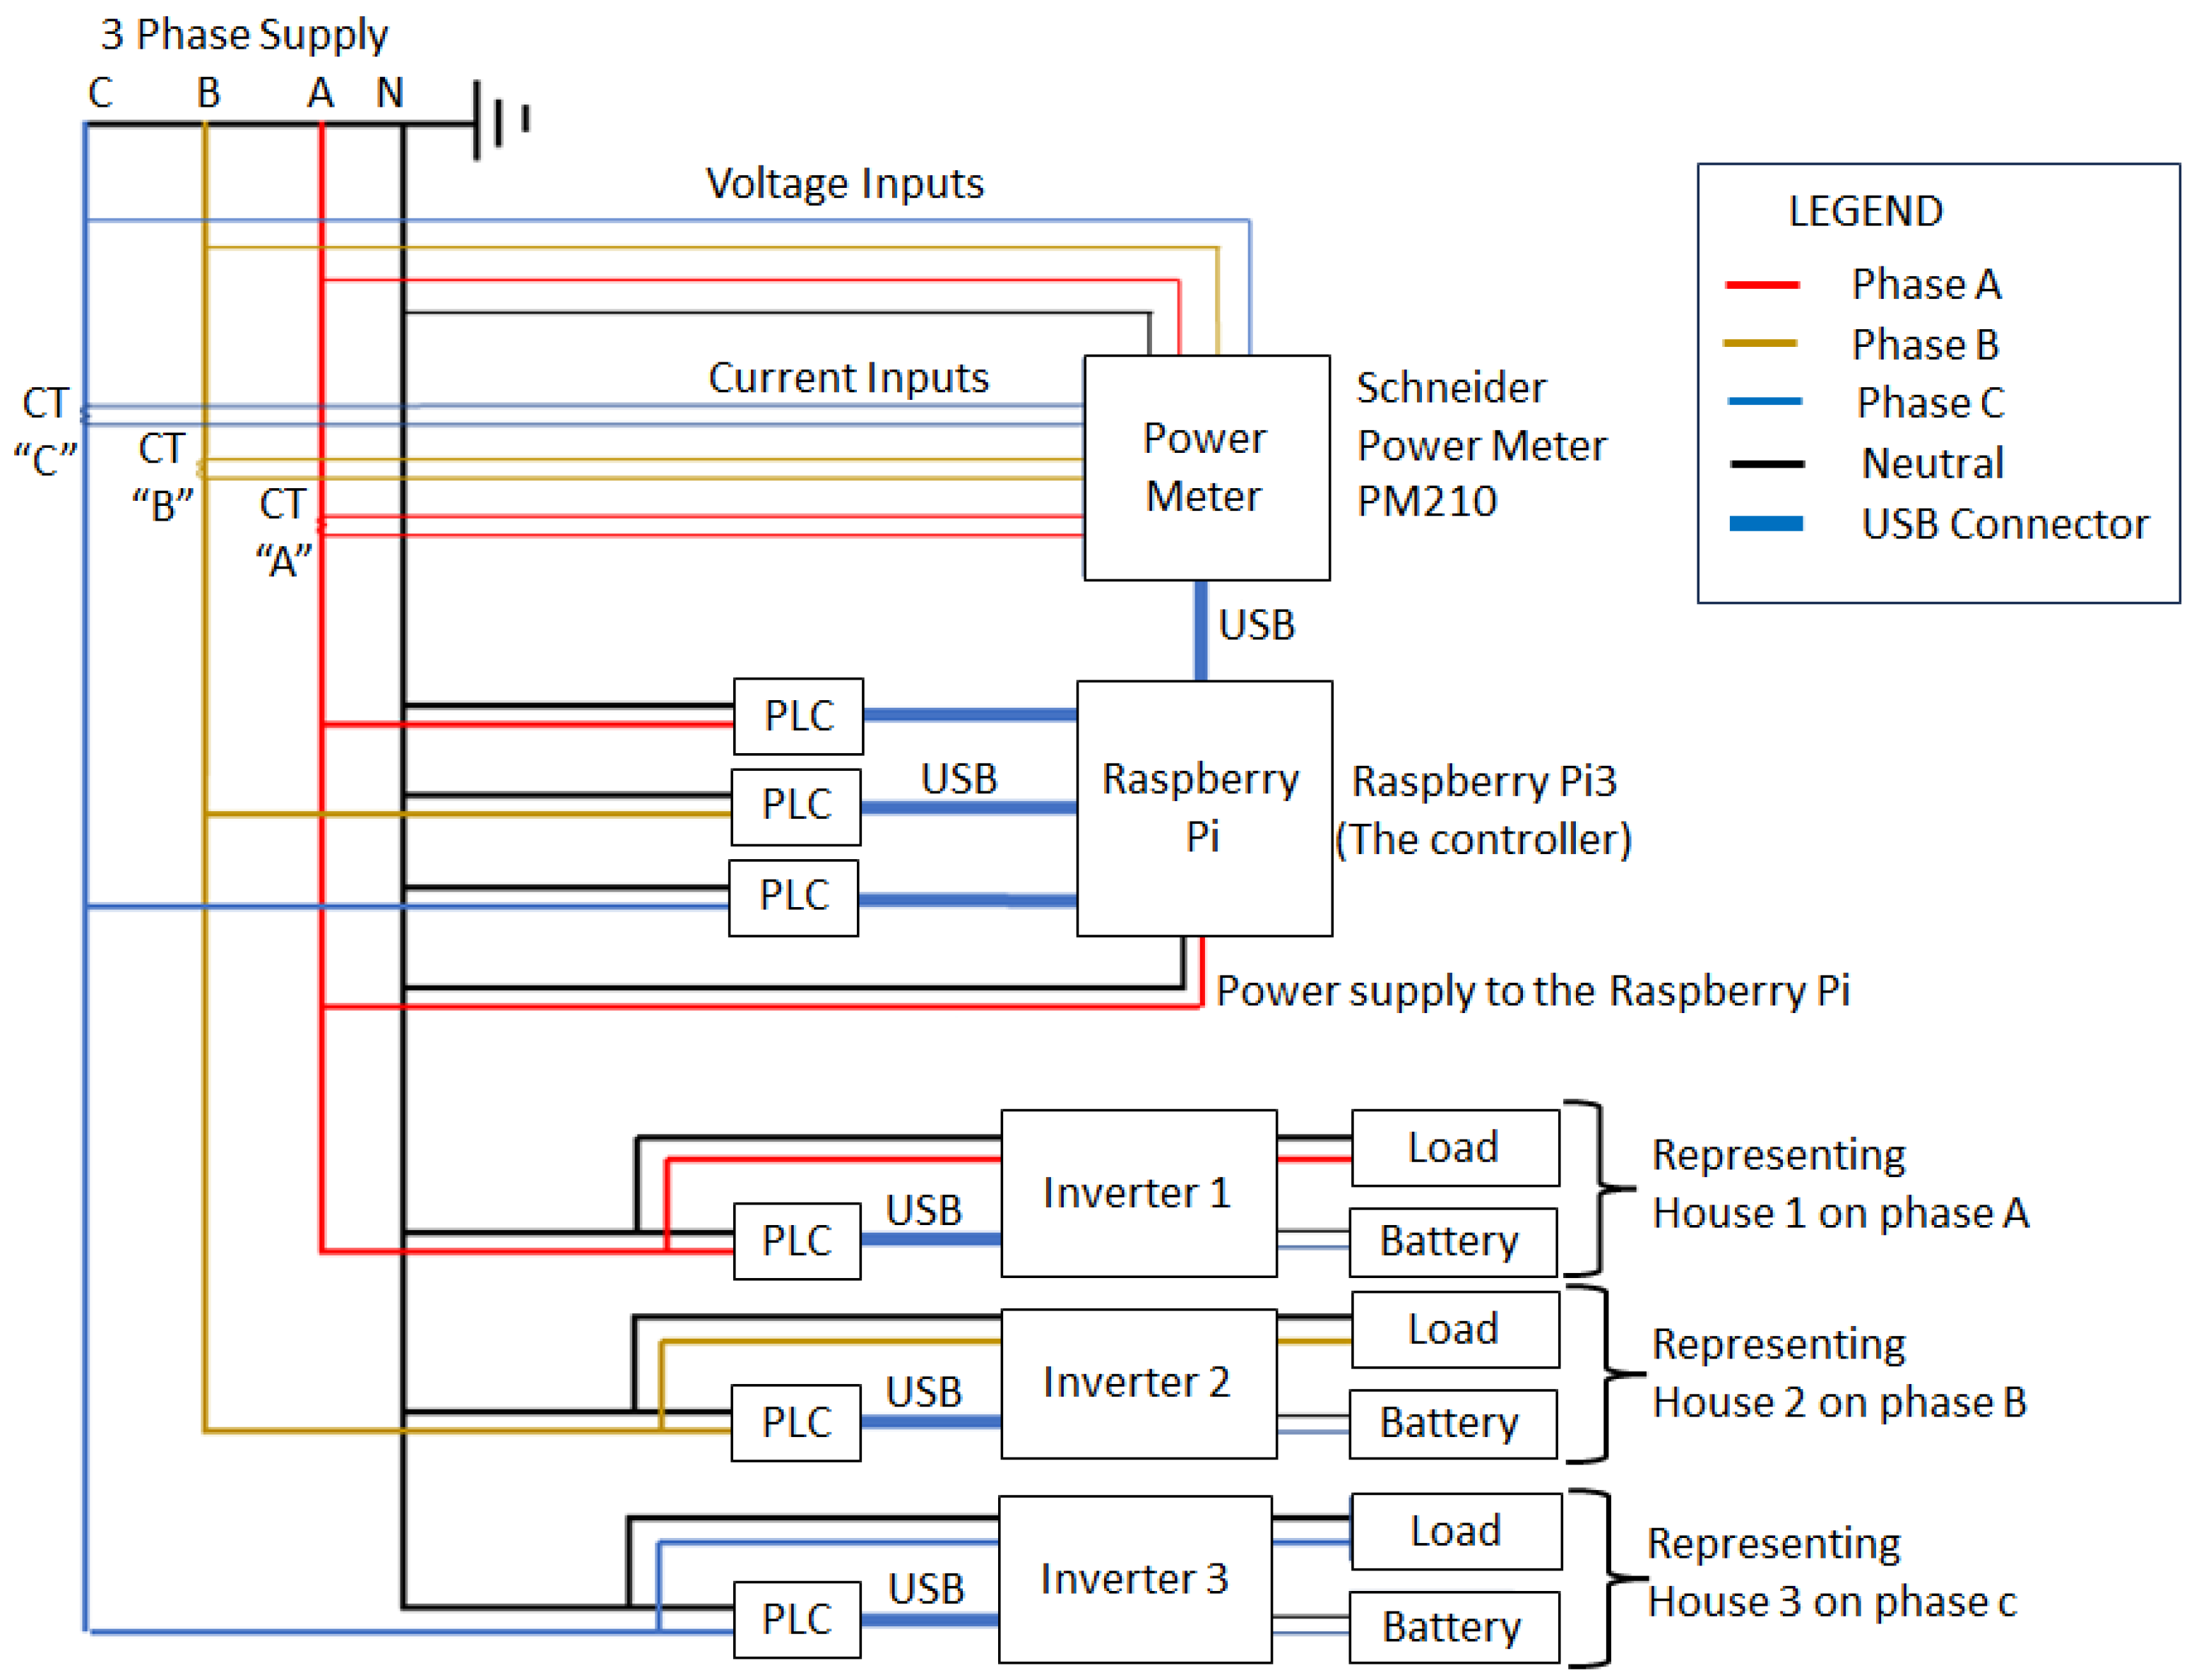
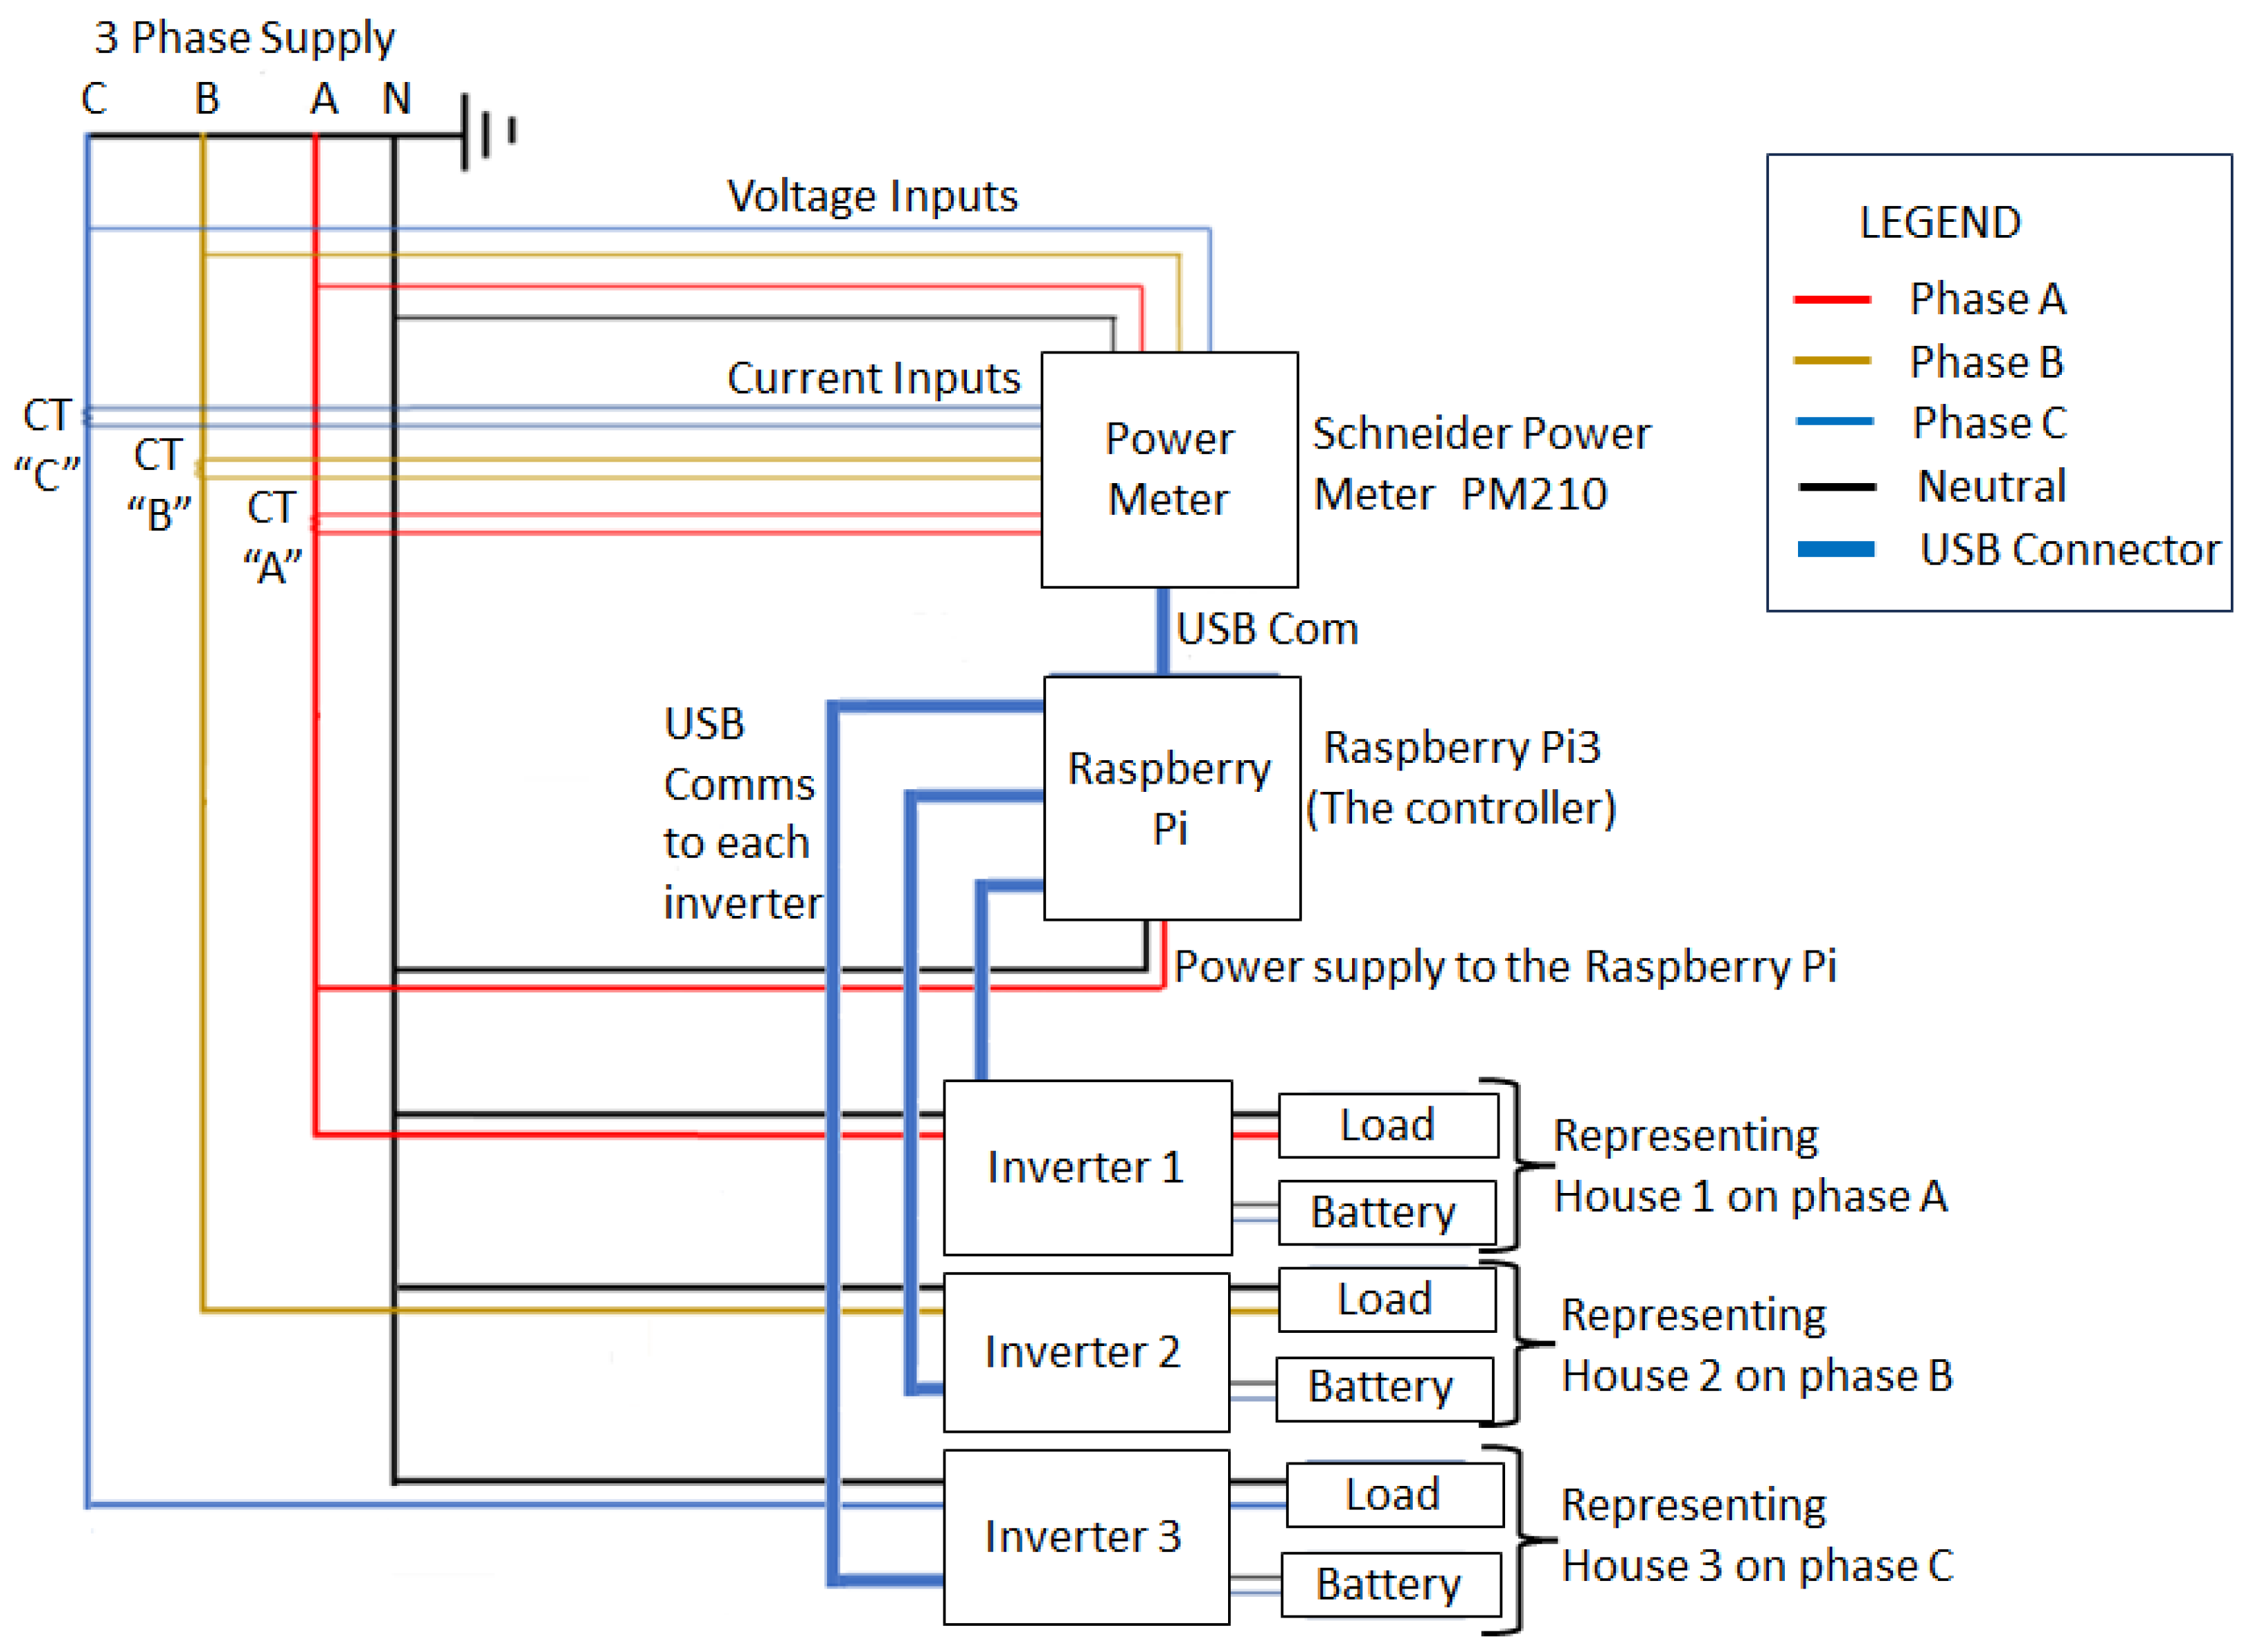
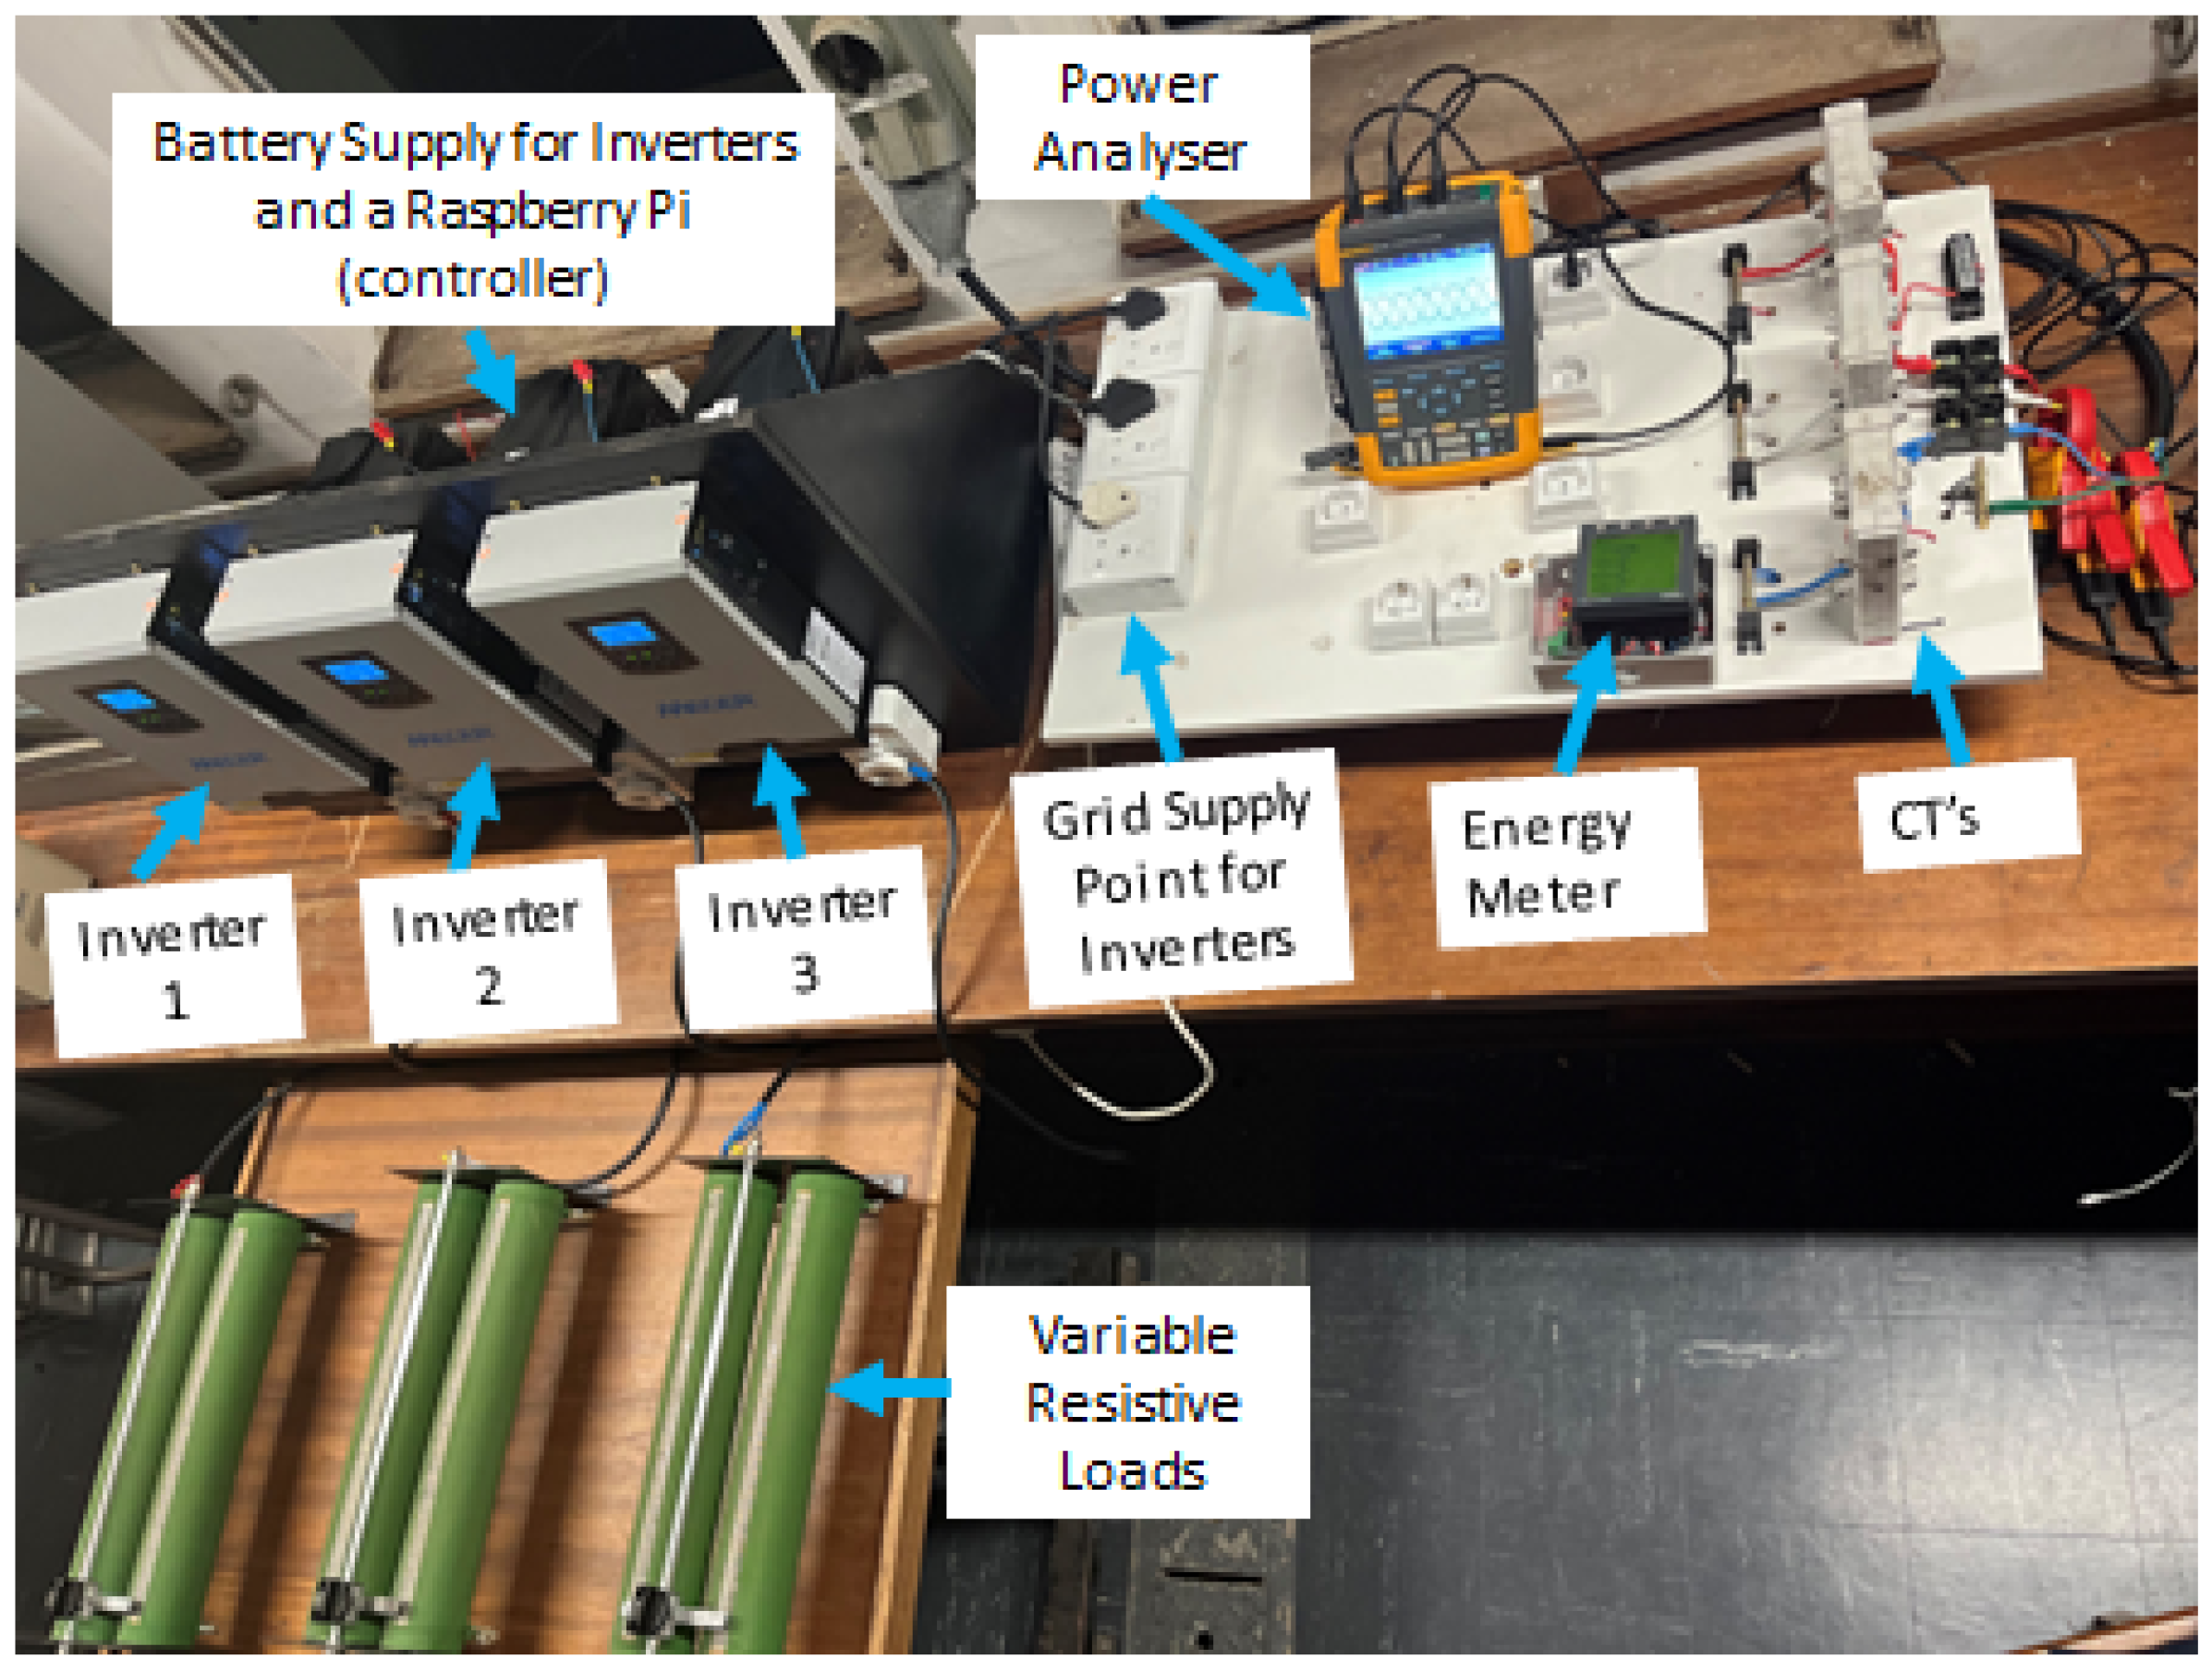
3.3. Laboratory Installation and Setup

The primary objective of the controller is to optimize the distribution of electricity across all three phases of the low-voltage system transformer, promoting balanced usage. In situations where multiple customers are connected to a single phase (red, white, or blue) of a three-phase transformer, the current drawn from the transformer tends to be unbalanced. To mitigate this unbalance, the recommended solution involves adjusting the operational mode of the inverter (utility, solar or battery) installed by the customer. The utility, solar or battery mode is a state of operation where the load is supplied through the inverter using the utility, PV or battery as the source of power, respectively.
Figure 8 illustrates a laboratory-based three-phase supply network with a line-to-line voltage of 400 V and a line-to-ground voltage of 220 V. This network consists of single-phase inverters, each rated at 1 kW, and a backup battery of 12 V DC, 100 Ah, supplying single-phase varying loads.
In practice, the controller will be positioned in close proximity to the transformer, monitoring and measuring the level of unbalance in the utility supply. It will then transmit a corresponding signal to the inverter, enabling individual customers to either increase or decrease their consumption or change the mode of operation in order to compensate for the unbalance. Although attaining a completely balanced supply may present challenges, the negative consequences of unbalance can result in significant costs for both the utility and its customers. Figure 9 illustrates a typical three-phase supply and single-phase customer configuration with a corresponding current vector diagram of a balanced system. In a balanced system, the magnitude of the neutral current is equal to zero or very close to zero. The current vectors for phases a, b and c are represented by I a , I b and I c in red, amber and blue, respectively.
The magnitude and phase angle of the neutral current are determined by the combined effect of the unbalanced three phases, as illustrated in Figure 10, Figure 11 and Figure 12. The magnitude and the phase angle of the neutral current in an unbalanced system are determined using
I neutral = i = 1 3 ( I phase i · cos ( θ i ) ) 2 + i = 1 3 ( I phase i · sin ( θ i ) ) 2
θ neutral = arctan i = 1 3 I phase i · cos ( θ i ) i = 1 3 I phase i · sin ( θ i )
Figure 10 illustrates the phasor diagram, with the red phase having a smaller magnitude than the other two phases, along with the resultant neutral current. Figure 11 illustrates the phasor diagram, with the blue phase having a smaller magnitude than the other two phases, along with the resultant neutral current. Figure 12 illustrates the phasor diagram, with the yellow phase having a smaller magnitude than the other two phases, along with the corresponding result of a neutral current.
A laboratory setup was designed, built and tested to replicate a real-world scenario of the utility low-voltage network featuring small-scale embedded generators (SSEGs), as shown in Figure 13. The figure shows a three-phase power supply with a phase-to-phase voltage of 400 V and a phase-to-ground voltage of 220 V, representing the power utility supplying the LV network. The batteries connected to each single-phase inverter (1 kW) are lead–acid types of 12 V DC and 100 AH each. To measure currents on each phase, three current transformers were incorporated into the setup. Additionally, an energy meter connected to the transformer was configured to record and store phase currents that supply individual single-phase loads. The meter data are extracted through the MODBUS communication protocol and saved to a Raspberry Pi4 microcontroller. The Raspberry Pi4 microcontroller is responsible for regulating inverters 1, 2 and 3 in the event of an unbalance beyond acceptable levels. The controller communicates with the inverters via the CRC protocol. This enables remote adjustments to their mode of operation and settings, with the aim of achieving a more balanced utility supply. Experimental results were then verified using a power analyzer to validate the measurements obtained from the energy meter and the inverters.
In a typical South African low-voltage transformer zone of a three-phase system, the number of single-phase customers can range from 15 to 30. This depends on the size of the transformer, which usually varies between 50 kVA and 100 kVA, respectively. Some installations may even have larger transformers exceeding 100 kVA, serving a higher number of customers. To illustrate the concept effectively, three single-phase inverters were installed to represent individual single-phase customers on each phase. In designing a controller, it is important to understand the dynamic behavior of the system to be controlled. In this case, it is important to understand the aggregated load dynamics of residential customers. The inherent time delay within the system is in the range of 20 s. The residential load profile remains relatively stable over short durations, such as one minute, without significant changes. According to [25], residential load models are sampled at a rate between 1 min and 1 h. In [26,27,28], load profiles sampled between 30 min and 1 h are shown. According to [29,30], the sampling time of residential loads is dependent on variables such as the number of customers and after diversity maximum demand (ADMD). These studies demonstrate that a small subset of customers, typically fewer than five, necessitates high-frequency sampling of approximately every one minute. Conversely, a larger number of customers, ranging from 40 to 60, can have the required aggregated load dynamics captured with lower-frequency sampling of about 60 min. The controller should be at least four times faster than the process time constant. The system is designed to be localized, which minimizes communication delays. As mentioned earlier, the inherent time delays within the system fall within the 20 s range. Consequently, a sampling rate of 30 s is sufficient for accurately controlling a residential load profile with a 5 min sampling interval, effectively managing a few houses. The CRC communication protocol is used to ensure that there is a handshake between the controlled device (hybrid inverter) and the controller (Raspberry Pi).
A limitation of the model is that it emulates only three inverters (one per phase), whereas in a real transformer zone, there can be many customers and inverters, ranging from 15 to 30, depending on the size of the transformer. In a real network, the controller will be monitoring and controlling several inverters per phase to achieve balanced load flow. Nevertheless, the laboratory simulation results effectively highlight the controller’s functionality.
Table 2 presents the typical parameters measured in an inverter. These parameters are readily accessible and controllable at any given moment.
The power analyzer records the voltage and the current waveforms as the system conditions change. Figure 14, Figure 15, Figure 16, Figure 17, Figure 18, Figure 19, Figure 20, Figure 21, Figure 22, Figure 23, Figure 24, Figure 25, Figure 26, Figure 27 and Figure 28 illustrate snapshots of the system under various network conditions.
Figure 14 shows a three-phase supply voltage of a balanced system. The voltages and their corresponding currents in individual phases are in phase due to the resistive nature of the corresponding loads. Figure 15 shows the supply currents under a balanced system where all three phases are supplying their respective loads from the utility and without charging their respective batteries. The resultant neutral current with respect to phase voltage A is zero, as shown in Figure 16.
When the supply is charging the batteries on each phase, the supply current deviates from linearity, giving rise to harmonics, and consequently, the neutral current of a balanced system becomes non-zero.
Figure 17 illustrates the nonlinear characteristic of the supply current of phase A, with respect to its corresponding voltage while the batteries are being charged. The same non-linear behavior is observed in the other phases during the charging conditions of individual phases. The resulting neutral current, with respect to the voltage of phase A when only phase A batteries are charging, is given in Figure 18.
Figure 19, Figure 20, Figure 21 and Figure 22 show the supply current during battery charging as well as the corresponding neutral current of individual phases B and C. For ease of analysis and interpretation of results, all currents are plotted against the same phase voltage A reference.
Figure 23 illustrates the supply currents during an unbalanced system condition, where two phases are simultaneously providing power to their respective loads and charging their corresponding batteries from the utility. This is while the loads on the other phase are being fed from the corresponding battery. The resultant current for this condition is shown in Figure 24. In addition, Figure 25 shows the level of harmonics generated due to the non-linear behavior of the system when the batteries are being charged by the main supply.
Figure 26 shows non-linear supply currents when all three phases are charging their corresponding batteries concurrently. These non-linear currents give rise to neutral currents and introduce harmonics into the system. The neutral current and harmonic levels, which occur when all three phases are charging batteries simultaneously, are illustrated in Figure 27 and Figure 28, respectively. In comparison to the previous situation involving the charging of batteries of two phases, there is a significant reduction in the magnitudes of both the neutral current and the harmonic levels. Therefore, the system performs better when all three phases are charging their corresponding batteries simultaneously. If the system is balanced but includes nonlinear loads, residual current on the neutral wire may persist, and steps should be taken to address it. The presence of current on the neutral wire does not inherently imply system imbalance in terms of real power; it could be attributed to factors like nonlinear loads and an unbalanced power factor related to reactive power.

3.4. Methodology to Estimate Level of Improvement Due to the Implementation of the Utility Controller

To demonstrate the effectiveness of controlling the customer inverter, the following approach is used:
  • Establishment of the problems that are created by the normal operation: uncontrolled inverter system.
  • Identification of control parameters that are more effective for ensuring stability and high performance of the network.
  • Design of a controller for the lab system.
  • Evaluation of the effectiveness of the controller.

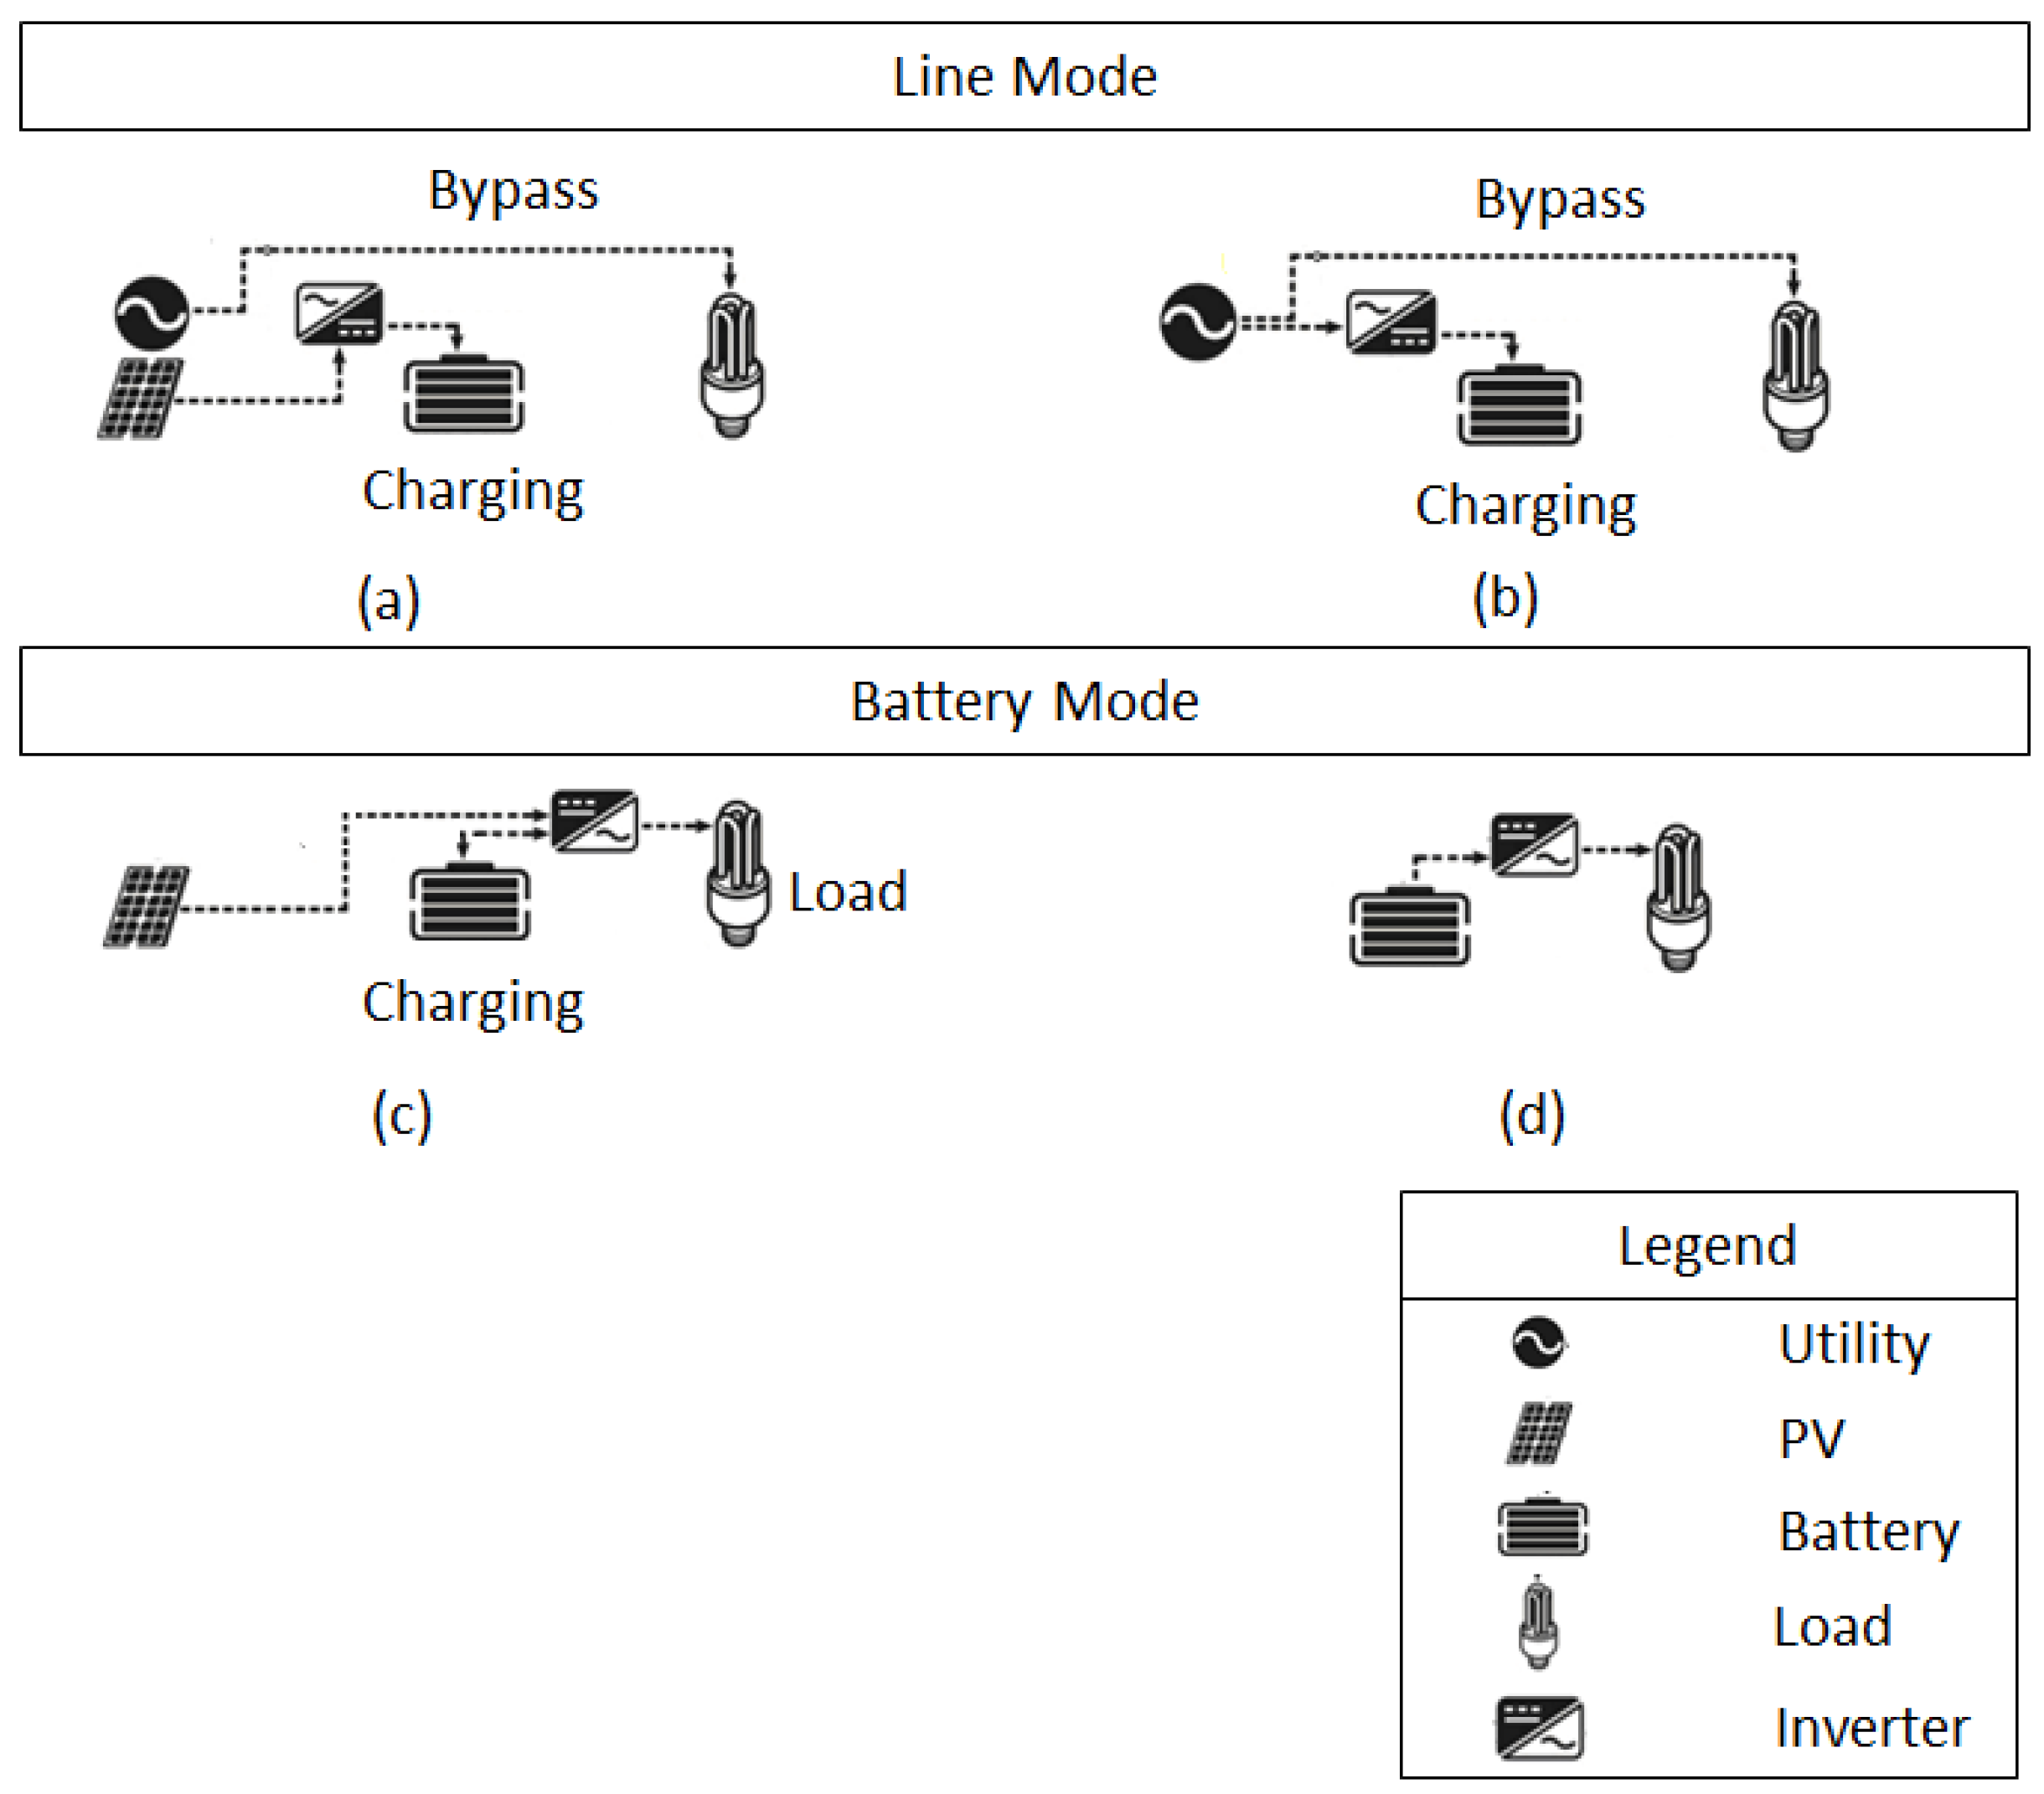
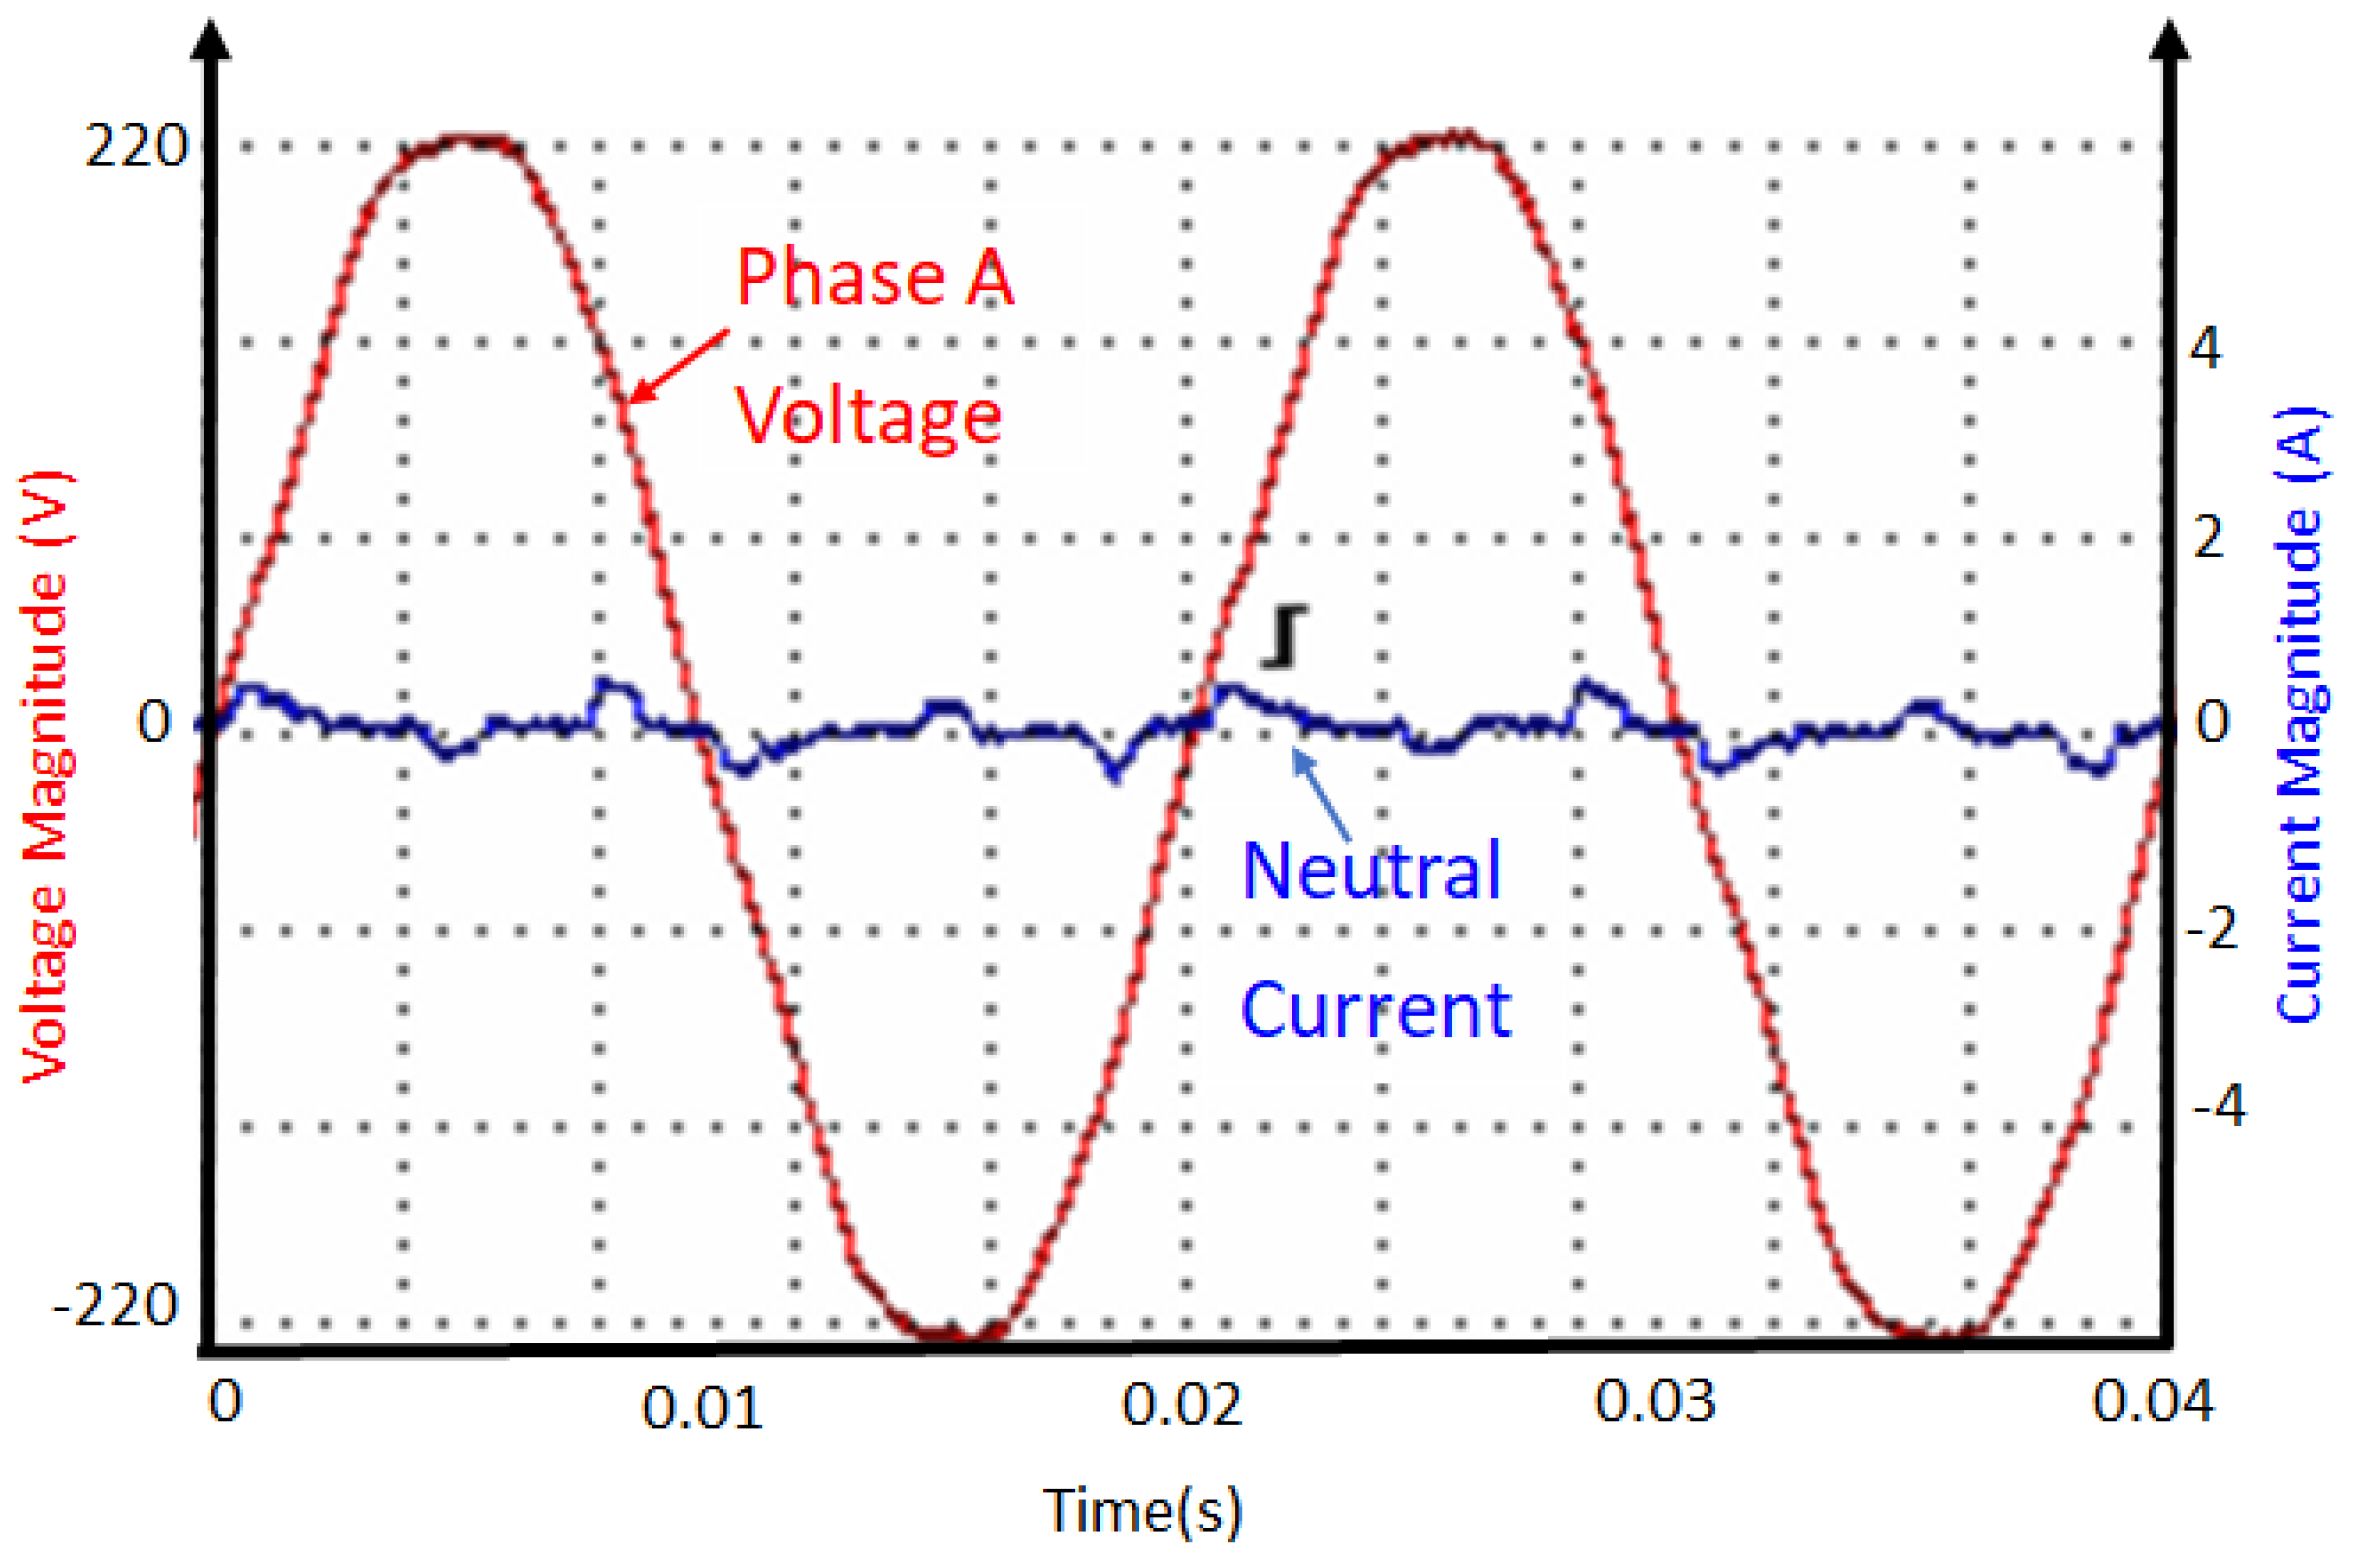
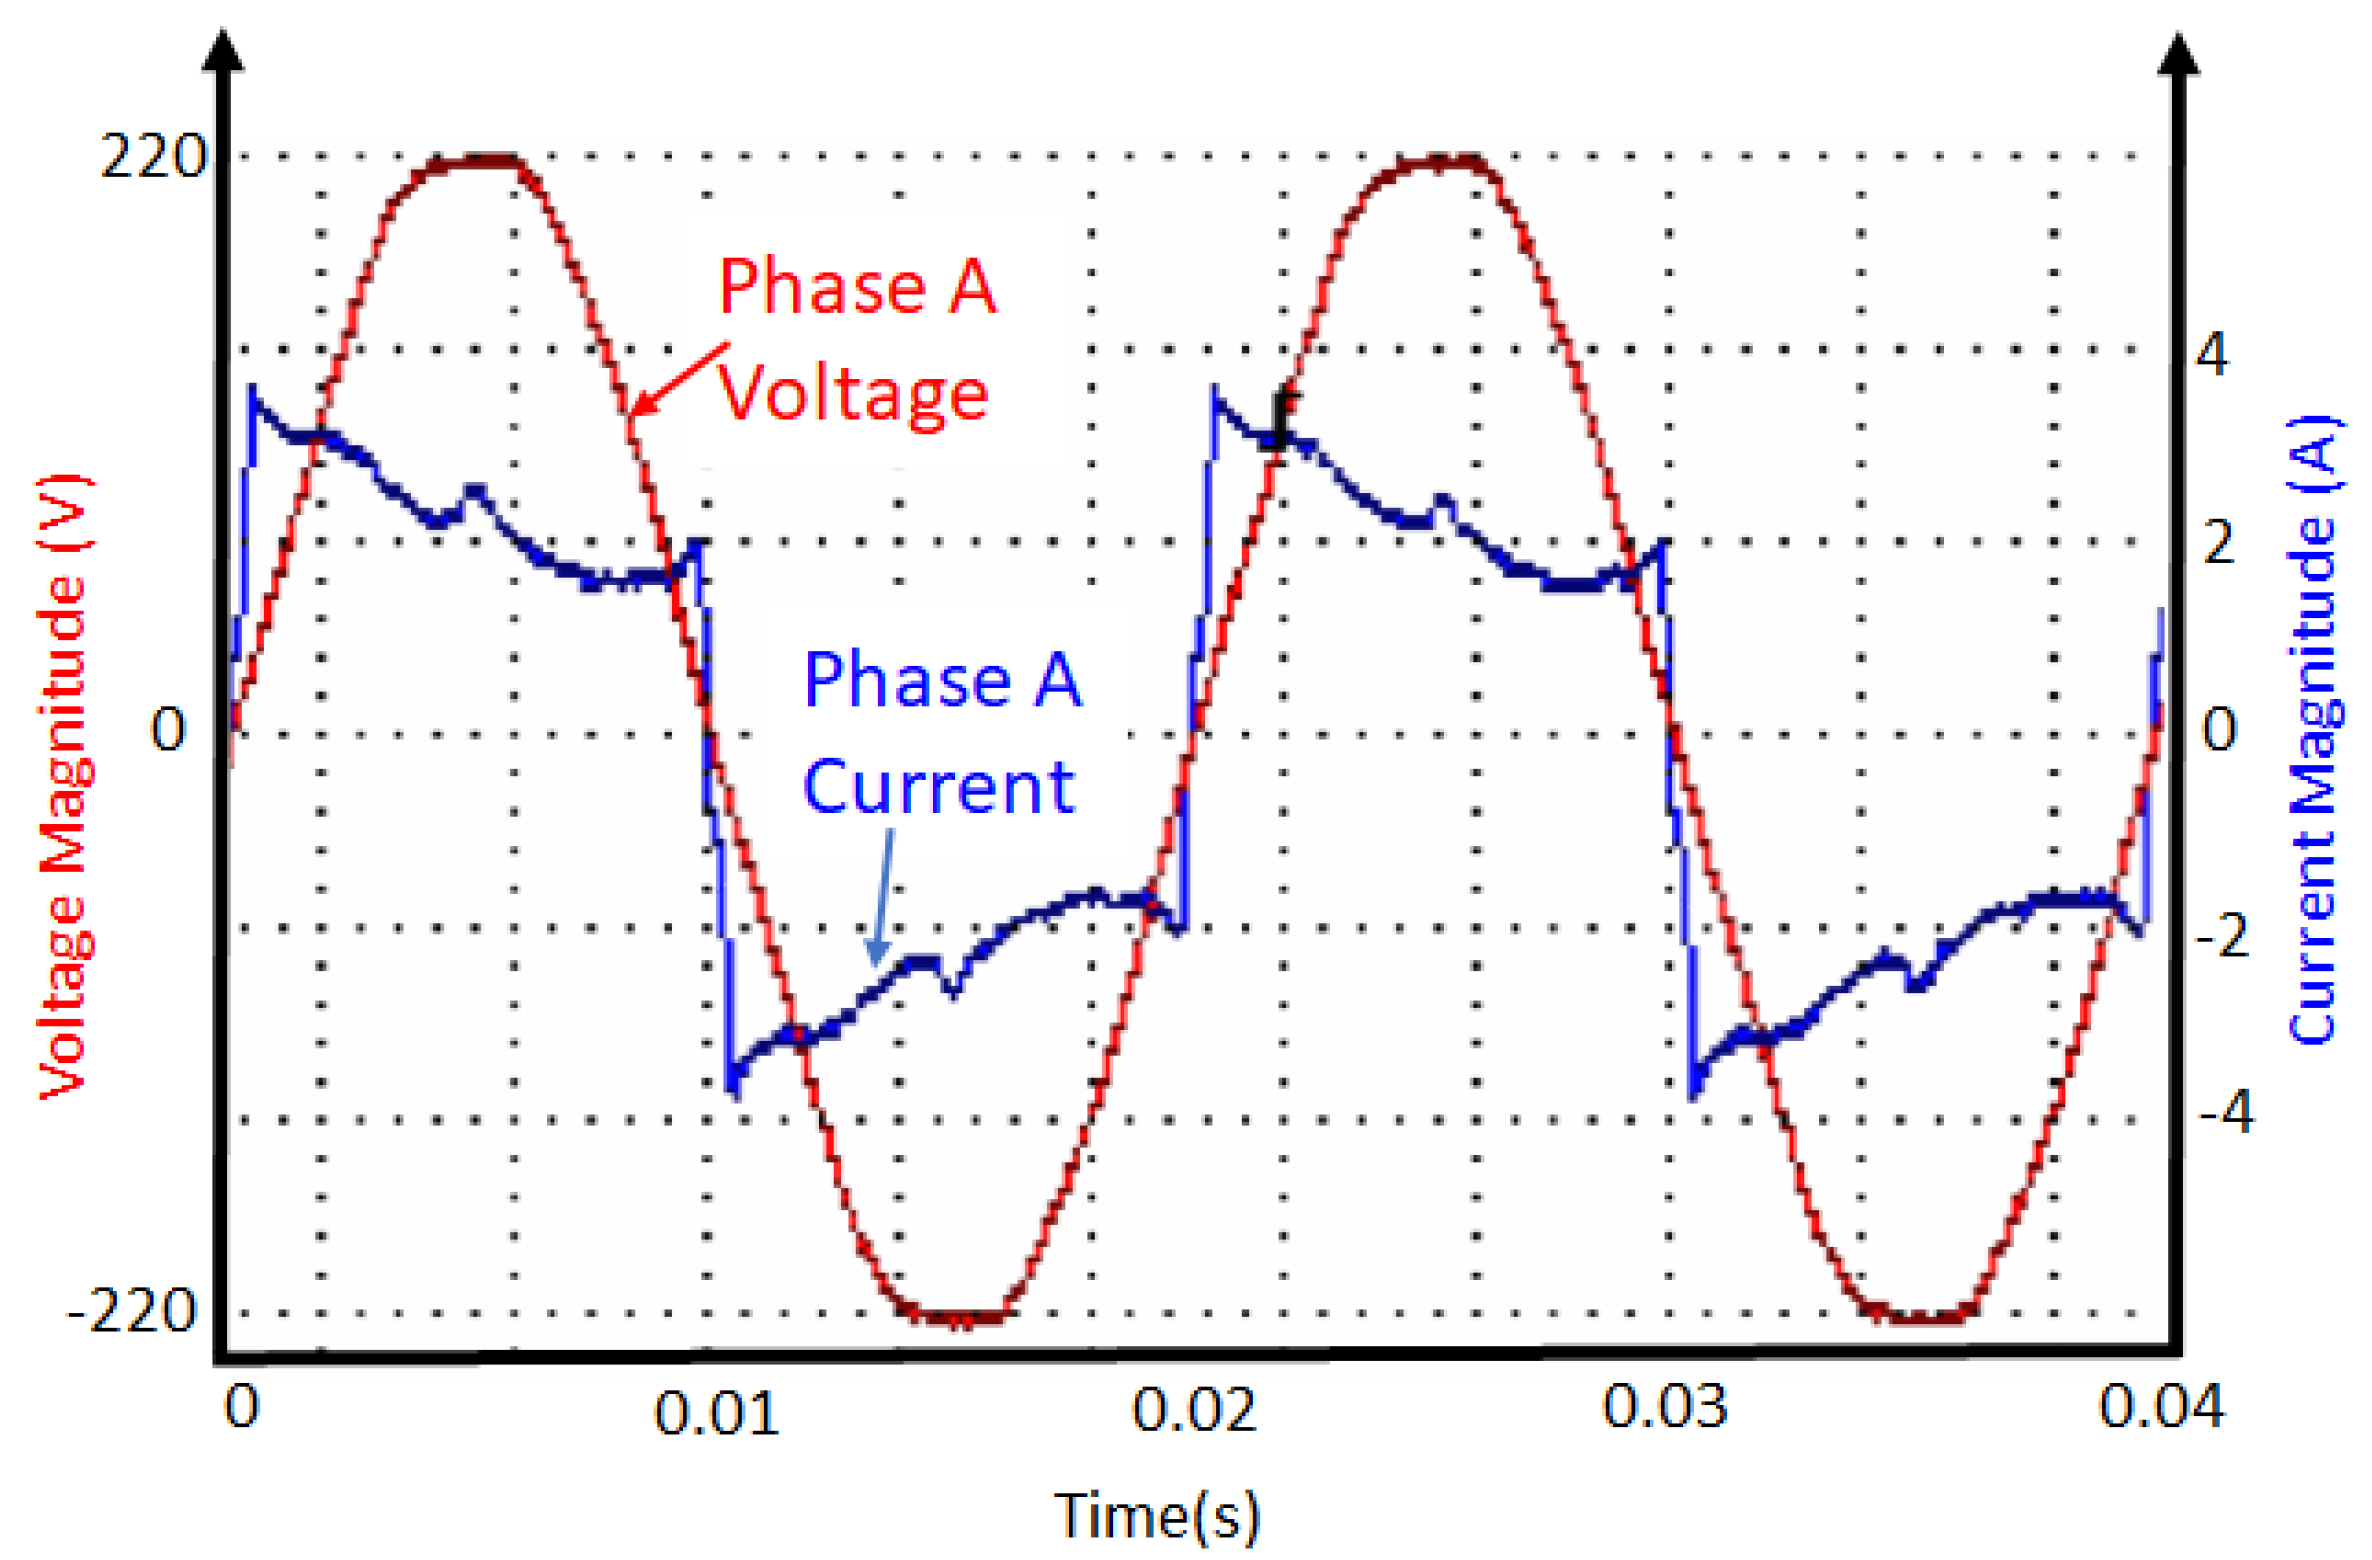
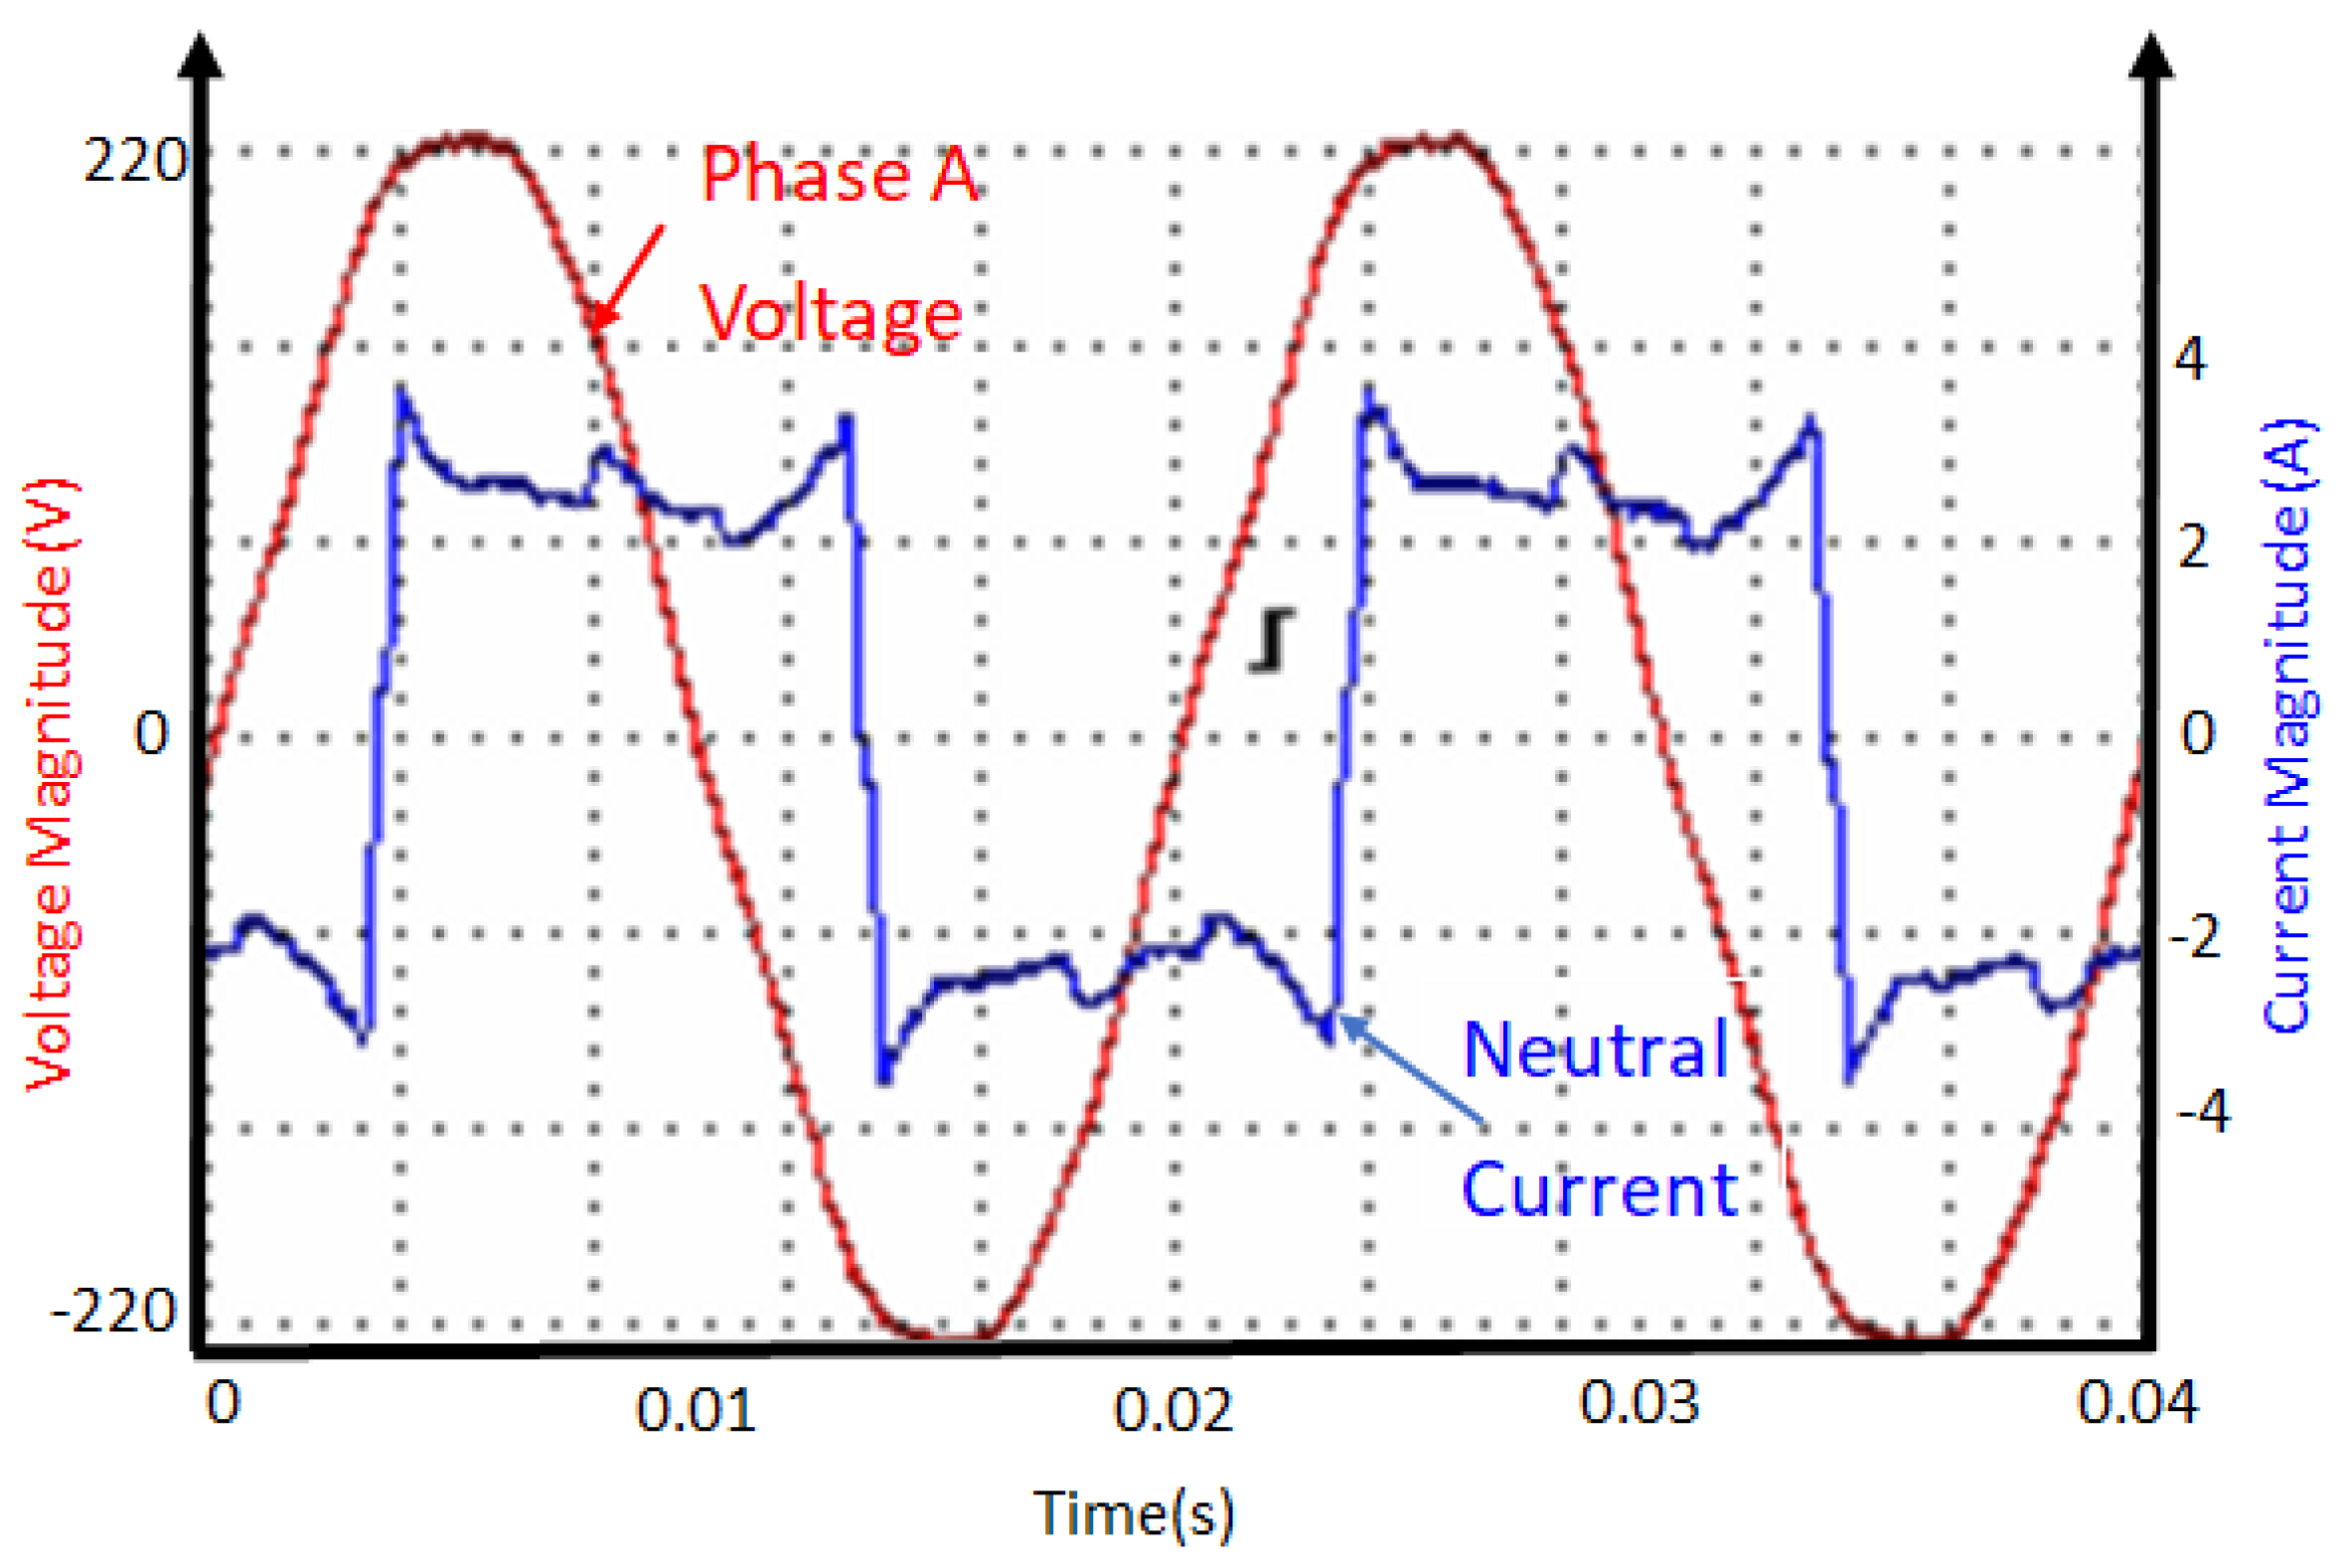
3.5. Base-Case Scenario: Uncontrolled System

A base-case scenario is an uncontrolled system whereby the individual inverter changes its mode of operation based on its settings. There are three modes of operation that the hybrid inverter has:
  • The AC output load is supplied directly from the utility.
  • The AC output load is supplied directly from the PV panels. This mode is not utilized in this study.
  • The AC output load is supplied directly from the battery.
The relationship between various parameters of the inverter is demonstrated in Figure 29, Figure 30 and Figure 31. In Figure 29, when the inverter switches its operation mode from the utility supply to the battery supply, the discharge current of the battery aligns with the demand of the AC output load. In other words, if the AC output load demand increases, the battery discharge current will also increase proportionally. Conversely, the battery capacity will decrease proportionately.
Figure 30 shows a relationship between the battery voltage and the battery capacity when the inverter is in battery supply mode. As the battery capacity decreases, the voltage of the battery also drops until it becomes lower than the battery recharge voltage setting of the inverter. This voltage level triggers a transition in the inverter operation mode from battery power to using the utility supply. Once the inverter switches from battery to utility mode, the battery starts charging while the AC output load is simultaneously powered by the utility supply.
Figure 31 illustrates the variation in utility supply current as each inverter transitions between different operational modes. These changes automatically occur based on the internal settings of individual inverters. From intervals one to five, all three inverters supply AC output loads from the utility supply, resulting in a balanced supply. At interval six, one inverter switches from the utility to the battery supply mode while the other two inverters continue to operate in the utility supply mode, resulting in an unbalanced supply. At interval seven, the second inverter also transitions to the battery supply mode, leaving only one inverter operating in the utility supply mode and also resulting in an unbalanced supply.
In the absence of control over the individual phase inverters on the network, they autonomously switch their operation modes based on individual settings. As a result, the utility supply becomes unbalanced, which can potentially lead to damage to the network and other electrical devices connected to it.

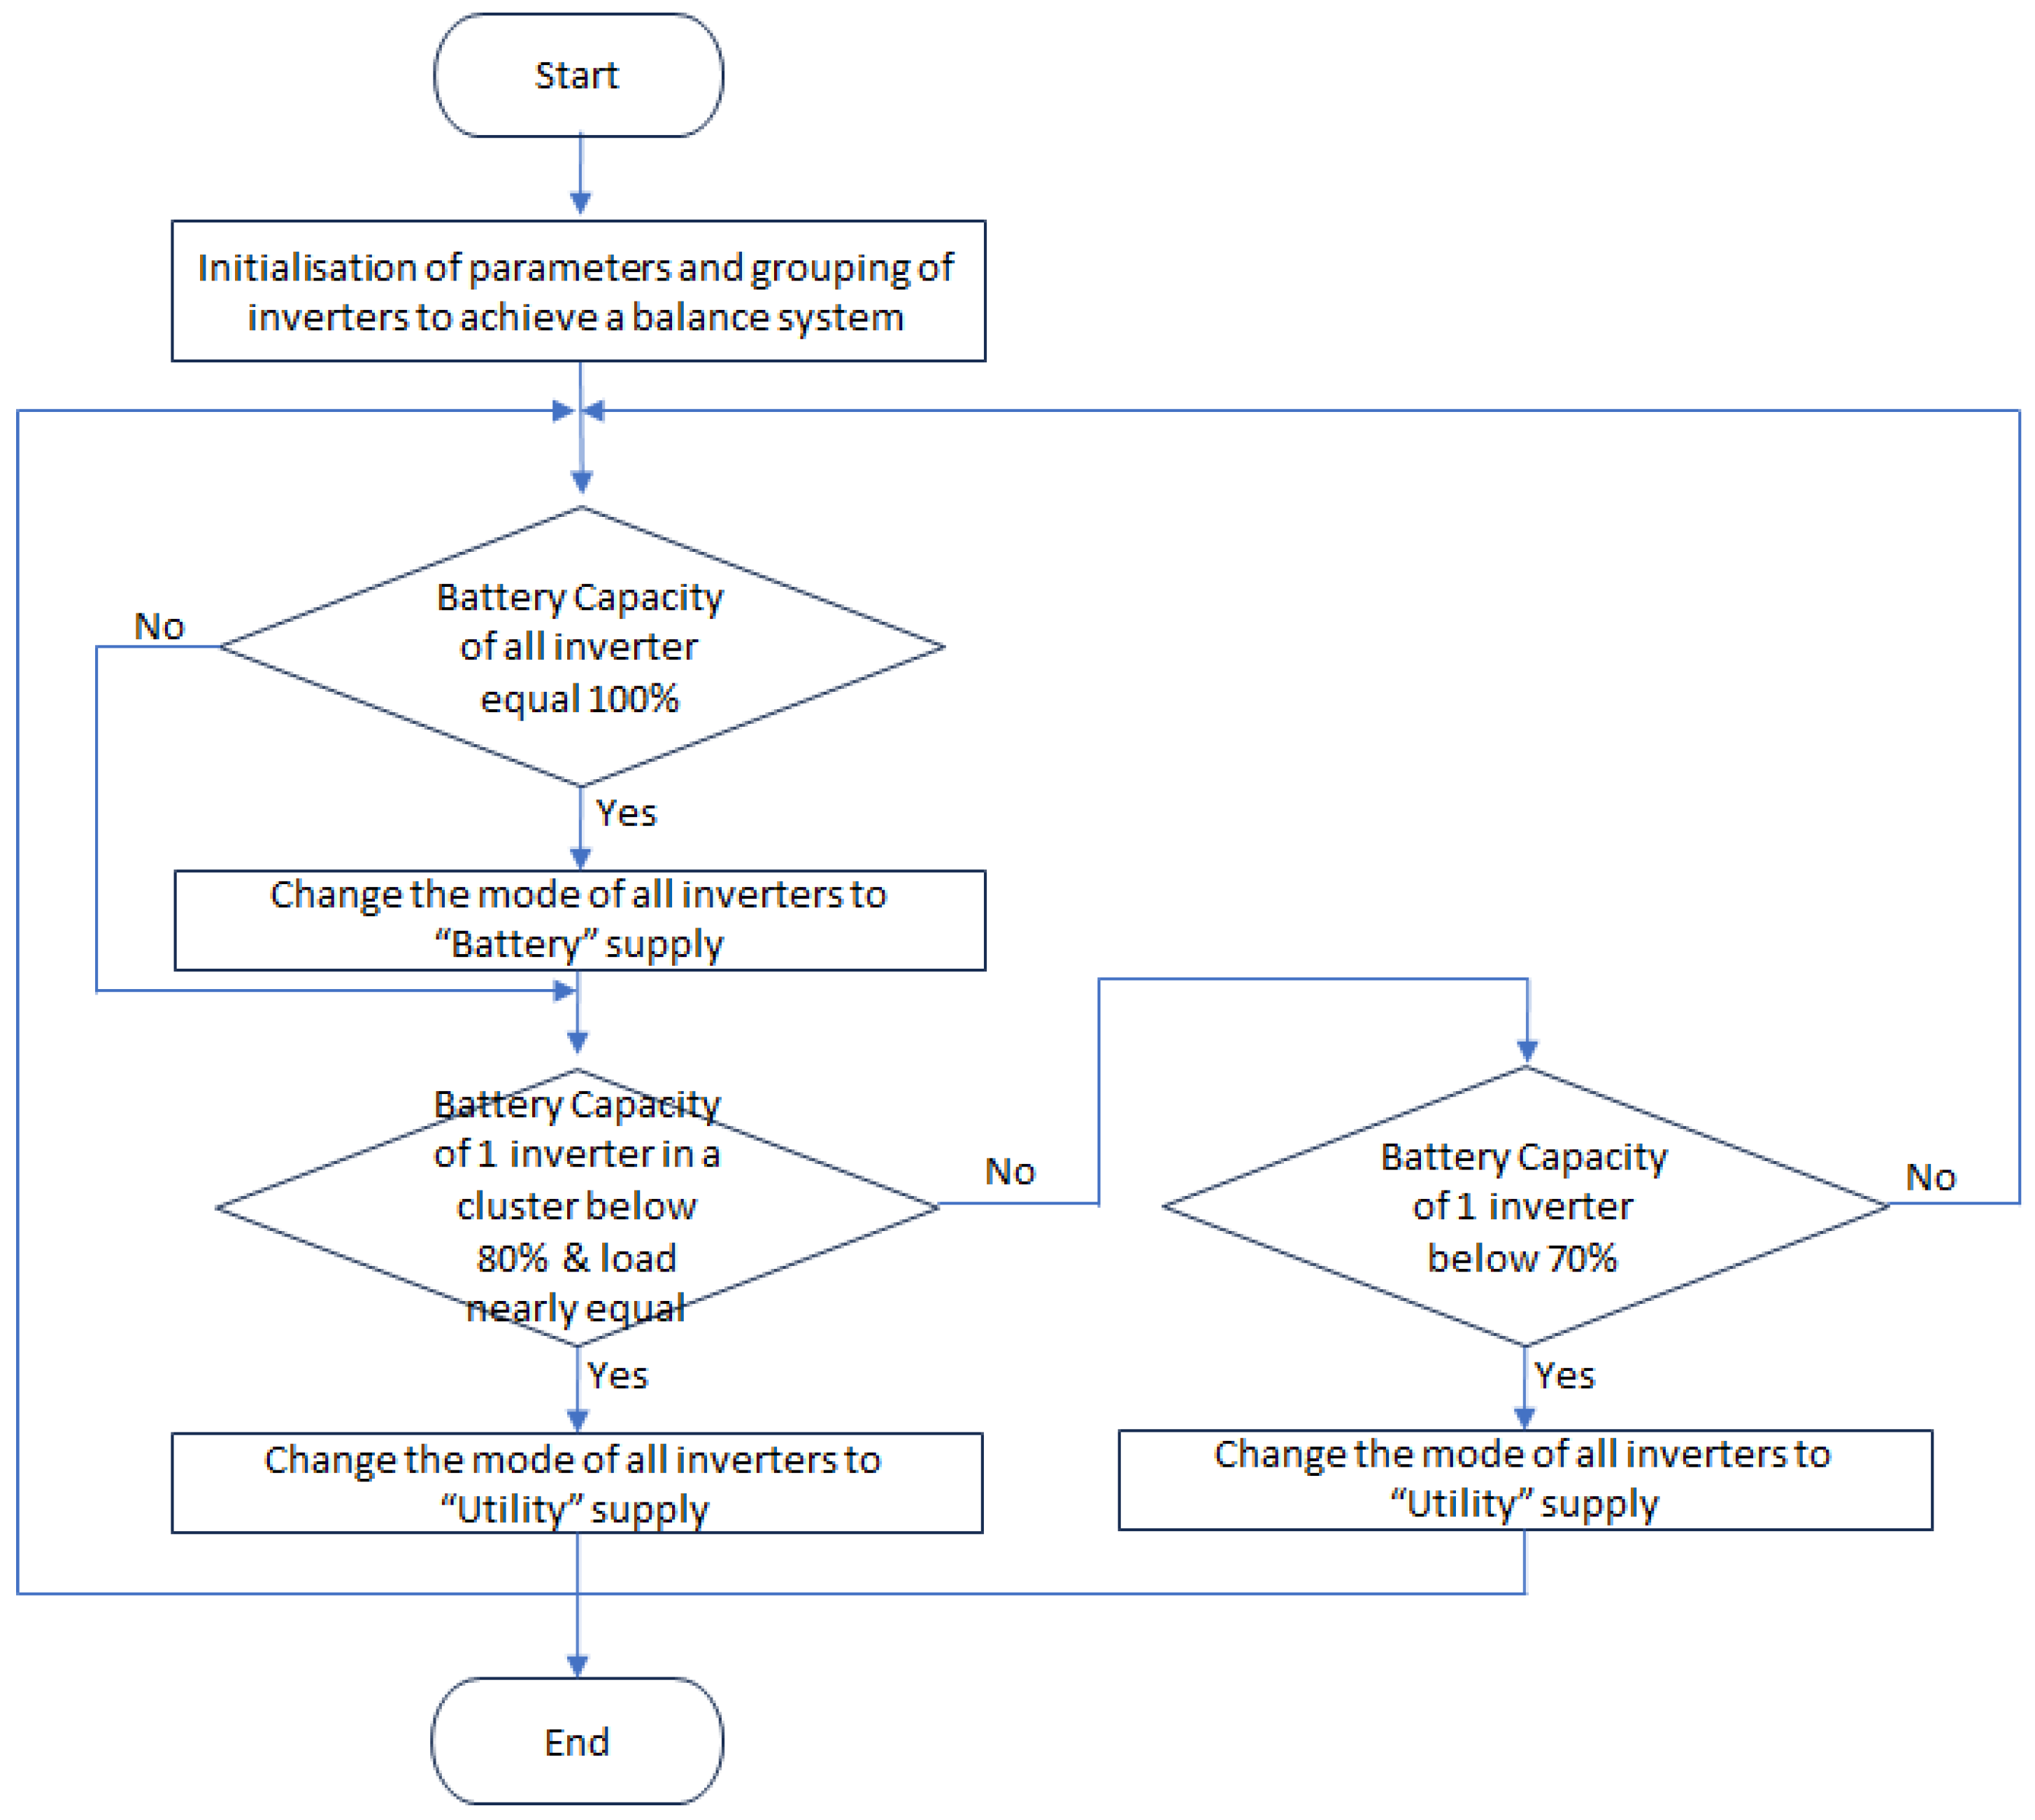
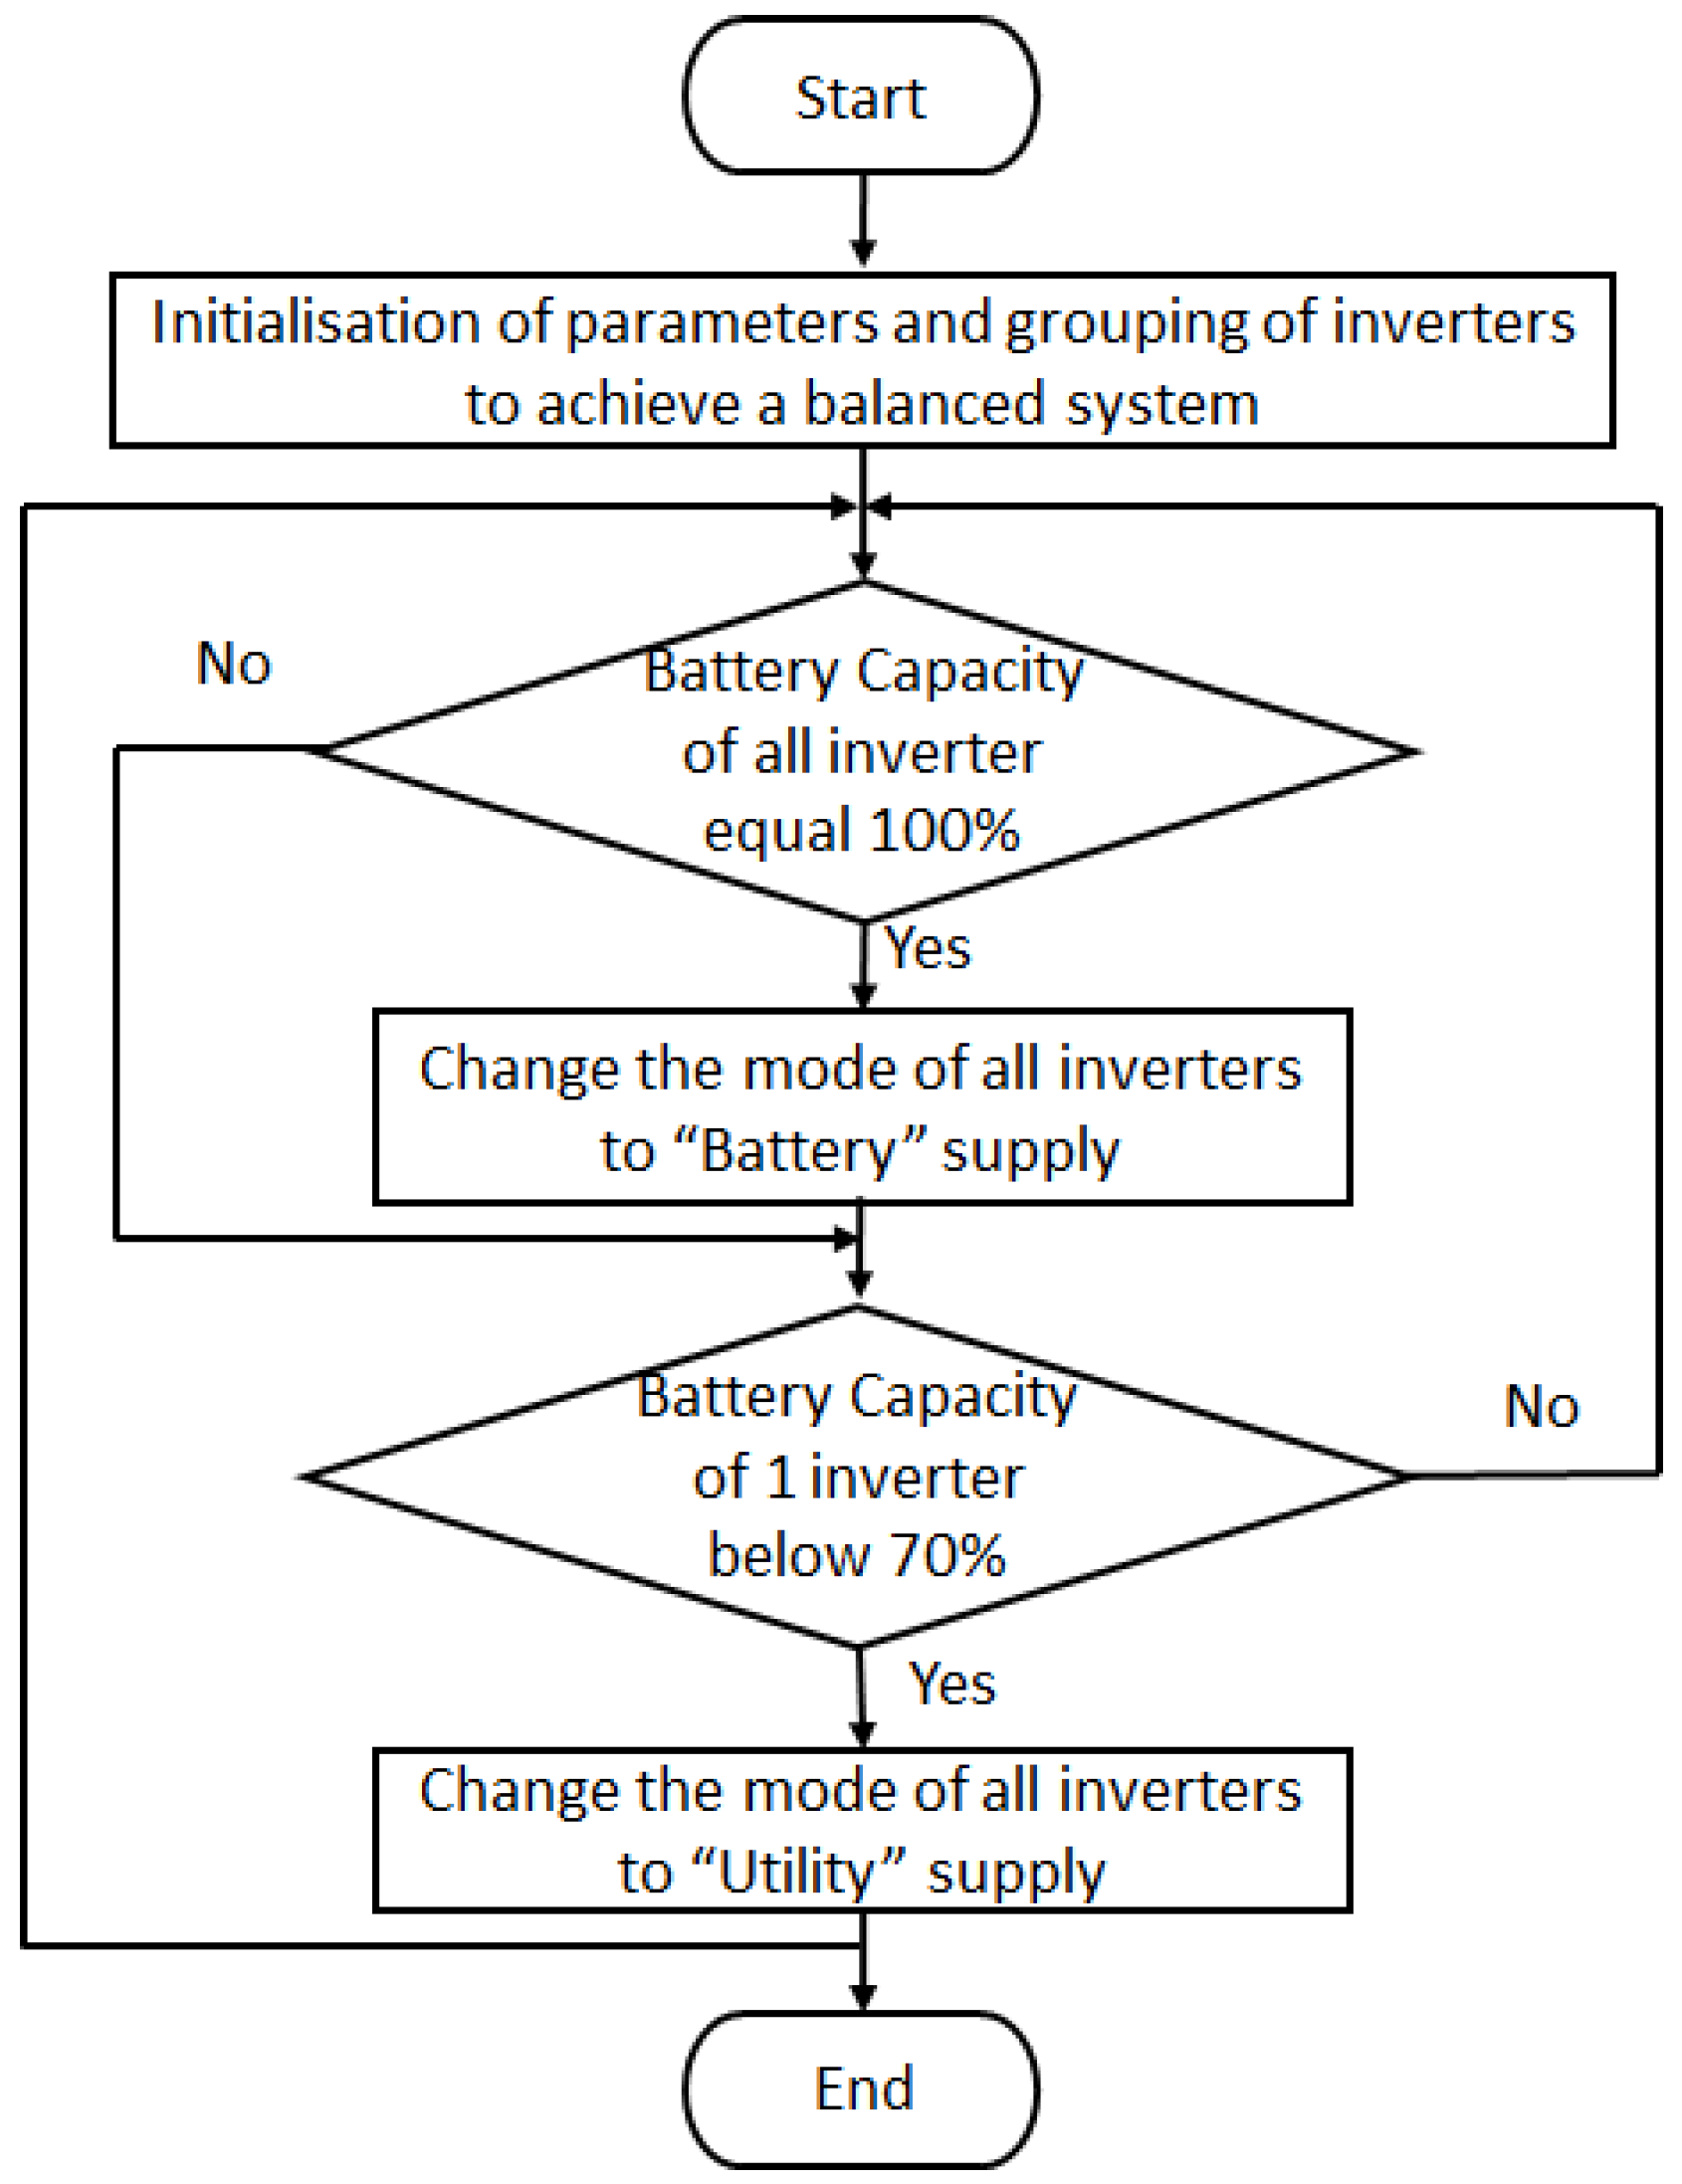
3.6. Design of the Controller

To mitigate the issue of unbalance in the supply network, a central controller was developed to facilitate synchronization of the inverters operating on individual phases. This synchronization ensures that all inverters operate in the same mode simultaneously.
The controller is designed with a focus on balancing three utility supply phases. After a thorough evaluation of different control parameters, it was evident that monitoring and controlling the battery capacity proved to be more straightforward and effective in achieving the desired outcomes. The flow chart of the controller of the laboratory demonstration model is shown in Figure 32. To attain the best results in a large system with numerous inverters, the initial stage of grouping the inverters using load demand and a neutral current threshold becomes critical. In a large system featuring numerous inverters across various phases, these inverters will be organized into clusters. These clusters will be systematically switched between battery mode and utility mode to mitigate neutral currents. The phrase ’cluster’ denotes a collection of three inverters, with each inverter functioning on a distinct phase. Appendix A, Figure A1, presents the flowchart of such a system. Although the laboratory demonstration is performed on a smaller system, it is expected that comparable outcomes will be achieved on a larger-scale system as well.

3.7. Controlled System

Figure 33 illustrates three synchronized inverters as they transition between the modes of operation, namely, utility supply and battery supply. The individual inverters are controlled using the battery charge capacity parameter in the following manner: if the battery capacity of any of the three inverters falls below 70%, it triggers a shift for all three inverters to the utility supply mode. Conversely, when the battery capacity of all three inverters reaches 100% charge, it simultaneously compels all three inverters to switch to the battery supply mode. This method of inverter synchronization proves to balance the supply effectively.
Figure 34 demonstrates how the operation mode of the inverter can be adjusted simultaneously to achieve a balanced current across all three phases, while keeping the AC output power constant for each inverter. The current supplied by the utility varies depending on the mode of operation of the inverter.

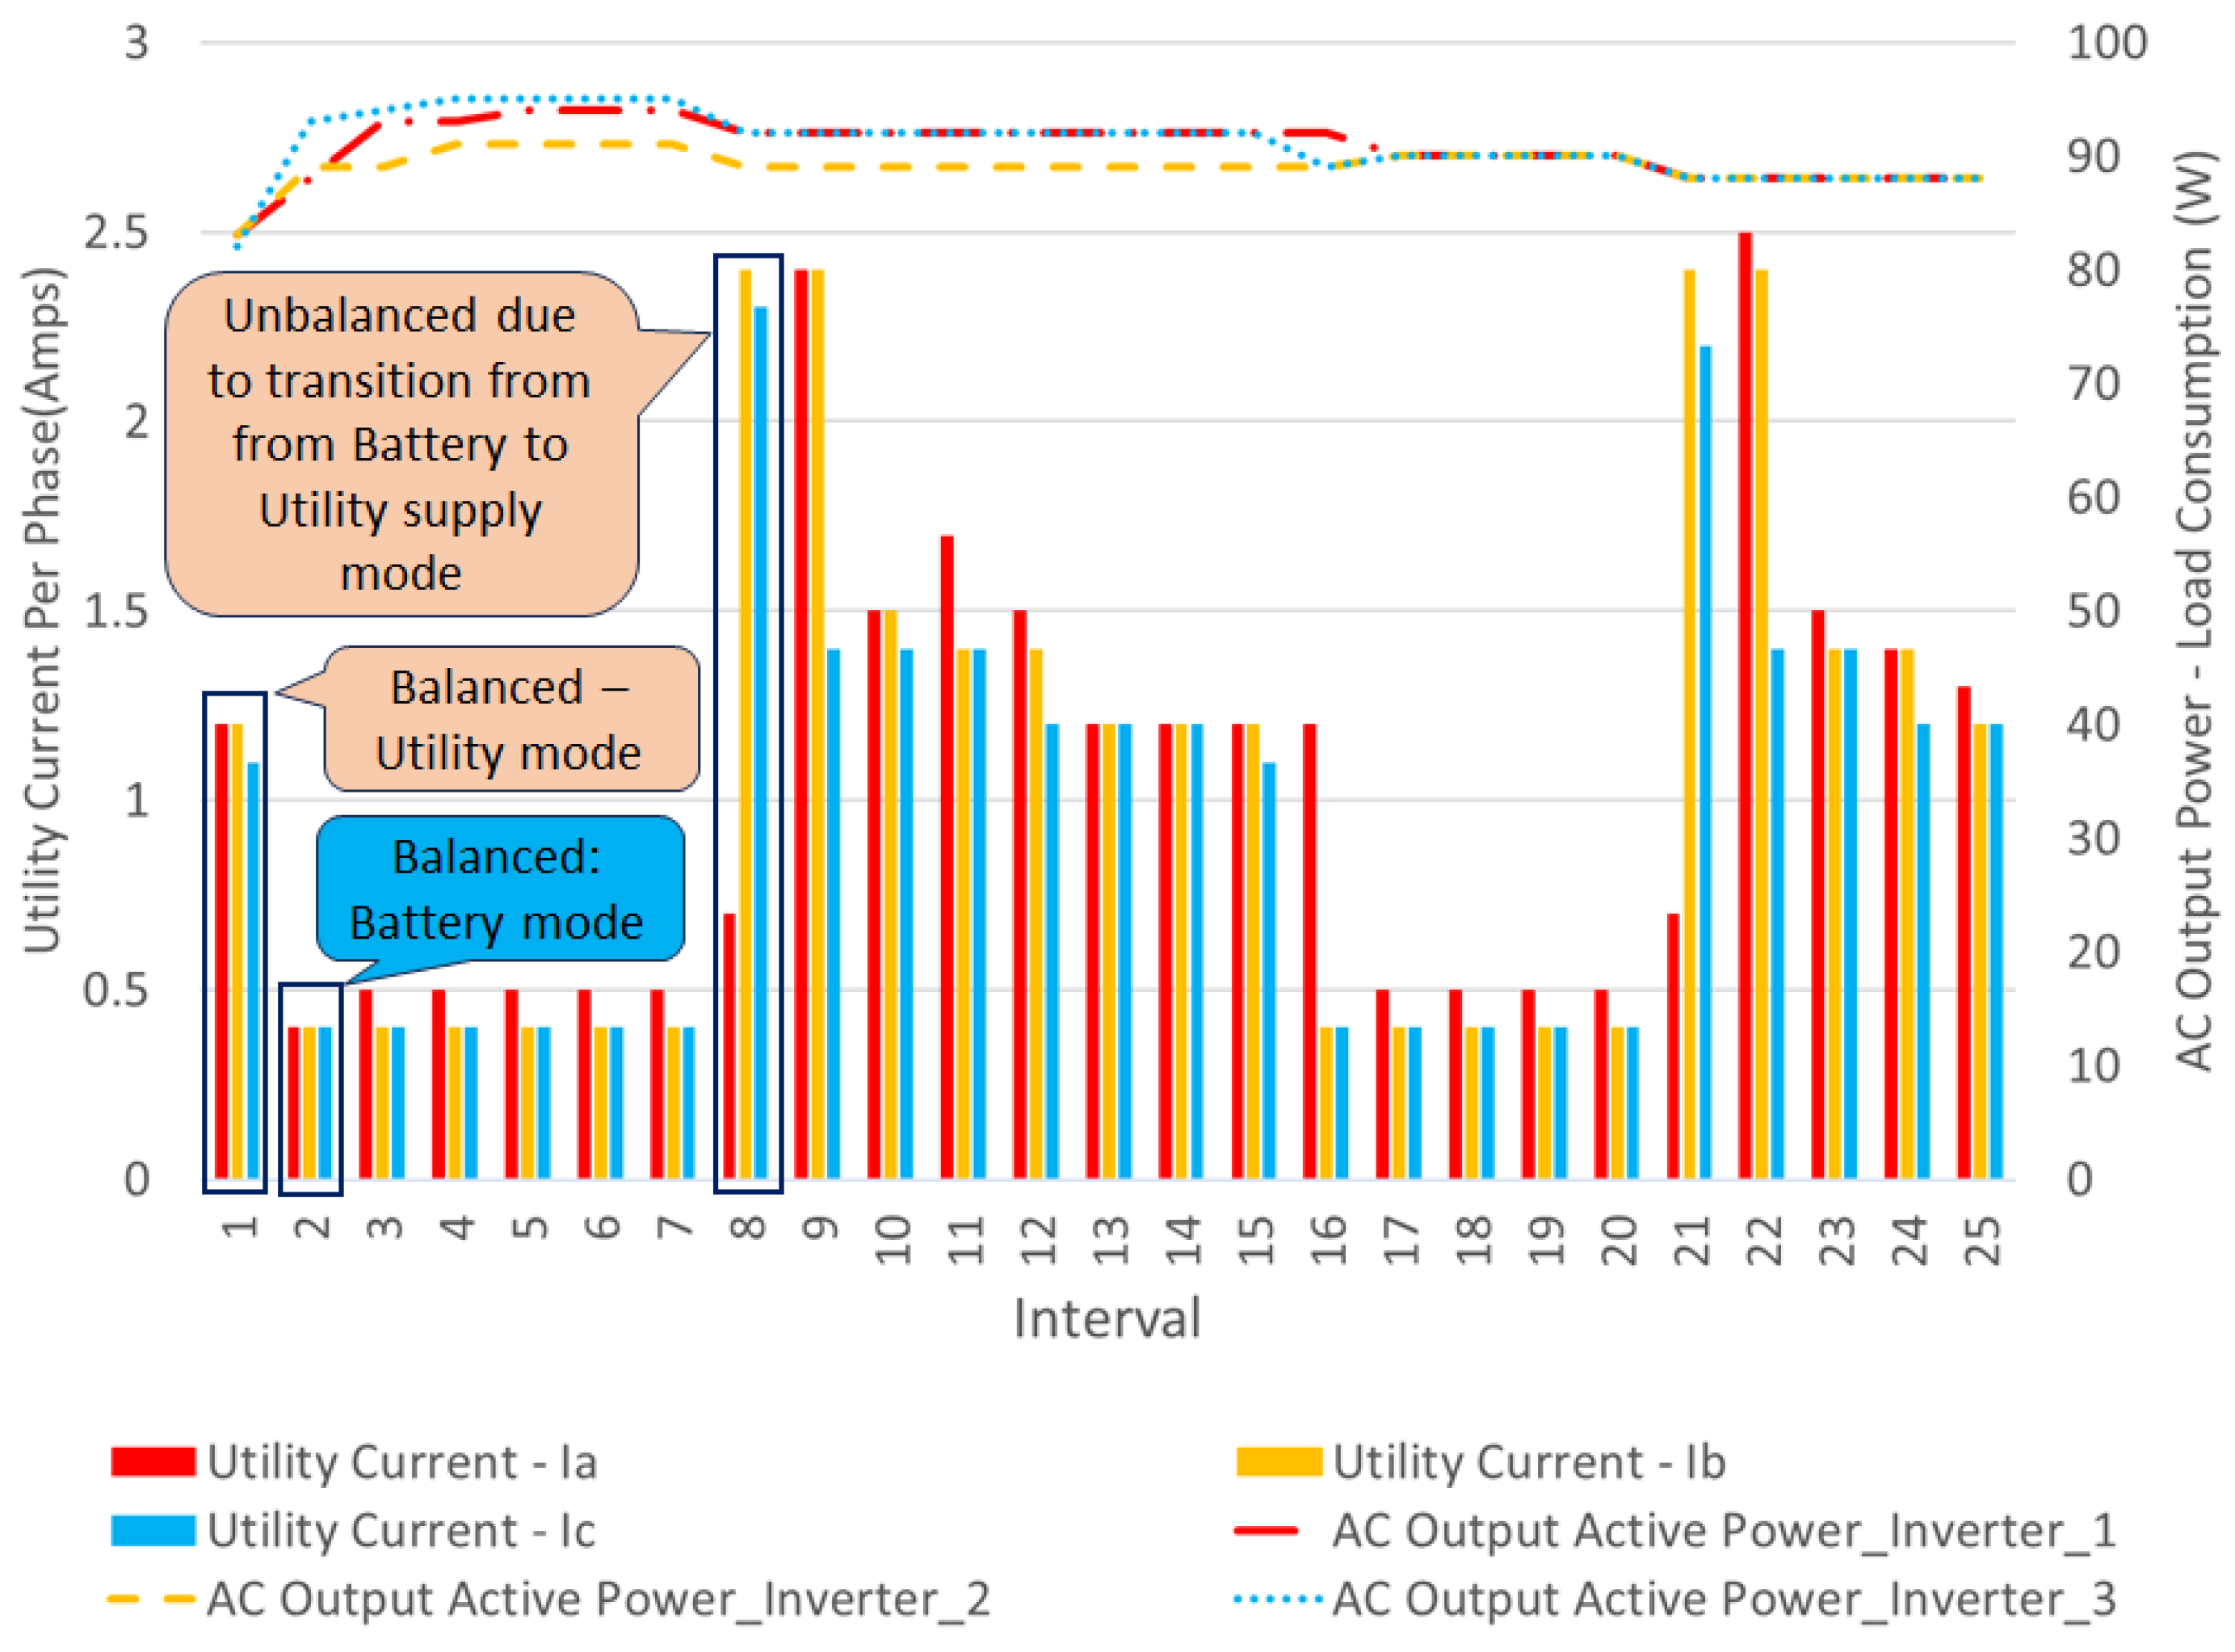
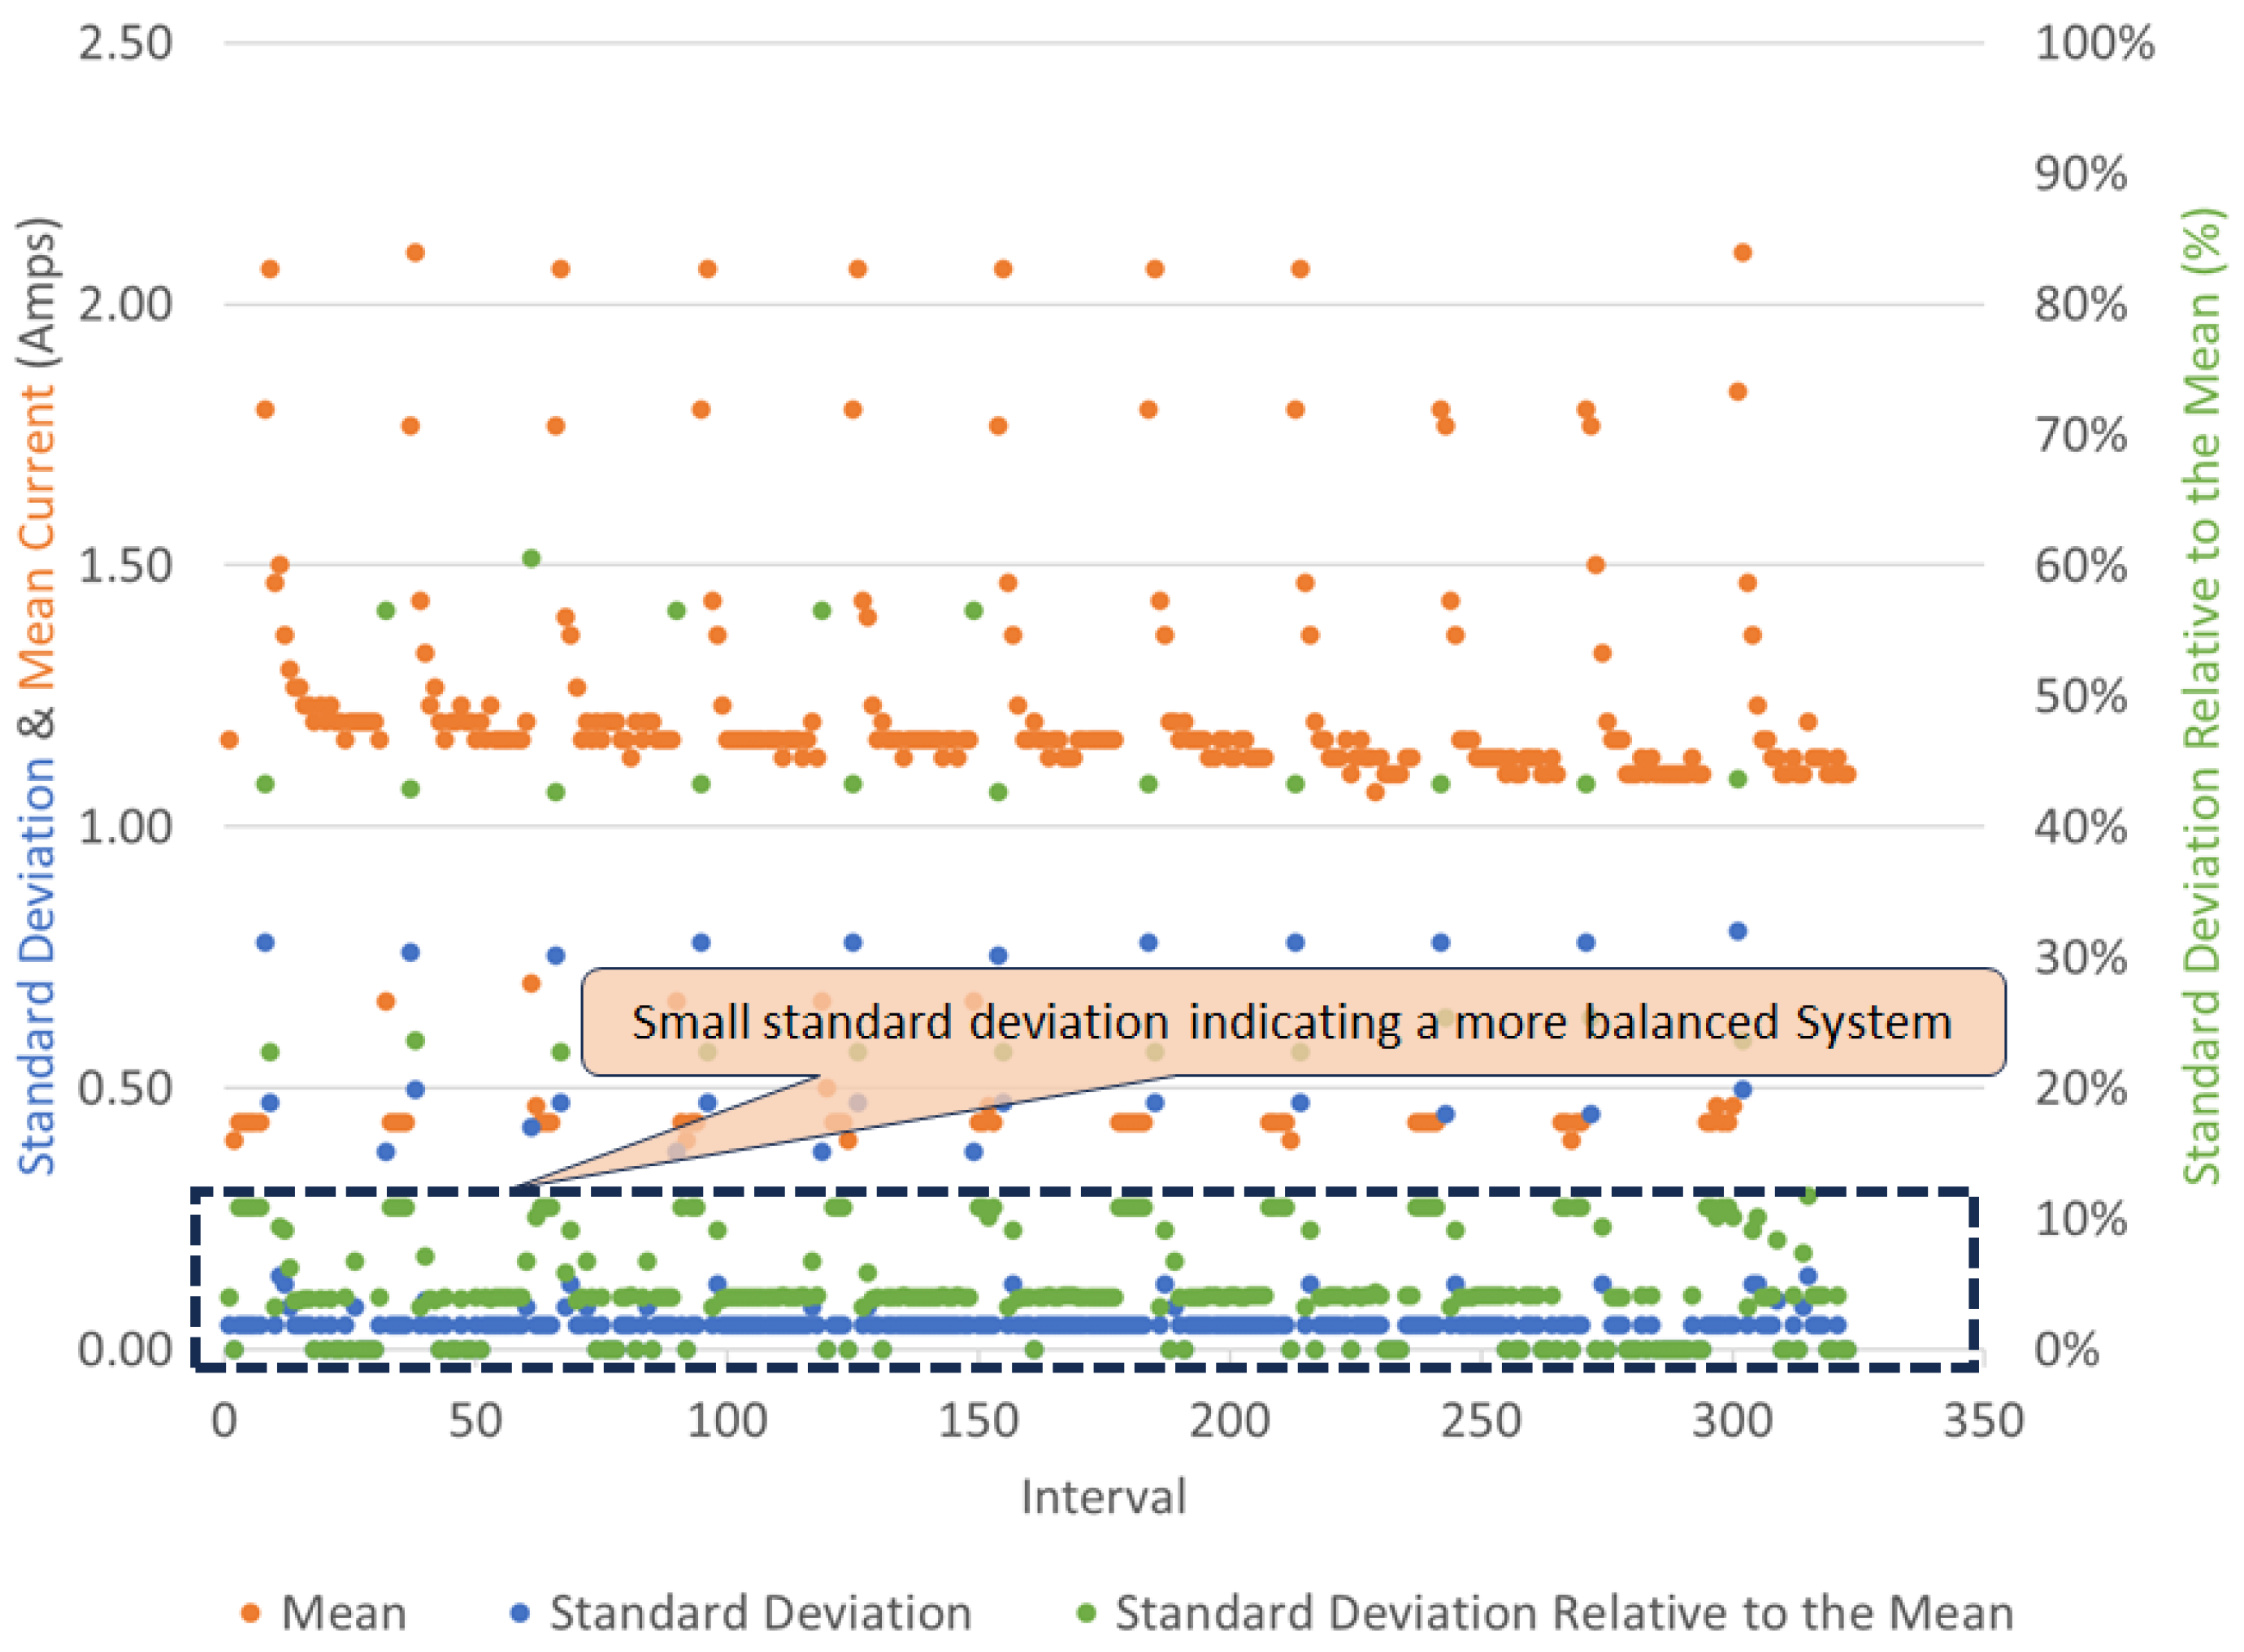
3.8. Evaluation of the Effectiveness of the Controller

For ease of analysis, a statistical approach is employed to compare the distribution of current magnitudes across the three phases. A correlation exists between the magnitude of the neutral current and the standard deviation resulting from the current magnitudes of the three phases. The standard deviation, when interpreted with respect to the mean, provides information about the dispersion or variability of a data point around the average value.
In the case of a balanced system where all three individual phase currents are equal, the resultant neutral current is zero. This signifies an associated standard deviation of zero derived from the magnitudes of the current in these three phases. Conversely, a higher standard deviation derived from the magnitudes of the three currents indicates a wide spread or dispersion among the currents of the phases, and indicates an unbalanced system. On the other hand, a smaller standard deviation implies that the magnitudes of individual phase currents are more equal to the mean, signifying a narrow variability or dispersion among the currents of the three phases and indicating a balanced system. During laboratory testing, no fluctuations in the supply voltage were observed during the transition of inverter modes from one to another. However, this may not be the case under all conditions, particularly in a practical system working on a real grid. Notably, substantial variability was only identified in the supply current. Therefore, the subsequent analysis primarily centers on the analysis of the supply current behavior. Current measurements for an uncontrolled system were recorded, and subsequently, the resulting standard deviation, mean and ratio between standard deviation and mean were computed using
σ = 1 3 i = 1 3 ( I phase i μ ) 2
μ = 1 3 i = 1 3 I phase i
σ relative to the mean = σ μ
It is important to recognize that Equations (19) and (21) correlate with the equations describing an unbalanced current, (5) and (4), respectively. Figure 35 shows the behavior of the system during different time intervals. Between the range of 0 and 24, the mean current value is high, while the standard deviation and the ratio of standard deviation to mean (approximately 10%) are low, indicating a balanced system. As the system transitions to the intervals between 24 and 64, both the mean and the ratio of standard deviation to mean increase to high values, indicating an unbalanced system. This suggests that some phases receive power from the utility while one phase is primarily supplied locally from a battery source and vice versa. Moving to the interval between 64 and 86, both the mean and ratio of standard deviation to mean are reduced to small values, signifying a balanced system where all three phases are sourced from local batteries. Finally, within the interval from 86 to 152, both the mean and the ratio of standard deviation to mean rise again, pointing towards an unbalanced system where certain phases rely on utility power while others are sustained locally by batteries and vice versa.
Figure 36 illustrates the variation in supply currents within a controlled system. The standard deviation, when compared to the mean, indicates a higher level of balance in the system. Additionally, significant improvements have been made, with values falling below 10% in the majority of intervals.

3.9. Cyber Attack on Communication Networks

Communication networks used for the control and monitoring of industrial equipment are vulnerable to cyberattacks. Consequently, it becomes crucial to institute preventative measures to protect the system from these threats. A cyberattack involves a deliberate and malicious endeavor to compromise the security, integrity or accessibility of computer systems, networks or digital data. These attacks can inflict damage on the system or processes while remaining concealed from the operator’s view.
Several techniques exist for the detection and prevention of cyberattacks. In a recent study [31,32], neural networks were explored as a novel approach due to their high level of automation in the learning process, meaning that they require less prior knowledge of the system being safeguarded. Additionally, recommendations suggest the implementation of redundancy in communication protocols, encryption, monitoring for unusual signal behavior through statistical properties and isolating the communication network from external connections (according to [33], the internet is the most commonly used method of cyberattack).
For the purposes of this paper, a cost-effective and straightforward approach is recommended, and it involves the application of statistical methods, such as analyzing maximum and minimum values, the correlation between variables and the standard deviations, to parameters like battery capacity, battery voltage, battery discharge current and the AC output power of the inverter. A significant deviation in these parameters can serve as an indicator of a potential cyber threat.

4. Conclusions and Recommendations

This paper introduces a cost-effective interface designed for power utility companies to enhance network efficiency by regulating connected inverters. It effectively addresses power flow challenges arising from unregulated distributed power generation within the low-voltage residential distribution network. The findings demonstrate that harmonizing the operational modes of single-phase distributed generators can mitigate the imbalance issues that they typically cause. This approach can be scaled up for implementation in extensive networks by gradually synchronizing clusters of inverters between different modes of operation.
In the uncontrolled system, the standard deviation exhibits significant variability, suggesting substantial current unbalances within the system in certain instances. Conversely, in a controlled system, the standard deviation approaches zero, indicating a significantly more balanced system.
It is advisable to conduct additional research to establish the minimum threshold of an acceptable current imbalance that poses no risk to equipment. Moreover, there is potential for further optimization and enhancement of the controller through the application of artificial intelligence techniques.
Cyberattacks pose a significant threat to the proposed controller. Therefore, it is strongly advised to conduct further research to identify the most appropriate cybersecurity measures, in addition to those already proposed, for the system.
Furthermore, it is recommended to assess the practicality of utilizing alternative energy sources (such as HVAC systems, geysers and others) within buildings or homes to achieve the same control objectives outlined in this paper.

Author Contributions

D.M. serves as the primary researcher for this paper. His key contributions encompass designing and setting up the laboratory simulation, developing and programming the controller using Raspberry Pi 4, and collecting and analyzing the laboratory results from various scenarios. D.D. offered guidance and technical assistance throughout the research and publication of this paper, and conducted a comprehensive review of the manuscript. R.P.C. provided supervision, technical support, review and funding of this research paper. All authors have read and agreed to the published version of the manuscript.

Funding

This research received no external funding; it is funded by the University of KwaZulu-Natal.

Data Availability Statement

Research data and analysis are available, and the authors will provide any information on request.

Acknowledgments

We would like to express our appreciation to Dharma Moodley and his lab assistant team for their invaluable technical support and assistance during the installation of the demonstration model. Additionally, we extend our gratitude to Remmy Musumpuka for his exceptional help in setting up the Raspberry Pi OS, setting up the power analyzer and overseeing the arrangement of the paper’s layout.

Conflicts of Interest

The authors declare no conflict of interest.

Abbreviations

The following abbreviations are used in this manuscript:
ADMDAfter diversity maximum demand
AhAmp-hour
BPSOBinary particle swarm optimization
CAN BusController area network
COTSCommercial off-the-shelf
CRCCyclic redundancy check
CTCurrent transformer
DCDirect current
DERsDistributed energy resources
DSODistribution system operator
DSSEDistribution system state estimation
HVHigh voltage
HVACHeating, ventilation and air conditioning
ICTInformation and communication technology
kVAKilovolt-ampere
kWKillowatt
LP-WANLow-power wide-area network
LVLow voltage
LVDGLow-voltage distribution grid
MVMedium voltage
MVDGMedium-voltage distribution grid
NMDNotified maximum demand
NRSNational regulatory standards
PLCPower line carrier
PLTPower line telecommunication
PMUsPhasor measurement units
PVPhotovotaic
RFRadio frequency
RMSIRoot mean squares of currents
RMSVRoot mean squares of voltages
SCADASupervisory control and data acquisition
SSEGsSmall-scale embedded generators
USBUniversal serial bus
WLSWeighted least-squares

Appendix A

Figure A1 shows a flowchart of a system comprising multiple inverters in a transformer zone. The term ’cluster of inverters’ refers to a group of three inverters, with each inverter operating on a different phase. When a group of inverters powering local loads across three-phases approaches a state of near balance while operating in battery mode, they are switched back to the utility supply allowing the battery to charge when there is no solar PV. The concept of a 70% threshold of battery capacity aims to prevent the complete depletion of customer batteries, as this is not their primary function.
Figure A1. Flowchart of many inverters in LV network.
Energies 16 07707 g0a1

References

  1. Liu, B.; Meng, K.; Dong, Z.Y.; Wong, P.K.; Li, X. Load balancing in low-voltage distribution network via phase reconfiguration: An efficient sensitivity-based approach. IEEE Trans. Power Deliv. 2020, 36, 2174–2185. [Google Scholar]
  2. Grigoras, G.; Neagu, B.C.; Gavrilas, M.; Tristiu, I.; Bulac, C. Optimal phase load balancing in low voltage distribution networks using a smart meter data-based algorithm. Mathematics 2020, 8, 549. [Google Scholar]
  3. Grigoras, G.; Neagu, B.C.; Scarlatache, F.; Noroc, L.; Chelaru, E. Bi-level phase load balancing methodology with clustering-based consumers’ selection criterion for switching device placement in low voltage distribution networks. Mathematics 2021, 9, 542. [Google Scholar]
  4. Altawil, I.; Obeidat, E.; Mahafzah, K.A.; Albatianeh, Z. Salp swarm algorithm for optimal load balancing in low voltage networks. Int. J. Power Electron. Drive Syst. (IJPEDS) 2022, 13, 2506–2514. [Google Scholar]
  5. Yan, R.; Saha, T.K. Investigation of voltage imbalance due to distribution network unbalanced line configurations and load levels. IEEE Trans. Power Syst. 2012, 28, 1829–1838. [Google Scholar]
  6. Ballestín-Fuertes, J.; Sanz-Osorio, J.F.; Muñoz-Cruzado-Alba, J.; Puyal, E.L.; Leiva, J.; Rivero, J.R. Four-legs D-STATCOM for current balancing in low-voltage distribution grids. IEEE Access 2021, 10, 779–788. [Google Scholar]
  7. Bina, M.T.; Kashefi, A. Three-phase unbalance of distribution systems: Complementary analysis and experimental case study. Int. J. Electr. Power Energy Syst. 2011, 33, 817–826. [Google Scholar]
  8. Von Jouanne, A.; Banerjee, B. Assessment of voltage unbalance. IEEE Trans. Power Deliv. 2001, 16, 782–790. [Google Scholar]
  9. NRS Standard 048-2; Electricity Supply—Quality of Supply Part 2: Voltage Characteristics, Compatibility Levels, Limits and Assessment Methods (Edition 3). South African National Standard (NRS): Pretoria, South Africa, 2007. Available online: https://ukzn-iis-02.ukzn.ac.za/san/NRS048-2.pdf (accessed on 12 October 2023).
  10. Du, Y.; Chen, J.; Li, H.; Yin, J.; Shao, M.; Guo, H. Discussion on the evaluation method of current unbalance compensation effect of three-phase unbalanced load adjusting device in distribution network. In Proceedings of the 2021 China International Conference on Electricity Distribution (CICED), Shanghai, China, 6–9 April 2021; pp. 230–234. [Google Scholar]
  11. Dey, N.; Chakraborty, A. Neutral Current and Neutral Voltage in Three Phase Four Wire Distribution System of a Technical Institution. Int. J. Comput. Appl. 2013, 72, 1–7. [Google Scholar]
  12. Kotsonias, A.; Asprou, M.; Hadjidemetriou, L.; Kyriakides, E. Enhancing the State Estimation for Low Voltage Distribution Grids. In Proceedings of the 2020 IEEE PES Innovative Smart Grid Technologies Europe (ISGT-Europe), Hague, The Netherlands, 26–28 October 2020; pp. 914–918. [Google Scholar]
  13. Kotsonias, A.; Asprou, M.; Hadjidemetriou, L.; Kyriakides, E. State estimation for distribution grids with a single-point grounded neutral conductor. IEEE Trans. Instrum. Meas. 2020, 69, 8167–8177. [Google Scholar]
  14. Armendariz, M.; Chenine, M.; Nordström, L.; Al-Hammouri, A. A co-simulation platform for medium/low voltage monitoring and control applications. In Proceedings of the ISGT 2014, Kuala Lumpur, Malaysia, 20–23 May 2014; pp. 1–5. [Google Scholar]
  15. Krcal, V.; Topolanek, D.; Vycital, V.; Vaculik, J. Indication of abnormal operation conditions in a mesh network based on data from distributed measurement. In Proceedings of the CIRED 2021—The 26th International Conference and Exhibition on Electricity Distribution, Online, 20–23 September 2021; Volume 2021, pp. 1567–1571. [Google Scholar]
  16. Armendariz, M.; Babazadeh, D.; Nordström, L.; Barchiesi, M. A method to place meters in active low voltage distribution networks using BPSO algorithm. In Proceedings of the 2016 Power Systems Computation Conference (PSCC), Genoa, Italy, 20–24 June 2016; pp. 1–7. [Google Scholar]
  17. Kwapisz, A. Utilization of the monitoring system for MV/LV transformers in smart grid application. In Proceedings of the 2016 Electric Power Networks (EPNet), Szklarska Poreba, Poland, 19–21 September 2016; pp. 1–4. [Google Scholar]
  18. Chaves, T.R.; Martins, M.A.I.; Pacheco, B.A. MV/LV Overhead Transformer Monitoring and Hot Spot Temperature Estimation. In Proceedings of the 2020 Intermountain Engineering, Technology and Computing (IETC), Orem, UT, USA, 14–15 May 2022; pp. 1–5. [Google Scholar]
  19. Ge, W.; Luo, H.; Zhao, H.; Gao, Q.; Zhou, G.; Ma, Y.; Fu, L. Research on communication technology of power monitoring system based on medium voltage power line carrier and low power wide area network. In Proceedings of the 2017 IEEE Conference on Energy Internet and Energy System Integration (EI2), Beijing, China, 26–28 November 2017; pp. 1–4. [Google Scholar]
  20. Baimel, D.; Tapuchi, S.; Baimel, N. Smart grid communication technologies-overview, research challenges and opportunities. In Proceedings of the 2016 International Symposium on Power Electronics, Electrical Drives, Automation and Motion (SPEEDAM), Capri, Italy, 22–24 June 2016; pp. 116–120. [Google Scholar]
  21. Lasagani, K.; Iqbal, T.; Mann, G.K. Data Logging and Control of a Remote Inverter Using LoRa and Power Line Communication. Energy Power Eng. 2018, 10, 351–365. [Google Scholar]
  22. Lin, Y.; Barooah, P.; Meyn, S.; Middelkoop, T. Experimental evaluation of frequency regulation from commercial building HVAC systems. IEEE Trans. Smart Grid 2015, 6, 776–783. [Google Scholar]
  23. de Araujo Passos, L.A.; van den Engel, P.; Baldi, S.; De Schutter, B. Dynamic optimization for minimal HVAC demand with latent heat storage, heat recovery, natural ventilation, and solar shadings. Energy Convers. Manag. 2023, 276, 116573. [Google Scholar]
  24. Standard 10142-1; The Wiring of Premises—Part 1: Low-Voltage Installations. SANS: Pretoria, South Africa, 2017.
  25. Proedrou, E. A comprehensive review of residential electricity load profile models. IEEE Access 2021, 9, 12114–12133. [Google Scholar]
  26. Claeys, R.; Cleenwerck, R.; Knockaert, J.; Desmet, J. Stochastic generation of residential load profiles with realistic variability based on wavelet-decomposed smart meter data. Appl. Energy 2023, 350, 121750. [Google Scholar]
  27. Stephen, B.; Mutanen, A.J.; Galloway, S.; Burt, G.; Järventausta, P. Enhanced load profiling for residential network customers. IEEE Trans. Power Deliv. 2013, 29, 88–96. [Google Scholar]
  28. Bizzozero, F.; Gruosso, G.; Vezzini, N. A time-of-use-based residential electricity demand model for smart grid applications. In Proceedings of the 2016 IEEE 16th International Conference on Environment and Electrical Engineering (EEEIC), Florence, Italy, 7–10 June 2016; pp. 1–6. [Google Scholar] [CrossRef]
  29. Sajjad, I.A.; Chicco, G.; Napoli, R. Effect of aggregation level and sampling time on load variation profile—A statistical analysis. In Proceedings of the MELECON 2014—2014 17th IEEE Mediterranean Electrotechnical Conference, Beirut, Lebanon, 13–16 April 2014; pp. 208–212. [Google Scholar]
  30. Elombo, A.I.; Morstyn, T.; Apostolopoulou, D.; McCulloch, M.D. Residential load variability and diversity at different sampling time and aggregation scales. In Proceedings of the 2017 IEEE AFRICON, Cape Town, South Africa, 18–20 September 2017; pp. 1331–1336. [Google Scholar]
  31. Zarzycki, K.; Chaber, P.; Cabaj, K.; Ławryńczuk, M.; Marusak, P.; Nebeluk, R.; Plamowski, S.; Wojtulewicz, A. Forgery Cyber-Attack Supported by LSTM Neural Network: An Experimental Case Study. Sensors 2023, 23, 6778. [Google Scholar]
  32. Kravchik, M.; Shabtai, A. Detecting cyber attacks in industrial control systems using convolutional neural networks. In Proceedings of the 2018 Workshop on Cyber-Physical Systems Security and Privacy, Toronto, ON, Canada, 19 October 2018; pp. 72–83. [Google Scholar]
  33. Alladi, T.; Chamola, V.; Zeadally, S. Industrial control systems: Cyberattack trends and countermeasures. Comput. Commun. 2020, 155, 1–8. [Google Scholar]
Figure 1. Detailed PLC communication layout.
Energies 16 07707 g001
Figure 2. Typical LV customer installation layout with full backup supply.
Energies 16 07707 g002
Figure 3. Typical LV customer installation layout with partial backup supply.
Energies 16 07707 g003
Figure 4. Raspberry Pi controntroller.
Energies 16 07707 g004
Figure 5. Power meter.
Energies 16 07707 g005
Figure 6. Hybrid inverter configuration.
Energies 16 07707 g006
Figure 7. Hybrid inverter modes of operation. (a) Charging the battery from a PV panel while simultaneously powering the load from the utility; (b) The battery and the load are fed from the utility; (c) The battery and the load are fed from the PV panel; and (d) The load is fed from the battery.
Energies 16 07707 g007
Figure 8. Laboratory layout diagram.
Energies 16 07707 g008
Figure 9. Typical three-phase supply and single-phase customer configuration with corresponding current phasor diagram of a balanced system.
Energies 16 07707 g009
Figure 10. Typical three-phase supply and single-phase customer configuration with corresponding current phasor diagram of a three-phase system when unbalanced by single-phase loads with load A reduced.
Energies 16 07707 g010
Figure 11. Typical three-phase supply and single-phase customer configuration with corresponding current phasor diagram of a three-phase system when unbalanced by single-phase loads with load C reduced.
Energies 16 07707 g011
Figure 12. Typical three-phase supply and single-phase customer configuration with corresponding current phasor diagram of a three-phase system when unbalanced by single-phase loads with load B reduced.
Energies 16 07707 g012
Figure 13. Laboratory setup.
Energies 16 07707 g013
Figure 14. Three-phase supply voltages of the laboratory system.
Energies 16 07707 g014
Figure 15. Three-phase supply currents of the laboratory system under balanced load.
Energies 16 07707 g015
Figure 16. Neutral current with respect to phase A voltage of the laboratory system under balanced linear loads (without battery charging).
Energies 16 07707 g016
Figure 17. Battery charging current of phase A with respect to phase A voltage.
Energies 16 07707 g017
Figure 18. Neutral current with respect to phase A voltage during battery charging of phase A.
Energies 16 07707 g018
Figure 19. Battery charging current of phase B with respect to phase A voltage.
Energies 16 07707 g019
Figure 20. Neutral current with respect to phase A voltage during battery charging of phase B.
Energies 16 07707 g020
Figure 21. Battery charging current of phase C with respect to phase A voltage.
Energies 16 07707 g021
Figure 22. Neutral current with respect to phase A voltage during battery charging of phase C.
Energies 16 07707 g022
Figure 23. Three-phase supply currents with two phases charging batteries while the third phase remains inactive.
Energies 16 07707 g023
Figure 24. Neutral current with respect to phase A voltage during simultaneous battery charging of two phases.
Energies 16 07707 g024
Figure 25. Harmonic levels during battery charging of two phases.
Energies 16 07707 g025
Figure 26. Three-phase supply currents when all three phases are charging batteries simultaneously.
Energies 16 07707 g026
Figure 27. Neutral current with respect to phase A voltage during simultaneous battery charging of all three phases.
Energies 16 07707 g027
Figure 28. Harmonic levels during battery charging of three phases.
Energies 16 07707 g028
Figure 29. Battery capacity vs. AC output power and battery discharge current.
Energies 16 07707 g029
Figure 30. Battery capacity vs. battery voltage.
Energies 16 07707 g030
Figure 31. AC output active power vs. utility supply current of individual phases.
Energies 16 07707 g031
Figure 32. Flow chart of the controller.
Energies 16 07707 g032
Figure 33. Battery charge capacity of individual inverters of a controlled system.
Energies 16 07707 g033
Figure 34. Utility supply current of individual phases for a controlled system.
Energies 16 07707 g034
Figure 35. Standard deviation of supply currents for an uncontrolled system.
Energies 16 07707 g035
Figure 36. Standard deviation of supply currents for a controlled system.
Energies 16 07707 g036
Table 1. NRS requirement for small-scale embedded generation.
Number of PhasesService Circuit Breaker Size
(A)
NMD
(kVA)
Generation Limit (kVA)
1204.61.2
16013.83.4
18018.44.6
36041.610.4
38055.413.8
Table 2. Typical internal parameters of an inverter.
Inverter Internal ParameterUnit Measure
Grid VoltageV
Grid FrequencyHz
AC Output VoltageV
AC Output FrequencyHz
AC Output Apparent PowerVAr
AC Output Active PowerkW
Output Load Percentage%
Bus VoltageV
Battery VoltageV
Battery Charging CurrentA
Battery Capacity%
Inverter Heat Sink TemperatureDeg C
PV Input CurrentA
PV Input VoltageV
Battery Discharge CurrentA
Disclaimer/Publisher’s Note: The statements, opinions and data contained in all publications are solely those of the individual author(s) and contributor(s) and not of MDPI and/or the editor(s). MDPI and/or the editor(s) disclaim responsibility for any injury to people or property resulting from any ideas, methods, instructions or products referred to in the content.

