Article

Achieving Net Zero Carbon Performance in a French Apartment Building?

CES (Centre for Energy Efficiency of Systems), MINES Paris—PSL Research University, 75006 Paris, France
*
Author to whom correspondence should be addressed.
Energies 2023, 16(22), 7608; https://doi.org/10.3390/en16227608
Submission received: 27 October 2023 / Revised: 7 November 2023 / Accepted: 12 November 2023 / Published: 16 November 2023
(This article belongs to the Special Issue Solutions towards Zero Carbon Buildings)

Abstract

:
Containing global warming to 1.5 °C implies staying on a given carbon budget and therefore being able to design net zero carbon buildings by 2050. A case study corresponding to a French residential building is used to assess the feasibility of achieving this target. Starting from an actual construction built in 2016, various improvement measures are studied: lowering heating energy needs, implementing bio-sourced materials and renewable energy systems (geothermal heat pump, solar domestic hot water production, and photovoltaic electricity production). Dynamic thermal simulation is used to evaluate energy consumption and overheating risk in hot periods. Greenhouse gas emissions are quantified using a consequential life cycle assessment approach, considering that during a transition period, exporting electricity avoids impacts corresponding to marginal production on the grid. Avoided impacts decrease and become zero when the grid is ultimately “decarbonized”. From this point, the building should be net zero emissions, but there remain unavoidable emissions. Residual GhG (greenhouse gas) emissions account for 5.6 kgCO2 eq/m2 annually. The possibility of offsetting these emissions is investigated, considering sequestration in forests or vegetation systems. A net zero emission level can be achieved, but on a national level, it would require that the whole sequestration potential of forest growth be devoted to offset emissions of new construction. A circular economy for construction products and equipment and considering water use will be needed to further decrease environmental impacts.

1. Introduction

The building sector accounts for 36% of the EU’s final energy consumption and almost 40% of total direct and indirect greenhouse gas emissions [1]. Decarbonizing this sector is crucial to achieve the objectives set by international climate agreements [2] and to maintain the earth in a safe operating space [3,4,5]. This involves improving our construction standards to a net zero emission performance. However, analyzing the roadmaps for achieving climate targets in different regions of the world shows that achieving Zero Carbon and Energy Buildings (ZCEBs) by 2050 is still problematic [6,7]. These roadmaps rarely consider embodied emissions due to complexity, e.g., related to emissions outside national boundaries. Literature proposals for the Zero Energy Building definition also tend to focus only on operational energy use, see for instance [8].
At the EU level, where low emissions are targeted, the Energy Performance of Buildings Directive (EPBD) has defined a zero-energy building target [1]. This is a positive initiative, though considering embodied carbon emissions remains important, as they can amount up to 75% of the total life cycle in net zero-energy buildings [9]. The concept of a zero emission building is still progressively becoming the target [9] and has even been extended to the neighborhood level [10,11]. Several definitions have been suggested for (net) zero carbon buildings and are thoroughly described and analyzed in [12]. The authors have identified large variations in methodological options (e.g., “system boundaries for both operational and embodied GhG emissions, the type of GhG emission factor for electricity use, the approach to the “time” aspect, and the possibilities of GhG emission compensation”). They finally acknowledge the unavoidable discrepancies among the ZCEB definitions across countries but urge the account of embodied carbon emissions and recommend the use of dynamic marginal electricity factors.
The design of ZCEBs remains highly dependent on the local context, e.g., availability of low impact materials, access to clean power or heat, and on-site renewable energy sources (RES). As a consequence, achieving a ZCEB could be close to impossible [13,14]. Aside from technical barriers, legislative, cultural and financial barriers have also been revealed in other countries, such as the UK [15]. Education and sensibilization aiming at applying Sustainable Development Goals in professional practice [16] are important, as well as combining qualitative and quantitative methodologies [17].
Life cycle assessment has been applied to buildings for a long time, and several reviews highlight the profusion of methods, data and accessible tools [18,19,20,21]. Some authors have even specifically reviewed consequential LCA in the building sector [21], which has been considered the more relevant methodological approach in an eco-design context [22]. The possibility of evaluating a consistent set of environmental indicators allows progress toward zero GhG emission building without degrading other environmental problems. It is mostly used in a comparative way, although recent efforts have been made to progress toward an “absolute” environmental evaluation [23,24], based upon the planetary boundary concept initially developed by Röckström and Steffen [3,4]. Combination with optimization strategies is recent and so is combination with the planetary boundary concept [25]. Zero emission buildings and districts are not always evaluated through a life cycle perspective, as explained by Brozovsy et al. [11].
Using wood or other bio-based materials is seen as one efficient solution to decrease embodied GhG emissions [26,27] and progress toward a circular economy [28]. Accounting for biogenic carbon is still a vivid debate among LCA researchers and practitioners, as various strategies coexist [29,30,31], and none are fully consensual. Some methods go up to complex modelling [32] integrating e.g., rotation period [33] or forestry carbon budget [34] but are not fully operational yet. Proper management of existing forests and forest landscape restoration (FLR) can be a relevant means for carbon storage and timber production [35].
Progress has also been made in decarbonizing building materials (e.g., cement, steel) through emission reduction and carbon capture technologies [36,37,38]. Despite higher costs, carbon capture can be made operational through economical circular CO2 recovery [39], which would ease the achievement of zero carbon buildings.
Based upon previous works addressing zero carbon and energy efficiency objectives, assessment methods, design approaches and technical aspects, this paper attempts to answer the following research question: is it technically feasible to reach a net zero GhG emission balance in a building over its life cycle, and which techniques need to be implemented towards this objective? The available solutions and existing challenges are analyzed. The possibility of offsetting remaining emissions by carbon capture and storage (CCS) or soil and tree sequestration is explored. The method aims to pave the way towards planetary-boundary compliant buildings, starting with climate change and net zero emissions buildings in a case study. The order of magnitude of emissions offset in the case of a residential building, typical of new construction in France, is evaluated through an original prospective and consequential approach. Other types of buildings can be studied by applying the same methodology.
This article is structured as follows: first the method is presented, then the case study, including the improvement possibilities of the building envelope (insulation and windows), the choice of materials (structure, inertia and insulation), and the choice of equipment (heat pump, solar collectors, etc.). The results for the energy and environmental assessment of the actual vs improved building are then presented and discussed in a separate part. Description of the methods includes the energy simulation procedure as well as the life cycle assessment framework and hypothesis. The results include the analysis of the building’s emissions as well as possible offsetting to achieve a net zero emissions balance at the building and further at the national scale. Sensitivity to data quality and uncertainty is explored in a specific discussion section.

2. Methods

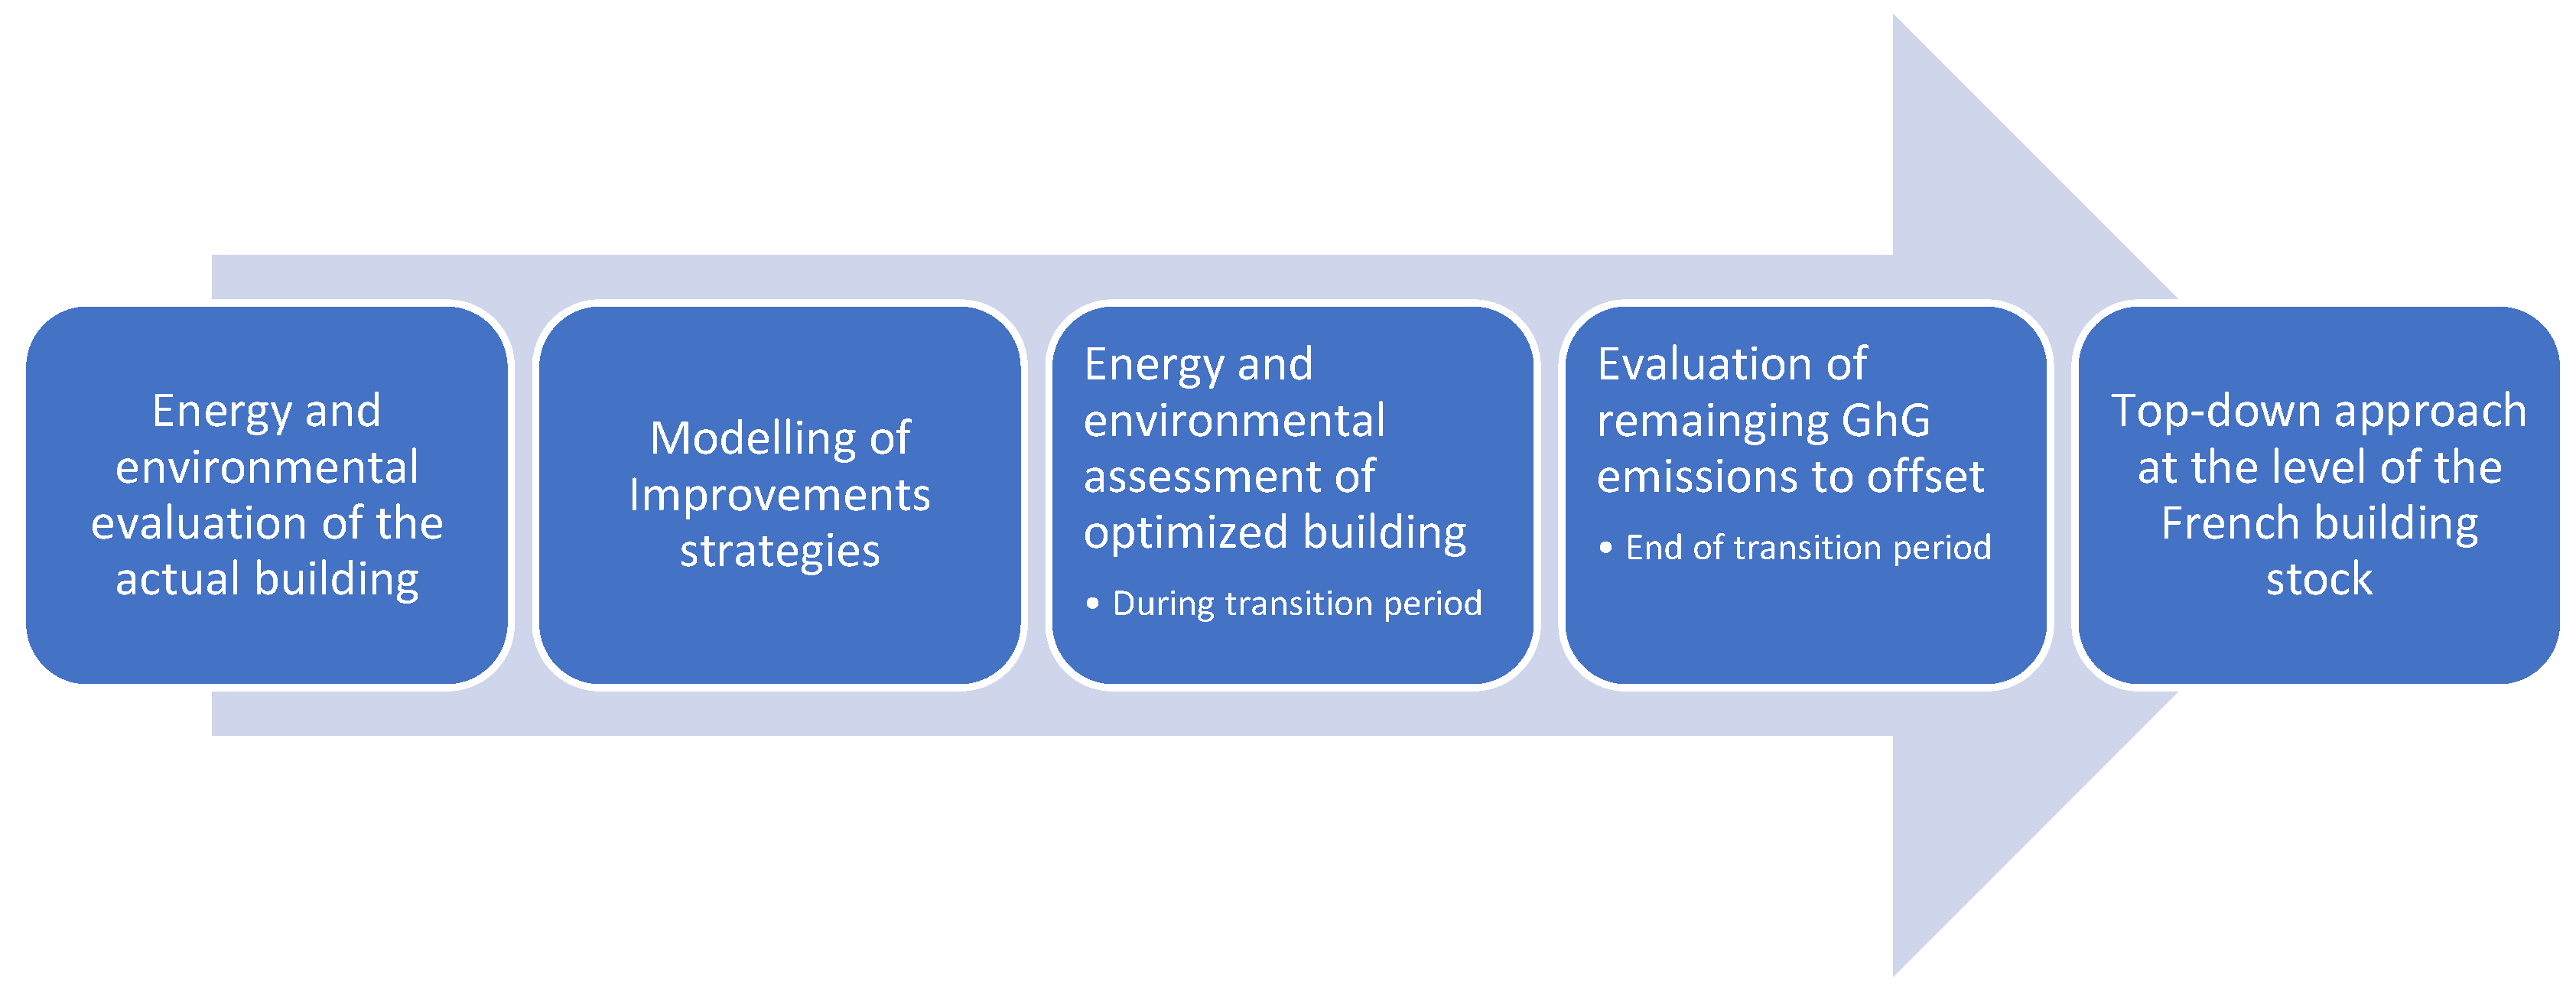
2.1. Methodology Overview

The steps followed for the study are summed up in Figure 1 below. The study was carried out on a low energy gas-heated residential building that was built in 2016 in France. A first assessment is performed on the actual building. Then, alternative design options are studied using energy simulation and life cycle assessment (LCA) in order to evaluate the potential for reducing emissions by optimizing the building (architectural, technological and behavioral choices). The remaining GhG emissions to be offset are then quantified in order to derive the required amount of CO2 to be captured and the feasibility of offsetting by, e.g., tree planting, as well as the possible obstacles to such implementation. Finally, a top-down approach is performed at the level of the French residential building stock to highlight the order of magnitude of emissions to be offset from a carbon-neutral perspective for the sector in 2050.

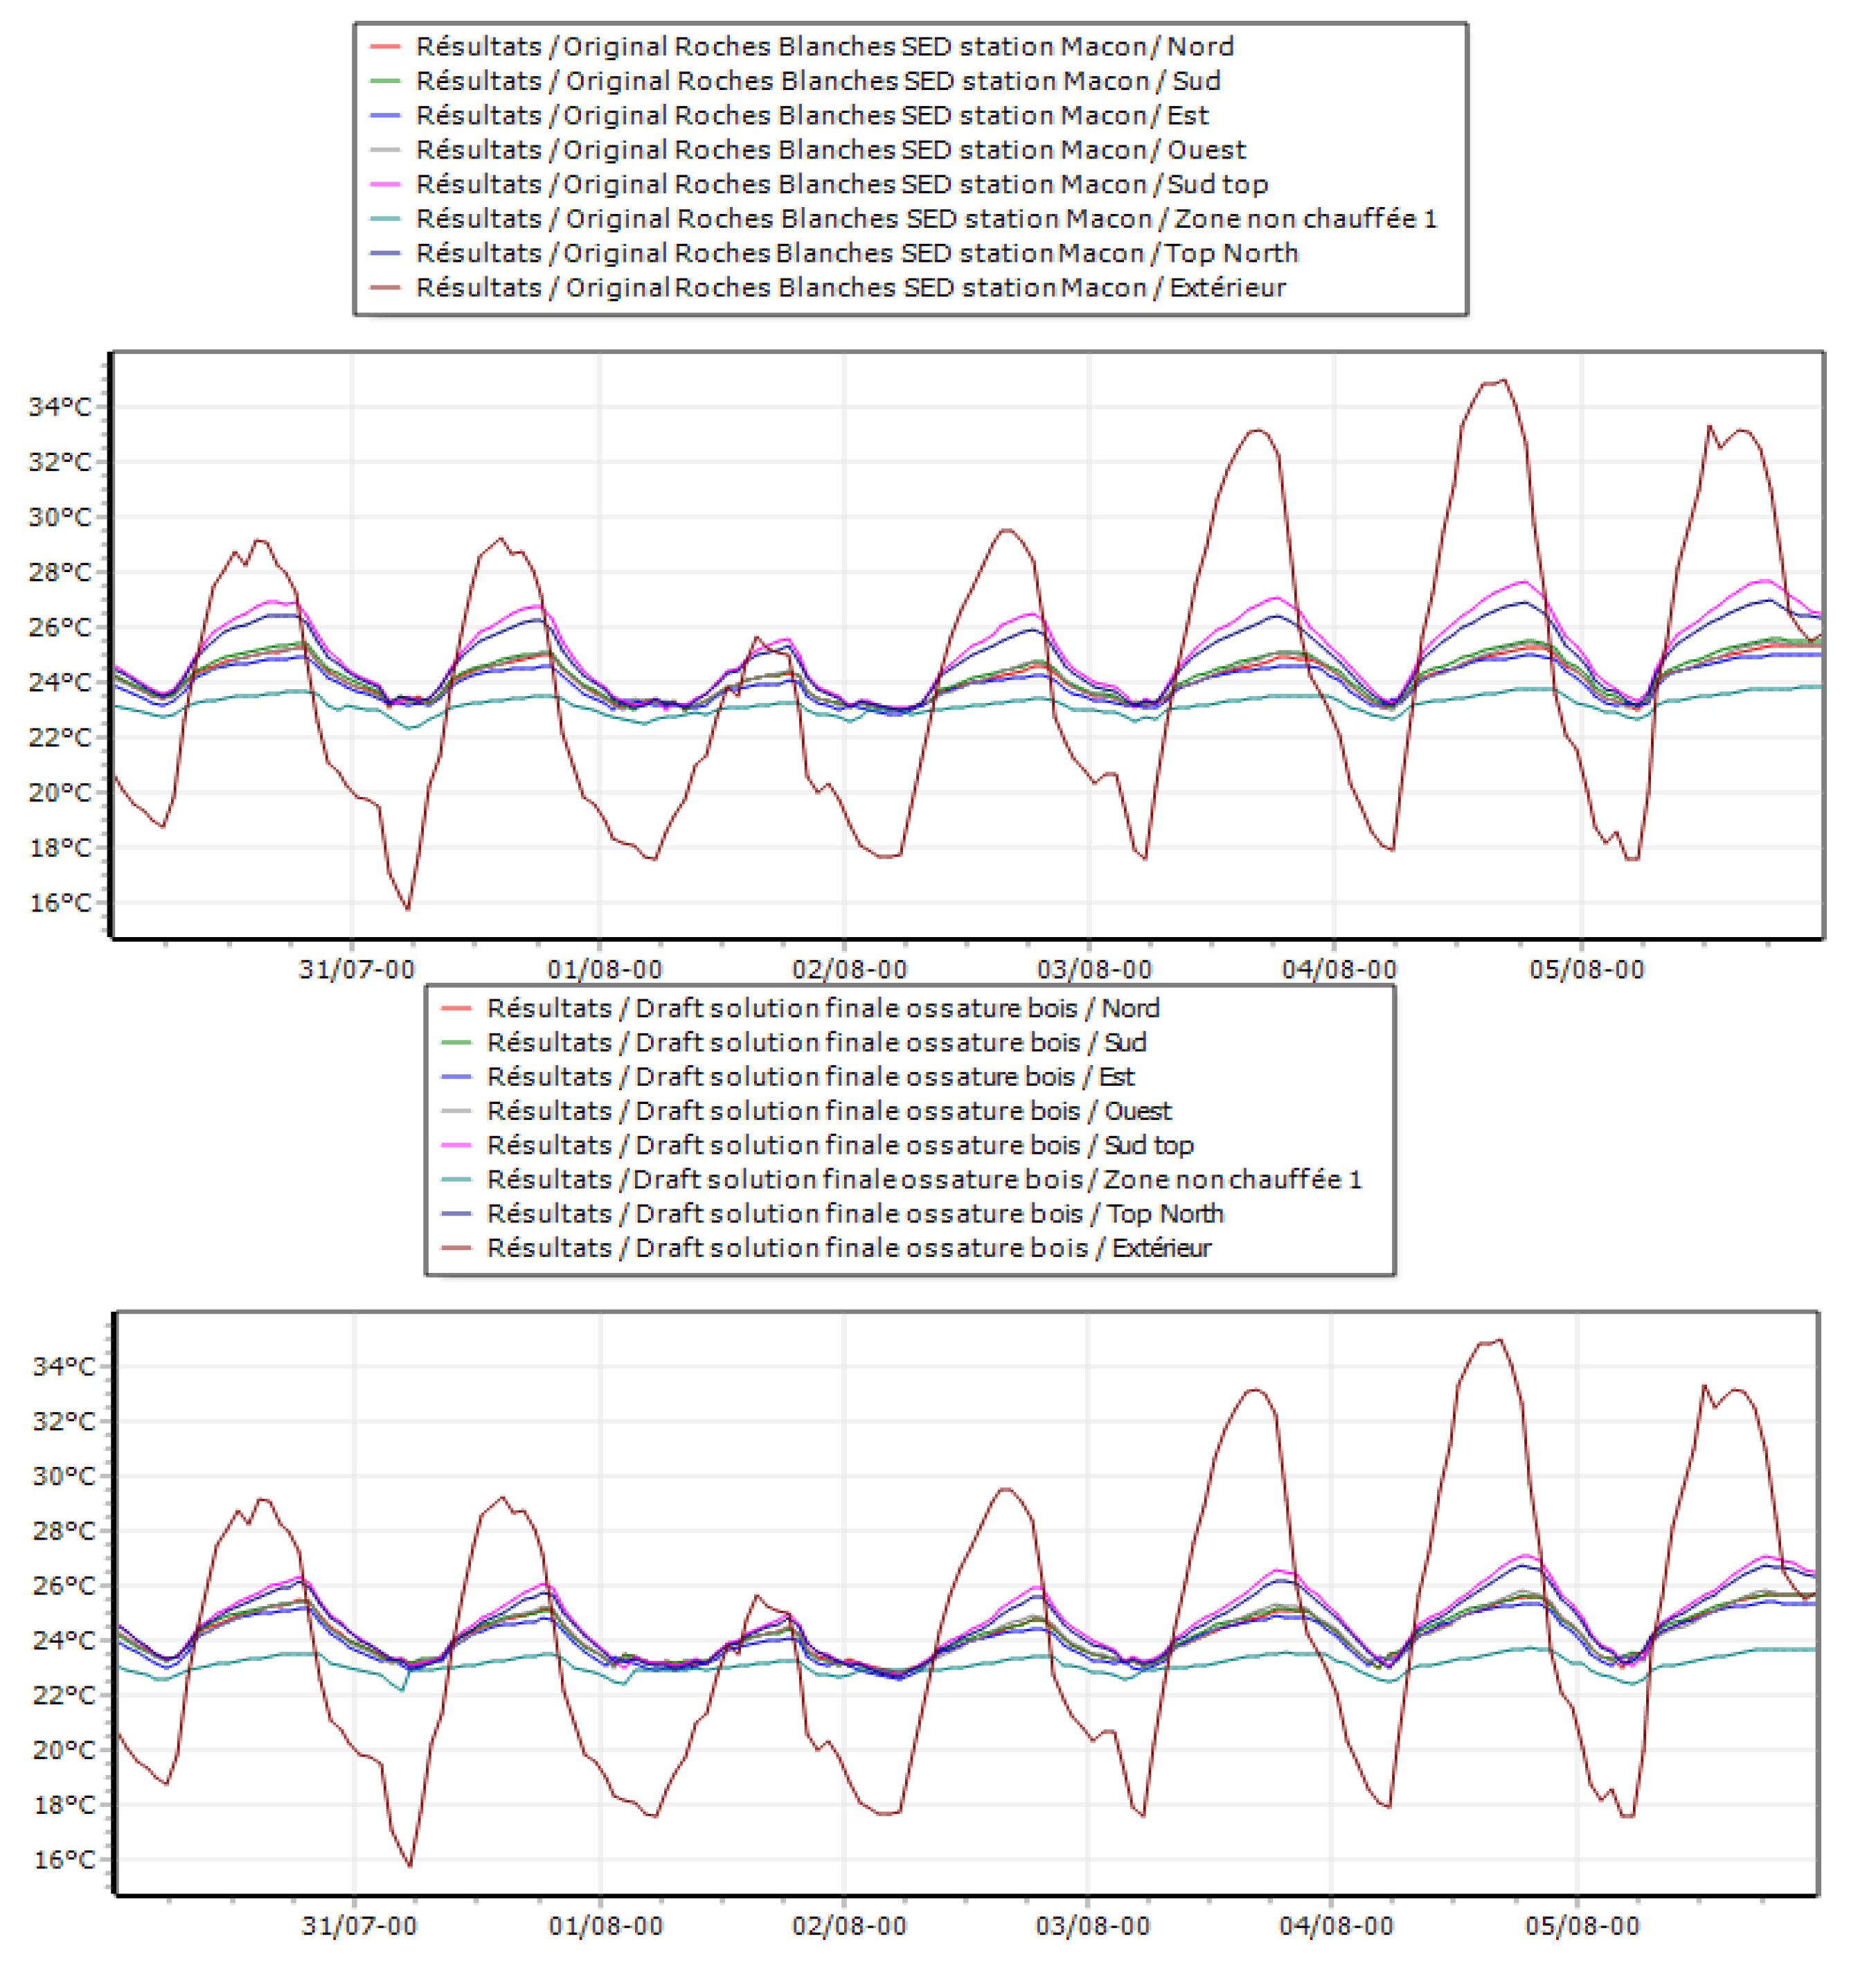
2.2. Building Energy Simulation

Energy performance is studied using the dynamic thermal simulation tool Pleiades STD Comfie [40]. Heating needs and consumption of the building are evaluated during a typical year with hourly resolution, based on thermal characteristics of envelope and systems, the site (climatic data, near and distant shading), occupancy scenarios (temperature set-point, internal heat gains corresponding to electricity consumption, domestic hot water (DHW), occupancy, etc.). The model is based on the concept of a thermal zone, a subset of the building considered with a homogeneous operating temperature. A finite volume discretization mesh is used. For each zone, the walls are divided into nodes that are sufficiently fine to be considered at a homogeneous temperature and an additional node corresponding to the air volume, furniture and light interior partitions. A heat balance is applied to each node, which can be represented at the zone level by a continuous and invariant linear system.
A modal reduction method is applied to each zone model to reduce the computation time. The reduced matrix systems of the zones are grouped by a coupling procedure. The outputs at each time step are calculated as a function of the indoor (heat gains from occupants and equipment) and outdoor (outdoor temperature, solar radiation) driving forces of the building. Non-linear phenomena (ventilation) or variable parameters (additional resistance due to shutters) are taken into account by correcting the driving force vector. Model reliability was evaluated by comparison with real data [41] and by the international BESTEST procedure for numerical comparison of reference models [42,43].

2.3. Life Cycle Assessment

2.3.1. Tools and Database

Pleiades LCA Equer is used for the life cycle assessment according to the ISO 14040 and 14044 standards [44,45], allowing the quantification of the environmental impacts of a building over its life cycle according to multiple indicators. The Equer database provides information on the environmental impacts corresponding to a functional unit of a product, process or service according to several indicators. It is created using the Brightway2 framework [46] and the ecoinvent database [47,48] version 3.8 using a wide range of life cycle impact assessment methods. Unit process data are contextualized to the French context (e.g., regarding electricity production). The reliability of Pleiades LCA Equer has been studied by inter-comparison with other software in several research projects. The results showed good overall reproducibility, but discrepancies can arise from inventory data sources and methodological differences, e.g., allocation and accounting for biogenic carbon.

2.3.2. Main Assumptions

The functional unit considered for the case study is 1 m2 of an apartment building housing 0.04 occupants per m2 over one year, according to the occupancy scenarios shown in Table 1. A lifespan of 100 years is considered for the building (10 years for building finishes, 20 years for equipment, 25 years for PV modules and 30 years for windows). LCA is carried out under the conservative assumption of identical replacement of an element at the end of its lifespan.
An hourly resolution model is used for the electricity production mix, considering a consequential LCA approach. This approach is appropriate for buildings exporting electricity to the grid (photovoltaic generation) as it considers the complex interaction of the building with the grid, assuming that exported electricity avoids production by marginal generation technologies. Prospective scenarios from RTE (French electricity Transmission System Operator) and ADEME (French environmental agency) were considered for 2025, 2035 and 2050 [49]. To represent a 100-year life span, the 2025 mix is considered for 5 years, then 25 years for 2035 and 70 years for 2050. This calculation therefore corresponds to a transition period, and the indicators expressed per year correspond to a yearly average of the impacts over the building life cycle. The energy simulation results were used to evaluate the heating load and thermal comfort. In addition to the 40 L of hot water consumption, an average cold water consumption of 100 L/person/day is considered as well as wastewater treatment. The transport of occupants and domestic waste are not considered.
The end of life considered is the recycling of metals, photovoltaic systems and recyclable materials (e.g., concrete is crushed to produce aggregates). Plastics are incinerated and biobased materials are treated at the end of life so that biogenic carbon can be stored for a very long time. The rest are considered inert waste and sent to landfills.

2.3.3. Environmental Indicators

Because this article focuses on GhG emissions, the climate change indicator is the main focus. It is evaluated using the Environmental footprint v3.0 method developed by the JRC [50]. But damage indicators on human health, ecosystems and resources are also evaluated according to the Recipe 2016 method [51].

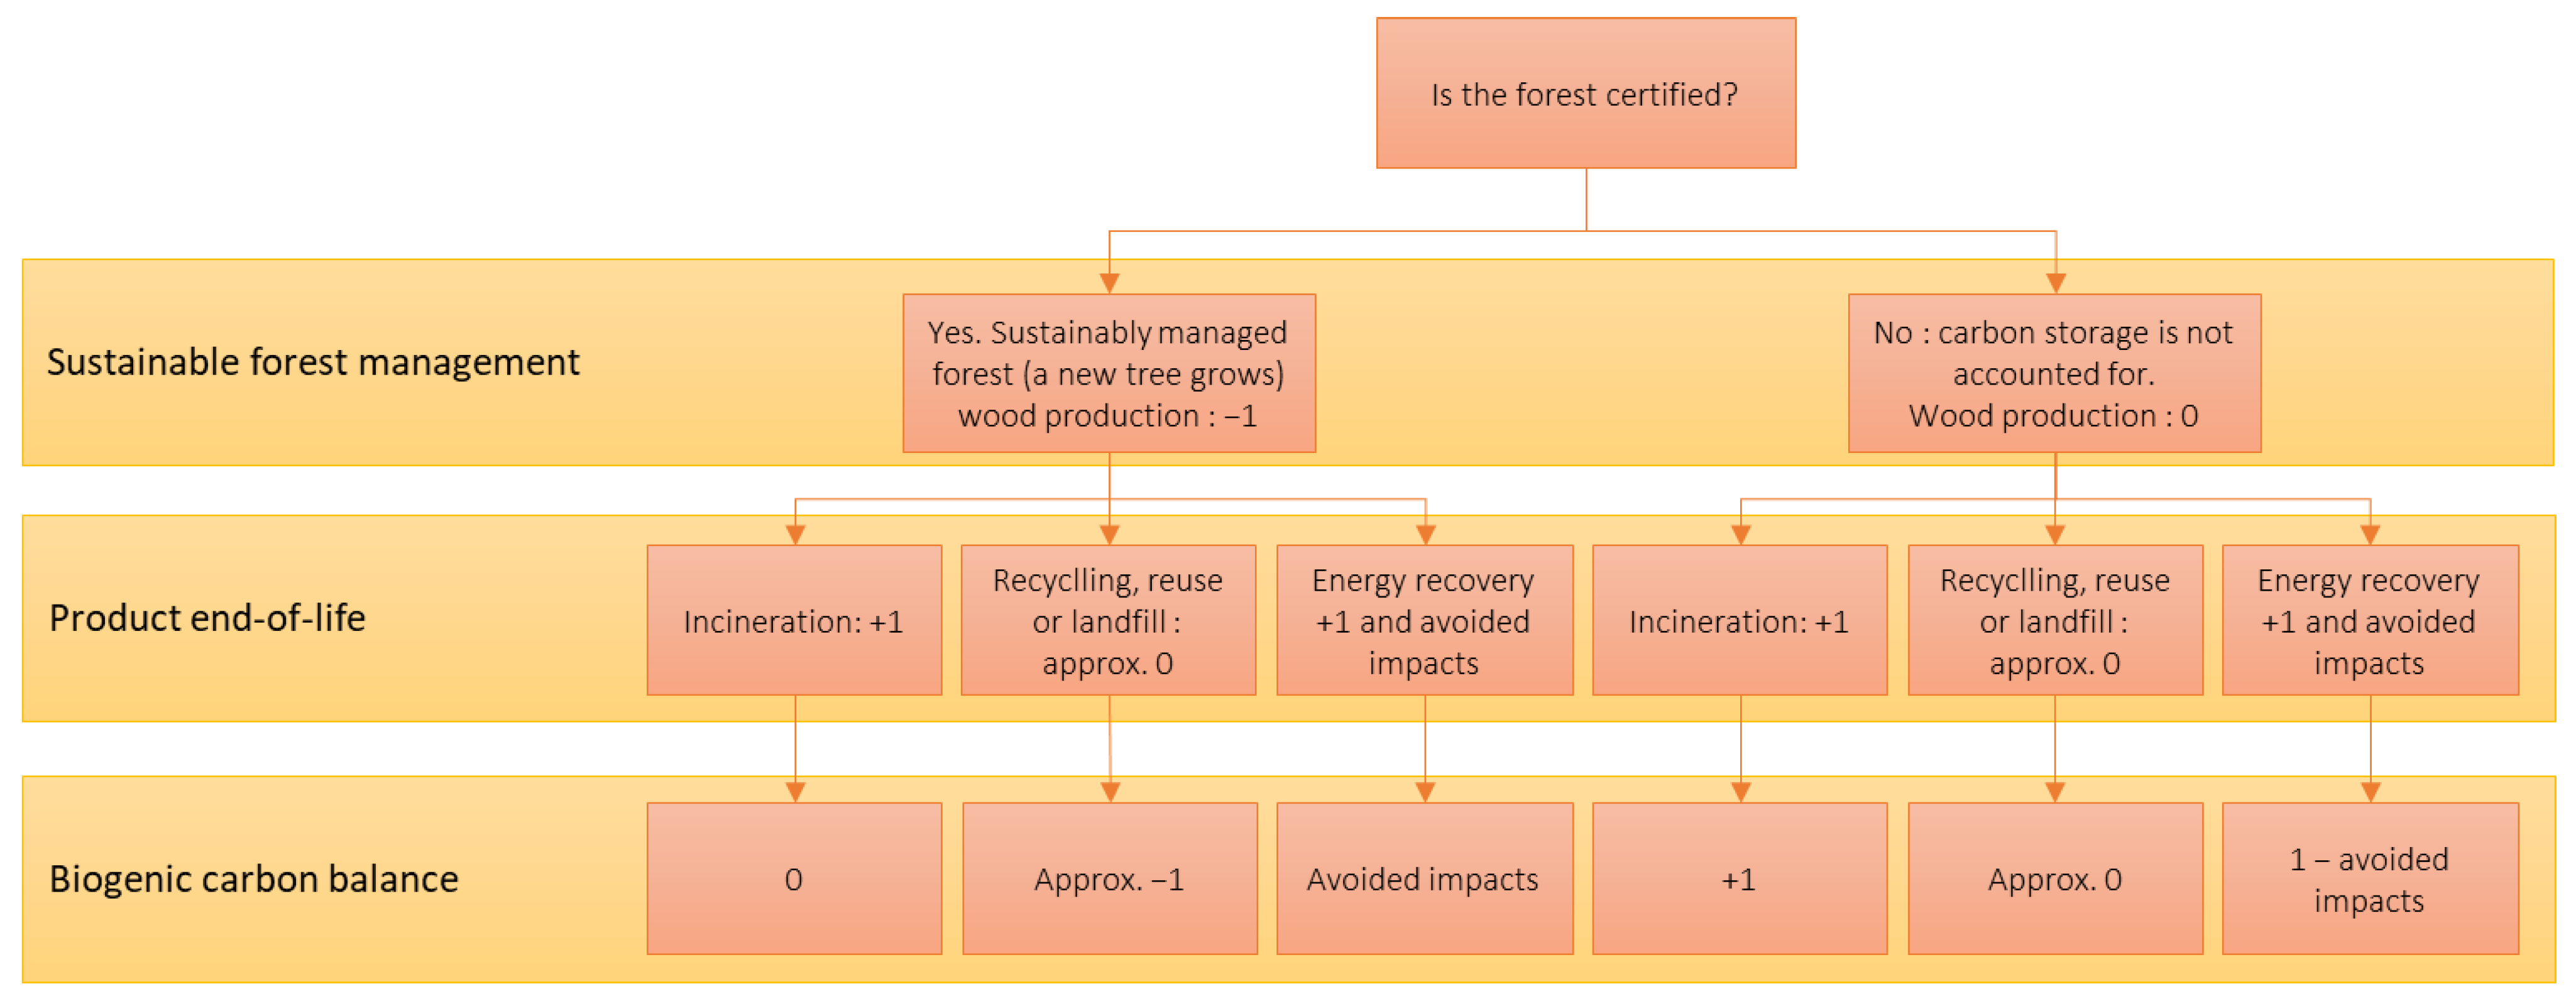
2.3.4. Consideration of Biogenic Carbon

In the EQUER method, negative biogenic CO2 emissions are accounted for in the production stage if a new tree is growing, which is the case for wood from certified forests. But if the wood stems from non-certified forests, the same amount of carbon is stored in the building as if it were stored in the forest. Therefore, no carbon fixation is considered (“0” instead of “−1” according to the notation of EN 15804 standard [52]). At the end of life, the quantity of biogenic CO2 is emitted if the wood is incinerated but not if the wood is landfilled or recycled (see Figure 2). Landfilling can delay emissions for a very long time, according to [53].

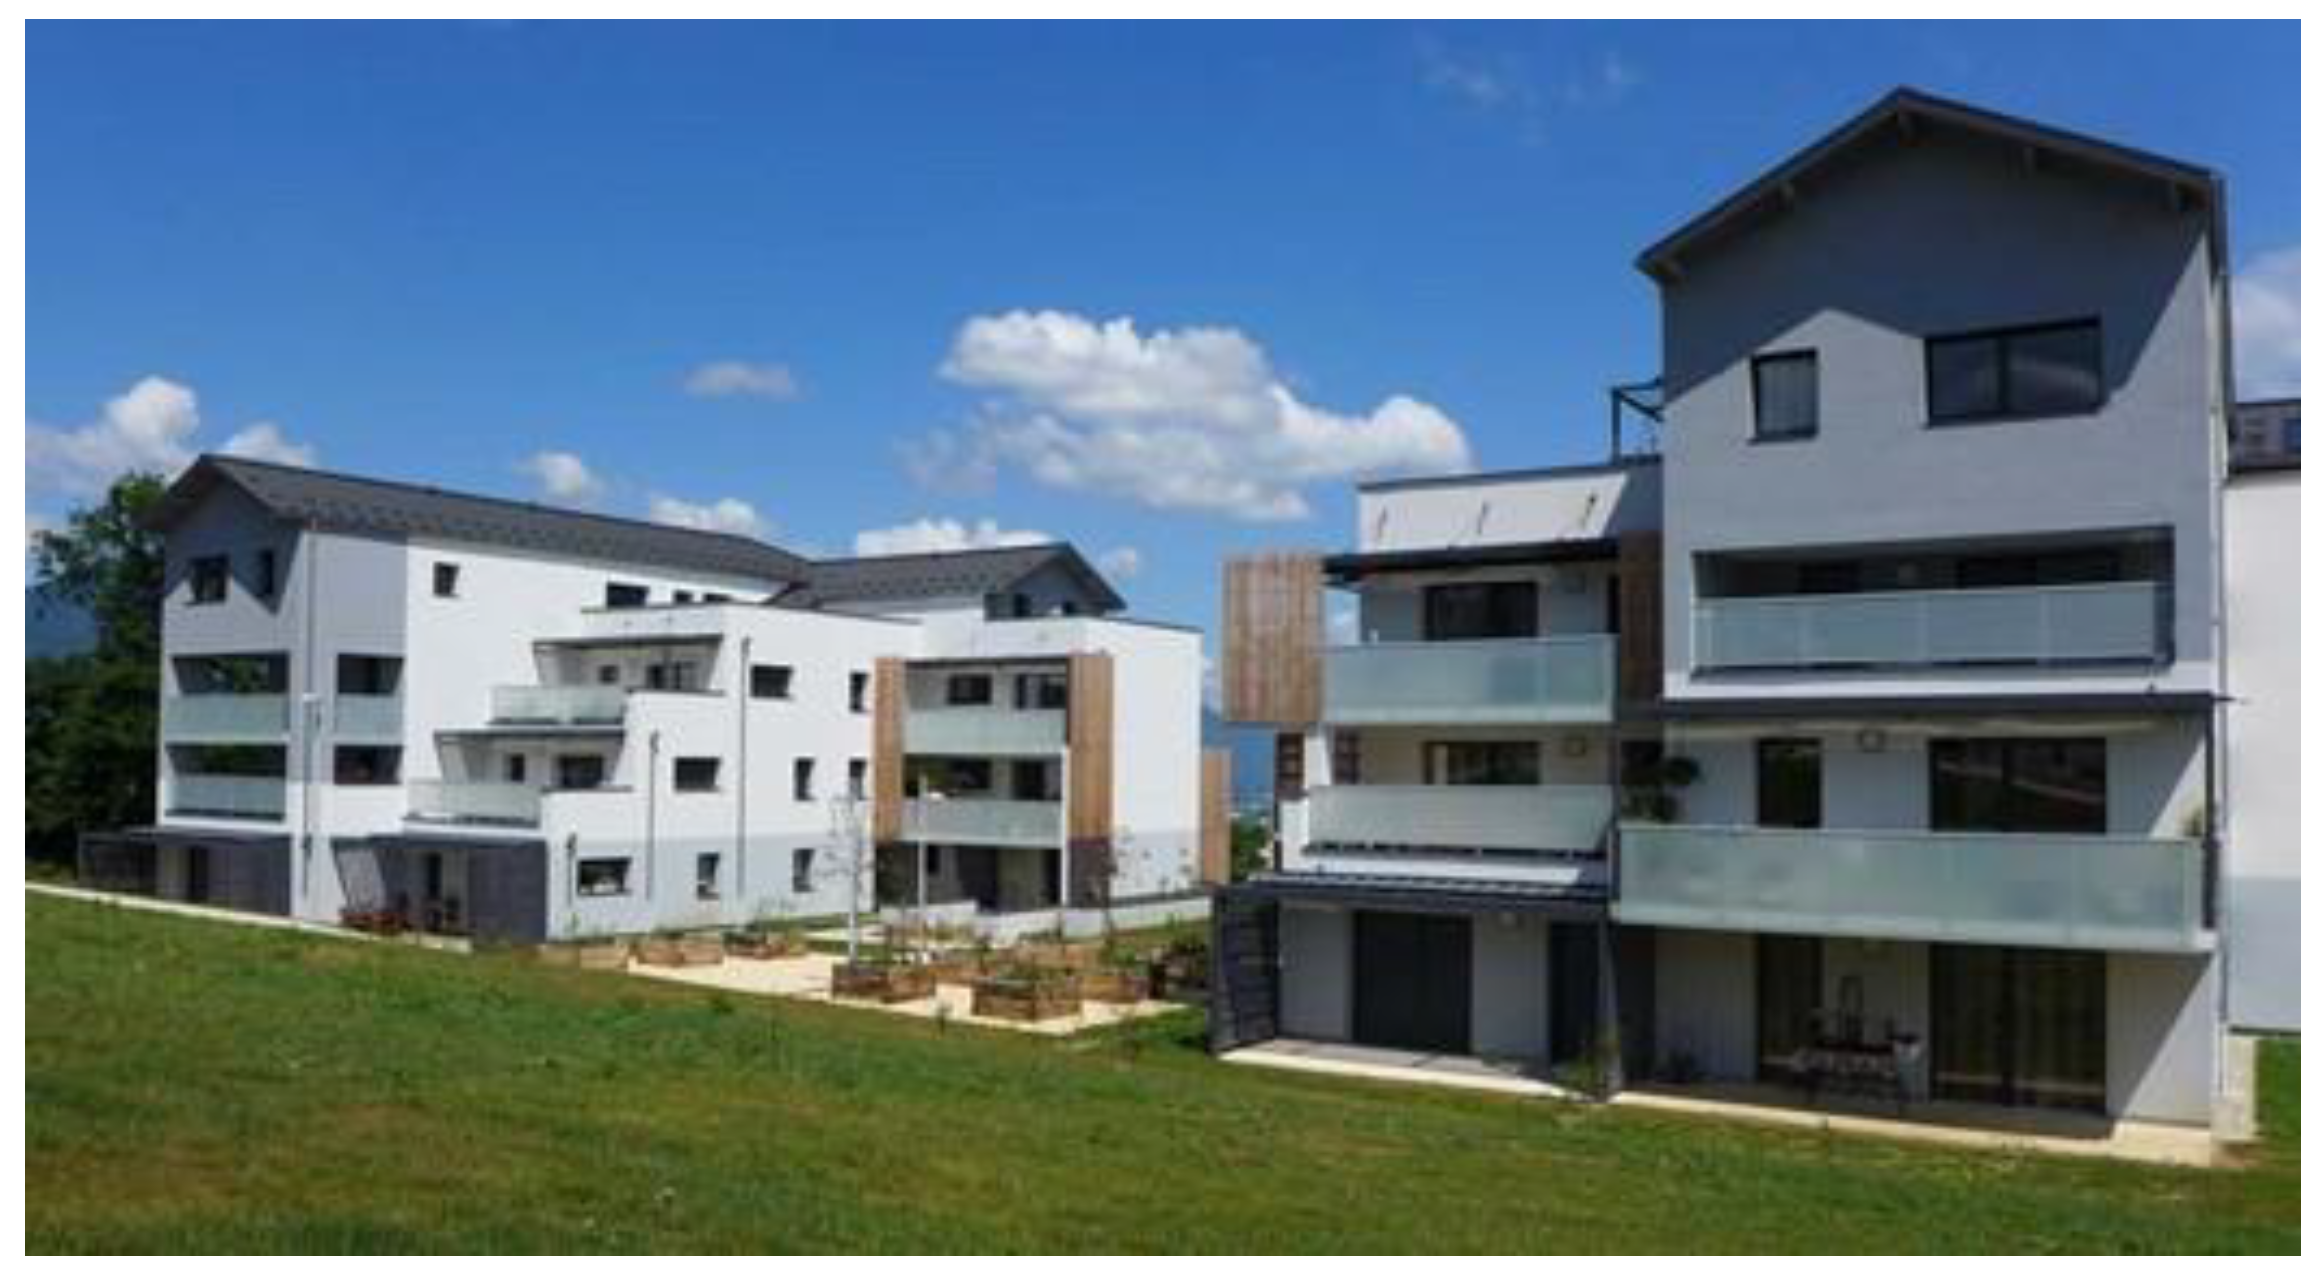
2.4. Case Study Presentation

The residence Les roches blanches, located near Chambéry (Savoie, France), is composed of two low-energy apartment blocks built in 2016, each with 4 floors and 17 flats of different sizes (Figure 3). The total living area is 2414 m2. The buildings have a concrete structure with external insulation (18 cm of rock wool on the walls, 30 cm on the sloped roofs and 30 cm of polyurethane on the flat roofs) and low emissivity double glazed windows. Space heating and domestic hot water (DHW) production are provided by a gas boiler. Ventilation is provided by a humidity-sensitive double flow ventilation system (exchanger efficiency: 80%). Climatic data correspond to a typical year in the region (Macon, France).
The considered scenarios of temperature set points, occupancy, domestic hot water (DHW) consumption and heat gains corresponding to specific electricity consumption are defined in Table 1.
Table 1. Occupancy scenarios.
CategoryScenario
Heating temperature set point20 °C (constant over the year)
OccupancyHourly scenario based on a stochastic model of occupancy developed by [54]
Internal gainsHourly scenario based on a stochastic model of occupancy developed by [54]
Domestic hot water40 L/day/person at 55 °C

2.5. Improvement of the Building

Starting from the actual building, an improved building model has been derived in order to evaluate a potential reduction of GhG emissions. Three main elements are considered: the structure and envelope of the building, heating and ventilation equipment, and the renewable energy system. The principle is first to decrease material and energy needs, then to improve energy efficiency, and finally to cover energy needs as much as possible through renewable production. Each improvement is evaluated using the energy simulation and life cycle assessment tools presented above.
The concrete structure of the actual building was replaced by timber frames (walls and roofs), and low carbon concrete was used for the foundation as well as the suspended floor. The intermediate floors remained in low-carbon concrete in order to add thermal mass to the wooden structure and improve summer comfort. A thin layer of raw earth was put on the walls and roofs for the same purpose. The insulation of the wooden walls and roof is made of 23.5 cm wood wool. The wood used in the construction is assumed to be grown in sustainably managed forests. The gas boiler for heating and domestic hot water (DHW) has been replaced by a geothermal heat pump (cop: 3.5 for heating; cop: 2.7 for DHW). Solar thermal collectors for DHW have been installed (140 m2) providing most of the needs, complemented with the heat pump backup. The heat exchanger efficiency of the ventilation system has been increased from 80 to 85% in order to reduce heat losses.
Double glazing is replaced with triple glazing, except on the south facades in order to improve the insulation while providing high solar gains. Night ventilation by window opening is considered to improve summer comfort and blinds were installed with 80% reduction of solar factor during the summer on the parts most exposed to overheating. A 176 kWp photovoltaic system was set up on the roofs and southern external facades of the building in order to offset the carbon emissions of the electricity consumption (heating and DHW backup, lighting, ventilation and domestic appliances), taking into account the electricity production mix with higher emissions in winter than in summer.

3. Results

3.1. Energy Simulation of the Actual Building

The results are presented in Table 2. Areal ratios are provided per m2 of net heated area.

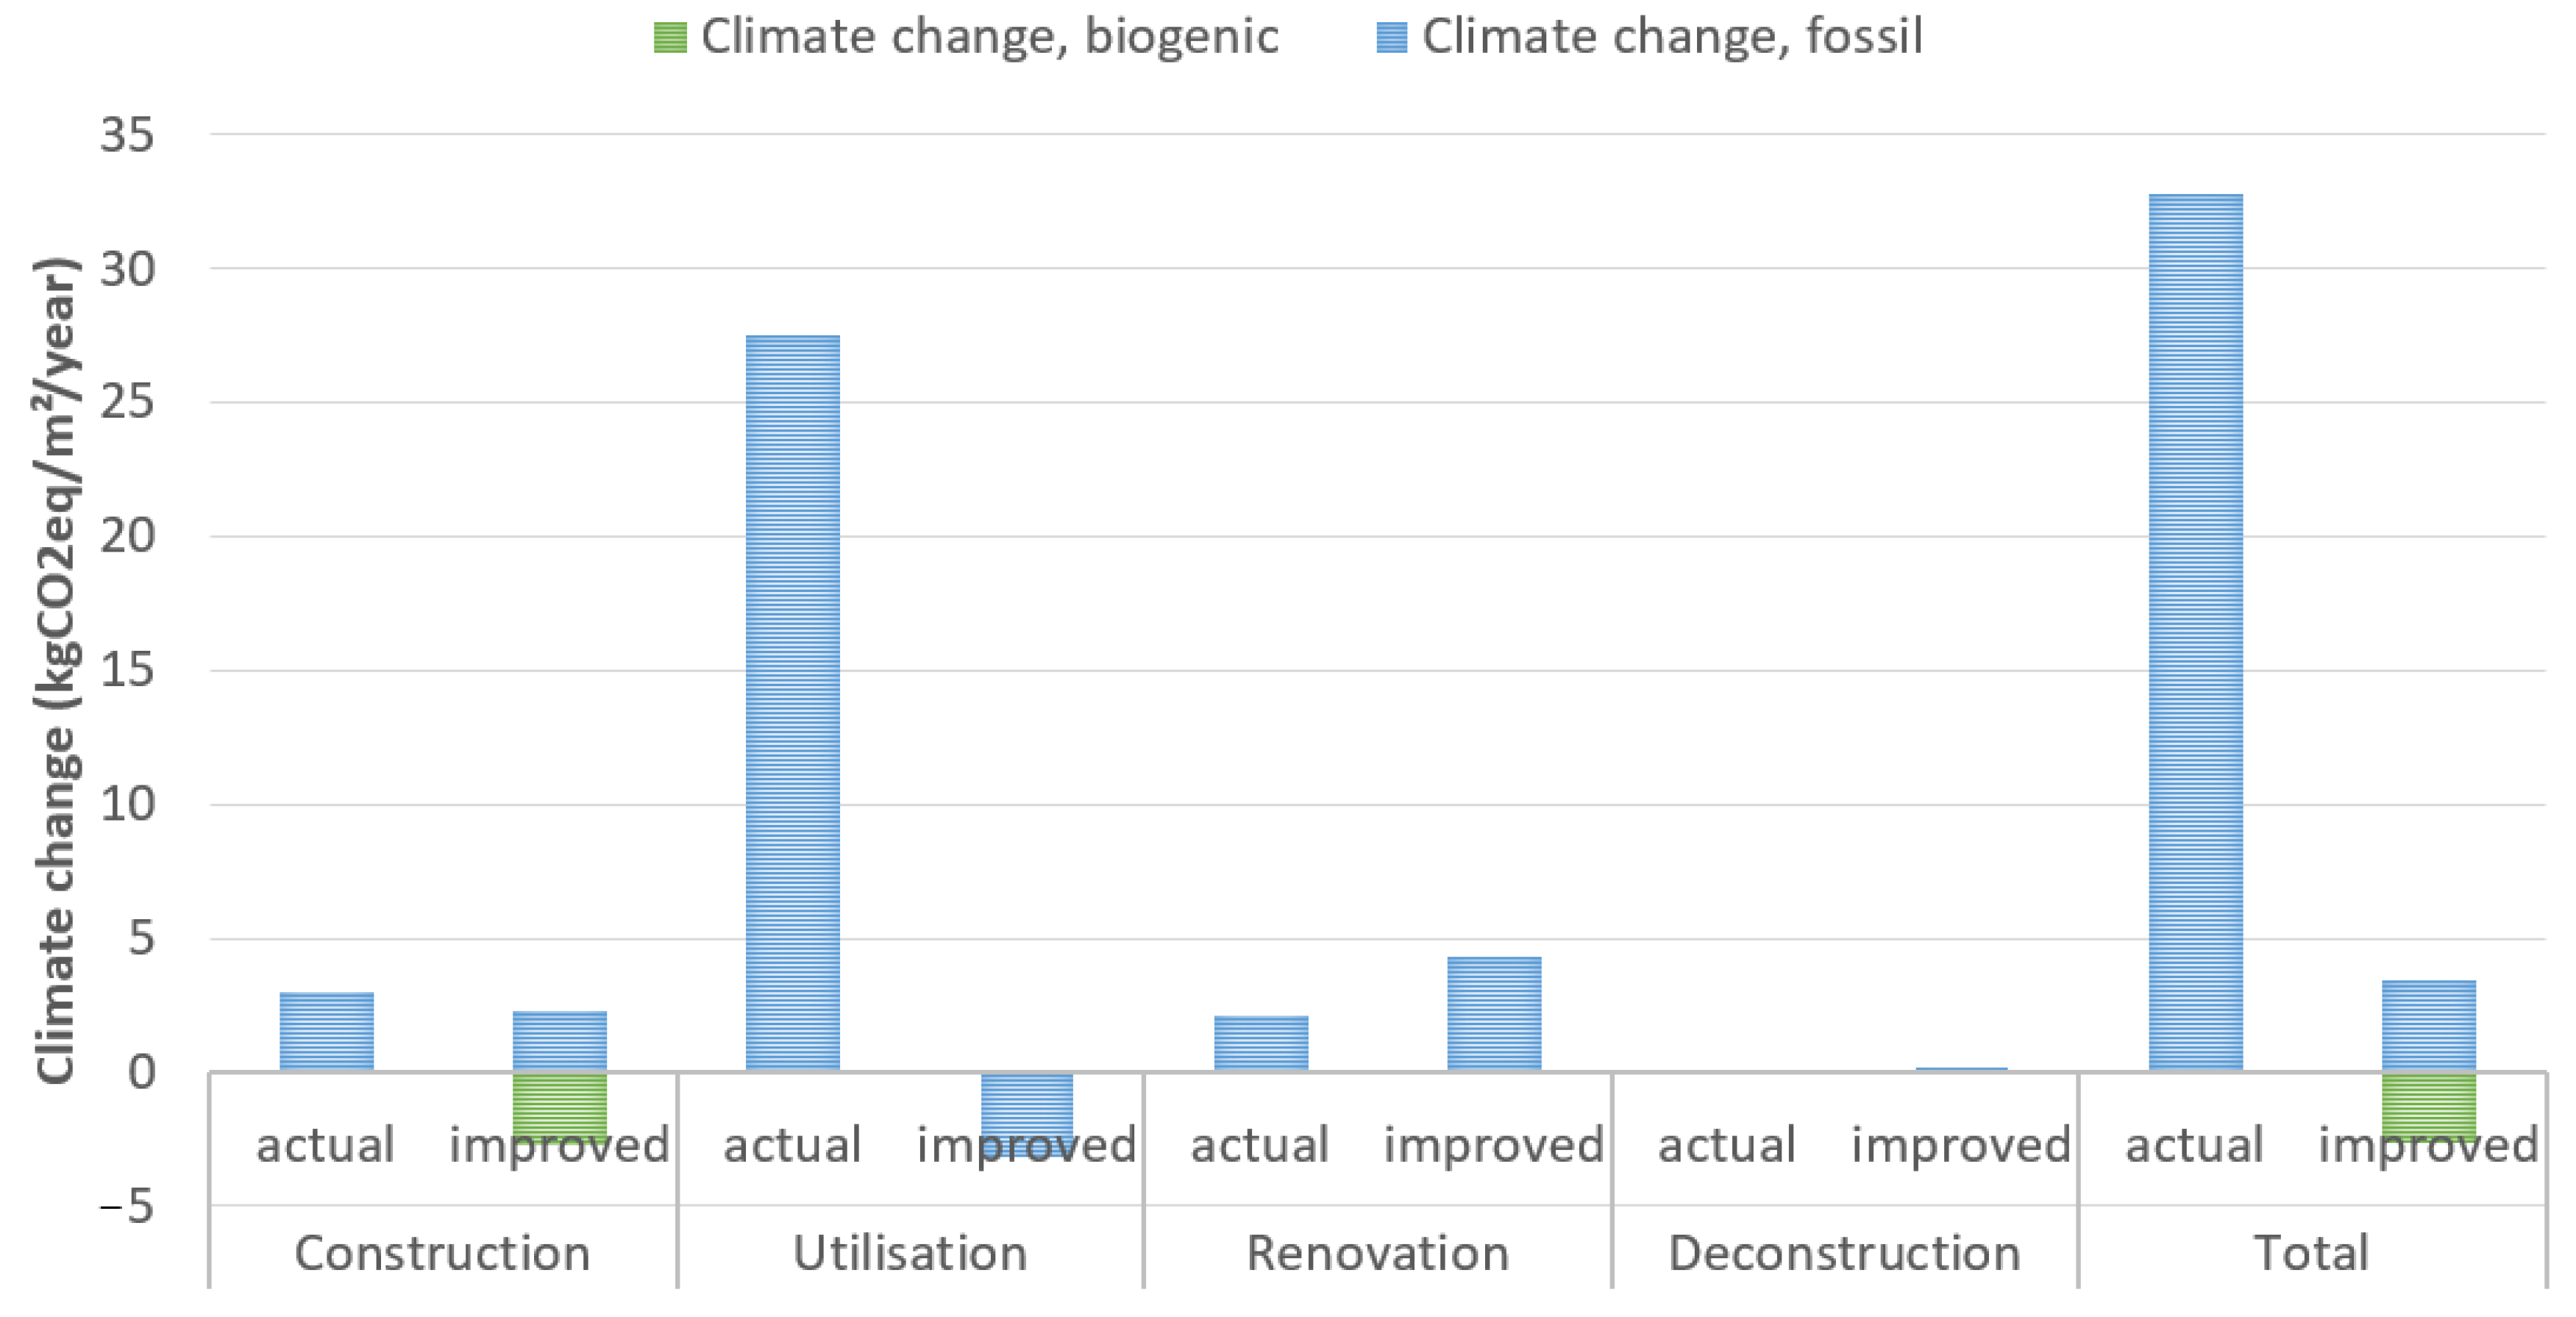
3.2. Life Cycle Assessment of the Actual Building

The environmental impacts in terms of greenhouse gas (GhG) emissions and damage indicators (human health and ecosystems) obtained for the base case (actual building) are given in Table 3, expressed per m2 of net building area and per year so that they can be compared with benchmark references.
The total climate change impact is around 33 kg CO2 eq/m2/year. By comparison, these emissions vary between 10 kg CO2 eq/m2/year (passive building with a photovoltaic system) and 160 kg CO2 eq/m2/year (uninsulated old building heated with gas) in a benchmark study performed in the frame of International Energy Agency Annex 72 [55]. The largest emissions correspond to the use stage, as can be seen in Figure 4.
The objective of this case study is to investigate the feasibility of achieving net zero carbon emissions through eco-design measures, such as the use of bio-based materials, minimization of energy requirements and the use of low-impact energy sources, as well as the sequestration of the remaining emissions.

3.3. Energy Simulation of the Improved Building

Energy requirements were minimized, as shown in Table 4.
Summer comfort has also been studied. The increased thermal mass of the building, night ventilation and blinds have improved the comfort level, despite an overall lighter timber frame structure compared to the actual building. Aside from its importance for building quality, assessment of thermal comfort is crucial to prevent future usage of active cooling, which could downgrade the overall environmental performance of the building because of increased energy consumption and additional equipment. Figure 5 illustrates the effect of night ventilation, which allows, thanks to the thermal mass of the building and its good insulation to keep indoor temperature below the external one during hot periods. The choice of thicknesses of materials with high thermal mass (concrete floors, raw earth) in the improved building was made to maintain the annual temperature between 20 and 27 °C, with a maximum discomfort rate of 1% (percentage of hours above 27 °C or below 20 °C). According to these thermal simulation results, improvements proposed to reduce GhG emissions would not reduce the thermal comfort level of the building.

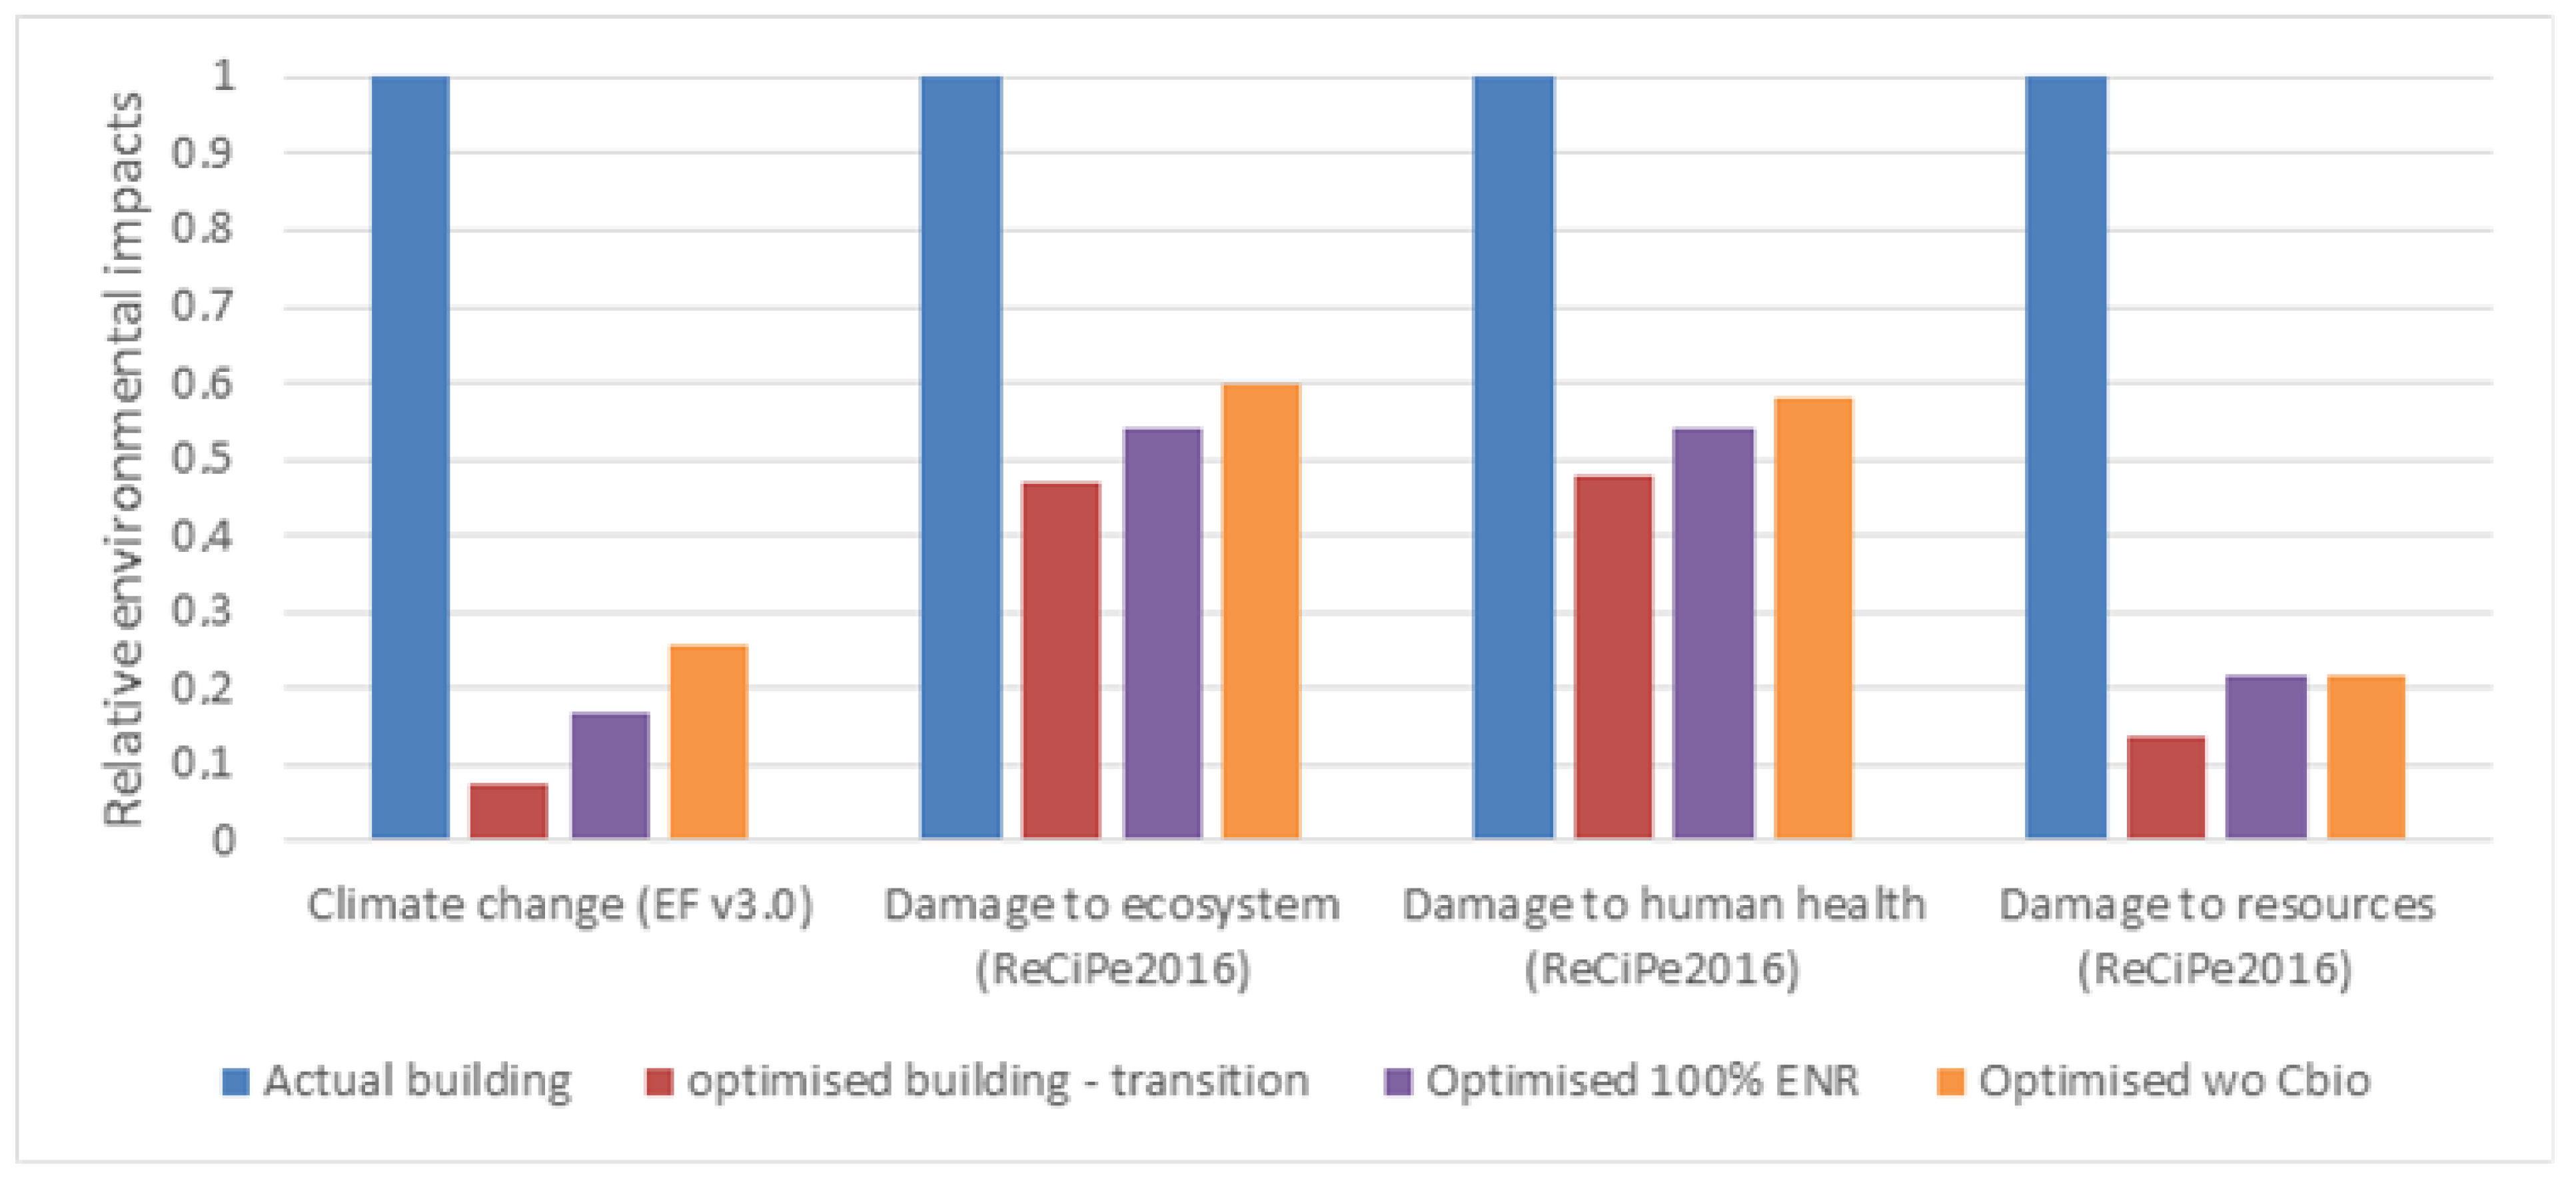
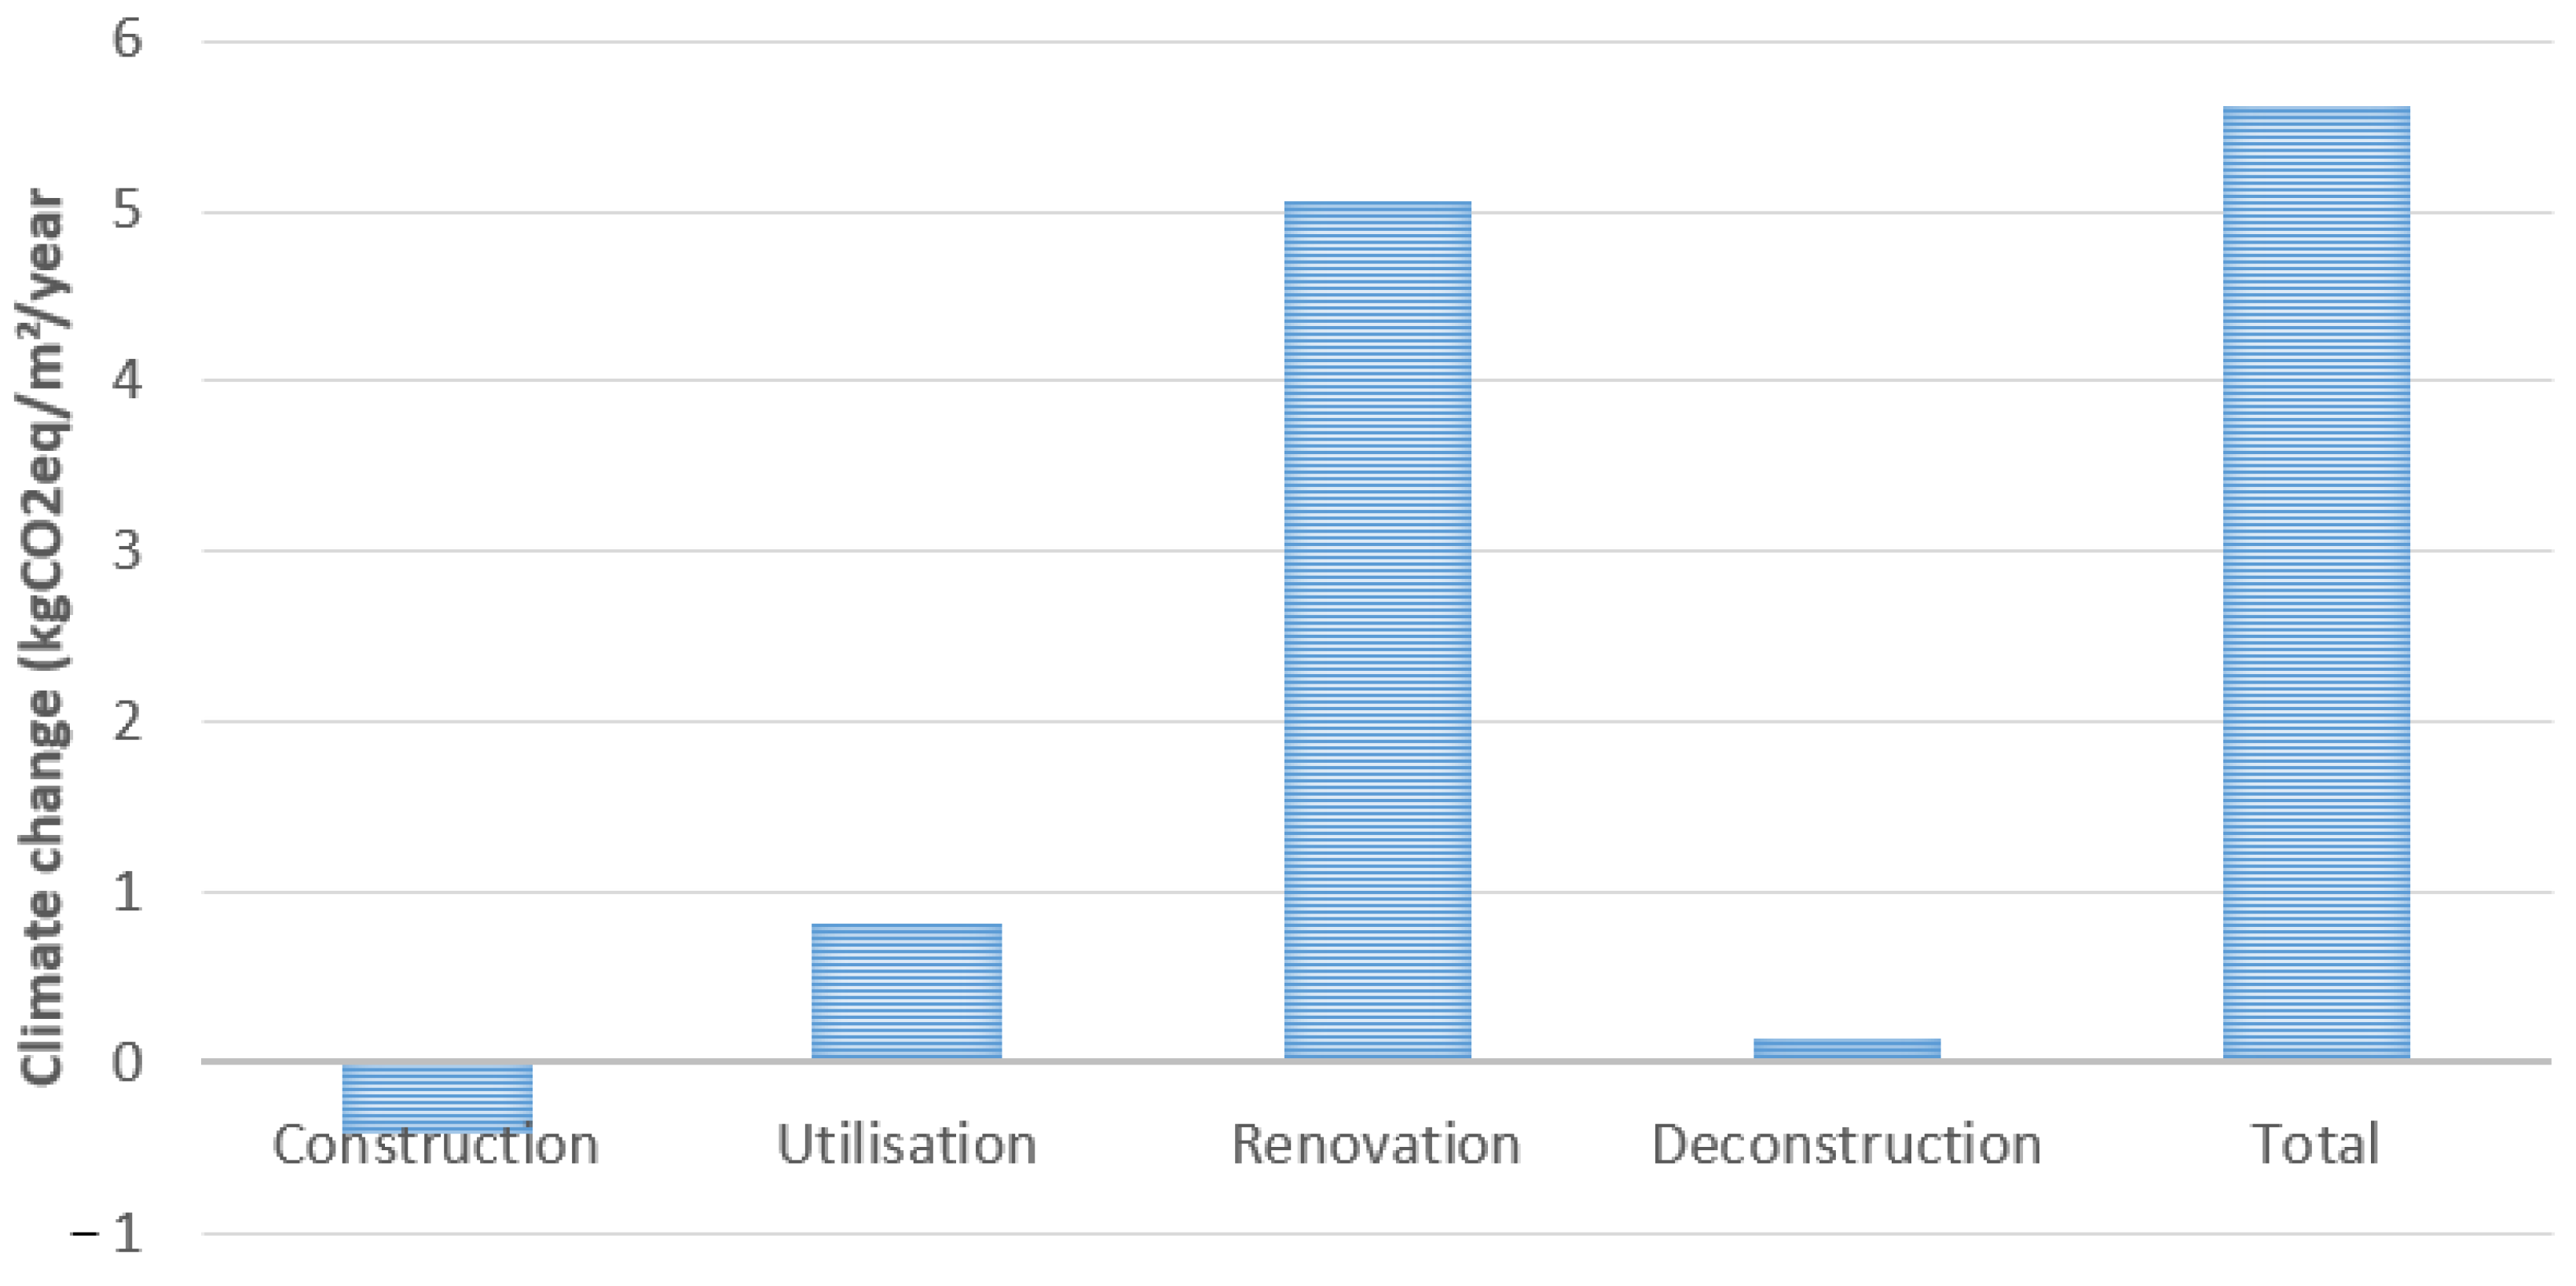
3.4. Life Cycle Assessment of the Improved Building

The results of the LCA study show a potential GhG emission reduction of up to 97% (Table 5) using bio-based materials, minimizing heating needs and using low carbon energy sources through the implementation of appropriate equipment. The choice of a timber frame structure reduces construction emissions from 3.01 to −0.41 kg CO2 eq/m2/year.
A considerable reduction in operational emissions is achieved, made possible by replacing the gas boiler and using renewable energy sources (solar thermal and photovoltaic). The photovoltaic system is oversized in relation to the self-consumption needs to account for the difference between winter and summer grid emissions. Avoided impacts considering marginal production are accounted for, but they become zero when the national electricity grid mix is 100% renewable. The 100% renewable electricity mix considered is taken from the ADEME prospective study [56] and is composed of 63% wind power, 17% PV, 13% hydraulic and 7% thermal REN (waste incineration, biomass and biogas).
Emissions during renovation appear to be the most significant because of the plumbing, electricity cables and other equipment (ventilation, PV system, etc.) that is replaced several times over the lifetime of the building.
All the above measures have allowed a considerable reduction of the total GhG emissions of the building: more than 90% of the emissions have been cancelled compared to the actual building (see Figure 6). But this calculation corresponds to a transition period. It is also useful to evaluate building performance after this transition. In this case, when the electricity grid production is decarbonized, the reduction of emissions becomes 84% (see Figure 7) because there is no avoided impact from PV production anymore (a 100% renewable grid was considered in this scenario). However, GhG emissions due to construction products like plumbing, electrical installation, and equipment (solar collectors, heat pumps, ventilation, etc.) increase the emissions in renovation and make the total balance positive with a higher value than the actual building due to the effect of equipment replacement. The whole life cycle GhG emissions would then be around 5.6 kg CO2 eq/m2/year after the transition period.

3.5. Compensation by Forest Sequestration and Extrapolation to the Dwelling Stock

In order to answer the research question regarding the feasibility of reaching a net zero GhG emission balance in a building, a top-down approach was performed. It consists of estimating a carbon budget corresponding to sequestration in forests, which can be expressed per m2 considering the annual new construction area. The GhG emissions of the improved building can be compared to this carbon budget, allowing us to check if the climate planetary boundary is respected.
There are numerous possibilities for offsetting these emissions by sequestration, including storage in natural ecosystems (vegetation, soil, aquatic environments). Forest sequestration gives the possibility of replanting on the same surface and using wood as a low carbon construction material. Other means of in situ sequestration may also be of great interest, such as vertical vegetation systems (VGS) because of the limitation of external sequestration surfaces (forests, meadows, wetlands, etc.) and the possibility of optimizing the use of unused building surfaces (facades, roofs, etc.) allowing carbon sequestration while providing other positive externalities (e.g., well-being of occupants, cooling of contact surfaces, etc.). The corresponding biomass sequestration potential has been estimated by various studies [57,58,59] and varies between 0.44 and 3.18 kg CO2 eq/m2/year depending on climate, vegetation, life cycle treatment, etc.
From the estimate of the carbon sequestration capacity of European forests given by Lelarge and Birot [60], which is also found in the data of the National Forest Inventory in France [61], we deduce a storage of 1680 kg C/ha/year on average, which corresponds to 6160 kg CO2 eq/ha/year in the biomass and forest soils. For this improved building with 2414 m2 of living space, the balance to be compensated for after the transition period is 13.5 t CO2 eq/year, which would correspond to the equivalent of 2.2 ha of European forest corresponding to around 9 m2 of forest per m2 of living space.
At the scale of the French territory, the number of dwellings built annually is estimated at 390,300 from 2000 to 2021, with an average living area of 90.9 m2 (French Data and Statistical Studies Department [62]. The annual growth of French forests is estimated at 40,000 ha/year according to [63], which corresponds to a 246,000 ton CO2 eq./year carbon budget considering the carbon sequestration estimate given above. If this whole budget could be allocated to compensate for new construction impacts, this would correspond to 7 kg CO2 eq/m2/year which is not much more than the improved building emissions. This means that our construction standards must be radically transformed, and that other compensation solutions must be found because new construction (which includes tertiary buildings) is yearly only 1% of the existing building stock, which produces much higher emissions.

4. Discussion

4.1. Vertical Vegetation Systems

Another way to further reduce emissions in buildings is to use vertical vegetation systems (VGS). Marchi et al. [58] described how they operate using a 5-step model to achieve real carbon sequestration in the soil. A potential of 0.44 to 3.18 kg CO2 eq/m2/year was obtained using this model. The process is as follows: plants growing in the VGS absorb CO2 and use it to form biomass (step 1). Each year, a percentage of the plants in a VGS must be replaced (step 2). The removed plants are sent to a composting facility (step 3). There, some of the carbon is released in the form of CO2 (step 4). The compost is then applied to agricultural soils, where some of the remaining carbon is absorbed by soil bacteria and eventually sequestered in the soil (step 5). The studied building has a total exterior opaque and unused facade area of 2069 m2, which gives a maximum sequestration potential of 910 to 6580 kg CO2 eq/year when fully vegetated. This sequestration does not take into account all the emissions related to the life cycle of the facility but only those from the biomass, for which it would be necessary to consider the emissions due to the fossil fuels and electricity needed to transport the plant residues to the composting facility, the management of the composting facility, and the transport and distribution of the compost produced to the agricultural soil.
Pulselli et al. [57] analyzed a case study considering the production chain up to the installation on a building facade as well as the maintenance of the VGS system and found that these emissions over the life cycle of the installation (here 25 years) can be equivalent to those sequestered by biomass according to the model of Marchi [58] and that it is necessary to take a local and responsible approach to the whole life cycle chain (emissions related to structure, transport, water and plant nutrients) in order not to release as much as the biomass sequestration of the VGS.

4.2. Forest Management

Sustainable forest management ensures a replanting of trees, but deforestation or overuse risk call for at least a national resource management plan of forests to ensure a sustainable use of the resources, improve ecosystem services and forest resilience [64]. Without biogenic carbon storage, the climate change impact of the improved building after the transition period almost reaches 8.5 kg CO2 eq/m2/yr, a 50% increase (see Figure 8, Optimized without biogenic carbon, noted wo Cbio). Moreover, the mitigation potential of forests can be hindered by climate change effects: increasing drought, fires, pest and disease outbreaks, wind storm [65].

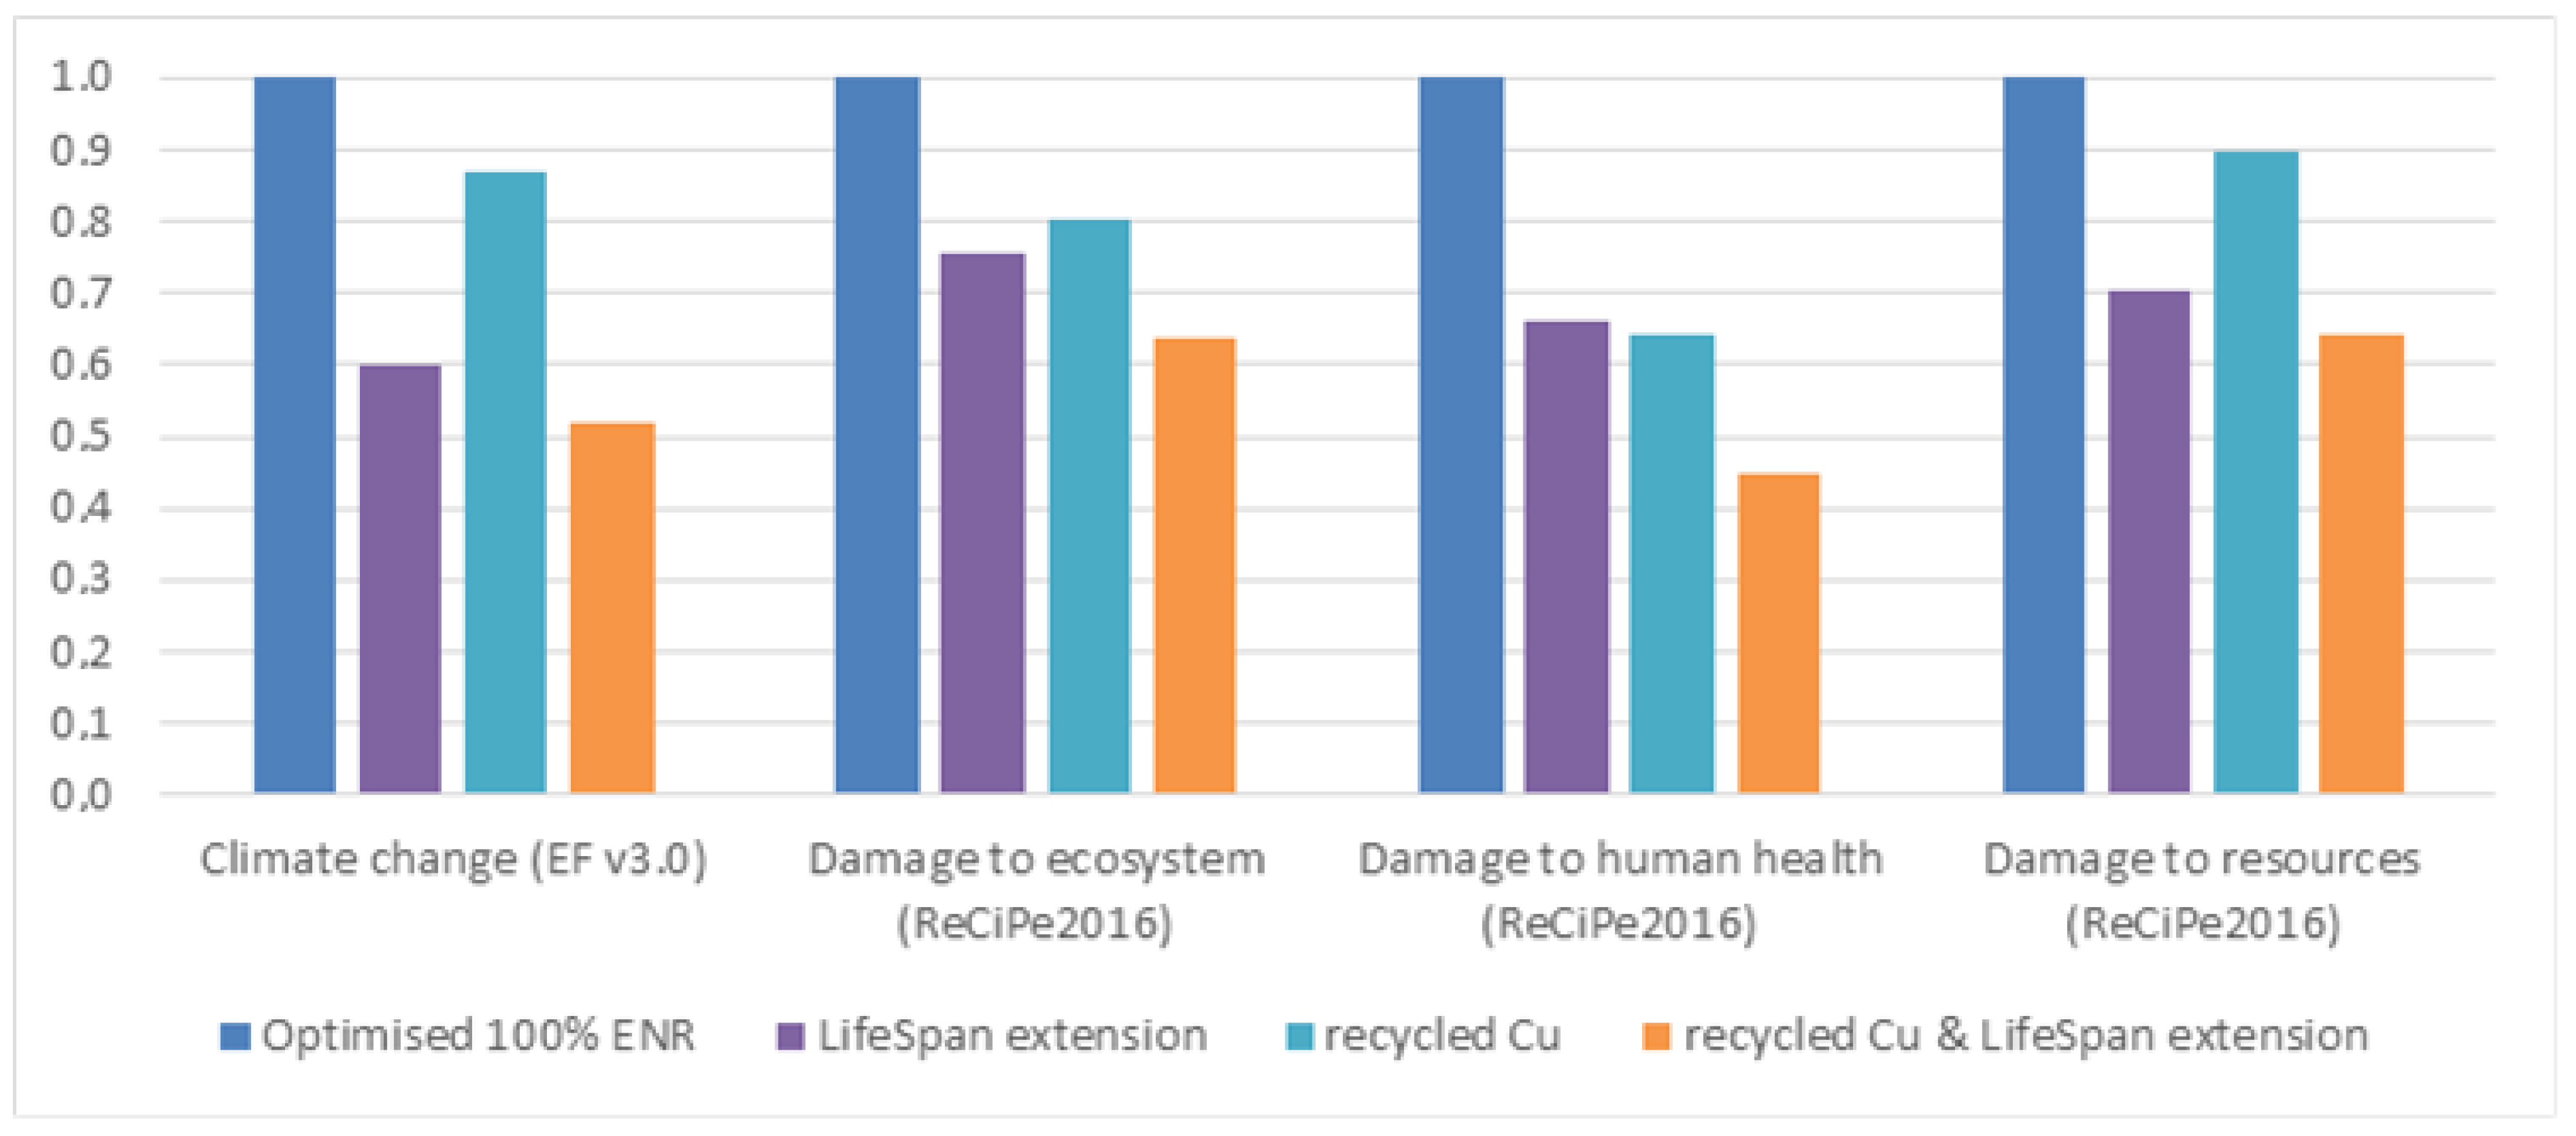
4.3. Multi-Criteria Analysis

Beyond GhG emissions, it is important to also consider other environmental impacts in order to avoid impact shifting. Damage indicators were evaluated in this study, showing an important reduction by decarbonization measures for damage to health, damage to ecosystem and resource depletion (see Figure 8). These indicators are uncertain, and such an evaluation should be further improved by ongoing work regarding impact assessment models.
Figure 8. Environmental impacts of the optimized building relative to the actual building.
Energies 16 07608 g008
Damage to ecosystems, human health and resources are also decreasing but in a smaller proportion than climate change. Indeed, the climate contribution is only 20.6% and 14.2% for ecosystem and health, respectively, for the optimized building against 64.4% and 45.5% for the actual building. Resource impacts are largely dominated by fossil fuels (over 80% for all cases). Increasing the use of wood increases land use impacts and increasing the use of equipment increases mineral and metallic resource use. To prevent impact shifting, a multi-criteria analysis must be performed.

4.4. Circular Economy

Going further in reducing building impacts and easing the carbon offsetting effort would induce additional contributors that were previously considered minor contributors, such as equipment, electronics and material replacement. It would therefore be useful to further investigate reuse and reconditioning of old equipment, longer lifetime and other known circular economy levers. A first sensitivity analysis has been performed by increasing all lifetime of equipment and finishes to 30 years, and a second analysis considered French recycled copper for electronic manufacturing and plumbing. The results are presented in Figure 9 and show a great potential for continuing to decrease environmental impacts of the building sector. This also calls for a better evaluation of the composition and quantity of contributors such as equipment, electric and electronics, and plumbing. They have been proven to become an important contributor but were previously neglected [66] and as shown in this study, they will be the next lever to address in order to progress toward zero carbon buildings.

4.5. Behavioral Changes

Reducing water and electricity consumption through behavioral changes and efficient appliances would also further contribute to decreasing remaining GhG emissions and will have a positive effect on damage to health and ecosystems as well. It is outside the scope of this article, but the importance of behavior in building LCA has long been proven by previous studies, such as in Polster et al. in the 1990′s [67].
Maybe in the future, suffering hazardous conditions, humanity should consider the decrease in life comfort, for instance:
-
a radical reduction in the number of newly constructed buildings,
-
increasing the density of people occupying buildings,
-
accepting higher variability of air temperature indoors (using adaptive thermal comfort models in simulations).

4.6. Prospective Uncertainties

The study showed the possibility of reducing the emissions of new apartment buildings from 33 kg CO2 eq/m2/year to less than 6 kg CO2 eq/m2/year after a transition period. Assuming that the annual growth in forestry and housing stock follows the same trend as in previous years, emissions from new residential buildings would correspond nearly entirely to the possibility of sequestering carbon by forest growth. There is uncertainty about the evolution of these trends in the long term and, therefore, the possibility of long-term sequestration using this method. Annual CO2 emissions from the existing housing stock were 98 Mt CO2 eq in 2019, considering only energy related, no embodied emissions [68] for a total of 36.6 million dwellings. To sequester these emissions by forests, it would be necessary to cover about 16 million hectares, i.e., 95% of the French forest area in 2019. These emissions can be considerably reduced, as shown in the case study above, by minimizing heating needs and using RES.
Considering new dwellings to be built, it would be important to also consider the grid decarbonization effect on the manufacture of equipment and materials to be replaced along the life-cycle of the product. This has not been done in this project; thus, GhG emissions from renovation are potentially over-estimated. Such calculations have been made in the past for renewable energy technologies, showing a potentially significant effect on the results [69]. However, the order of magnitude given in this study would probably still hold as the French electricity grid is not carbon intensive. Such an integrated assessment is considered to be an interesting perspective of this work.

4.7. Temptation of Hasty Electrification

Electrification is seen in the building sector as a decarbonization lever, providing that clean power is made accessible. However, massive hasty electrification of uses, anticipating the future provisioning of low-impact electricity, could have an adverse effect and hinder the needed transition of the grid by unreasonably increasing the electricity demand. In this paper, the gas boiler is replaced by a heat pump, thus leading to an increase in electricity consumption. However, a significant effort is made to limit, at their minimum, the electricity needs for heating (additional insulation, heat recovery on ventilation) and DHW (solar panels). The improved building also provides renewable electricity to the grid thanks to the PV system. Even if its production is unlikely to coincide with its consumption, it takes part in the grid transition. This setup is thus considered to be consistent with an efficient decarbonization of the grid by 2050.

4.8. Generalisation of the Results

The case study is specific to the French context, and numerous assumptions and scenarios affect the results. Particularly, construction techniques, architecture, occupants’ behavior and prospective aspects (e.g., regarding the evolution of electric system) may differ a lot in other contexts. The presented case study and corresponding results aim to show the possible application of the methodology, which could be used in other countries while adapting data and scenarios appropriately.

5. Conclusions and Perspectives

Limiting global warming to 1.5 °C implies not exceeding the remaining carbon budget, and therefore, designing net zero carbon buildings. An apartment building built in 2016 in France was redesigned in order to check the possibility of reaching this performance level by lowering heating energy needs and implementing bio-sourced materials and renewable energy systems (geothermal heat pump, solar domestic hot water production, and photovoltaic electricity production). GhG emissions were evaluated using life cycle assessment, integrating energy consumption calculated using a building energy simulation. During a transition period, exporting electricity avoids impacts corresponding to standard production on the grid. These avoided impacts decrease and become zero when the grid is decarbonized after the transition. At this date, the building should be net zero emissions, but there remain emissions related, e.g., to the replacement of construction products (e.g., equipment, windows, painting), drinking water production and wastewater treatment. More research is needed to better understand the amount of electric and electronic components in buildings depending on their uses and design options. Circular economy levers on such previously minor contributors (buildings equipment, electronics and plumbing) should be undertaken to further decrease the impacts of buildings.
The possibility of offsetting these emissions is therefore studied, considering sequestration in forests or vegetation systems. A net zero emission level can be achieved if the whole sequestration potential can be used to offset emissions by new construction. But emissions from existing buildings correspond to the potential of the whole French forest area, and the budget should also be shared with other sectors: transport, industry and agriculture. It is therefore needed to radically transform our construction standards, probably also our comfort and way of life standards, and to search for supplementary sequestration techniques.
In perspective, it would be useful to model the building stock using dynamic LCA and to allocate a part of the whole carbon budget to buildings in order to check if a net zero balance can be achieved on a national level.

Author Contributions

Conceptualization, A.H.D. and B.P.; Methodology, A.H.D.; Software, A.H.D. and C.R.; Validation, C.R.; Data curation, C.R.; Writing—original draft, A.H.D.; Writing—review & editing, C.R. and B.P.; Supervision, B.P. All authors have read and agreed to the published version of the manuscript.

Funding

This research received no external funding.

Data Availability Statement

Data are contained within the article.

Acknowledgments

This work was carried out during a research trimester of the engineering cycle at Ecole des Mines de Paris, using energy calculation and life cycle assessment tools that were previously developed in various research programs (European Commission, ADEME, Chair ParisTech VINCI Ecodesign of buildings and infrastructure).

Conflicts of Interest

The authors declare no conflict of interest.

References

  1. European Parliament, Council of the European Union. EUR-Lex—32010L0031—EN—EUR-Lex. Available online: https://eur-lex.europa.eu/eli/dir/2010/31/oj (accessed on 9 May 2023).
  2. United Nations Framework Convention on Climate Change. The Paris Agreement. 2015. Available online: https://unfccc.int/sites/default/files/english_paris_agreement.pdf (accessed on 11 May 2023).
  3. Rockström, J.; Steffen, W.; Noone, K.; Persson, Å.; Chapin, F.S., III; Lambin, E.F.; Lenton, T.M.; Scheffer, M.; Folke, C.; Schellnhuber, H.J.; et al. A safe operating space for humanity. Nature 2009, 461, 472–475. [Google Scholar] [CrossRef]
  4. Steffen, W.; Richardson, K.; Rockström, J.; Cornell, S.E.; Fetzer, I.; Bennett, E.M.; Biggs, R.; Carpenter, S.R.; De Vries, W.; De Wit, C.A.; et al. Planetary boundaries: Guiding human development on a changing planet. Science 2015, 347, 1259855. [Google Scholar] [CrossRef] [PubMed]
  5. Richardson, K.; Steffen, W.; Lucht, W.; Bendtsen, J.; Cornell, S.E.; Donges, J.F.; Drüke, M.; Fetzer, I.; Bala, G.; von Bloh, W.; et al. Earth beyond six of nine planetary boundaries. Sci. Adv. 2023, 9, eadh2458. [Google Scholar] [CrossRef] [PubMed]
  6. Mata, E.; Korpal, A.K.; Cheng, S.H.; Navarro, J.P.J.; Filippidou, F.; Reyna, J.; Wang, R. A map of roadmaps for zero and low energy and carbon buildings worldwide. Environ. Res. Lett. 2020, 15, 113003. [Google Scholar] [CrossRef]
  7. Huovila, A.; Siikavirta, H.; Rozado, C.A.; Rökman, J.; Tuominen, P.; Paiho, S.; Hedman, A.; Ylén, P. Carbon-neutral cities: Critical review of theory and practice. J. Clean. Prod. 2022, 341, 130912. [Google Scholar] [CrossRef]
  8. Sartori, I.; Napolitano, A.; Voss, K. Net zero energy buildings: A consistent definition framework. Energy Build. 2012, 48, 220–232. [Google Scholar] [CrossRef]
  9. Kristjansdottir, T.F.; Heeren, N.; Andresen, I.; Brattebø, H. Comparative emission analysis of low-energy and zero-emission buildings. Build. Res. Inf. 2018, 46, 367–382. [Google Scholar] [CrossRef]
  10. Lausselet, C.; Borgnes, V.; Brattebø, H. LCA modelling for Zero Emission Neighbourhoods in early stage planning. Build. Environ. 2019, 149, 379–389. [Google Scholar] [CrossRef]
  11. Brozovsky, J.; Gustavsen, A.; Gaitani, N. Zero emission neighbourhoods and positive energy districts—A state-of-the-art review. Sustain. Cities Soc. 2021, 72, 103013. [Google Scholar] [CrossRef]
  12. Satola, D.; Balouktsi, M.; Lützkendorf, T.; Wiberg, A.H.; Gustavsen, A. How to define (net) zero greenhouse gas emissions buildings: The results of an international survey as part of IEA EBC annex 72. Build. Environ. 2021, 192, 107619. [Google Scholar] [CrossRef]
  13. Georges, L.; Haase, M.; Wiberg, A.H.; Kristjansdottir, T.; Risholt, B. Life cycle emissions analysis of two nZEB concepts. Build. Res. Inf. 2015, 43, 82–93. [Google Scholar] [CrossRef]
  14. Moschetti, R.; Brattebø, H.; Sparrevik, M. Exploring the pathway from zero-energy to zero-emission building solutions: A case study of a Norwegian office building. Energy Build. 2019, 188–189, 84–97. [Google Scholar] [CrossRef]
  15. Osmani, M.; O’Reilly, A. Feasibility of zero carbon homes in England by 2016: A house builder’s perspective. Build. Environ. 2009, 44, 1917–1924. [Google Scholar] [CrossRef]
  16. Oltra-Badenes, R.; Guerola-Navarro, V.; Gil-Gómez, J.-A.; Botella-Carrubi, D. Design and Implementation of Teaching–Learning Activities Focused on Improving the Knowledge, the Awareness and the Perception of the Relationship between the SDGs and the Future Profession of University Students. Sustainability 2023, 15, 5324. [Google Scholar] [CrossRef]
  17. Ahmed, N. Developing a tailored tool to assess regenerative development and design within the built environment. J. Green Build. 2023, 18, 135–166. [Google Scholar] [CrossRef]
  18. Sharma, A.; Saxena, A.; Sethi, M.; Shree, V. Varun Life cycle assessment of buildings: A review. Renew. Sustain. Energy Rev. 2011, 15, 871–875. [Google Scholar] [CrossRef]
  19. Cabeza, L.F.; Rincón, L.; Vilariño, V.; Pérez, G.; Castell, A. Life cycle assessment (LCA) and life cycle energy analysis (LCEA) of buildings and the building sector: A review. Renew. Sustain. Energy Rev. 2014, 29, 394–416. [Google Scholar] [CrossRef]
  20. Anand, C.K.; Amor, B. Recent developments, future challenges and new research directions in LCA of buildings: A critical review. Renew. Sustain. Energy Rev. 2017, 67, 408–416. [Google Scholar] [CrossRef]
  21. Hansen, R.N.; Rasmussen, F.N.; Ryberg, M.; Birgisdóttir, H. A systematic review of consequential LCA on buildings: The perspectives and challenges of applications and inventory modelling. Int. J. Life Cycle Assess. 2022, 28, 131–145. [Google Scholar] [CrossRef]
  22. Frischknecht, R.; Benetto, E.; Dandres, T.; Heijungs, R.; Roux, C.; Schrijvers, D.; Wernet, G.; Yang, Y.; Messmer, A.; Tschuemperlin, L. LCA and decision making: When and how to use consequential LCA; 62nd LCA forum, Swiss Federal Institute of Technology, Zürich, 9 September 2016. Int. J. Life Cycle Assess. 2016, 22, 296–301. [Google Scholar] [CrossRef]
  23. Andersen, C.E.; Ohms, P.; Rasmussen, F.N.; Birgisdóttir, H.; Birkved, M.; Hauschild, M.; Ryberg, M. Assessment of absolute environmental sustainability in the built environment. Build. Environ. 2020, 171, 106633. [Google Scholar] [CrossRef]
  24. Bjoern, A.; Chandrakumar, C.; Boulay, A.-M.; Doka, G.; Fang, K.; Gondran, N.; Hauschild, M.Z.; Kerkhof, A.; King, H.; Margni, M.; et al. Review of life-cycle based methods for absolute environmental sustainability assessment and their applications. Environ. Res. Lett. 2020, 15, 083001. [Google Scholar] [CrossRef]
  25. Brejnrod, K.N.; Kalbar, P.; Petersen, S.; Birkved, M. The absolute environmental performance of buildings. Build. Environ. 2017, 119, 87–98. [Google Scholar] [CrossRef]
  26. Ramage, M.H.; Burridge, H.; Busse-Wicher, M.; Fereday, G.; Reynolds, T.; Shah, D.U.; Wu, G.; Yu, L.; Fleming, P.; Densley-Tingley, D.; et al. The wood from the trees: The use of timber in construction. Renew. Sustain. Energy Rev. 2017, 68, 333–359. [Google Scholar] [CrossRef]
  27. Carcassi, O.B.; Habert, G.; Malighetti, L.E.; Pittau, F. Material Diets for Climate-Neutral Construction. Environ. Sci. Technol. 2022, 56, 5213–5223. [Google Scholar] [CrossRef] [PubMed]
  28. Dahiya, S.; Katakojwala, R.; Ramakrishna, S.; Venkata Mohan, S. Biobased products and life cycle assessment in the context of circular economy and sustainability. Mat. Circ. Econ. 2020, 2, 7. [Google Scholar] [CrossRef]
  29. Matthews, R.; Sokka, L.; Soimakallio, S.; Mortimer, N.; Rix, J.; Schelhaas, M.; Jenkins, T.; Hogan, G.; Mackie, E.; Morris, A.; et al. Review of Literature on Biogenic Carbon and Life Cycle Assessment of Forest Bioenergy. Forest Research. 2014. Available online: http://www.energy-wsp.org/media/upload/veipraktiki34.pdf (accessed on 3 November 2015).
  30. Hoxha, E.; Passer, A.; Saade, M.R.M.; Trigaux, D.; Shuttleworth, A.; Pittau, F.; Allacker, K.; Habert, G. Biogenic carbon in buildings: A critical overview of LCA methods. Build. Cities 2020, 1, 504–524. [Google Scholar] [CrossRef]
  31. Andersen, C.E.; Rasmussen, F.N.; Habert, G.; Birgisdóttir, H. Embodied GHG Emissions of Wooden Buildings—Challenges of Biogenic Carbon Accounting in Current LCA Methods. Front. Built Environ. 2021, 7, 120. [Google Scholar] [CrossRef]
  32. Tellnes, L.; Ganne-Chedeville, C.; Dias, A.; Dolezal, F.; Hill, C.; Escamilla, E.Z. Comparative assessment for biogenic carbon accounting methods in carbon footprint of products: A review study for construction materials based on forest products. iForest Biogeosci. For. 2017, 10, 815–823. [Google Scholar] [CrossRef]
  33. Cherubini, F.; Guest, G.; Strømman, A.H. Application of probability distributions to the modeling of biogenic CO2 fluxes in life cycle assessment. GCB Bioenergy 2012, 4, 784–798. [Google Scholar] [CrossRef]
  34. Head, M.; Bernier, P.; Levasseur, A.; Beauregard, R.; Margni, M. Forestry carbon budget models to improve biogenic carbon accounting in life cycle assessment. J. Clean. Prod. 2019, 213, 289–299. [Google Scholar] [CrossRef]
  35. Seymour, F. Seeing the Forests as well as the (Trillion) Trees in Corporate Climate Strategies. One Earth 2020, 2, 390–393. [Google Scholar] [CrossRef]
  36. Habert, G.; Miller, S.A.; John, V.M.; Provis, J.L.; Favier, A.; Horvath, A.; Scrivener, K.L. Environmental impacts and decarbonization strategies in the cement and concrete industries. Nat. Rev. Earth Environ. 2020, 1, 559–573. [Google Scholar] [CrossRef]
  37. Liu, X.; Peng, R.; Bai, C.; Chi, Y.; Li, H.; Guo, P. Technological roadmap towards optimal decarbonization development of China’s iron and steel industry. Sci. Total Environ. 2022, 850, 157701. [Google Scholar] [CrossRef] [PubMed]
  38. Tautorat, P.; Lalin, B.; Schmidt, T.S.; Steffen, B. Directions of innovation for the decarbonization of cement and steel production—A topic modeling-based analysis. J. Clean. Prod. 2023, 407, 137055. [Google Scholar] [CrossRef]
  39. Chai, S.Y.W.; Ngu, L.H.; How, B.S.; Chin, M.Y.; Abdouka, K.; Adini, M.J.B.A.; Kassim, A.M. Review of CO2 capture in construction-related industry and their utilization. Int. J. Greenh. Gas Control. 2022, 119, 103727. [Google Scholar] [CrossRef]
  40. Peuportier, B.; Sommereux, I.B. Simulation tool with its expert interface for the thermal design of multizone buildings. Int. J. Sol. Energy 1990, 8, 109–120. [Google Scholar] [CrossRef]
  41. Munaretto, F.; Recht, T.; Schalbart, P.; Peuportier, B. Empirical validation of different internal superficial heat transfer models on a full-scale passive house. J. Build. Perform. Simul. 2018, 11, 261–282. [Google Scholar] [CrossRef]
  42. Judkoff, R.; Neymark, J. International Energy Agency Building Energy Simulation Test (BESTEST) and Diagnostic Method; NREL/TP-472-6231; National Renewable Energy Lab. (NREL): Golden, CO, USA, 1995. [CrossRef]
  43. Judkoff, R.; Neymark, J. Twenty Years On!: Updating the IEA BESTEST Building Thermal Fabric Test Cases for ASHRAE Standard 140. In Proceedings of the BS 2013: 13th Conference of the International Building Performance Simulation Association, Chambery, France, 26–28 August 2013; pp. 63–70. [Google Scholar]
  44. ISO 14040:2006; Environmental Management—Life Cycle Assessment—Principles and Framework. ISO: Geneva, Switzerland, 2006.
  45. ISO 14044:2006; Environmental Management—Life Cycle Assessment—Requirements and Guidelines. ISO: Geneva, Switzerland, 2006.
  46. Mutel, C. Brightway: An open source framework for Life Cycle Assessment. J. Open Source Softw. 2017, 2, 236. [Google Scholar] [CrossRef]
  47. Frischknecht, R.; Jungbluth, N.; Althaus, H.-J.; Doka, G.; Dones, R.; Heck, T.; Hellweg, S.; Hischier, R.; Nemecek, T.; Rebitzer, G.; et al. Overview and Methodology. Ecoinvent. Rep. 2007. Available online: http://www.ecoinvent.org/fileadmin/documents/en/01_OverviewAndMethodology.pdf (accessed on 20 June 2013).
  48. Wernet, G.; Bauer, C.; Steubing, B.; Reinhard, J.; Moreno-Ruiz, E.; Weidema, B. The ecoinvent database version 3 (part I): Overview and methodology. Int. J. Life Cycle Assess. 2016, 21, 1218–1230. [Google Scholar] [CrossRef]
  49. Frapin, M.; Roux, C.; Assoumou, E.; Peuportier, B. Modelling long-term and short-term temporal variation and uncertainty of electricity production in the life cycle assessment of buildings. Appl. Energy 2021, 307, 118141. [Google Scholar] [CrossRef]
  50. European Commission, Joint Research Centre. Environmental Footprint: Update of Life Cycle Impact Assessment Methods: Ecotoxicity Freshwater, Human Toxicity Cancer, and Non Cancer; Publications Office of the European Union: Luxembourg, 2020; Available online: https://data.europa.eu/doi/10.2760/300987 (accessed on 3 September 2021).
  51. Huijbregts, M.A.J.; Steinmann, Z.J.N.; Elshout, P.M.F.; Stam, G.; Verones, F.; Vieira, M.; Zijp, M.; Hollander, A.; van Zelm, R. ReCiPe2016: A harmonised life cycle impact assessment method at midpoint and endpoint level. Int. J. Life Cycle Assess. 2017, 22, 138–147. [Google Scholar] [CrossRef]
  52. EN 15804+A2; Sustainability of Construction Works—Environmental Product Declarations—Core Rules for the Product Category of Construction Products. EU: Brussels, Belgium, 2019.
  53. Levasseur, A.; Lesage, P.; Margni, M.; Samson, R. Biogenic Carbon and Temporary Storage Addressed with Dynamic Life Cycle Assessment. J. Ind. Ecol. 2013, 17, 117–128. [Google Scholar] [CrossRef]
  54. Vorger, E.; Schalbart, P.; Peuportier, B. Integration of a comprehensive stochastic model of occupancy in building simulation to study how inhabitants influence energy performance. In Proceedings of the 30th International PLEA 2014 Conference, Ahmedabad, India, 16–18 December 2014; p. 8. [Google Scholar]
  55. Wurtz, A.; Peuportier, B. Application of the Life Cycle Assessment to a Building Sample for in Order to Helping in Projects Evaluation. In Proceedings of the Climamed Conference, Lisbon, Portugal, 11 May 2021; Available online: https://hal.archives-ouvertes.fr/hal-03194021 (accessed on 8 March 2022).
  56. ADEME. Mix électrique 100% Renouvelable? Analyses et Optimisations. 2016. Available online: https://librairie.ademe.fr/cadic/2889/mix-electrique-rapport-2015.pdf (accessed on 14 June 2023).
  57. Pulselli, R.M.; Saladini, F.; Neri, E.; Bastianoni, S. A comprehensive lifecycle evaluation of vertical greenery systems based on systemic indicators. In Proceedings of the Sustainable City 2014, 9th International Conference on Urban Regeneration and Sustainability is a Civil Engineering, Siena, Italy, 23–25 September 2014; pp. 1017–1024. [Google Scholar]
  58. Marchi, M.; Pulselli, R.M.; Marchettini, N.; Pulselli, F.M.; Bastianoni, S. Carbon dioxide sequestration model of a vertical greenery system. Ecol. Model. 2015, 306, 46–56. [Google Scholar] [CrossRef]
  59. Rowe, T.; Poppe, J.; Buyle, M.; Belmans, B.; Audenaert, A. Is the sustainability potential of vertical greening systems deeply rooted? Establishing uniform outlines for environmental impact assessment of VGS. Renew. Sustain. Energy Rev. 2022, 162, 112414. [Google Scholar] [CrossRef]
  60. Lelarge, K.; Birot, J. Etude de la Séquestration de Carbone Par Les éCosystèmes de la Réserve Naturelle du Pinail; GEREPI: Vouneuil-sur-Vienne, France, 2021; 26p. [Google Scholar]
  61. IFN, Inventaire Forestier National (IFN). La Forêt Française: Un Puit de Carbone? Son Role Dans la Limitations des Changements Climatiques. 2005. Available online: https://inventaire-forestier.ign.fr/IMG/pdf/L_IF_no07_carbone.pdf (accessed on 11 May 2023).
  62. French Data and Statistical Studies Department (SDES). Key Figures on Housing—2022 Edition. 2022. Available online: https://www.statistiques.developpement-durable.gouv.fr/edition-numerique/chiffres-cles-du-logement-2022/pdf/Chiffres-cles-logement-2022.pdf (accessed on 28 June 2023). (In French)
  63. French Ministry of Agriculture and Food Security. Forest—Wood. Ministère de l’Agriculture et de la Souveraineté Alimentaire. Available online: https://agriculture.gouv.fr/foret-bois (accessed on 28 June 2023). (In French)
  64. Huuskonen, S.; Domisch, T.; Finér, L.; Hantula, J.; Hynynen, J.; Matala, J.; Miina, J.; Neuvonen, S.; Nevalainen, S.; Niemistö, P.; et al. What is the potential for replacing monocultures with mixed-species stands to enhance ecosystem services in boreal forests in Fennoscandia? For. Ecol. Manag. 2021, 479, 118558. [Google Scholar] [CrossRef]
  65. Lindner, M.; Maroschek, M.; Netherer, S.; Kremer, A.; Barbati, A.; Garcia-Gonzalo, J.; Seidl, R.; Delzon, S.; Corona, P.; Kolström, M.; et al. Climate change impacts, adaptive capacity, and vulnerability of European forest ecosystems. For. Ecol. Manag. 2010, 259, 698–709. [Google Scholar] [CrossRef]
  66. Hoxha, E.; Maierhofer, D.; Saade, M.; Passer, A. Influence of technical and electrical equipment in life cycle assessments of buildings: Case of a laboratory and research building. Int. J. Life Cycle Assess. 2021, 26, 852–863. [Google Scholar] [CrossRef]
  67. Polster, B.; Peuportier, B.; Sommereux, I.B.; Pedregal, P.D.; Gobin, C.; Durand, E. Evaluation of the environmental quality of buildings towards a more environmentally conscious design. Sol. Energy 1996, 57, 219–230. [Google Scholar] [CrossRef]
  68. French Ministry of Ecological Transition and Territorial Cohesion. Reporting on French Low Carbon Strategy. 2021. Available online: https://www.ecologie.gouv.fr/sites/default/files/2021_Indicateurs%20de%20r%C3%A9sultats_SNBC-vF.pdf (accessed on 28 June 2023). (In French)
  69. Hertwich, E. Understanding the Climate Mitigation Benefits of Product Systems: Comment on “Using Attributional Life Cycle Assessment to Estimate Climate-Change Mitigation…”. J. Ind. Ecol. 2014, 18, 464–465. [Google Scholar] [CrossRef]
Figure 1. General overview of the methodology.
Energies 16 07608 g001
Figure 2. Biogenic carbon balance over the life cycle of wood (lab recherche environnement VINCI |PARISTECH).
Energies 16 07608 g002
Figure 3. Residence Les Roches Blanches, source: Jean Paul Faure Architect.
Energies 16 07608 g003
Figure 4. Contributions of the life cycle stages in GhG emissions (base case).
Energies 16 07608 g004
Figure 5. Temperature profiles during the hottest week (simulation results) for the actual building (upper figure) and the improved building (bottom figure).
Energies 16 07608 g005
Figure 6. Yearly average life cycle GhG emissions of the actual and improved buildings during the transition period.
Energies 16 07608 g006
Figure 7. Life cycle GhG emissions of the improved building with a decarbonised grid scenario (after the transition period).
Energies 16 07608 g007
Figure 9. Environmental impacts of the optimized building, sensitivity to circular economy levers.
Energies 16 07608 g009
Table 2. Actual building energy simulation results (annual balance).
CategoryEquipmentAreal Ratio (kWh/m2)
Heating needsGas15
Energy needed for DHWGas34
Electricity useGrid26
Electricity use for ventilationCMV 11
1 Controlled Mechanical Ventilation of the building: CMV (0.45 ach) + air renewal (6 ach) by opening windows at night in summer if indoor temperature > 22 °C and outdoor temperature < indoor.
Table 3. GhG emissions and damage indicators of the actual building.
ImpactUnitConstructionUseRenovationEnd-of-LifeTotal
Climate change (EF v3.0)kgCO2 eq/m2/yr3.1 × 1002.7 × 1012.5 × 1001.2 × 10−13.3 × 10⁻¹
Damage to ecosystem (ReCiPe2016)specie.yr/m2/yr1.6 × 10−81.0 × 10−72.5 × 10−84.7 × 10−101.4 × 10⁻⁷
Damage to human health (ReCiPe2016)DALY/m2/yr8.7 × 10−63.9 × 10−51.8 × 10−51.7 × 10−76.7 × 10−5
Damage to resources (ReCiPe2016)USB/m2/yr2.0 × 10−12.8 × 1002.8 × 10−18.5 × 10−33.3 × 100
Table 4. Improved building energy simulation results (annual balance).
CategoryEquipmentAreal Ratio (kWh/m2)
Heating needsHeat pump 30 kW5
Energy needed for DHWsolar thermal collector (140 m2)
+ electric back-up
13
Electricity useNetwork26
Electricity consumption for ventilationCMV1
Photovoltaic electricity productionPV panels58
Table 5. GhG emissions and damage indicators of the improved building.
ImpactUnitConstructionUseRenovationEnd-of-LifeTotal
Climate change (EF v3.0)kgCO2 eq/m2/yr−4.09 × 10−1−2.27 × 1005.06 × 1001.49 × 10−12.53 × 100
Damage to ecosystem (ReCiPe2016)specie.yr/m2/yr2.63 × 10−8−8.42 × 10−103.97 × 10−85.43 × 10−106.57 × 10⁻⁸
Damage to human health (ReCiPe2016)DALY/m2/yr6.32 × 10−6−9.42 × 10−72.65 × 10−51.82 × 10−73.20 × 10−5
Damage to resources (ReCiPe2016)USB/m2/yr1.94 × 10−1−2.18 × 10−14.63 × 10−17.23 × 10−34.46 × 10−1
Disclaimer/Publisher’s Note: The statements, opinions and data contained in all publications are solely those of the individual author(s) and contributor(s) and not of MDPI and/or the editor(s). MDPI and/or the editor(s) disclaim responsibility for any injury to people or property resulting from any ideas, methods, instructions or products referred to in the content.

