Article

The Economic Profitability of Photovoltaic Installations in Households in Poland from a New Policy Perspective

Faculty of Economics and Management, University of Zielona Góra, Podgórna 50 Street (Building A-0), 65-246 Zielona Góra, Poland
*
Author to whom correspondence should be addressed.
Energies 2023, 16(22), 7595; https://doi.org/10.3390/en16227595
Submission received: 15 October 2023 / Revised: 6 November 2023 / Accepted: 13 November 2023 / Published: 15 November 2023
(This article belongs to the Section C: Energy Economics and Policy)

Abstract

:
Solar energy is a source of energy that can meet a significant part of the demand for heat and electricity. However, its acquisition is associated with high variability both during the year and on individual days. The construction of installations due to changes in tariff systems, investment costs and subsidy programs raises doubts as to their profitability. The aim of this study was to assess the profitability of photovoltaic investments for households, considering public financial support. This study used RetScreen Expert software 8.1.2.13 to perform the entire analysis and performance cost, risk and sensitivity simulations. Climate data were imported from ground monitoring stations or from NASA global satellite or analytical data. The conducted research showed the profitability of investments in photovoltaics, even without state support. Differences between regions were insignificant. However, the support system has changed, extending the period of return on investment.

1. Introduction

Crisis phenomena that have been occurring in recent years, including, in particular, the energy crisis and ongoing climate change, make it necessary to constantly search for new energy sources and systemic solutions. One of the biggest socio-environmental problems of the current century is climate change. Man-made greenhouse gas emissions are increasing the frequency of extreme weather. Appropriate technical solutions combining various energy sources as well as solutions in state policy are of great importance. One of the main stimulators of the emerging solutions at the current stage is the finances used, including various types of direct or indirect financial transfers in the form of reliefs, exemptions or subsidies for individual investors or enterprises due to high initial investment costs. Efforts by countries to provide financial incentives and create an economic environment for private sector investment will increase renewable energy investment opportunities. As a consequence, many European Union (EU) countries managed to achieve a significant increase in the number of photovoltaic installations, wind farms and other renewable energy sources. The aim of this study was to assess the profitability of photovoltaic investments for households, taking into account public financial support. In research conducted in the field of renewable energy, various aspects are emphasized, including [1,2,3,4,5,6] technical issues, the cost-effectiveness of production, the coordination of supply chains, the analysis of barriers and incentives to solar photovoltaic energy, tariff solutions, and deeper research on factors affecting the position of such technologies on the market. At the current stage of development of the renewable energy market, which is becoming more and more common, photovoltaic systems and wind turbines play a key role. When analyzing the indicated energy sources, we started from the optimization of the microgrid in the hybrid model, limiting the weakness of each individual source and considering a wide group of location conditions such as [7] wind speeds, noise, degree of insolation, legal restrictions, transmission and storage infrastructure. One should also note the rapid progress in the technologies used to obtain energy, which improves the efficiency of its acquisition, changing the profitability and lifespan of such investments but also worsening the profitability of earlier projects as they become less effective. The second issue is the macroeconomic conditions along with the state policy pursued. There is a clear relationship between these two spheres. Shah, Hiles and Morley [8] indicated that in countries where support for the renewable energy sector is low, investments will be more dependent on macroeconomic aspects, as well as on substitutes such as crude oil or natural gas. In the conditions of economic growth, despite the initiatives taken, the demand for energy is growing. In this situation, actions taken to change the energy mix and increase the use of renewable energy and clean energy technologies are one of the most important mechanisms aimed at breaking the long-term relationship between carbon dioxide (CO2) emissions and economic growth [9,10]. In addition, global energy price dynamics encourage the use of renewable and low-emission energy sources [11]. In the coming future, environmental law and ecological culture will be of fundamental importance to stimulate the use of renewable energy, going beyond economic rationality. Subsidies will continue and environmental awareness will continue to grow. Information campaigns are also gaining in importance [12]. In this context, attention should be paid to tariff solutions, which directly affect the profitability of investments and the economic incentives used, mainly through exemptions from income tax, value-added tax or sales tax, subsidies, and tariffs by individual countries. Tariff arrangements and the adoption of a net metering system are of great importance [13]. This study attempts to assess the profitability of investments, considering a wide group of factors, with particular emphasis on the incentives used. The results can be useful for designers/installers of photovoltaic systems in order to size the systems in accordance with the requirements of the beneficiaries for off-grid end users to adapt their consumption to photovoltaic production. The uncertainty and fluctuations in the prices of energy and fuels used for its production affect the investment costs that risk-averse recipients are willing to incur for the introduction of a system solution in production. Various evaluation methods are used in the process of the evaluation and economic optimization of microgrid solutions. The profitability of such a project can be measured by the lifetime cost of electricity (LCOE), net present value (NPV) or internal rate of return (IRR). Calculation of the NPV and LCOE values requires the adoption of the assumed discount rate and other conditions that will change after the investment is completed. The LCOE measurement is particularly sensitive to the foot [14]. This assumption is not required for IRR analysis. Despite ongoing investment processes, the production of energy from renewable sources still does not satisfy the global demand to a large extent. In addition, the use of these sources is strongly regionally differentiated. There is no possibility of quickly overcoming this situation due to existing barriers such as [15,16,17] low efficiency of renewable energy technologies, low efficiency of the balance of systems (BOS), high initial costs, lack of financing mechanisms or inadequate infrastructure and skills shortage. We are therefore dealing with an imbalance in meeting energy needs and a high correlation between economic growth and the level of greenhouse gas emissions [18]. The presented research fills the research gap regarding financial support for households switching to renewable energy sources. It highlights the directions of the applied policy based on the adopted input parameters and simulations in given climatic conditions. Consequently, it constitutes an attempt to answer the problem of searching for an energy acquisition system with the support of state policy.
The structure of this work consists of an introductory part showing the outline of the problem, a literature review part discussing current research on this topic, a methodological part and a case study where comprehensive analyses and summaries are provided.

2. Review of the Literature

The energy crisis, which has manifested itself in rising fuel prices and their increased volatility, has once again strengthened the discussion of transformations in the structure of energy sources. Due to the fact that fuel prices translate into the whole economy, this should dispel lingering doubts, an important issue [19], and should be met with a reaction of national policies. Moreover, energy and fuels can always become political tools and cause economic crises. One of the possible responses to the crisis is to focus on ensuring the continuity of fuel and energy supplies as well as the economic and political security of domestic energy resources. In addition to the technological and economic aspect, the social and political dimension has a significant impact on the development of renewable energy [20]. In the case of Poland, it is a good alternative for households, with the possibility of installing photovoltaic (PV) panels, especially since nominal and real prices of crude oil and natural gas have historically shown an upward trend [21]. As research has shown [22], after the global financial crisis, all markets for both the renewable energy and fossil fuel sectors revealed the spread of herd behavior among investors during the extreme increase in oil prices. In the US, the fossil fuel energy market is characterized by strong cross-sector spillovers and the risk of spillover to any renewable energy market. This behavior also occurred during the COVID-19 pandemic. In this case, economic entities assessed both shocks differently—those coming from outside (SARS-CoV-2) and those coming from the economy (financial crisis) [23].
In the period 2020–2022, renewable energy played an important role in the production of several types of energy used in the world and became one of the most important energy sources used to generate electricity without the use of fossil fuels such as gas, oil or coal. This reduced environmental pollution and limited the global greenhouse effect. Thanks to this, renewable energy can be considered the future of electricity production because it is not limited by the availability of exhaustible resources and is environmentally friendly [24,25]. This energy is a rich source of green energy that can replace fossil fuels. Due to the daily availability of the sun, solar energy is widely used by most countries, including developing countries [26]. Photovoltaic technology is one of the most important sources of renewable energy (next to cost-effective and environmentally friendly wind energy [27]). This fact is confirmed by numerous studies, especially those using photovoltaic panels [25,28,29,30,31]. Therefore, there is a need for software tools that are able to determine the potential energy output characteristics and operational efficiency of photovoltaic systems. This will help to compare the efficiency and cost of energy production in different system configurations [32]. For Korea, measurement and verification (M&V) analysis using RETScreen Expert was used in search of answers to the problem of reducing the cost of energy loss from old residential buildings. Simulation and empirical analysis showed an increase in net energy savings of 64 GJ over the analyzed period. In addition, in 2020, GHG emissions were reduced by 2.71 (t CO2) as a result of energy savings. Ultimately, energy efficiency was achieved, which reduced residents’ doubts about the long-term benefits of using energy efficiency tools [33]. Investing in solar panels on roofs could also reduce the problem of the energy crisis due to the high potential of solar energy and the low prices of the PV system, which shorten the payback period [34]. A study in the Thiruvananthapuram district of India analyzed the economic feasibility and practical application of 1 KW rooftop solar systems. The simple payback period was 5.7, which means that the investment payment was paid back in 5.7 years and the project was proven to be profitable (NPV > initial cost). The cost–benefit ratio was 10.5 and GHG emissions were reduced [35]. In the state of Nigeria, an application for photovoltaic technology was tested due to the highest annual solar radiation of 5.96 kWh/m2/d, clear sunny days and the highest efficiency factor of 21.7% leading to the highest energy export of 11,385 MWh to the grid. The statewide PV application had a payback period of 13.6 years with a reduction in GHG emissions of 5452.5 tons of CO2, equivalent to 501.5 hectares of carbon sink forests [36]. In the case of Egypt (New Valley), thanks to the proposed 50 kW photovoltaic power plant, there are chances of producing up to 100 MWh of electricity and reducing greenhouse gas emissions to the atmosphere by about 43.3 tons per year [37]. A feasibility study in a simulation process was used in Malawi to determine the impact of feed-in tariffs on renewable energy investments for the Kamazu International Airport photovoltaic farm. An analysis of the applied feed-in tariffs for solar energy in Malawi showed that they are well below the minimum rate that would make an investment in solar PV economically viable. In this case, the development and application of the FIT policy framework were not compatible with Malawi’s national, local, fiscal and socio-economic policies. The obtained results forced a review of economic policy in terms of increasing investments in solar energy in the country [32]. Remaining in Africa, a cost-benefit analysis of an energy-efficiency photovoltaic system showed that despite an incremental initial cost of PLN 36,560, the total annual and revenue savings were PLN 15,312, with simple and capital payback periods of 6.8 years and 3, respectively, and 7 years, with annual life cycle cost savings of PLN 4989 [38]. In the case of a Pakistan study, the results indicated that the implementation of a stand-alone 5 kW photovoltaic system would reduce greenhouse gas emissions by 0.6–0.7 t CO2 in various regions of Pakistan under prevailing climatic conditions. The installation of photovoltaic systems will contribute to a large extent to power load sharing, which will lead to an improvement in the energy situation and reduce concerns about environmental emissions in the country [39]. In Quetta, Pakistan, a cost, investment and greenhouse gas mitigation analysis was carried out for the installation of photovoltaic panels. The project highlighted the significant role of a single energy end user by reducing 122 tons of CO2 over the 25-year lifetime of the project. Initial costs of PLN 4501 were recovered in less than 4 years, effectively meeting energy needs and saving PLN 1195 annually [40].
Photovoltaic systems are often supported by other sources of renewable energy to increase usability and maximize the effects of obtaining energy both in households and for the use of large wind farms designed to supply energy to the entire local community. In the case of private farms, a comparison of the hybrid method of using photovoltaic panels and wind energy was proposed to evaluate such an investment project in two wind zones in Poland (Lubuskie Voivodship). For Polish geographical conditions, the feasibility study showed that the level of insolation was more important than the more favorable wind zone. The simulation indicated a higher economic efficiency of the hybrid model in the southern location, with slightly less favorable conditions for wind installations. At the same time, the investments were economically profitable and allowed for their return in the perspective of at least 11 years [41]. The hybridization of solar and wind power at Harapanahalli in Karnataka, India, showed that annual power generation capacity could be increased by around 90% with hybrid power generation, with a payback period of around 7 years. At that time, the implementation of a solar-to-wind system resulted in an extension of the break-even period by 1 year [42]. Simulation models were also used to determine the optimal strategy for utilizing solar and bioenergy available in rural India to meet the energy deficit. The technical and financial analysis carried out for two villages and 768 households showed that the system provides 24/7 power and is also cost-effective due to the relatively short payback period (less than 8 years). In addition, the implementation of the strategy provided benefits such as the reduction of greenhouse gas emissions (by 93%), the automatic control of electricity theft, biofertilizers and the improvement of the natural environment [43]. For Indonesia in the Merauke area, Regency assessed the use of renewable energy potential from biomass, solar and wind power to reduce dependence on fossil energy and offset the increase in electricity consumption at a time of economic and population growth. The analysis of the RETScreen simulations then indicated a significant potential for solar energy and biomass, which is due to the abundance of raw materials and sufficient irradiation in this area [44].

3. Methodology and Case Report

This transition to renewable energy sources is currently one of the main areas discussed in the topics of the future of energy and environmental protection. In Poland, as in many other countries, one of the key drivers is state policy. In Poland, there is the “My Electricity” program, which provides financial support for natural persons who generate electricity for their own needs. The subsidy is granted for the installation power of 2–10 kW, and its amount depends on the number of purchased products. In 2022, the next edition of the “My Electricity” program was introduced. In the experience so far, this program has been one of the important stimulators of the development of PV micro-installations in Poland. If only PV micro-installations are submitted for co-financing, the co-financing amount is up to 50% of eligible costs, but not more than PLN 6000 (previously it was PLN 4000). If a PV micro-installation with an additional element is submitted for co-financing, the co-financing will amount to the following: for PV micro-installations, up to 50% of eligible costs, but not more than PLN 7000 (previously PLN 5000); for an energy storage facility, up to 50% of eligible costs, but not more than PLN 16,000 (previously PLN 7500); for heat storage, up to 50% of eligible costs, but not more than PLN 5000; and for the EMS/HEMS system, up to 50% of eligible costs, but not more than PLN 3000. Only natural persons generating electricity for their own needs may apply for subsidies for micro-installations (PV) and energy storage devices, provided that they settle under net billing. This applies to new prosumers as well as existing users who resigned from settling in the discount system in favor of the system introduced on 1 April 2022. Therefore, the program has been extended to include other devices related to energy storage. The amounts of individual co-financing have also been increased. In previous versions, this program was very popular. For example, the budget of the original “My Electricity 2.0” program was tripled to a total amount of PLN 1.159 billion, but even such a large pool of funds did not meet the expectations of hundreds of thousands of people applying for co-financing for photovoltaic installations installed on the roofs of their houses [44]. Applicants whose applications were positively evaluated but who did not have enough financial resources for grants were placed on the reserve list. Inflationary processes and the growing demand both in Poland and abroad for photovoltaic installations resulted in an increase in the average price of photovoltaic panels in Poland from approx. PLN 20,000 to approx. PLN 25,000 in 2023, which thus extended the period of return on investment by about 4 years.
The current subsidy system is aimed at natural persons whose photovoltaic micro-installation will be connected to the new settlement system—“net billing”. In this case, prosumers are to sell surplus energy to the grid at wholesale prices and, if necessary, buy it at retail rates, which are obviously higher, including all fees. It is worth noting that the subsidy also applies to “early” prosumers who will give up the current system of discounts, known as “net-metering”, and switch to “net billing”. This decision is irreversible, but in this case, consumers will receive a one-off grant of PLN 2000. In each case, however, the payback period is lower due to the reduction in initial costs. Additionally, to benefit from financial incentives, you do not have to meet income criteria. Apart from the purely economic effects for households, the state of the environment is improving, which is in line with the European Union’s policy.
Of course, the payback period is also determined by a number of other factors, such as weather conditions, including insolation, which is related to geographical location; the angle at which the panels are installed on the roof of the house; or factors such as debt for the purchase of photovoltaic panels, loan interest rates, debt periods, inflation, discount rates and the duration of the entire project. Therefore, the process of planning the use of energy from renewable sources plays an important role already at the initial stages of project implementation. The analysis considered the feasibility of the project using financial analysis, risk analysis and changes in the levels of GHG emissions. The project included the installation of photovoltaic panels on the roof of a single-family house where a heat pump (8.8 kV) was installed. The target was to reduce fuel consumption by 20% in a building the size of 133 m2, which corresponds to the average size of a single-family house in Poland [45].
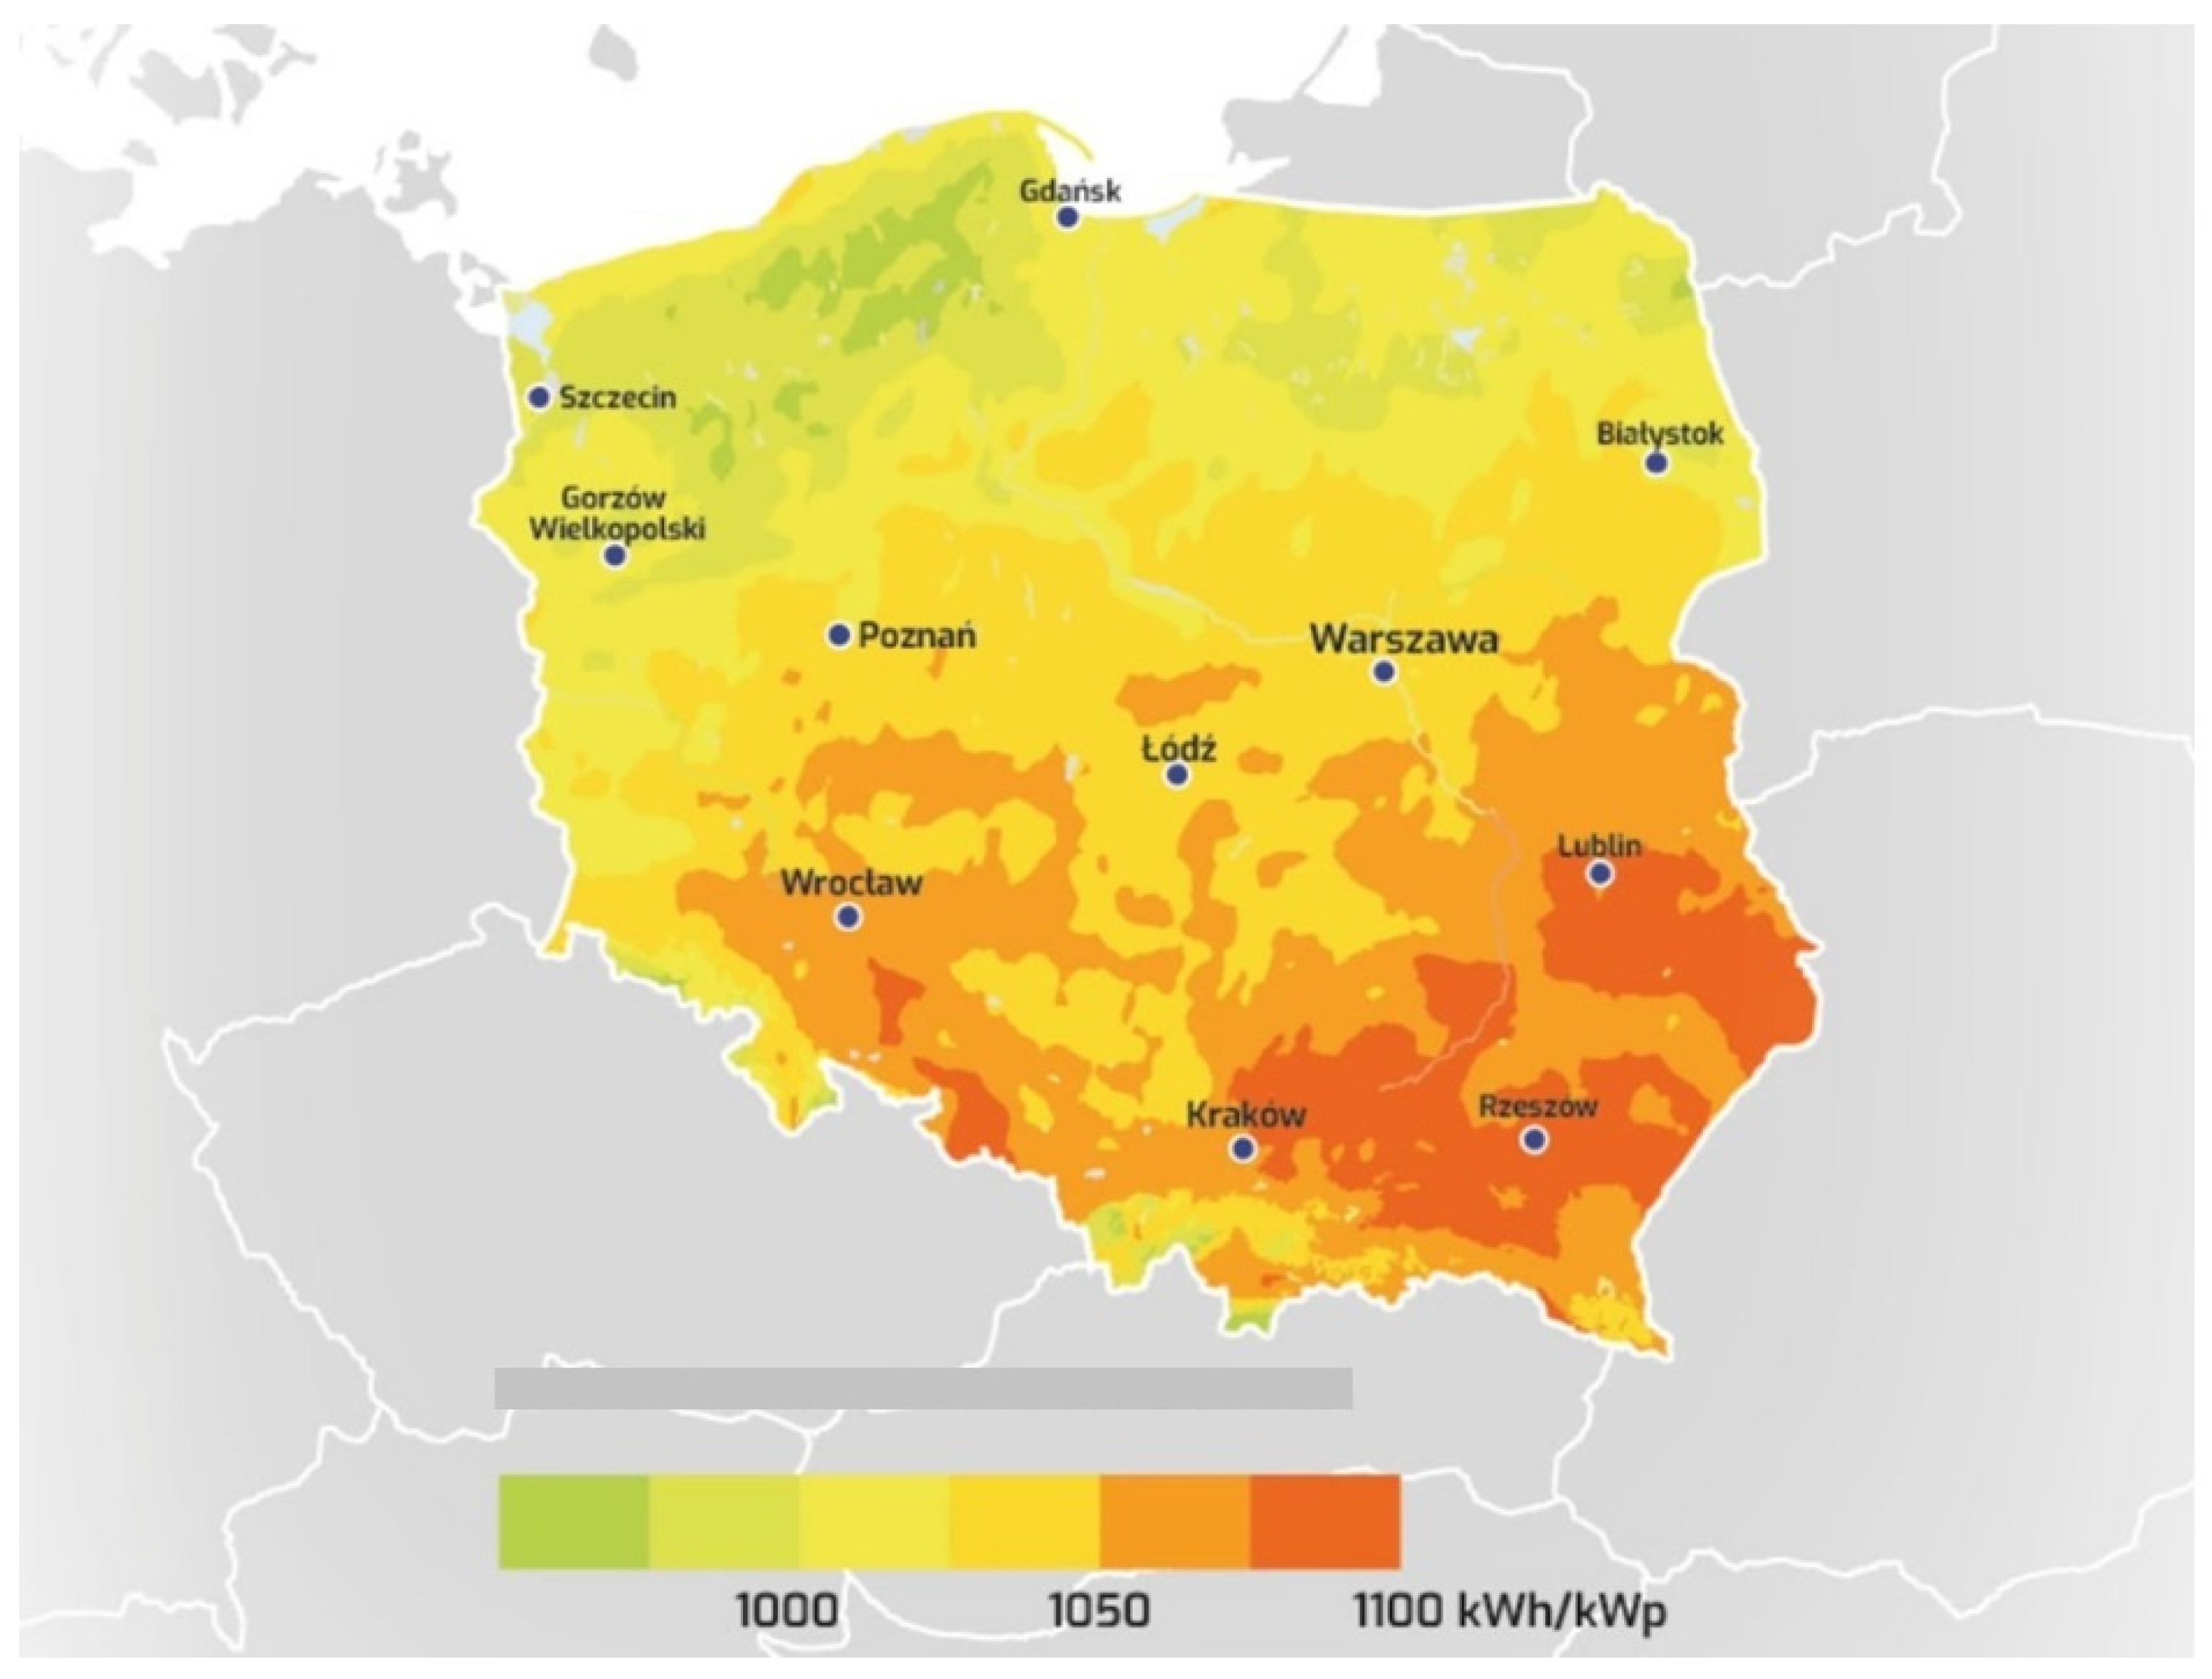
It is possible to show slight differences in the level of insolation in Poland between individual regions (Figure 1), which results in differences, but to a small extent in the period of return on investment in solar panels. In the case of the Lubuskie Voivodeship (west of the country), the solar conditions are moderate (Figure 1) in relation to the south of the country, where better insolation could generate more clean energy.
The main purpose of the applied analysis was to assess energy saving efficiency, improve overall project development, support rapid project implementation and project efficiency, raise public awareness of energy saving, and highlight the importance of emission reduction credit [47]. This is necessary in light of forecasts that energy consumption in the built environment will increase by 34% over the next 20 years [48]. RetScreen Expert software was used in the study to perform the entire analysis and run a cost and risk simulation. Climate data were imported from ground monitoring stations or from NASA global satellite or analytical data. If climate data were not available from a particular ground monitoring station, data were then provided by satellite or NASA analytics data [25], which was applicable in this case. The software enabled the comprehensive identification, assessment and optimization of the technical and financial feasibility of potential renewable energy and energy efficiency projects, as well as the measurement and verification of actual industrial plant performance and the identification of energy savings/production opportunities.
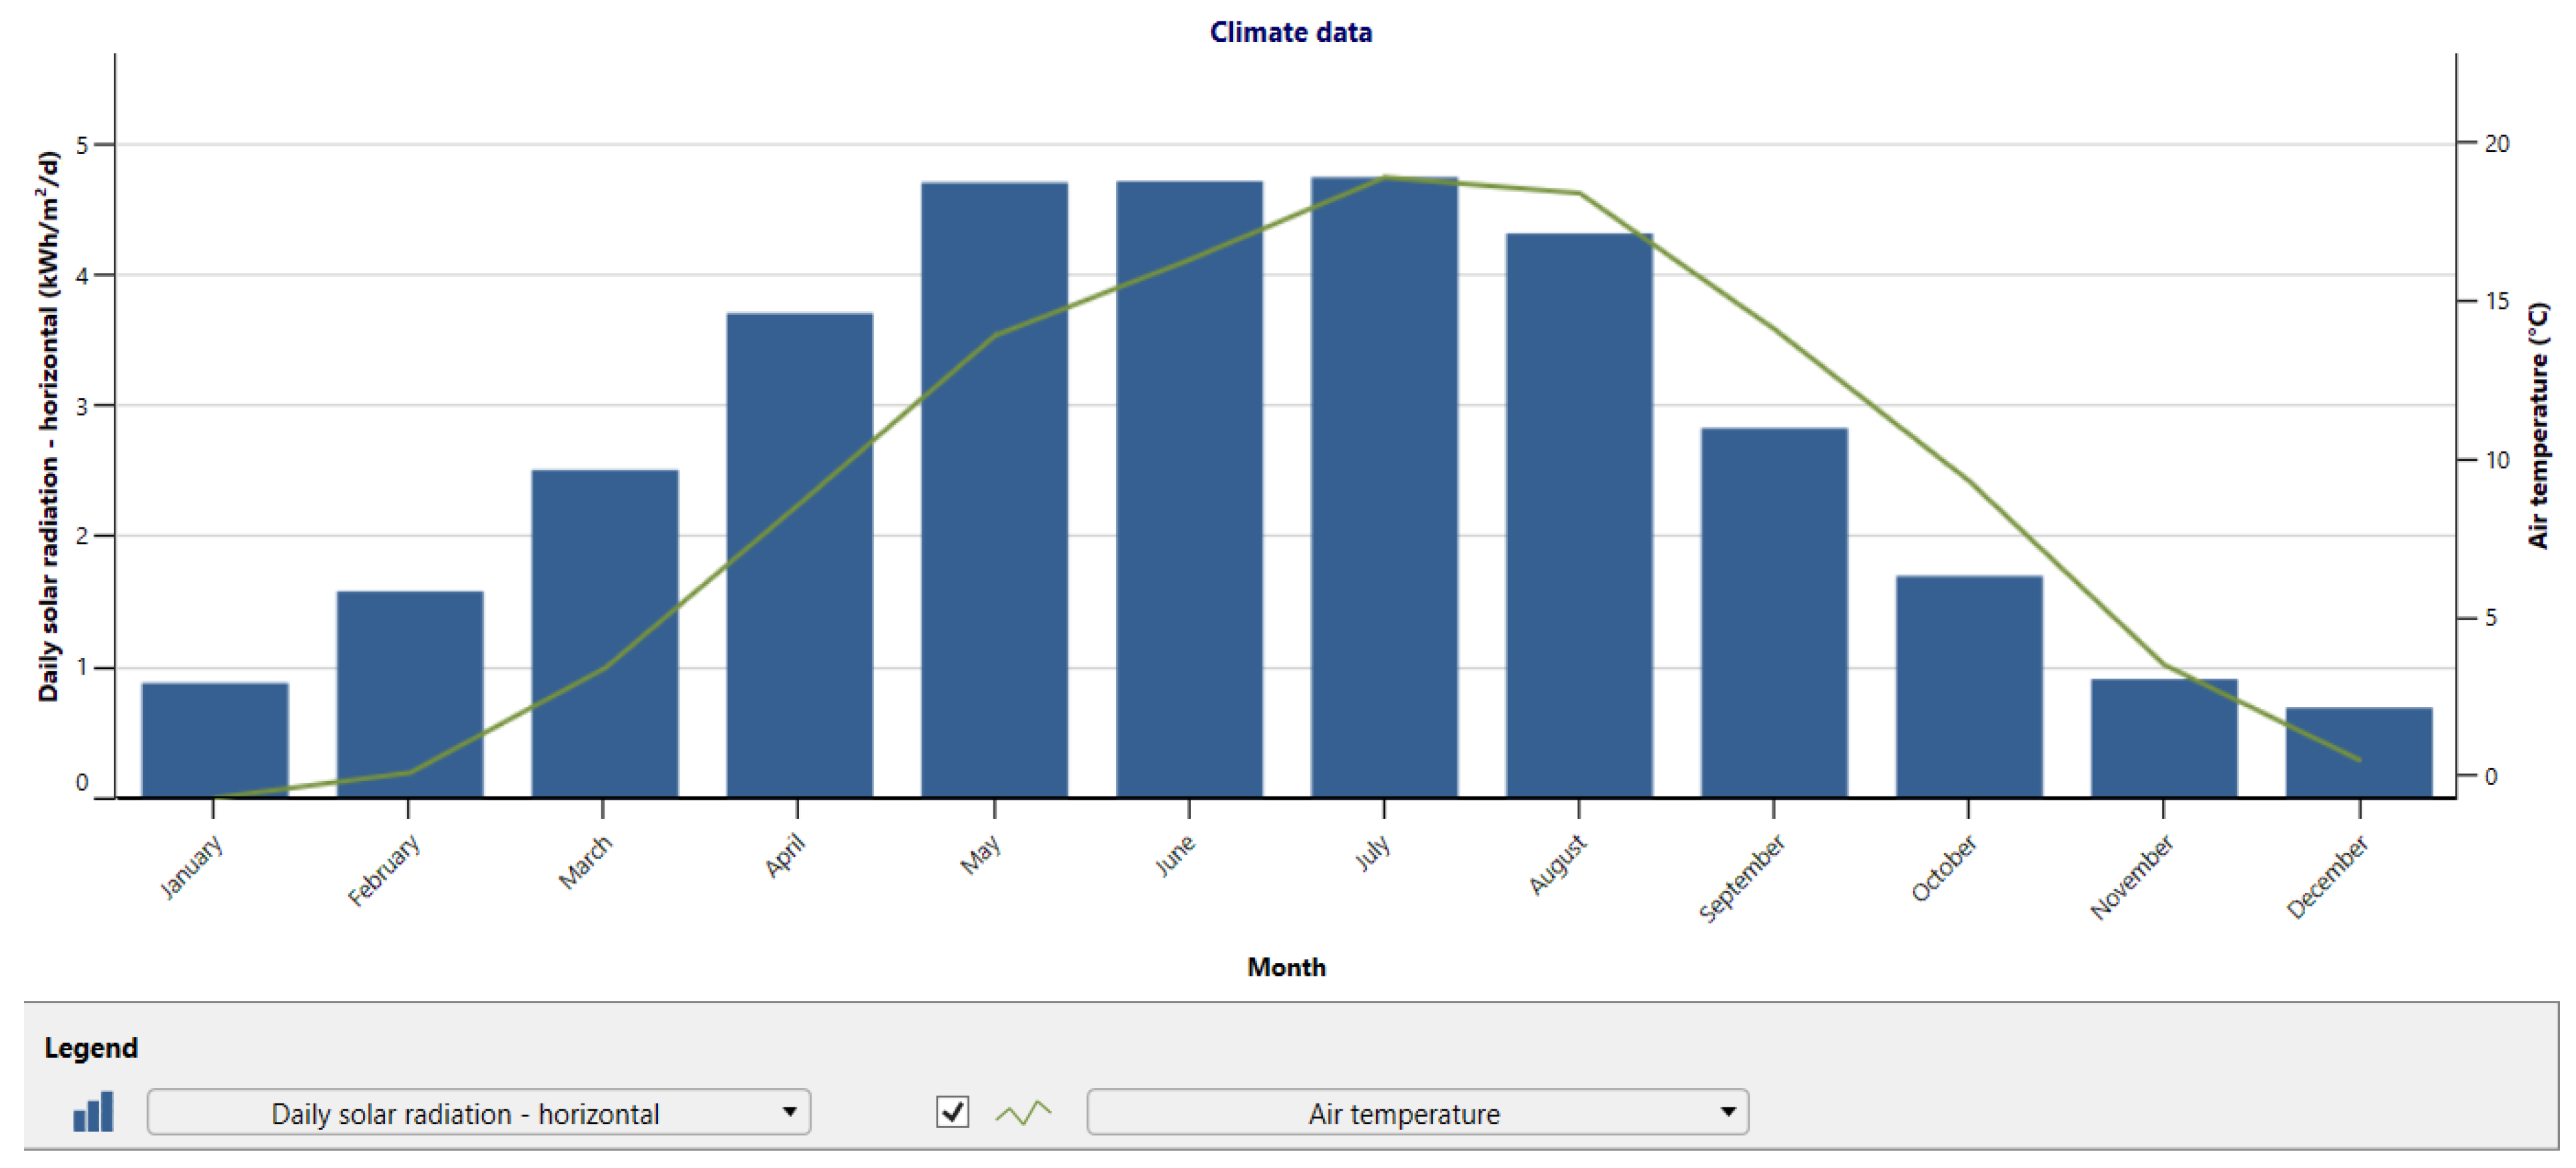
High daily solar radiation in the case of the Lubuskie Voivodship falls in the summer months (May to August), which is strongly related to the geographical location of Poland. The average annual horizontal solar radiation is 2.78. In the same months, the highest ground temperature is also recorded, and wind speeds reach their minimum. Large differences occur on an annual basis between individual months, both in terms of insolation and wind strength (Table 1). This encourages the use of hybrid solutions combining solar and wind installations. It will make it very difficult to stabilize the energy obtained from its two main renewable sources: solar panels and wind turbines. A positive element is the negative correlation between these two sources (during windy periods, there is low average insolation and vice versa). Of course, a hybrid approach requires some technical considerations and may pose challenges for households. Firstly, the substitutability of methods of obtaining energy from renewable sources should be considered. This may look different for a given region due to the weather conditions typical of that place. Secondly, energy sources should be selected in such a way as to possibly increase the efficiency of the entire installation in accordance with the principles of phraseology. In such conditions, the use of photovoltaics will be reinforced with an additional renewable source, which will be able to supplement the entire system during periods of lower radiation. Such an undertaking also requires overcoming the financial barrier, which makes the appropriate use of support policies justified. A much more difficult barrier may be the lack of appropriate conditions for the installation of photovoltaic panels, related to the small plot area in the case of panels based on frames, contraindications resulting from the roof structure or the technical conditions of the household building. In such a case, the financial support policy may be insufficient.
The graphical course of solar radiation and air temperature is shown in Figure 2.
The general trend of photovoltaic potential in Europe is increasing towards the south. In this respect, taking into account the photovoltaic potential of Poland compared to other European countries, it should be noted that the daily parameters of the energy generation potential range from 2.74 to 3.29 kWh/kWp, which translates into the range of 1000–1200 KWh during the year (Figure 3).
In this case, Italy, Spain, Portugal, Greece and the Adriatic Sea countries fare much better, where these values may be even twice as high. Despite such weather conditions, it is still reasonable to use photovoltaic panels and renewable energy sources, especially when a hybrid approach is considered.

3.1. Assumed Economic Parameters

The analysis considered several economic parameters determining the profitability of the entire project. Analyzing the feasibility of the project in a house that, until now, was supposed to use only conventional energy sources in the case of gas fuel, the fuel cost escalation rate (at 8%) was estimated, which was the expected average annual growth rate in the base case and the proposed fuel costs in the case of the duration of the project. This allowed inflation rates to be applied to fuel costs, which may differ from general inflation. Due to the increase in fuel prices in Poland, this index reached a higher value than the average annual CPI. Current inflation rates in Poland have reached nearly 18.2% (February 2023), which classifies it in terms of galloping inflation. With such large price fluctuations and a significant increase in interest rates, the average annual inflation was estimated to be 6%. Then, the discount rate (7.5%) was determined, which is the rate used to discount future cash flows in order to obtain their present value. The rate generally considered to be the most appropriate is the weighted average cost of capital. In the next step, the reinvestment rate (8%) was determined, which is the rate used to reinvest future positive cash flows in order to calculate the modified internal rate of return (MIRR). This rate should be higher than the inflation rate to absorb the cost of living. The duration of the project was 15 years and it was supported by a government grant from the “My Electricity 4.0” project, the total maximum subsidy of which is PLN 20,500 and the project is interest-free (Table 2).
The effective income tax rate was 17.47% and the depreciation rate was 5% over a 15-year project cycle.

3.2. Cost and Savings Analysis

The total upfront costs represent the total incremental investment that needs to be made to get the proposed case object up and running before it starts generating savings and/or revenue. The total initial costs were the sum of the estimated feasibility study, development, engineering, energy system, heating system and cooling system or energy efficiency measures, and balance of system and other costs, and were inputs to the simple payback calculation, plus equity and project debt. The initial costs, in addition to the installation of photovoltaic cells, also included the necessary systems for heating, heat demand, cooling (air conditioning), solar water heater, lighting costs and the operation of electrical devices. Operation and maintenance (O&M) costs were the sum of the annual costs that must be incurred to operate and maintain the proposed case system, in excess of the O&M costs required by the base case system. The model used O&M costs to calculate the total annual costs and annual cash flows (Table 3).

3.3. Financial Viability

The model calculated a pre-tax internal rate of return (IRR) on equity (8%), which represented the project’s actual return on equity over its pre-tax life. It was calculated on the basis of the annual pre-tax cash flow and the duration of the project. If the internal rate of return was equal to or greater than the required rate of return, then the project was likely to be considered financially acceptable. If it was lower than the required rate of return, the project was usually rejected. The model also calculated a modified pre-tax internal rate of return (MIRR) from equity (8%), which represented the cost and profitability provided by the equity of the project over its pre-income tax lifetime. The MIRR assumed that positive cash flows from the project were reinvested at the reinvestment rate and negative cash flows were financed at the discount rate or weighted average cost of capital. The model calculated a simple payback period, which represented the time it takes for a proposed facility to recoup its initial costs from generated revenues or savings. The basic premise of the simple payback method is that the faster the investment costs can be recovered, the more desirable the investment is. However, this indicator should not be used as the main project evaluation indicator. However, it is useful as a secondary indicator indicating the level of investment risk. Another criticism of the simple payback method is that it does not take into account the time value of money or the impact of inflation on costs. In this regard, a better parameter is the return on capital, which represents the time it takes for the facility owner to recoup their own initial investment from the project’s generated cash flow. The return on capital considers the cash flow of the project since its inception, as well as the leverage (level of debt) of the project, making it a better indicator of the time value of a project than a simple return. The model also estimated the net present value (NPV), which is the net value of future cash flows resulting from the investment, taking into account the time value of money. Cash flow can be both positive and negative. In other words, NPV represents the value of future cash flows in terms of today’s money (Table 4). Positive NPV values are an indicator of a potentially viable project, and NPV is defined as follows:
N P V = C F 1 1 + k 1 + + C F n 1 + k n N 0 ,
where
  • CFi—expected net cash flow in year i (i = 1, 2, …, n),
  • N0—initial investment outlay,
  • k—appropriate market capitalization rate, i.e., the opportunity cost of investing capital in risky projects,
  • n—lifetime of the project effect in years.
The model also estimated annual lifetime savings, which were averaged nominal annual savings with exactly the same lifetime and net present value as the project. Annual life cycle savings were calculated using the net present value, the discount rate and the lifetime of the project. In addition, the GHG reduction rate was calculated.
Table 4. Financial feasibility.
Pre-tax IRR equity%28.9%
Pre-tax MIRR equity%16.5%
Pre-tax IRR assets%28.9%
Pre-tax MIRR assets%16.5%
Simple paybackyr4.7
Equity paybackyr4.6
Net present value (NPV)PLN185,935
Annual life cycle savingsPLN/yr21,064
Debt service coverage no debt
Source: own study using RetScreen Expert software.
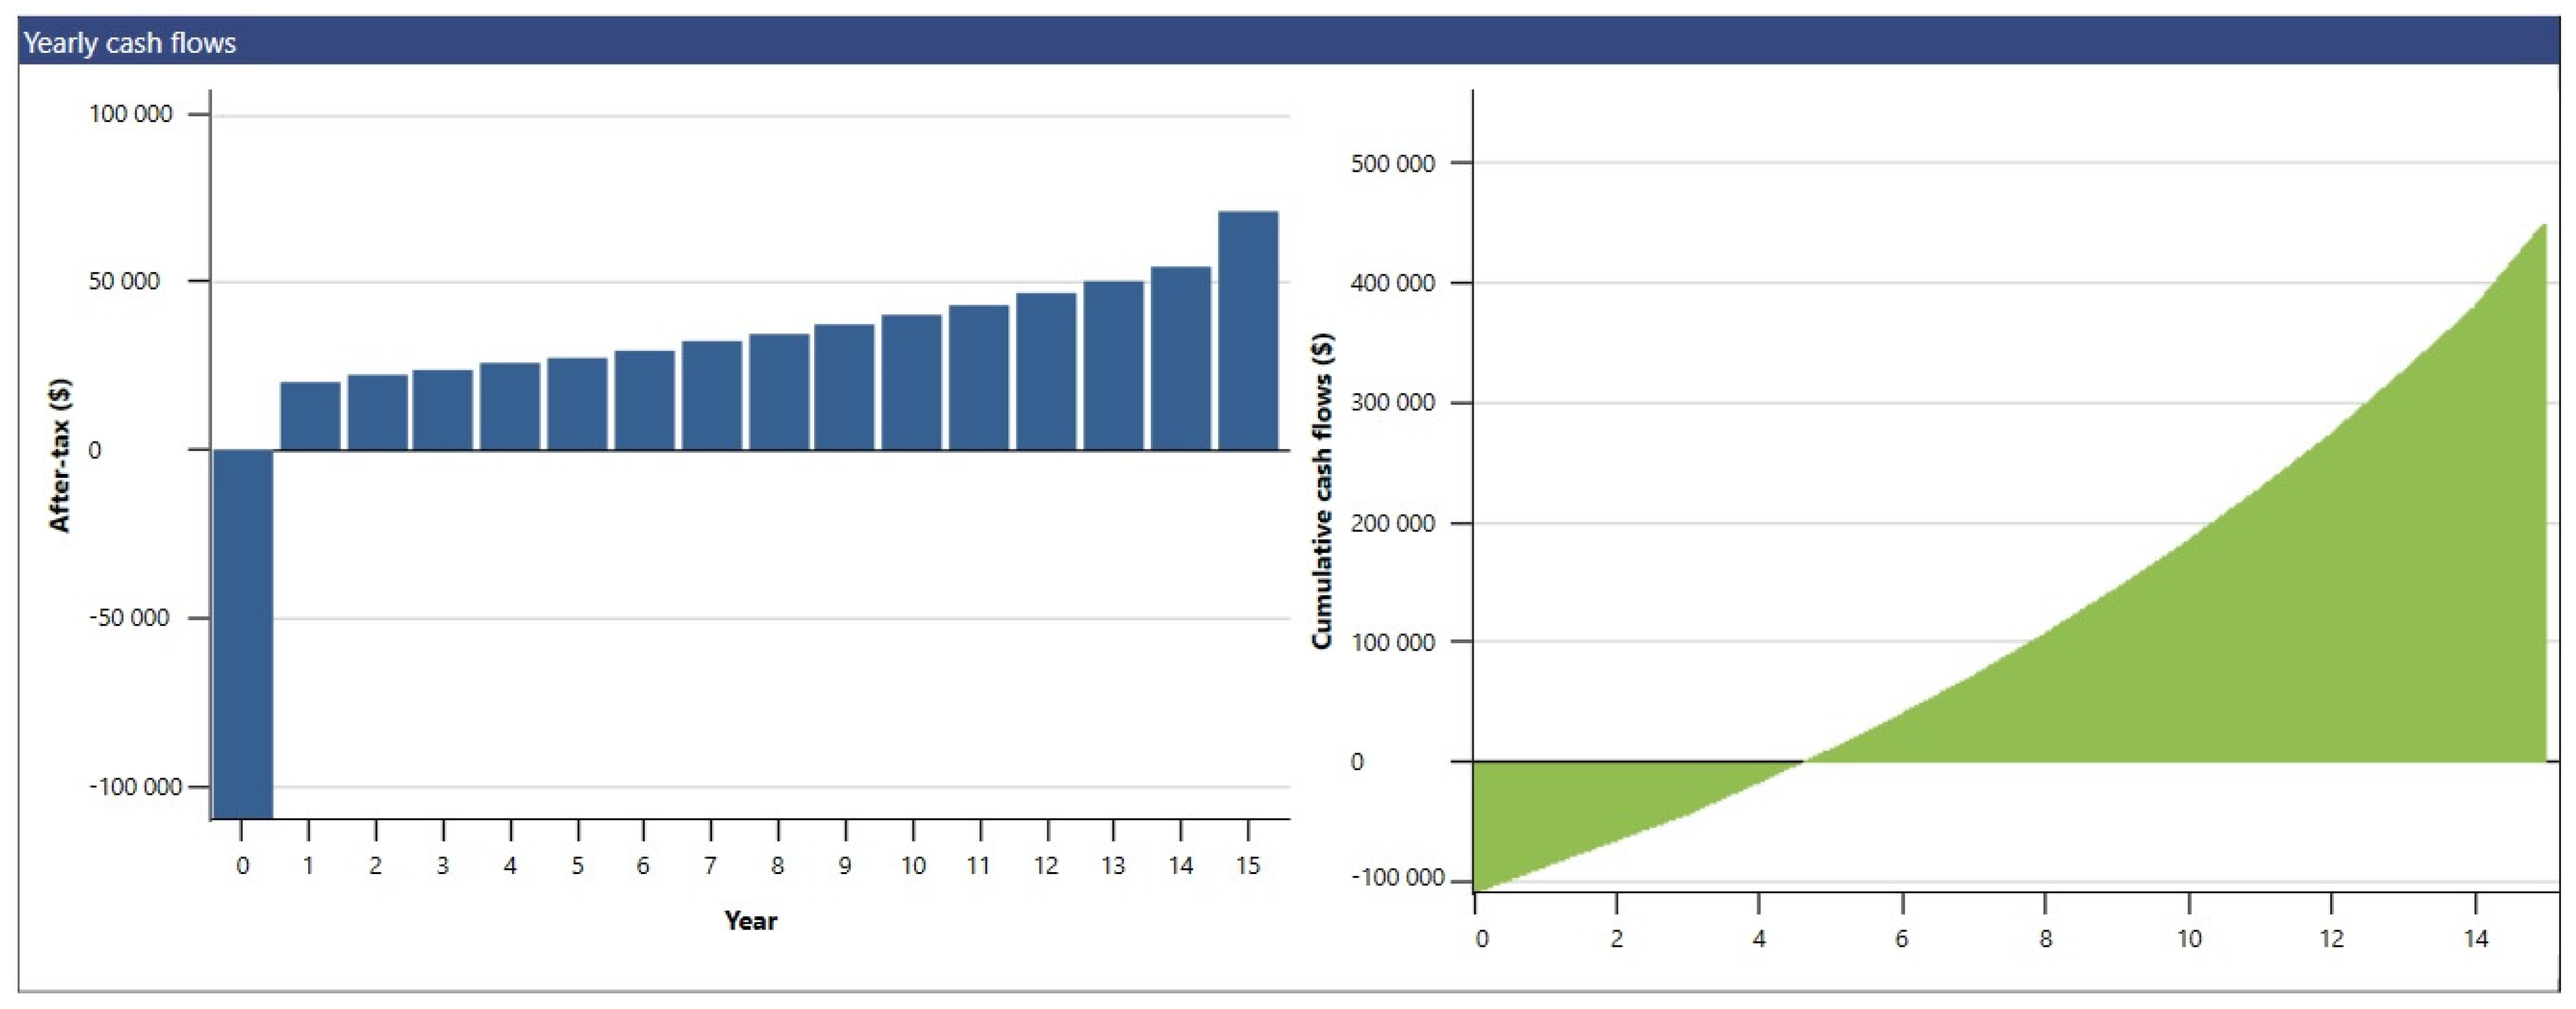
The annual and cumulative cash flows are shown in Figure 4. Initial losses were related to the investments made in the project and, after a period of about 5 years, the benefits from the investment were generated, which was also confirmed by the return on capital ratio. In this case, this conclusion may be consistent with the opinions indicating an increase in the time needed to return the capital by about 3–4 years.
The payback period was, therefore, one of the most important indicators assessed in the feasibility study. It is a way of assessing whether the project plan has a chance of success. The feasibility study assessed the actual feasibility of implementing the project plan. In the case of investment projects, what is important from the point of view of prosumers and political decision makers is how long it will take for the investment to pay off and what further planned savings will be made throughout the project’s life cycle. However, it should be remembered that the assessment of the indicator depends on certain arbitrarily adopted initial assumptions, which may determine different scenarios depending on the support policy used, the length of the entire project life cycle and the assumed economic parameters. Therefore, all parameters should be assessed as a whole rather than individually.

3.4. Financial Viability

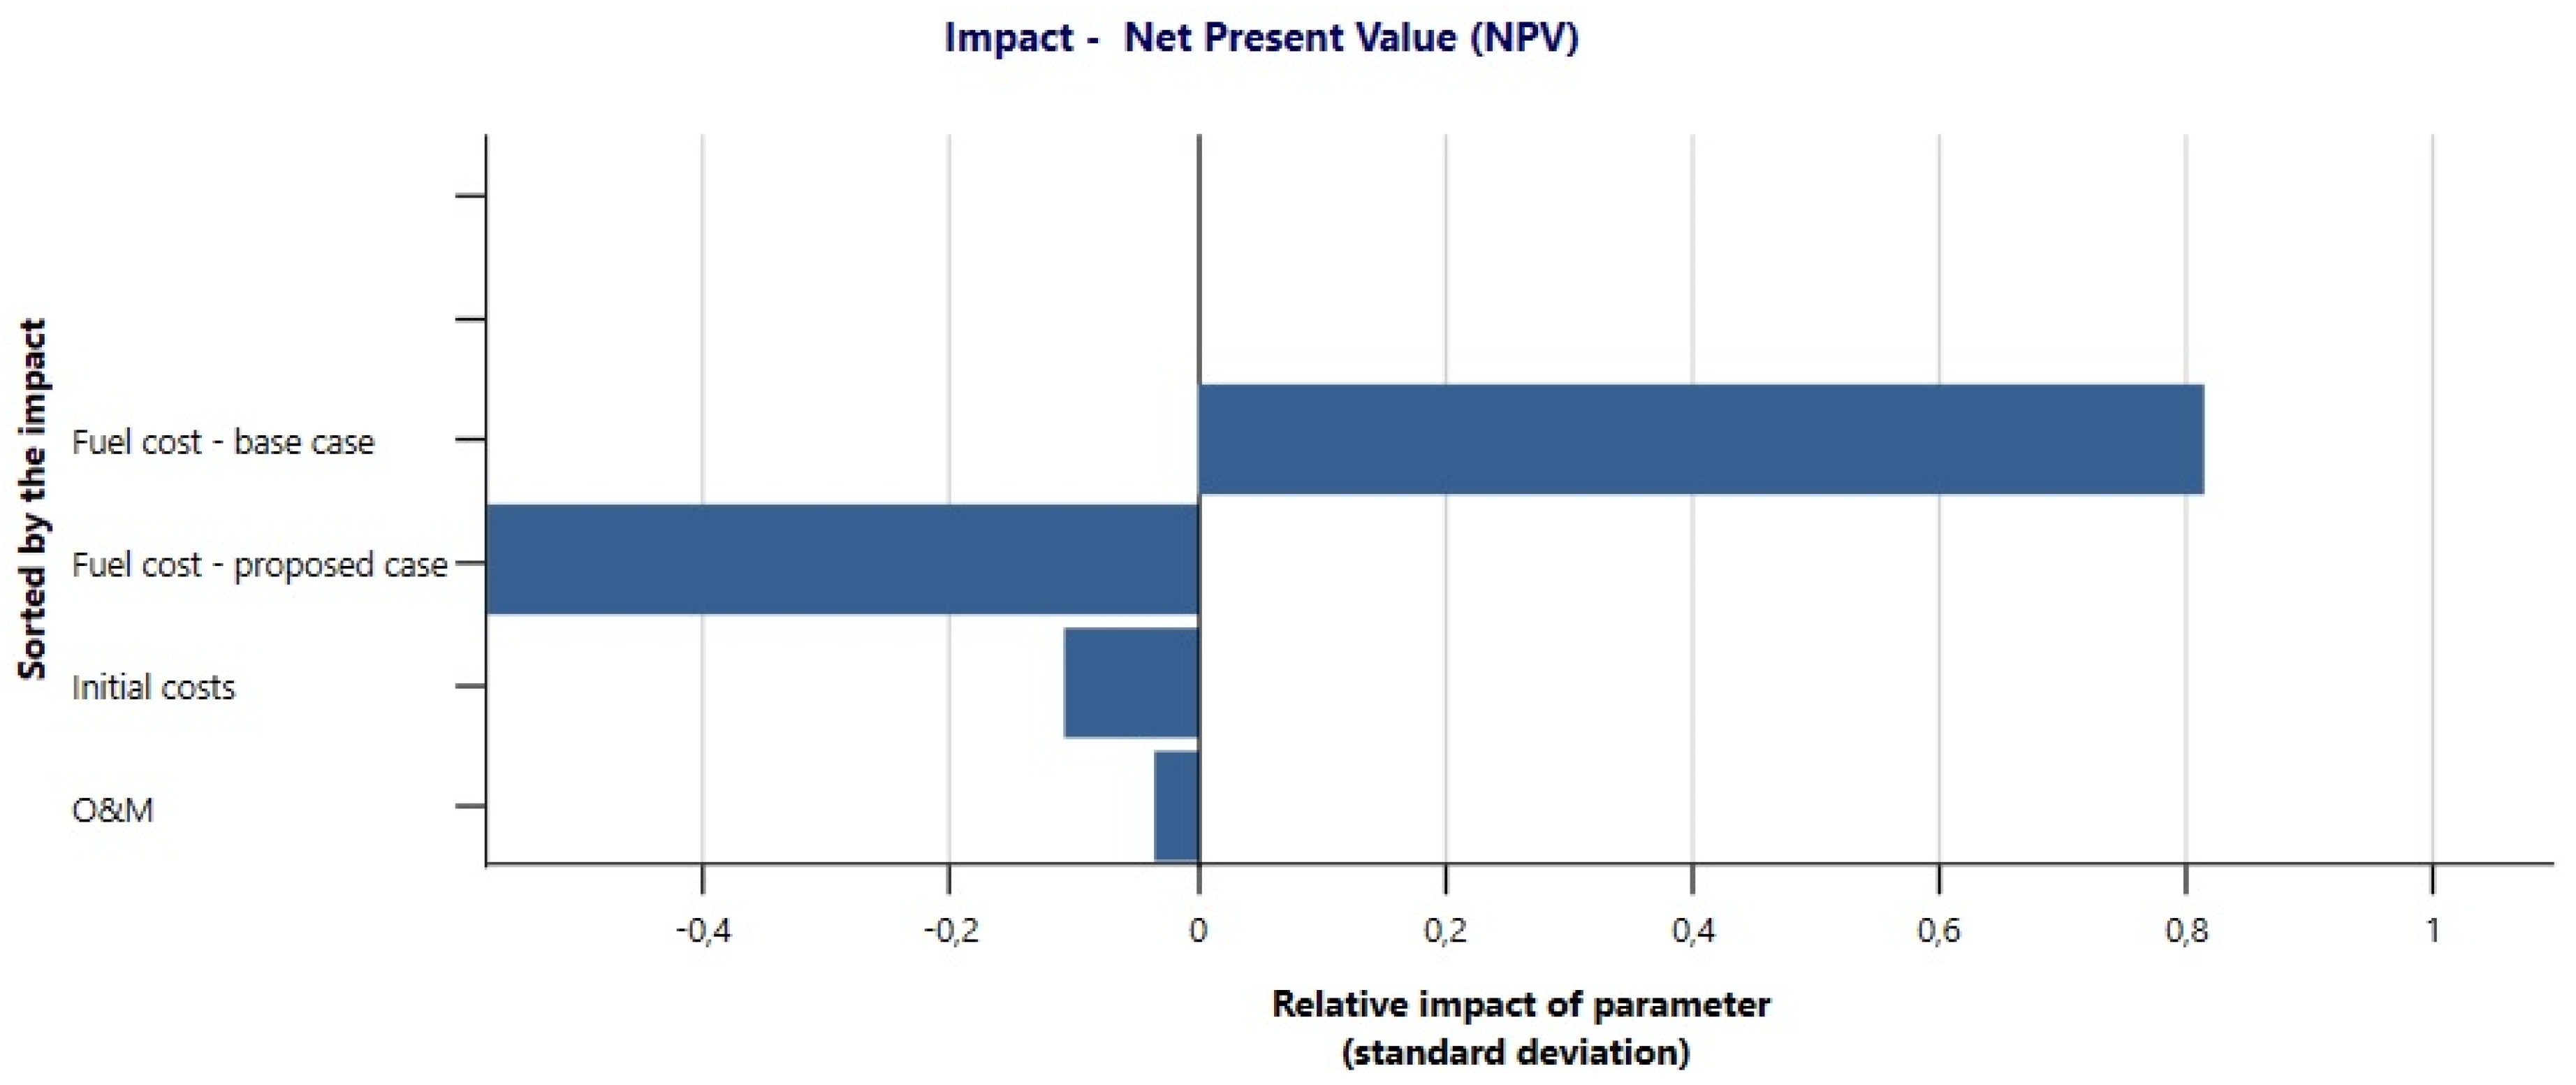
In the risk analysis section, the effect of each input parameter on the financial ratio was obtained by applying standard multiple linear regression to the financial ratio. The risk analysis was carried out using a Monte Carlo simulation that included 500 possible combinations of input variables. Risk analysis allows you to assess whether the volatility of a financial indicator is acceptable or not by looking at the distribution of possible outcomes. As indicated by the impact graph (Figure 5), the variability in energy production costs was the result of the variability of various parameters, and the directions of these changes were different. NPV was inversely related to initial costs, which had the greatest impact on NPV. Similar directions concerned planned changes in the costs of fuel and operation and maintenance.
Changes in NPV are shown in Figure 6 (and payback in Figure 7). This histogram shows the distribution of possible values of the financial indicator resulting from the Monte Carlo simulation. The height of each bar represents the frequency (%) of values falling within the range defined by the width of each bar. The analysis assumed an acceptable risk level of 10%.

3.5. GHG Reduction

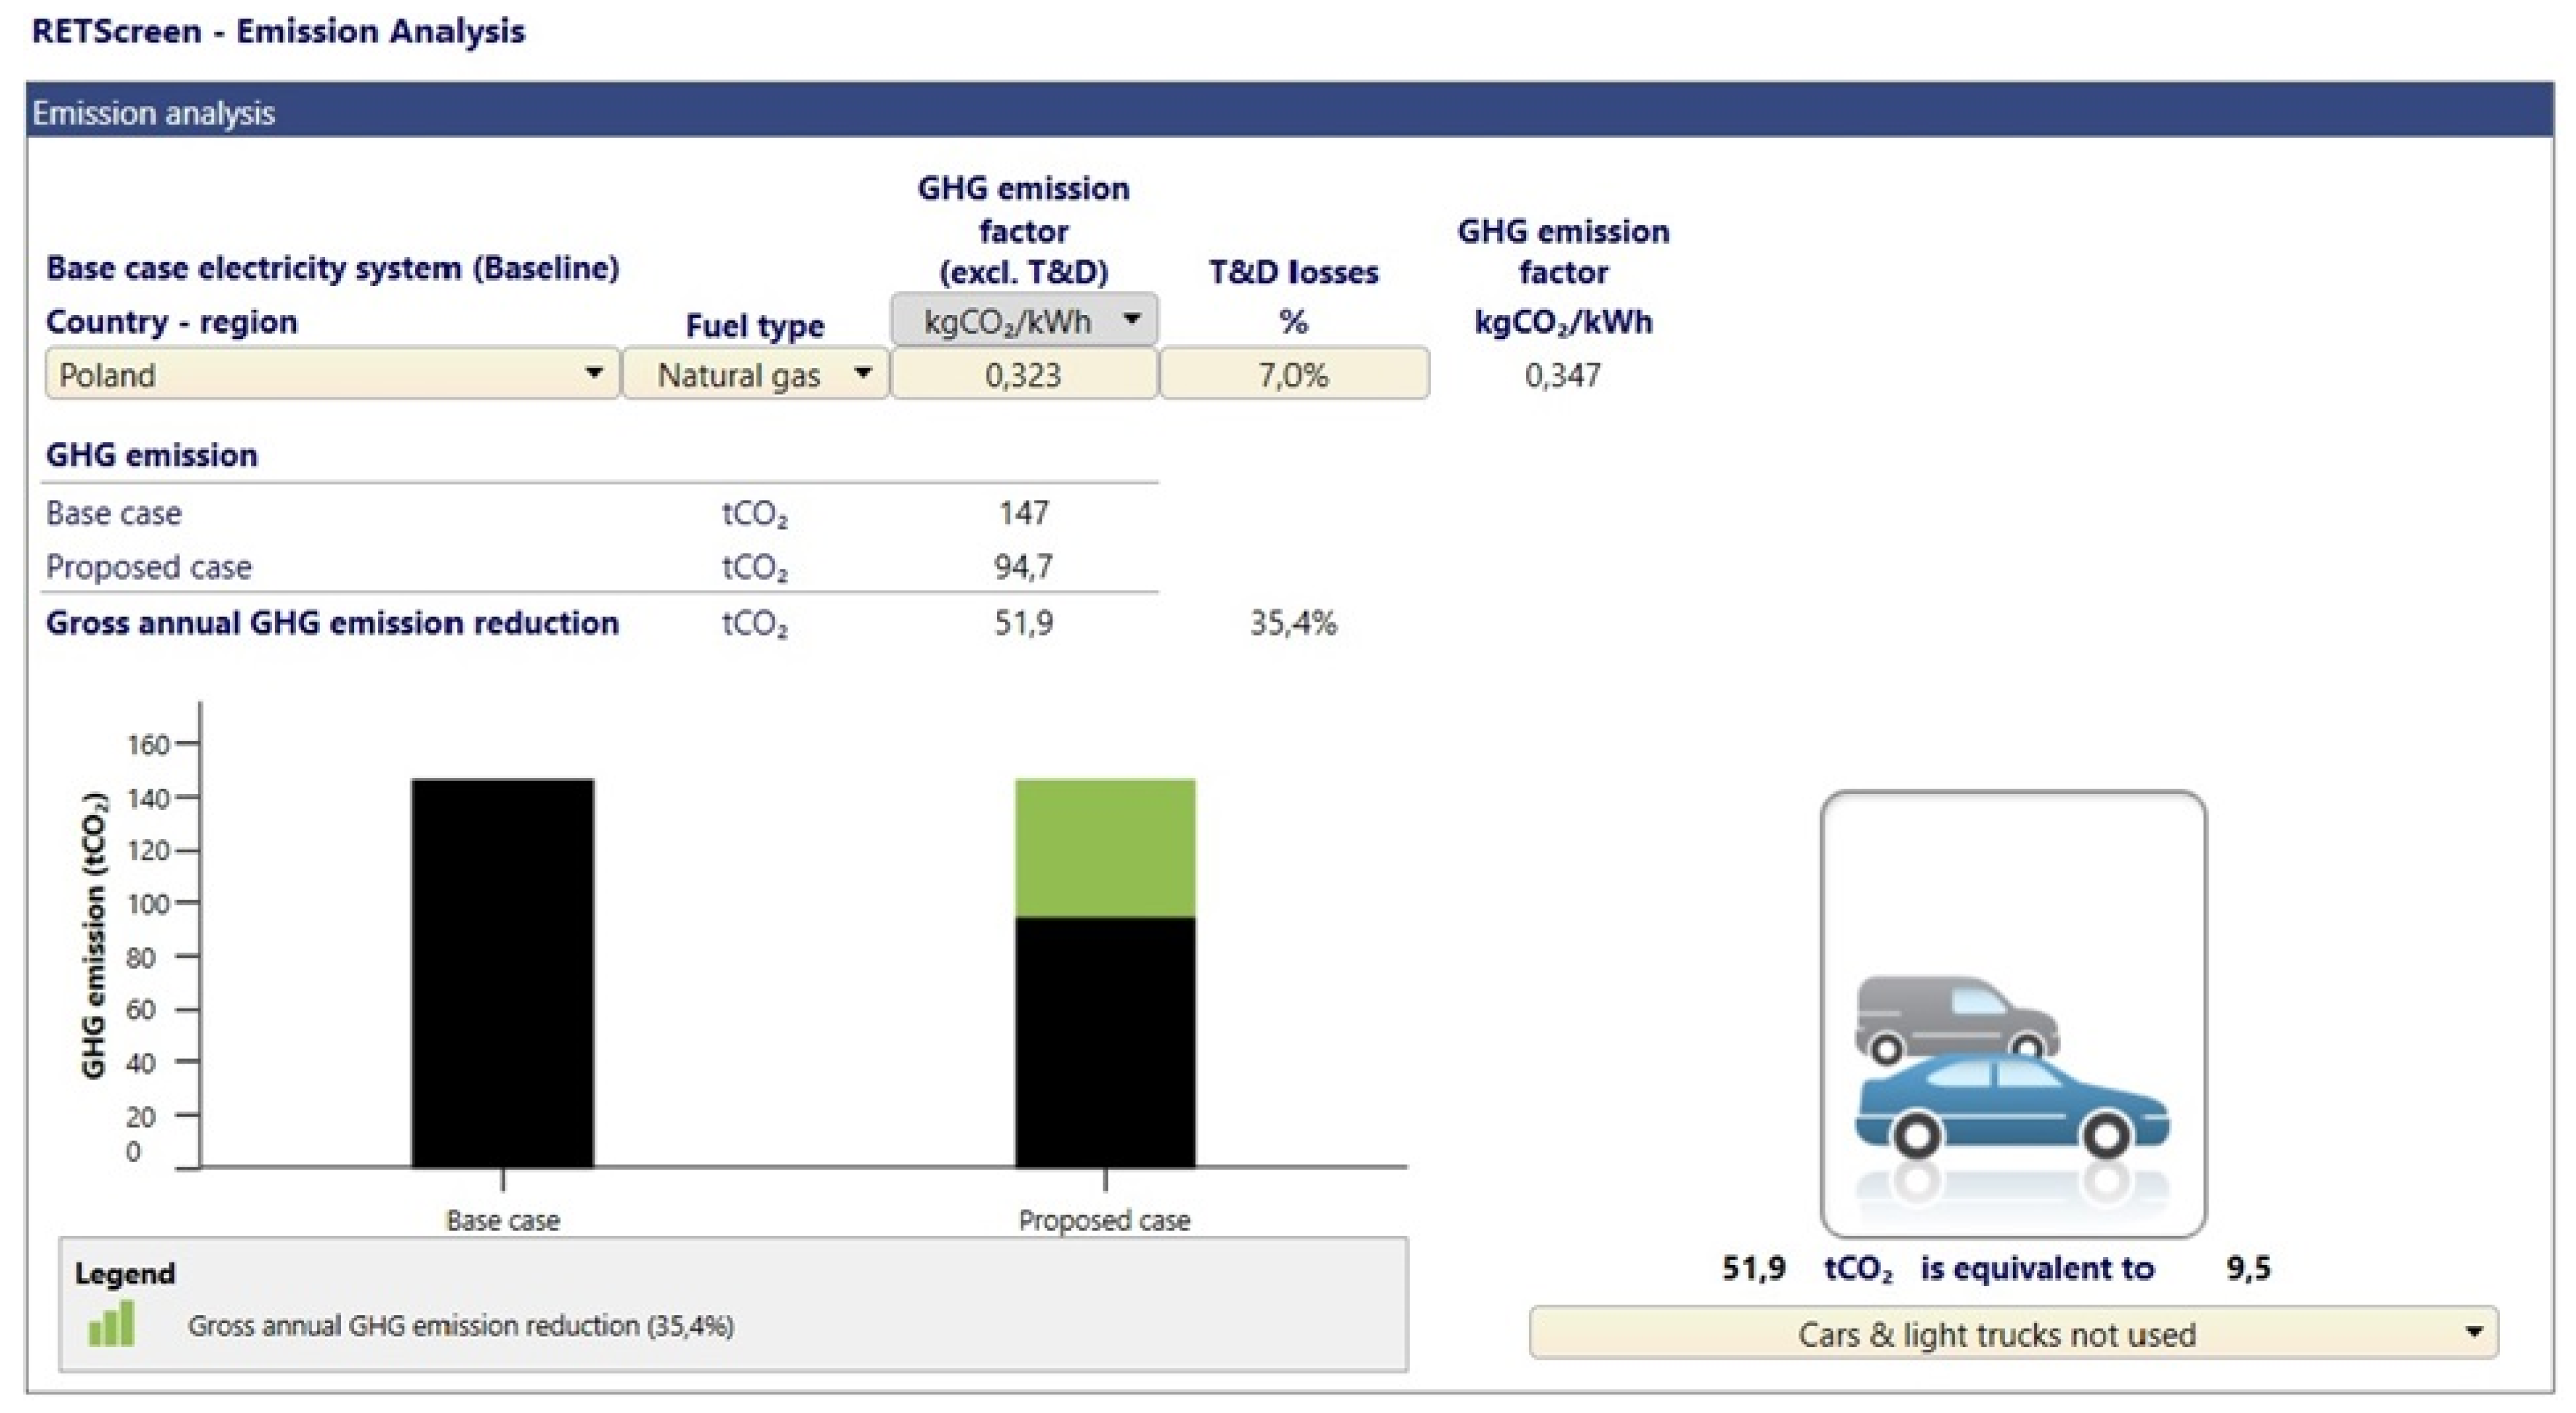
The adopted solutions, in addition to being financially viable, should be environmentally friendly, demonstrating the potential to reduce greenhouse gas emissions by the proposed facility. In the analyzed case, the annual emission reduction was 35.4, which corresponds to a reduction of 51.9 t CO2, which is equivalent to 9.5 idle cars and vans, 22,320 L of gasoline saved, 121 barrels of crude oil saved, 11.8 acres of forest coal or 17.9 tons of recycled waste (Figure 8).
The comparison between various zones within Poland showed differences in the payback period and the values of financial flows (Table 5). These differences did not determine the legitimacy of such investments. The largest spread in relation to the payback period was 1 year. Locations in Western Poland (Szczecin and Zielona Góra) turned out to be the most favorable for investments in photovoltaics. The least favorable among the respondents was Warsaw, followed by Białystok. The others were close to the most favorable locations. Therefore, if we consider only the natural conditions related to the issues of insolation, there were no significant differences between the majority of locations, which encourages the use of universal mechanisms to support the development of photovoltaics in Poland. At the same time, from a purely economic point of view, it allows for a relatively even distribution of its formation (apart from extreme locations) throughout the country, which is a clear advantage for its development.

4. Conclusions

The conducted research related to the process of evaluating investments in renewable energy sources has indicated several important premises for implementing policies in the field of energy grid development and decisions taken by business entities and households.
  • First of all, in the current climate conditions, it is necessary to combine several renewable energy sources and secure supplies with another non-renewable source. This is due to large annual and daily fluctuations in insolation and wind levels in individual regions of Poland. This allows for a more stable energy supply on an annual basis, although it still requires a different main source of energy.
  • Investments in photovoltaic panels are profitable even without state support. However, in such a situation, the payback period is relatively long and requires high initial capital. Energy growth has shortened the payback period for photovoltaic investments for the average household.
  • State support allows you to significantly reduce the initial investment cost to a greater extent compared to photovoltaic panels and, to a lesser extent, to gas turbines.
  • The conducted research showed the possibility of applying a universal support policy for photovoltaic systems due to similar natural conditions occurring in most locations in Poland.
  • For households, it is recommended to use renewable energy sources. On a broader scale, it is important to appropriately shape the policy of supporting investments in photovoltaic and wind installations as a motivating factor and shorten the payback period for investors.

Author Contributions

Conceptualization, Ł.A. and P.K.; methodology, Ł.A. and P.K.; software, Ł.A. and P.K.; validation, Ł.A. and P.K.; formal analysis, Ł.A. and P.K.; investigation, Ł.A. and P.K.; data curation, Ł.A. and P.K.; writing—original draft preparation, Ł.A. and P.K.; writing—review and editing, Ł.A. and P.K.; visualization, Ł.A. and P.K.; funding acquisition, Ł.A. and P.K. All authors have read and agreed to the published version of the manuscript.

Funding

This study was conducted and financed in the framework of the research projects: “Economic and social conditions for the development of renewable energy sources in rural areas in Poland”, grant No. 2021/43/B/HS4/00422, granted by the National Science Centre, Poland, program OPUS.

Data Availability Statement

The data comes from the Retscreen Expert database.

Conflicts of Interest

The authors declare no conflict of interest.

References

  1. Tomosk, S.; Haysom, J.E.; Hinzer, K.; Schriemer, H.; Wright, D. Mapping the geographic distribution of the economic viability of photovoltaic load displacement projects in SW USA. Renew. Energy 2017, 107, 101–112. [Google Scholar] [CrossRef]
  2. Yu, Z.J.; Carpenter, J.V., III; Holman, Z.C. Techno-economic viability of silicon-based tandem photovoltaic modules in the United States. Nat. Energy 2018, 3, 747–753. [Google Scholar] [CrossRef]
  3. Lima, D.A. Stochastic analysis of economic viability of photovoltaic panels installation for big consumers in Brazil. Electr. Power Syst. Res. 2019, 173, 164–172. [Google Scholar] [CrossRef]
  4. D′Adamo, I.; Falcone, P.M.; Gastaldi, M.; Morone, P. The economic viability of photovoltaic systems in public buildings: Evidence from Italy. Energy 2020, 207, 118316. [Google Scholar] [CrossRef]
  5. Moreda, G.P.; Muñoz-García, M.A.; Alonso-García, M.C.; Hernández-Callejo, L. Techno-economic viability of agro-photovoltaic irrigated arable lands in the EU-Med region: A case-study in southwestern Spain. Agronomy 2021, 11, 593. [Google Scholar] [CrossRef]
  6. de Melo, K.B.; da Silva, M.K.; de Souza Silva, J.L.; Costa, T.S.; Villalva, M.G. Study of energy improvement with the insertion of bifacial modules and solar trackers in photovoltaic installations in Brazil. Renew. Energy Focus 2022, 41, 179–187. [Google Scholar] [CrossRef]
  7. Farhangi, H.; Joós, G. Microgrid Planning and Design: A Concise Guide; John Wiley & Sons: Hoboken, NJ, USA, 2019. [Google Scholar]
  8. Shah, I.; Hiles, C.; Morley, B. How do oil prices, macroeconomic factors and policies affect the market for renewable energy? Appl. Energy 2018, 215, 87–97. [Google Scholar] [CrossRef]
  9. Kułyk, P.; Augustowski, Ł. Conditions of the occurrence of the environmental Kuznets curve in agricultural production of Central and Eastern European countries. Energies 2020, 13, 5478. [Google Scholar] [CrossRef]
  10. Rafindadi, A.A.; Usman, O. Globalization, energy use, and environmental degradation in South Africa: Starting empirical evidence from the Maki-cointegration test. J. Environ. Manag. 2019, 244, 265–275. [Google Scholar] [CrossRef]
  11. Ike, G.N.; Usman, O.; Alola, A.A.; Sarkodie, S.A. Environmental quality effects of income, energy prices and trade: The role of renewable energy consumption in G-7 countries. Sci. Total Environ. 2020, 721, 137813. [Google Scholar] [CrossRef] [PubMed]
  12. Londoño-Pulgarin, D.; Cardona-Montoya, G.; Restrepo, J.C.; Muñoz- Leiva, F. Fossil or bioenergy? Global fuel market trends, Renew. Sustain. Energy Rev. 2021, 143, 110905. [Google Scholar] [CrossRef]
  13. Washburn, C.; Pablo-Romero, M. Measures to promote renewable energies for electricity generation in Latin American countries. Energy Policy 2019, 128, 212–222. [Google Scholar] [CrossRef]
  14. Bergdahl, N.; Nouri, J. COVID-19 and Crisis-Prompted Distance Education in Sweden. Technol. Knowl. Learn. 2021, 26, 443–459. [Google Scholar] [CrossRef]
  15. Kabir, E.; Kumar, P.; Kumar, S.; Adelodun, A.A.; Kim, K.H. Solar energy: Potential and future prospects. Renew. Sustain. Energy Rev. 2018, 82, 894–900. [Google Scholar] [CrossRef]
  16. Olabi, A.G.; Abdelkareem, M.A. Renewable energy and climate change. Renew. Sustain. Energy Rev. 2022, 158, 112111. [Google Scholar] [CrossRef]
  17. Irfan, M.; Zhao, Z.Y.; Ahmad, M.; Mukeshimana, M.C. Solar energy development in Pakistan: Barriers and policy recommendations. Sustainability 2019, 11, 1206. [Google Scholar] [CrossRef]
  18. Bekun, F.V.; Alola, A.A.; Sarkodie, S.A. Toward a sustainable environment: Nexus between CO2 emissions, resource rent, renewable and nonrenewable energy in 16-EU countries. Sci. Total Environ. 2019, 657, 1023–1029. [Google Scholar] [CrossRef]
  19. Lieber, R. Europe and America in the World Energy Crisis. Int. Aff. 1979, 55, 531–545. [Google Scholar] [CrossRef]
  20. Żuk, P.; Żuk, P. National energy security or acceleration of transition? Energy policy after the war in Ukraine. Joule 2022, 6, 709–712. [Google Scholar] [CrossRef]
  21. Shafiee, S.; Topal, E. A long-term view of worldwide fossil fuel prices. Appl. Energy 2010, 87, 988–1000. [Google Scholar] [CrossRef]
  22. Chang, C.L.; McAleer, M.; Wang, Y.A. Herding behavior in energy stock markets during the Global Financial Crisis, SARS, and ongoing COVID-19. Renew. Sustain. Energy Rev. 2020, 134, 110349. [Google Scholar] [CrossRef] [PubMed]
  23. Tang, C.; Aruga, K. Effects of the 2008 Financial Crisis and COVID-19 Pandemic on the Dynamic Relationship between the Chinese and International Fossil Fuel Markets. J. Risk Financ. Manag. 2021, 14, 207. [Google Scholar] [CrossRef]
  24. Malwa, R.; Khan, Z.R. Design and Optimization of Hybrid Energy System for an Off-Grid Area of Bangladesh by using HOMER and Validation by RETScreen. In Proceedings of the International Conference on Mechanical, Industrial and Energy Engineering, Khulna, Bangladesh, 19–21 December 2020; pp. 1–6. [Google Scholar]
  25. Barik, D.; Arun, M.; Saeed, M.A.; Ramachandran, T. Experimental and Computational Analysis of Aluminum-Coated Dimple and Plain Tubes in Solar Water Heater System. Energies 2023, 16, 295. [Google Scholar] [CrossRef]
  26. Husain, A.A.F.; Phesal, M.H.A.; Ab Kadir, M.Z.A.; Amirulddin, U.A.U. Techno-Economic Analysis of Commercial Size Grid-Connected Rooftop Solar PV Systems in Malaysia under the NEM 3.0 Scheme. Appl. Sci. 2021, 11, 10118. [Google Scholar] [CrossRef]
  27. Serdari, E.; Berberi, P.; Muda, V.; Buzra, U.; Mitrushi, D.; Halili, D.; Bërdufi, I. A Methodology for Optimal Selection of a Wind Power Conversation System Based on Economic Analysis. J. Multidiscip. Eng. Sci. Technol. 2017, 4, 2342–2346. [Google Scholar]
  28. Poongavanam, P.; Chand, A.A.; Tai, V.B.; Gupta, Y.M.; Kuppusamy, M.; Dhanraj, J.A.; Velmurugan, K.; Rajagopal, R.; Ramachandran, T.; Prasad, K.A.; et al. Annual Thermal Management of the Photovoltaic Module to Enhance Electrical Power and Efficiency Using Heat Batteries. Energies 2023, 16, 4049. [Google Scholar] [CrossRef]
  29. Ramachandran, T.; Mourad, A.-H.I.; Hamed, F. Review on Solar Energy Utilization and Projects: Development in and around the UAE. Energies 2022, 15, 3754. [Google Scholar] [CrossRef]
  30. Nizamudeen, C.; Krishnapriya, R.; Mozumder, M.S.; Mourad, A.-H.I.; Ramachandran, T. Photovoltaic performance of MOF-derived transition metal doped titania-based photoanodes for DSSCs. Sci. Rep. 2023, 13, 6345. [Google Scholar] [CrossRef]
  31. Chaitanya, B.; Akhter, M.Z.; Ramachandran, T.; Al-Marzouqi, A.H.; Omar, F.K. Trends in Solar Powered Water Desalination Using Hydrogels: A Short Review. In Proceedings of the 2023 Advances in Science and Engineering Technology International Conferences (ASET), Dubai, United Arab Emirates, 20–23 February 2023. [Google Scholar] [CrossRef]
  32. Chitedze, I.; Cosmas, N.C.; Ang’u, C. Financial Modeling of Feed-In Tariff for Increasing Solar Photovoltaic Energy Portfolio in Malawi. J. Energy Nat. Resour. 2020, 9, 14–27. [Google Scholar] [CrossRef]
  33. Owolabi, A.B.; Nsafon, B.E.K.; Roh, J.W.; Suh, D.; Huh, J.S. Measurement and verification analysis on the energy performance of a retrofit residential building after energy efficiency measures using RETScreen Expert. Alex. Eng. J. 2020, 59, 4643–4657. [Google Scholar] [CrossRef]
  34. Kassem, Y.; Çamur, H.; Aateg, R.A.F. Exploring Solar and Wind Energy as a Power Generation Source for Solving the Electricity Crisis in Libya. Energies 2020, 13, 3708. [Google Scholar] [CrossRef]
  35. Samuel, L. Economic analysis and emission analysis for gridconnected 1kw solar roof top photovoltaic power system using RetScreen expert software: Sase study on Trivandrum district, India. Pollut. Res. 2020, 39, 113–116. [Google Scholar]
  36. Owolabi, A.B.; Nsafon, B.E.K.; Roh, J.W.; Suh, D.; Huh, J.S. Validating the techno-economic and environmental sustainability of solar PV technology in Nigeria using RETScreen Experts to assess its viability. Sustain. Energy Technol. Assess. 2019, 36, 100542. [Google Scholar] [CrossRef]
  37. Saad, M.; Sultan, H.M.; Abdeltwab, A.; Diab, A.A.Z. Feasibility Study of a Small-Scale Grid-Connected PV Power Plants in Egypt; Case Study: New Valley Governorate. Int. J. Adv. Comput. Sci. Appl. 2021, 12, 624–631. [Google Scholar] [CrossRef]
  38. Nkwetta, D.N. Design, feasibility, performance assessment and optimization of the technical and financial viability of potential renewable energy and energy efficiency projects. Int. J. Energy Technol. 2019, 1, 1–19. [Google Scholar] [CrossRef]
  39. Mehmood, A.; Shaikh, F.A.; Waqas, A. Modeling of the solar photovoltaic systems to fulfill the energy demand of the domestic sector of Pakistan using RETScreen software. In Proceedings of the 2014 International Conference and Utility Exhibition on Green Energy for Sustainable Development (ICUE), Pattaya, Thailand, 19–21 March 2014; pp. 1–7. [Google Scholar]
  40. Ahmed, W.; Sheikh, J.A.; Kouzani, A.Z.; Mahmud, M.A.P. The Role of Single End-Users and Producers on GHG Mitigation in Pakistan—A Case Study. Sustainability 2020, 12, 8351. [Google Scholar] [CrossRef]
  41. Kułyk, P.; Augustowski, Ł. Economic Profitability of a Hybrid Approach to Powering Residual Households from Natural Sources in Two Wind Zones of the Lubuskie Voivodeship in Poland. Energies 2021, 14, 6869. [Google Scholar] [CrossRef]
  42. Yendaluru, R.S.; Karthikeyan, G.; Jaishankar, A.; Babu, S. Techno-economic feasibility analysis of integrating grid-tied solar PV plant in a wind farm at Harapanahalli, India. Environ. Prog. Sustain. Energy 2020, 39, e13374. [Google Scholar] [CrossRef]
  43. Pratik, K.; Ravi, T.A.V. A Sustainable Business Framework Using Solar and Bio-Energy to Instate Incessant Power in Rural India: Optimal Scheduling, Smart Metering, and Economic Viability. IEEE Reliab. Soc. Sect. 2020, 10, 11021–11035. [Google Scholar]
  44. Available online: https://wloclawek.naszemiasto.pl/fotowoltaika-drozeje-i-zwrot-sie-dluzej-rzad-nie-planuje/ar/c9-8860515 (accessed on 14 October 2023).
  45. Hariyanto, H.; Parenden, D.; Vinceviča-Gaile, Z.; Gamawati Adinurani, P. Potential of New and Renewable Energy in Merauke Regency as the Future Energy. E3S Web Conf. 2020, 190, 00012. [Google Scholar] [CrossRef]
  46. Available online: https://fgenergy.pl/naslonecznienie-w-polsce-praw-na-naszej-mapie-stan-naslonecznienia-w-swoim-regionie/ (accessed on 14 October 2023).
  47. What Is Measurement and Verification (M&V)—Efficiency Valuation Organization (EVO). Available online: https://evo-world.org/en/mv/what-is-mv (accessed on 14 October 2023).
  48. Choi, J. Case studies of the design construction and certification of energy-efficient houses in the republic of KOREA. Archit. Eng. 2017, 2, 3–8. [Google Scholar] [CrossRef]
Figure 1. Map of Poland’s insolation. Source: [46].
Energies 16 07595 g001
Figure 2. Annual course of solar radiation and air temperature in the province Lubuskie. Source: own study using RetScreen Expert software.
Energies 16 07595 g002
Figure 3. Photovoltaic electricity potential in Europe. Source: solar resource map © 2021 Solargis, https://solargis.com (accessed on 14 October 2023).
Energies 16 07595 g003
Figure 4. Annual and cumulative cash flows. Source: own study using RetScreen Expert software.
Energies 16 07595 g004
Figure 5. Impact graph. Source: own study using RetScreen Expert software.
Energies 16 07595 g005
Figure 6. NPV distribution. Source: own study using RetScreen Expert software.
Energies 16 07595 g006
Figure 7. Payback distribution. Source: own study using RetScreen Expert software.
Energies 16 07595 g007
Figure 8. Evaluation of GHG emission reductions. Source: own study using RetScreen Expert software.
Energies 16 07595 g008
Table 1. Atmospheric conditions for renewable energy installations. Source: own study using RetScreen Expert software.
UnitClimate data locationFacility locationSource
Latitude 51.951.9
Longitude 15.515.5
Climate zone 5A–Cool–HumidGround + NASA
Elevationm192177Ground − Map
Heating design temperature°C−10.2 Ground
Cooling design temperature°C27.3 Ground
Earth temperature amplitude°C18.9 NASA
MonthAir temperatureRelative humidityPercipitationDaily solar radiationAtmospheric pressureWind speedEarth temperatureHeating degree-days 18 °CCooling degree-days 10 °C
°C%mmkWh/m2/dkPam/s°C°C-d°C-d
January−0.785.9%43.710.88100.43.6−2.55800
February0.181.8%37.521.58100.33.6−1.15010
March3.476.4%45.262.51100.23.43.04530
April8.669.0%37.503.71100.03.19.02820
May13.967.6%52.704.71100.22.814.7127121
June16.369.5%65.104.72100.22.717.851189
July18.967.8%82.464.75100.22.720.10276
August18.468.9%67.274.32100.22.619.60260
September14.177.2%48.902.83100.32.814.5117123
October9.382.0%36.581.70100.43.09.02700
November3.588.0%46.500.91100.23.12.84350
December0.588.5%46.810.69100.33.5−1.25430
Annual8.976.9%610.312.78100.23.18.93358969
SourceGroundGroundNASANASANASAGroundNASAGroundGround
Measured at m100
Table 2. Assumed economic parameters.
General
fuel cost escalation rate%8%
inflation rate%6%
discount rate%7.5%
reinvestment rate%8%
project lifeyr15
Finance
incentives and grantsPLN1555
debt ratio%0%
Source: own study using RetScreen Expert software.
Table 3. Assumed economic parameters—costs and savings.
Initial Costs
Incremental initial costsPLN111,327
Total initial costsPLN111,327
Incentives and grantsPLN1555
Yearly cash flow—Year 1
Annual costs and debt payments
O&M costs (savings)PLN−3112
Fuel costs in proposed casePLN46,192
Debt paymentsPLN0
Total annual costs 43,080
Annual savings and revenue
Fuel costs—base casePLN66,215
Total annual savings and revenuePLN66,215
Net yearly cash flow—Year 1PLN23,134.61
Source: own study using RetScreen Expert software.
Table 5. Comparison of the profitability of photovoltaic installations in different locations in Poland.
IndicatorZielona GóraRzeszówWrocławKrakówŁódźWarszawaBialystokSzczecinGdańskPoznań
Pre-tax IRR equity (%)28.928.228.128.228.124.426.129.12728.6
Pre-tax MIRR equity (%)16.516.216.216.316.21515.616.515.916.4
Pre-tax IRR assets (%)28.928.228.128.228.124.426.129.12728.6
Pre-tax MIRR assets (%)16.516.216.216.316.21515.616.515.916.4
Simple payback (yr)4.74.94.94.94.95.75.34.75.14.8
Equity payback (yr)4.64.84.84.74.85.45.14.64.94.7
Net Present Value (NPV) (PLN)185,935177,136176,283178,045176,719135,081153,684188,390164,207181,889
Annual life cycle savings (PLN/yr)21,06420,06719,97120,17020,02015,30317,41021,34218,60320,606
Benefit–cost ratio2.72.62.62.62.62.22.42.72.52.6
Source: own study using RetScreen Expert software.
Disclaimer/Publisher’s Note: The statements, opinions and data contained in all publications are solely those of the individual author(s) and contributor(s) and not of MDPI and/or the editor(s). MDPI and/or the editor(s) disclaim responsibility for any injury to people or property resulting from any ideas, methods, instructions or products referred to in the content.