Article

Towards Carbon Neutrality and Circular Economy in the Glass Industry by Using the Production Decision Model

1
Department of Accounting Information, National Taichung University of Science and Technology, Taichung 40343, Taiwan
2
Department of Business Administration, National Central University, Jhongli, Taoyuan 32001, Taiwan
*
Author to whom correspondence should be addressed.
Energies 2023, 16(22), 7570; https://doi.org/10.3390/en16227570
Submission received: 24 September 2023 / Revised: 7 November 2023 / Accepted: 9 November 2023 / Published: 14 November 2023
(This article belongs to the Topic Multiple Roads to Achieve Net-Zero Emissions by 2050)

Abstract

:
In the modern age, where global warming is intensifying year by year, carbon reduction has long been an issue that countries all over the world must pay attention to. Therefore, governments have established a carbon tax and trading system to control the total carbon emissions of each country. According to the European Container Glass Federation (FEVE), every 10% recycled waste glass can reduce carbon dioxide emissions by 5%. Recycling waste glass will not only save the cost of raw materials but also make a significant contribution to sustainable development. This study uses the circular economy concept in the glass industry to recycle waste glass. It combines activity-based costing (ABC) and the Theory of Constraints (TOCs) to establish a production decision-making model, including carbon tax and trading. The objectives of this study are to solve the problem through mathematical programming to explore the impact of the carbon tax and carbon rights cost on corporate profits and to provide the government with the results as a reference for establishing a carbon tax system.

1. Introduction

The rapid development of modern science, technology, and civilization has brought a lot of convenience to the lives of the public. However, many side effects allow us to enjoy a comfortable life. Environmental issues are one of the most attention-getting concerns for countries in the world. Due to the excessive carbon emissions caused by humans, the global greenhouse effect is increasing daily [1]. In recent years, disasters caused by climate change have gradually emerged around the world. For example, last year’s heavy rain in Europe and wildfires in Spain, etc., all illustrate the urgency to deal with the greenhouse effect problem [2,3,4,5]. Countries have successively proposed “2050 net zero emissions” [5]. Taiwan is also keeping up with international trends; in September 2021, under the leadership of 27 domestic and foreign companies such as Sinosteel, Chunghwa Telecom, ASE, Far EasTone, and Taiwan Cement, it announced the establishment of the “Taiwan Net Zero Action Alliance” with specific goals, with the hope to achieve zero carbon emissions in office sites by 2030 and zero carbon emissions in office and production sites by 2050. In March 2022, the government officially announced “Taiwan’s 2050 Net Zero Emissions Pathway and Strategy General Explanation”, which will implement the four major transformation strategies of energy, industry, life, and society, hoping to move towards net zero in 2050 in accordance with the international target [6]. Carbon fees, carbon taxes, carbon rights trading, carbon footprints, and other methods are all of the measures that can be taken to achieve “2050 Net Zero Emissions”, and the National Legislative Yuan also passed the “Climate Change Response Law” in the third reading in 2023, incorporating the 2050 net-zero emission target into law, and it officially launch the carbon fee collection mechanism, which is expected to be found in 2024 [7]. The first wave will collect carbon fees for 287 large carbon emitters whose annual emissions exceed 25,000 metric tons. It plans to establish a carbon rights trading system [7].
The glass industry is a high-energy-consuming industry that consumes many resources—during glass production, waste gas, wastewater, and noise generated from raw materials, melting, forming, and annealing cause particular environmental pollution, mainly to the atmosphere and water [8]. The glass industry’s environmental pollution involves many areas, including the glass and harmful substances produced during production [8]. Glass is an important material but also fragile. At the same time, the glass manufacturing process is not environmentally friendly [9]. At least 86 million tons of carbon dioxide are emitted from glass production every year. But glass remains the packaging of choice for protecting the planet. Glass is made entirely from natural raw materials and can be recycled and recycled endlessly into new bottles and jars. This reduces waste, reduces CO2 emissions, and saves raw materials. According to the European Container Glass Federation (FEVE), every 10% of recycled waste glass can reduce carbon dioxide emissions by 5%. The industry is working to make glass production more sustainable and climate neutral by designing more efficient furnaces to reduce carbon emissions by up to 60%. In recent years, the international net-zero carbon emission trend has also affected the glass industry, which will have a transformative impact through lightweight changes [10]. Light glass and glass recycling are solutions to reduce the effect of carbon dioxide in the glass industry [11,12]. This study will take the glass industry as an example to explore its continuous production decision-making model under the green economy, including the carbon tax system, carbon rights trading system, recycling system (circular economy), the carbon emission cost, and the operating cost.
In addition, this article not only analyzes the different carbon tax cost equations and carbon rights trading mechanisms of the glass industry under the green economy and circular economy but also considers the carbon reduction impact of adding appropriate recycled raw materials in the glass production process. The best production plan simulates how the enterprise can achieve the maximum profit under the product configuration, cost consumption, and production quantity and observes how various carbon taxes, carbon rights trading mechanisms, and recycling systems will affect the carbon emissions and profits of the enterprise—a kind of influence [13,14,15,16]. The rest of this study will be arranged as follows: section two discusses the carbon emission of the glass industry and the development of a circular economy, carbon tax and carbon rights-related systems, and the application of green activity-based costing and the restriction theory. The third section presents the production process of this study and the single-phase and multi-phase production model planning of the eight carbon emission functions. The fourth section includes the sample data of the enterprise (the data are the basic parameters of the model in the third chapter), the comparison of simple models, and the data integration and analysis of the research results. Section five involves a brief discussion.

2. Literature Review

2.1. Carbon Emissions and Circular Economy Development in the Glass Industry

Ingrao et al. (2021) claimed that a large amount of glass packaging is produced globally, and the waste of glass disposal after use causes environmental problems. Therefore, efforts need to be made to optimize and promote glass reuse and recycling practices in a circular economy and with the value-added orientation of waste [17]. Glass is made by blending and mixing the required raw materials and then firing in a smelting furnace at 1500 °C. From this, we can see that it is an industry with high energy consumption and high carbon emissions [18]. With a global focus on energy saving, carbon reduction, and environmental protection [19], the trend must start from the ecological strategy of sustainable development [19]. Green production processes such as air pollution control, greenhouse gas reduction, water pollution control, waste management, and reuse in green production should be necessary for the glass industry to rebuild new life strategies and means [20]. Glass has the characteristic of a stable composition, so many chemicals are stored in glass bottles, but at the same time, its other non-perishable part has brought many problems to the environment; whether it is incinerated or buried, it cannot effectively treat waste. Lin et al. (2018) showed that recovering and stabilizing supply chain waste and reusing raw materials under a circular economy can promote economic growth and avoid environmental damages [20]. Glass shards will become challenging to decompose in the background [20]. However, glass is a material that can be wholly reused and recycled. It has a specific recycling value and can be remade into various glass products or raw materials. If recycled materials are not used to produce brand-new glass products, high carbon emissions will be generated when the raw materials are burned and heated [21]. In comparison, the combustion temperature required for recycling waste glass is lower and less like natural materials such as silicon dioxide. A large amount of carbon dioxide is produced during combustion. It can be seen that recycling waste glass for reuse can effectively reduce carbon emissions.
For the domestic industry, Taiwan Glass invests more than TWD 24 million in the environmental protection of each factory area, including investing in equipment, improving manufacturing processes, and holding relevant personnel training, etc., to achieve the goal of energy improvements and pollution reduction. At the same time, Taiwan Glass also has a recycling processing center, which cleans and reuses recycled glass and uses it in various factories. In addition, it also purchases used waste glass containers in the market. These can be turned into glass raw materials after selection, washing, crushing, and screening procedures. In 2021, flat and container glass recycling rates reached 19.37% and 47.92%, respectively, as shown in Table 1. Taiwan Glass will continue to improve the glass recycling rate, reduce waste and the use of burning raw materials, and reduce carbon emissions. (Taiwan Glass Sustainable Development Report, 2021.)

2.2. Carbon Tax, Carbon Fee Collection, and Carbon Rights Trading System

Carbon fee and tax (carbon tax): their two meanings are not far apart, with only legal differences [22]. They both directly set a reasonable price for each ton of carbon emissions and affect enterprises by controlling prices [23]. This method is internationally recognized as the most effective carbon reduction tool in carbon emission-related decision making [24]. However, one of the critical points of this method is the “fee rate”. If the rate is too high, it will quickly lead to a rebound of the enterprise. If the rate is too low or too many tax exemptions (fees) are given, the enterprise will not be able to attain carbon reduction. To instill pressure, for example, the South Korean government launched KETS (Korea Emissions Trading Scheme), the world’s second-largest carbon trading system, in 2015. However, the trend of South Korean carbon emissions will remain the same but rise in the next few years. More than 97% of the free carbon emission certificates have been given to various enterprises, which has caused many enterprises to use up their free quotas. Therefore, they do not even need to pay carbon taxes, and naturally, they cannot achieve the effect of carbon reduction [24]. Thus, the carbon tax policy still requires countries worldwide to gradually develop reasonable rates and other related supporting measures to fully exert its effectiveness and jointly achieve the ultimate goal of reducing carbon emissions [25]. The government implements a carbon tax, which is levied uniformly by the Ministry of Finance. After the tax is collected into the national treasury, it can be regarded as fiscal revenue for the entire government. Its uses include social welfare, income tax reduction and exemption, and the development of various low-carbon infrastructure. The “Carbon fee” implemented in Taiwan’s “Climate Change Response Act” in 2022 is relatively unique. The Ministry of Environment and Resources mainly implements it. It collects carbon fees from large carbon emitters and establishes a climate fund for developing low-carbon methods, green energy, subsidies for industrial transformations, and other measures.
The “Coase Theorem”, proposed by Coase (1960), is an essential economic achievement [26]. It points out how, under certain conditions, economic actors can find practical solutions to externalities without direct government involvement [26]. Carbon rights trading originated from the Coase theorem, which means that no matter whom the rights are allocated to, if there is no transaction cost or the transaction cost is extremely small, people will automatically solve the problem of external effects through market transactions, causing resources to have the most suitable distribution. Carbon rights can be divided into two types, one of which is through government-mandated Cap and Trade; the European Union Emission Trading System (EUETS) belongs to this type. The other is generated in the voluntary market and is often used by enterprises as a carbon offset. When a company successfully reduces carbon and has excess carbon credits, it can be sold to companies needing more carbon credits [27]. For example, the electric car brand Tesla has many unused carbon rights that can be auctioned to other fuel vehicle manufacturers, and even in the first quarter of 2021, the revenue from carbon rights trading will exceed the industry’s revenue. In the long run, companies that need to continue to spend extra revenue to purchase carbon credits will be overwhelmed and will increase carbon reduction measures accordingly, thereby reducing total carbon emissions.

2.3. Green Activity-Based Costing and Theory of Constraints

These two methods are two theories that will be applied in the mathematical programming model of this study. Activity-based costing (ABC) is a method to help companies effectively estimate production and environmental costs [28,29,30]. This method disassembles each product or service into the most basic operating activities and then uses accurate cost-tracing and allocation methods to calculate a reasonable cost [14,16,31]. In cost calculation, direct cost is easier to be accurate retroactively [13]. However, the allocation of indirect costs has become a critical point. After obtaining reasonable cost information, enterprises can effectively select and adjust product mixes to reduce production costs and increase profits [14]. The Theory of Constraints (TOCs) was proposed initially by the Israeli scholar Eliyahu M. Goldratt [32]. This is an all-round management concept [33]. Its basic assumption is that there is a bottleneck in the production system, which determines the output rate of the production system. Goldratt believed that the organization’s resources, labor force, etc., are limited and that all kinds of resources cannot have an upper limit. Managers need to use these constraints as standards for production efficiency, to maximize production and utility under these resource constraints, and to use the activity-based cost system to find the enterprise’s most appropriate product mix configuration. Goldratt used this theory to identify problem points and find ways to break through these limitations [32]. For example, human resource shortages can be solved by working overtime, and equipment capacity shortages can be solved by renting new equipment.

3. Research Design

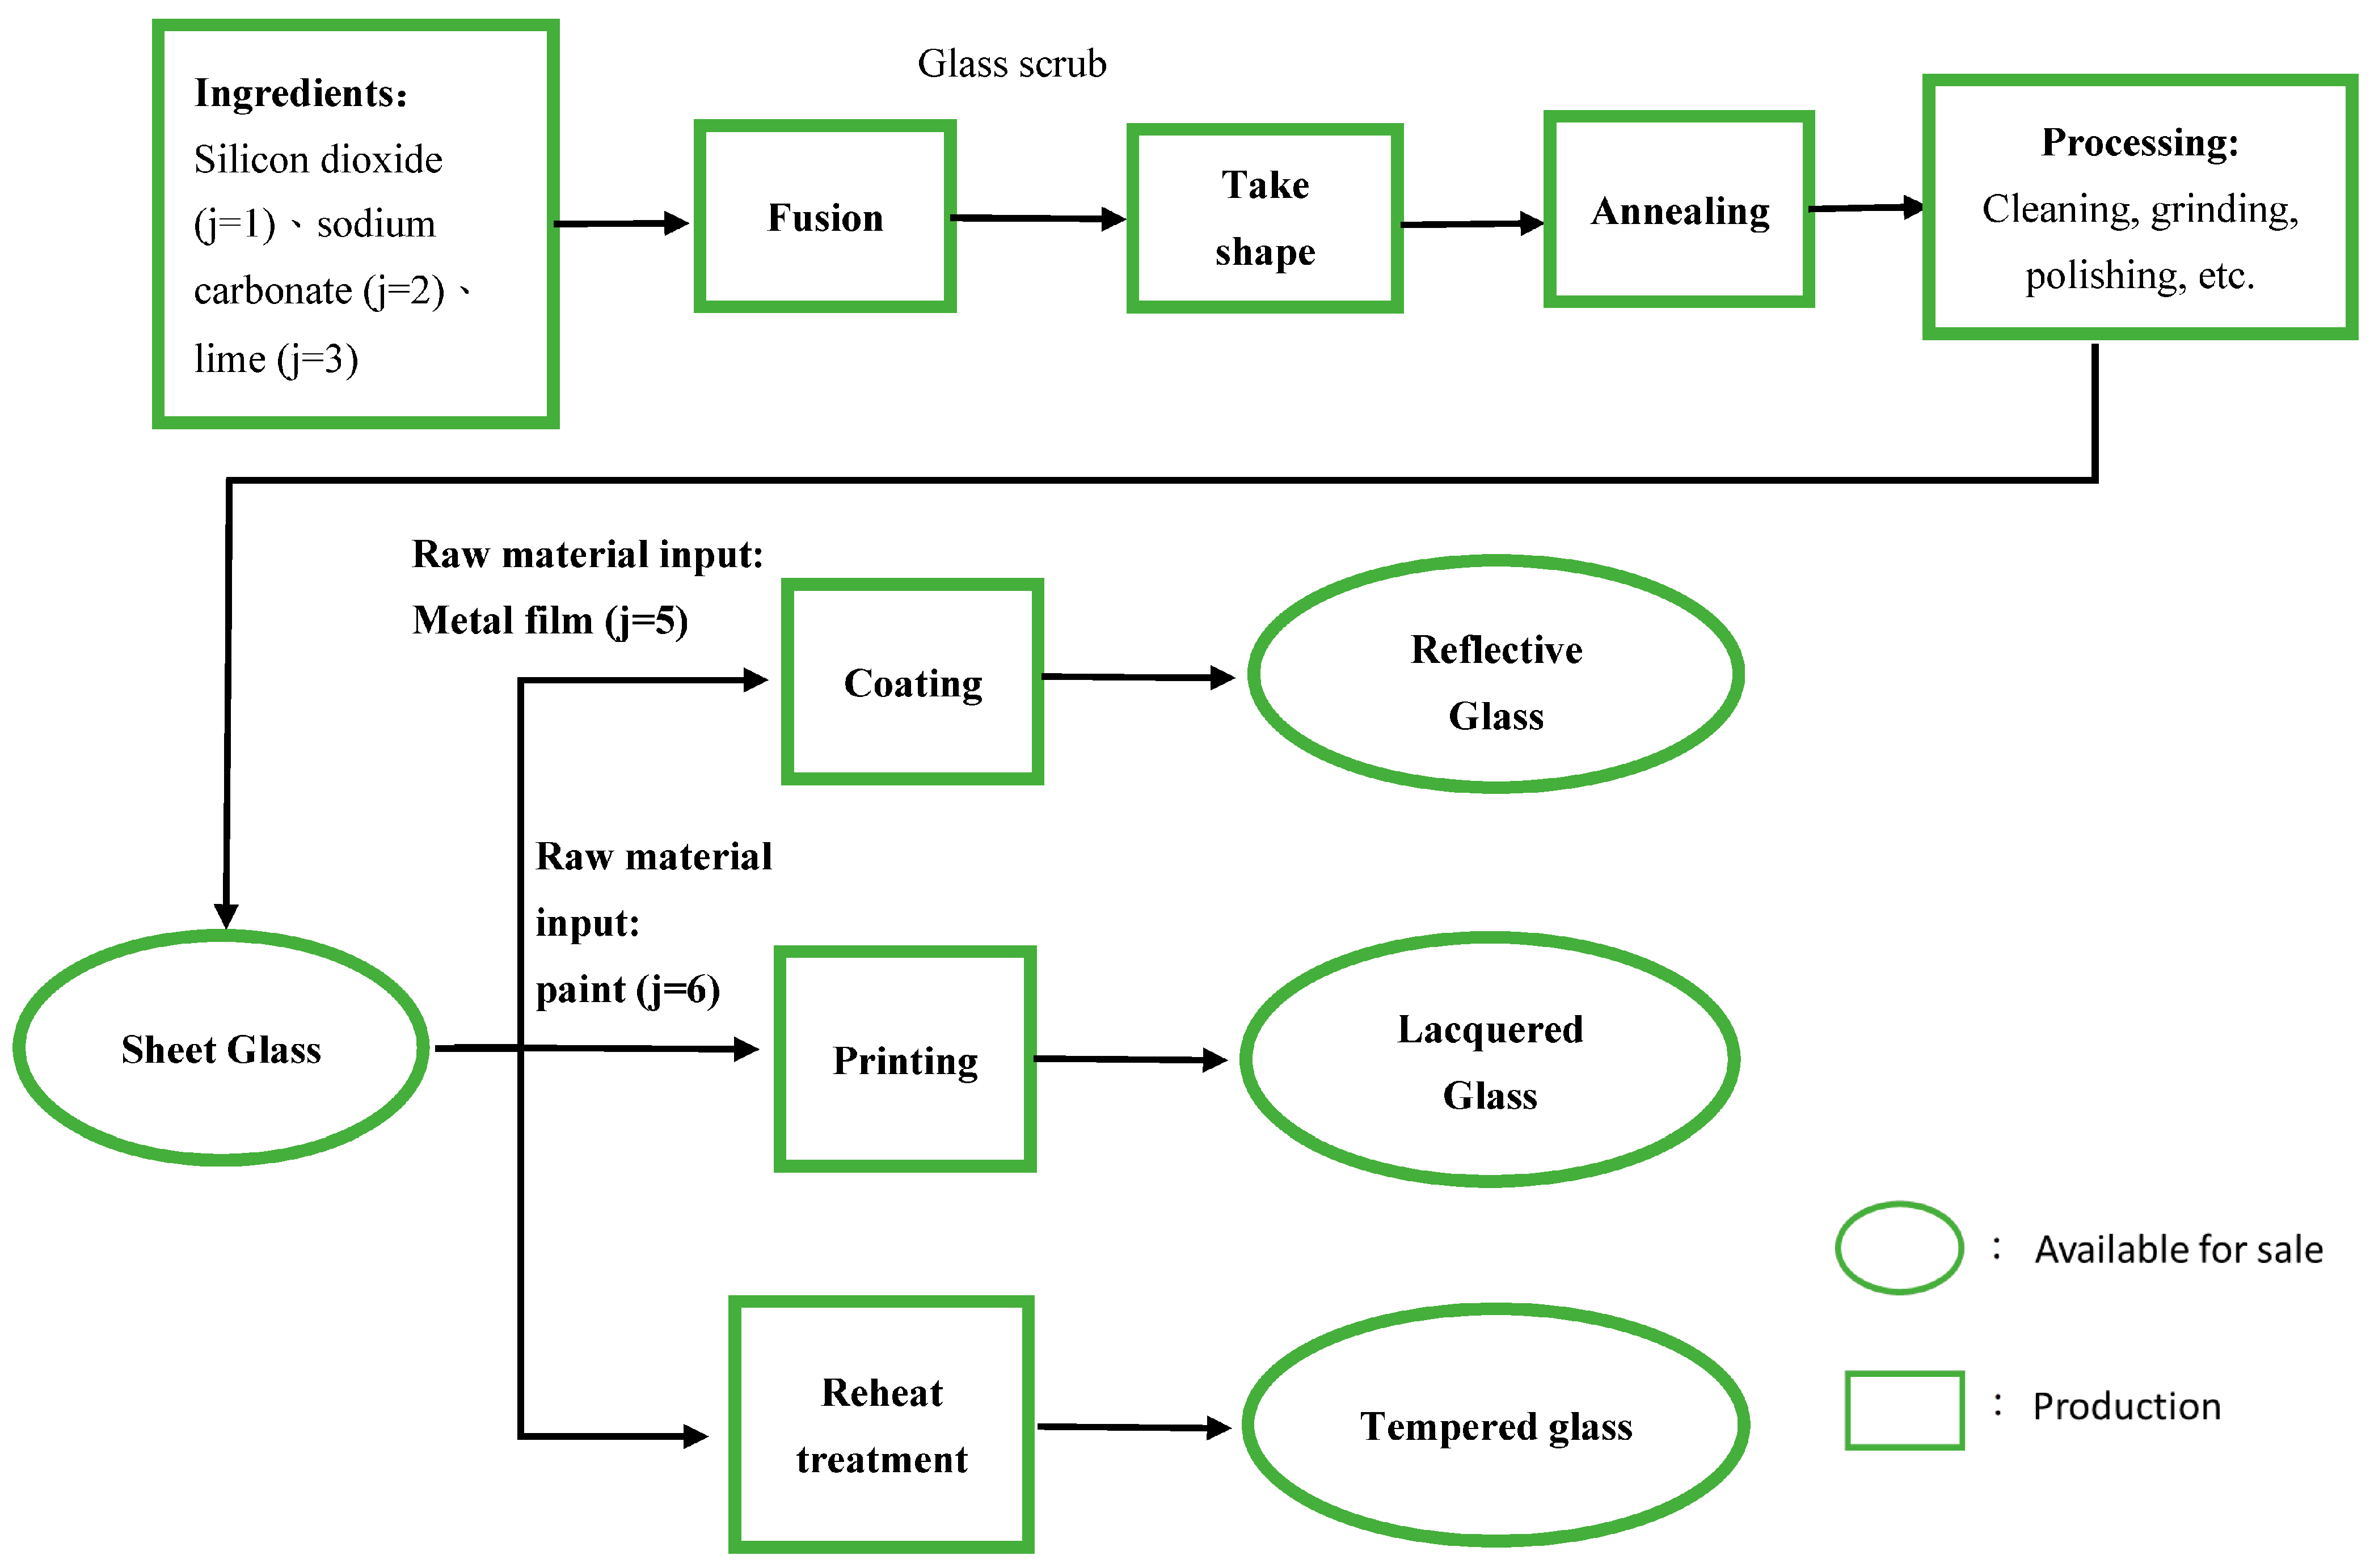
3.1. Glass Industry Production Process

Glass has a long history [21]. The earliest record of human beings using glassware was around 2000 BC. With the progress of civilization, glass production technology has also been constantly changing and improving. The modern glass production process in Figure 1. can be divided into five significant steps: ingredients, fusion, take shape, annealing, and processing. The introduction production process is as follows: Firstly, according to the different glass products to be produced, set the ratio of raw materials and mix them, put them into a raw material mixer for blending, then send them to a melting furnace. Melting mainly involves heating the prepared raw materials to high temperatures to form a uniform, bubble-free glass liquid. This is a complex physical and chemical reaction process. Glass is melted in a furnace. There are two main types of melting furnaces: a crucible kiln, which contains the glass material in the crucible and is heated outside the crucible. The other is a pool kiln, in which the glass material is melted in the kiln pool, and an open flame is heated above the glass liquid surface. Shaping converts molten glass into a solid product with a fixed shape. Glass undergoes severe temperature changes and shape changes during the forming process, leaving thermal stress in the glass. This thermal stress reduces the strength and thermal stability of the glass article. If it is cooled directly, it is likely to break by itself during the cooling process or subsequent storage, transportation, and use (commonly known as the cold explosion of glass). Glass products must be annealed after forming to eliminate the complex explosion phenomenon. Annealing is to maintain or slowly cool down within a specific temperature range to eliminate or reduce the thermal stress in the glass to an allowable value. In addition, some glass products can be stiffened to increase their strength. The principle of stiffening is to generate compressive stress on the surface layer of the glass to increase its strength.

3.2. Research Hypothesis

This article will take the glass industry as an example. Due to market size factors in Taiwan’s glass industry, the case company is the exclusive manufacturer. Its main products have a domestic market share of 83% for flat glass. The case company mainly produces four products, sheet glass (i = 1), reflective glass (i = 2), painted glass (i = 3), and tempered glass (i = 4), where reflective glass (i = 2), lacquered glass (i = 3), and tempered glass (i = 4) are all products made of sheet glass (i = 1), and each product will be limited according to production capacity. As well as demand forecasting, there are upper and lower limits on the output.
Production Function refers to the relationship between the number of production factors invested in production and the maximum output an enterprise can achieve within a certain period when the technical level of production remains unchanged. To maintain the consistency of this study, the following research assumptions will be made: In the production process of this study, all steps are divided into unit-level operations and batch-level operations. The utilization rate of all machinery, equipment, and labor is 100%, and there is no accident of force majeure. The unit selling price of all raw materials and products remains unchanged during production. According to the policy set by the government, human resources will use the first and second overtime rates to calculate salaries according to the length of overtime hours, and the rates at each stage will remain unchanged during the production process. Each unit of product will be subject to a carbon tax, and there is no upper limit, which means that the cost of the carbon tax will depend on the quantity of the product produced, and the tax rate at each stage will remain unchanged during the production process. Carbon rights trading will be subject to the restrictions of various governments. Still, this paper assumes that there are no restrictions on carbon rights trading, no additional transaction costs will be incurred, and the carbon rights fee will remain unchanged during the production process. In the four models containing carbon rights trading in this paper, the company will buy (or sell) carbon rights to maximize its profits, will not retain any unused excess carbon rights, and will sell them all in exchange for profit. This study has a recycling mechanism for glass reuse to reduce carbon emissions. In the single-period model, it is assumed that waste glass (j = 7) accounts for 30% of all raw materials, while the multi-period model adopts an increase year by year. There is a 20% assumption, and each production phase will produce a certain percentage of waste glass for use in the next following production phase.

3.3. Basic Production Model

3.3.1. General Formula of Objective Function

Accurately estimate enterprise costs through activity-based costing (ABC), then use the TOCs to identify and manage system constraints [14,15,16]. This section describes the objective function of this paper, along with all the constraints adopted in the production process.
The company maximizes profit (π) = total glass product sales—sum of total direct material cost—total direct labor cost—total handling operation cost—setup operation cost—total carbon emission cost—other fixed costs.
Single period general formula:
π = i = 1 4 S i P i R e i = 1 4 { [ M C 7 q i 7 + M C 4 ( q i 4 0.06 ) + ( j = 5 6 M C j q i j ) ] P i } ( 1 R e ) i = 1 4 ( j = 1 6 M C j q i j ) P i H R 1 + ε 1 H R 2 H R 1 + ε 2 H R 3 H R 1 C o Q o B o i = 1 4 C o d i o B i o C a r b o n   t a x F

3.3.2. Direct Material Cost Function

This research assumes that glass production mainly uses seven kinds of raw materials. Silicon dioxide (j = 1), sodium carbonate (j = 2), and lime (j = 3) are the three basic raw materials; petroleum coke (j = 4) is used as fuel, and its amount will increase or decrease depending on the product; metal film (j = 5) and paint (j = 6) which are used in reflective glass (i = 2), and painted glass (i = 3) will be used as raw materials; waste glass (j = 7) is a recycled raw material that can replace part of the raw materials.
One-period direct material cost function:
R e i = 1 4 { [ M C 7 q i 7 + M C 4 ( q i 4 0.06 ) + ( j = 5 6 M C j q i j ) ] P i } + ( 1 R e ) i = 1 4 ( j = 1 6 M C j q i j ) P i
Related constraints:
i = 1 4 P i q i j     U M Q j     ( j = 1,2 , , 6 )  

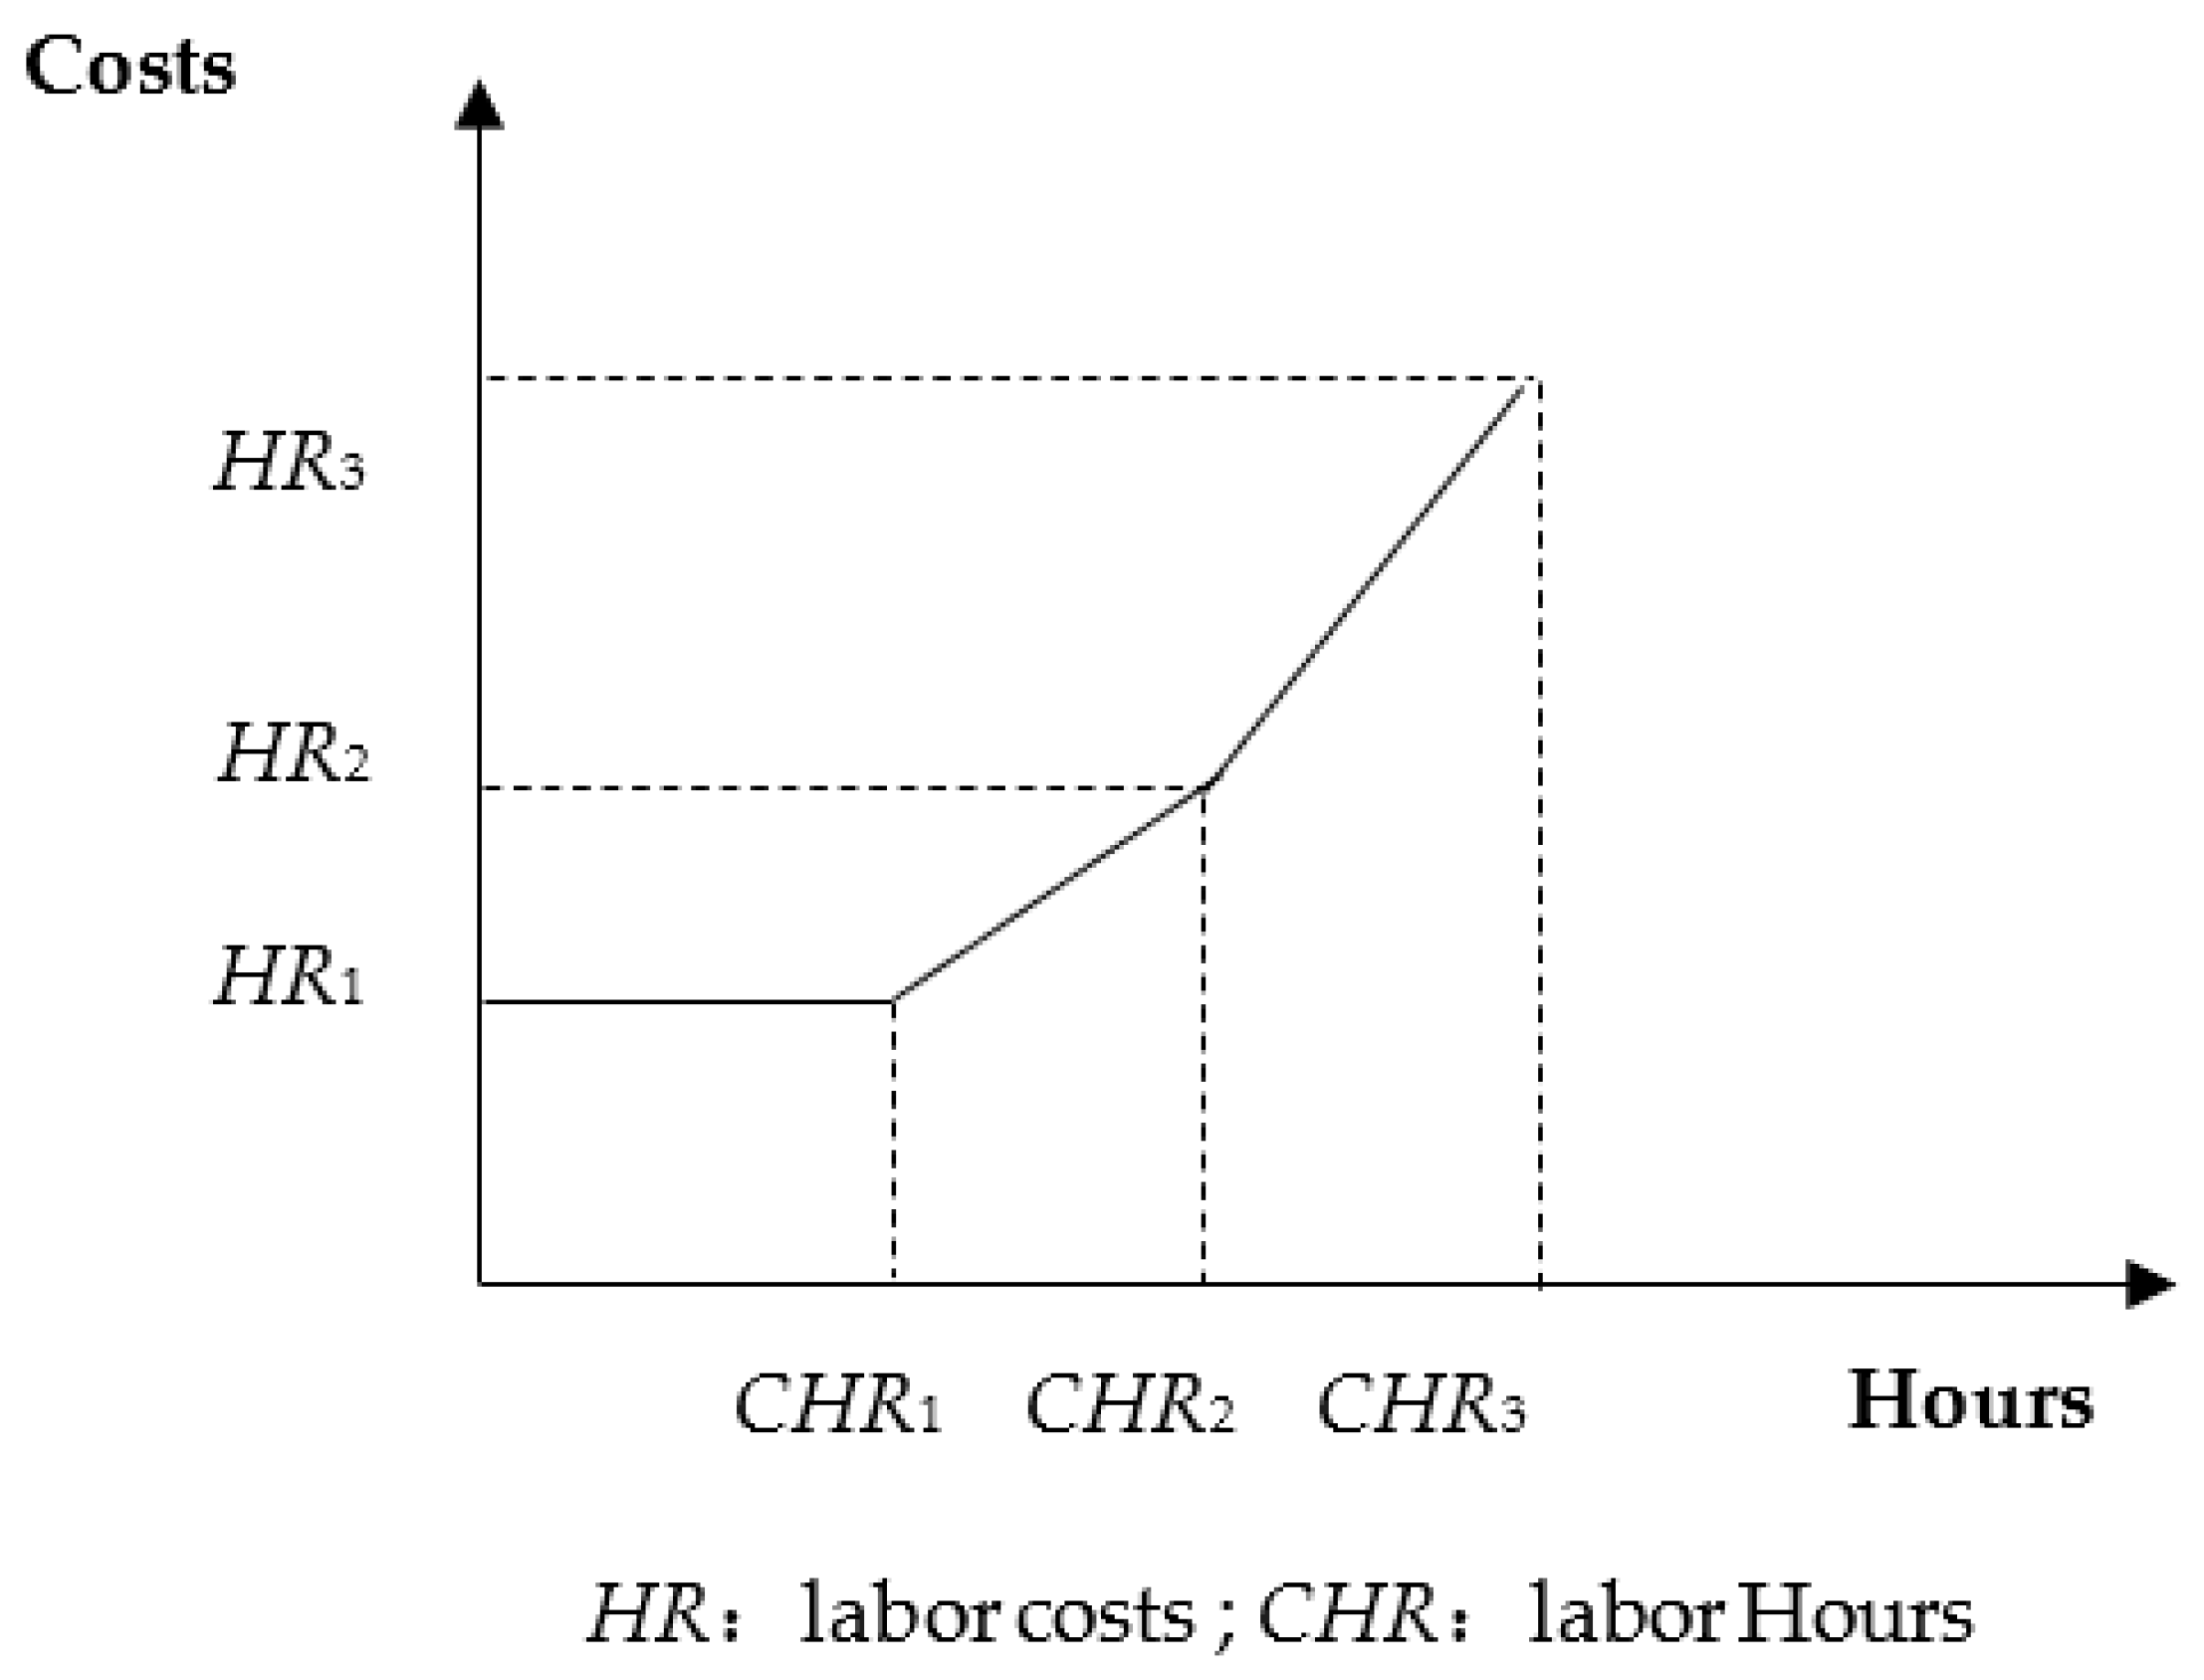
3.3.3. Direct Labor Cost Function

The direct labor cost in the glass production line will include regular working hours and the first and second overtime working hours. The manpower is mainly used for supervising the operation process and operating equipment. Labor costs are usually fixed, because wages must be paid to employees regardless of whether there is a production demand. Overtime hours are typically generated when there are urgent orders or when the original number of employees cannot handle excessive charges in a short period. At this time, it will be considered that the increase in working hours has successively enabled the first and second overtime labor costs.
The correlation diagram is shown in Figure 2. The labor cost function is a continuous segmental function. If the working hours exceed the regular hours, two overtime rates will be activated in sequence according to the number of overtime hours.
Single-period direct labor cost function:
H R 1 + ε 1 H R 2 H R 1 + ε 2 H R 3 H R 1
Related constraints:
i = 1 4 o = 1 6 u i o P i C H R 1 + ε 1 ( C H R 2 C H R 1 ) + ε 2 ( C H R 3 C H R 1 )
ε 0 α 1 0
ε 1 α 1 α 2 0
ε 2 α 2 0
ε 0 + ε 1 + ε 2 = 1
α 1 + α 2 = 1
Direct labor hours and costs will depend on the combination of dummy variables α 1 and α 2 , for example: if α 1 is 1, then α 2 must be 0, and it can be known from the constraints (3)–(8) that ε 0 and ε 1 both fall between (0, 1) and the sum is 1. At this time, the company’s labor hours are C H R 1 + ε 1 ( C H R 2 C H R 1 ) , which will fall in the second paragraph in Figure 2 (where the total labor cost is H R 1 + ε 1 H R 2 H R 1 ).

3.3.4. Material Handling Costs

In this study, it is assumed that material handling operations will only occur on the way from inventory to the production line, and all glass raw materials are transported to the machine room for production operations.
One-period material handling cost function:
C o Q o B o
Related constraints:
j = 1 6 q i j P i η o B o ( i = 1 4 , o = 5 )
Q o B o P C o   ( o = 5 )

3.3.5. Batch Level Job—Set Job Cost Function

In this study, it is assumed that the setting operation will occur in the operation of o = 1~4, for example: when batching, the proportion is set through the parameters of the machine to control the quality of the glass; or at o = 3, the lacquered glass. During processing, control the color of the paint and so on through the relevant machine settings.
Single-period setting activity cost function:
i = 1 4 C o d i o B i o
Related constraints:
P i Γ i o B i o ( i = 1 4 , o = 6 )
i = 1 4 d i o B i o P C o ( o = 6 )

3.3.6. Machine Hour Limit

In the glass production process, machinery and equipment account for a large part of the needs. In the process of batching, melting, forming, processing, etc., the coating and printing process of special products, machinery, and equipment will be used, and the machine will exist. The upper limit of the production capacity, that is, the limitation of the production capacity, will indirectly affect profits. The following is the relevant machine hour limit formula:
Single period:
i = 1 4 m h i o P i L M P o ( o = 1,2 , 3,4 )

3.4. Carbon Tax Cost Function

This article will design four model functions based on three systems: continuous and discontinuous, with or without tax allowances, and with or without carbon trading. In this study, the use ratio of waste glass (j = 7) in a single-period accounts for 30% of all raw materials, while the use ratio of waste glass in multiple periods (j = 7) is set to increase year by year. The first period accounts for 30% of all raw materials, the second phase accounts for 50% of all raw materials, and the third phase accounts for 70% of all raw materials. It is assumed that each production phase will produce a certain proportion of waste glass for the next production phase. It is expected that through a year-by-year model, the way of recycling waste glass to replace raw materials will achieve the carbon reduction goal, which can further reduce costs and increase profits. For the part of carbon rights, this study adopts the basic linear carbon weight function, which means that regardless of the amount of carbon rights bought or sold, it is a single rate.

3.4.1. Continuous Carbon Tax Cost Function

One-period objective function:
π = i = 1 4 S i P i R e i = 1 4 { [ M C 7 q i 7 + M C 4 ( q i 4 0.06 ) + ( j = 5 6 M C j q i j ) ] P i } ( 1 R e ) i = 1 4 ( j = 1 6 M C j q i j ) P i [ H R 1 + ε 1 H R 2 H R 1 + ε 2 ( H R 3 H R 1 ) ] C o Q o B o i = 1 4 C o d i o B i o ( ω 1 C T 1 + ω 2 C T 2 + ω 3 C T 3 ) F
Figure 3 shows that the continuous (incremental progressive tax rate) carbon tax cost function is the cost of the carbon tax, which will use different tax rates sequentially with the increase in carbon emissions. In Equation (15), CTQ1 is the upper limit of the tax rate in the first segment, and for the part whose carbon emissions are between 0 and CTQ1, c t r 1 is used as the tax rate; CTQ2 is the upper limit of the tax rate in the second segment, and the amount of carbon emissions is between CTQ1 and CTQ2, and c t r 2 is used as the tax rate for the part, and c t r 3 is used as the tax rate for the amount of carbon emissions after CTQ2.
Single-period functions:
f 1 T C T Q =     c t r 1 T C T Q ,     if       0 TCTQ C T Q 1 C T 1 + c t r 2 T C T Q C T Q 1 ,     if       C T Q 1 < TCTQ C T Q 2 C T 2 + c t r 3 T C T Q C T Q 2 ,     if       TCTQ > C T Q 2
The following are all constraints related to the cost of this carbon tax:
Single period:
i = 1 n C T e i P i = ω 1 C T Q 1 + ω 2 C T Q 2 + ω 3 C T Q 3
ω 0 β 1 0
ω 1 β 1 β 2 0
ω 2 β 2 β 3 0
ω 3 β 3 0
ω 0 + ω 1 + ω 2 + ω 3 = 1
β 1 + β 2 + β 3 = 1

3.4.2. Continuous Carbon Tax Cost Function with Carbon Rights

Single-period objective function:
  π = i = 1 4 S i P i R e i = 1 4 { [ M C 7 q i 7 + M C 4 ( q i 4 0.06 ) + ( j = 5 6 M C j q i j ) ] P i } ( 1 R e ) i = 1 4 ( j = 1 6 M C j q i j ) P i H R 1 + ε 1 H R 2 H R 1 + ε 2 H R 3 H R 1 C o Q o B o i = 1 4 C o d i o B i o { ω 1 C T 1 + ω 2 C T 2 + ω 3 C T 3 θ G C Q T C T Q σ 1 + ( ω 1 C T 1 + ω 2 C T 2 + ω 3 C T 3 ) + θ T C T Q G C Q σ 2 } F
For example, when σ 1 is 1, σ 2 must be 0. At this time, the company’s total carbon emissions will fall in the range of (0, GCQ), which means that the company will not need to purchase carbon rights and can sell the used part to other enterprises, and the carbon emission cost at this time is ω 1 C T 1 + ω 2 C T 2 + ω 3 C T 3 θ G C Q T C T Q σ 1 .

3.4.3. Continuous Carbon Tax Cost Function with Allowances

Single-period objective function:
π = i = 1 4 S i P i R e i = 1 4 { [ M C 7 q i 7 + M C 4 ( q i 4 0.06 ) + ( j = 5 6 M C j q i j ) ] P i } 1 R e ) i = 1 4 ( j = 1 6 M C j q i j ) P i H R 1 + ε 1 H R 2 H R 1 + ε 2 H R 3 H R 1 C o Q o B o i = 1 4 C o d i o B i o ( μ 1 C T F 1 + μ 2 C T F 2 + μ 3 C T F 3 ) F
In this function, the assumption that the government will give each enterprise a certain amount of tax exemption is added, within the quota, and no tax will be imposed on the enterprises. After the quota is exceeded, different tax rates will be activated sequentially as the amount of carbon emissions increases. CTFQ1 is the upper limit of the tax rate in the first stage, and the carbon emission amount is between CTFQ0 and CTFQ1, and c t f r 1 is used as the tax rate; CTFQ2 is the upper limit of the tax rate in the second stage, and the carbon emission amount is between CTFQ1 and CTFQ2, and c t f r 2 is used as the tax rate for the part, and c t f r 3 is used as the tax rate for the amount of carbon emissions after CTFQ2.
Single-period functions:
f 2 T C T Q = 0 ,                         0 T C T Q C T F Q 0 c t f r 1 ( T C T Q C T F Q 0 ) ,     C T F Q 0 < T C T Q C T F Q 1 C T F 1 + c t f r 2 ( T C T Q C T F Q 1 ) ,     C T F Q 1 < T C T Q < C T F Q 2 C T F 2 + c t f r 3 ( T C T Q C T F Q 2 ) ,     T C T Q > C T F Q 2
The following are all constraints related to the cost of this carbon tax:
Single period:
i = 1 n C T e i P i C T F Q 0 + μ 1 C T F Q 1 C T F Q 0 + μ 2 C T F Q 2 C T F Q 0 + μ 3 ( C T F Q 3 C T F Q 0 )
μ 0 ψ 1 0
μ 1 ψ 1 ψ 2 0
μ 2 ψ 2 ψ 3 0
μ 3 ψ 3 0
μ 0 + μ 1 + μ 2 + μ 3 = 1
ψ 1 + ψ 2 + ψ 3 = 1

3.4.4. Continuous Carbon Tax Cost Function of Carbon Rights and Allowances

Single-period objective function:
π = i = 1 4 S i P i R e i = 1 4 { [ M C 7 q i 7 + M C 4 ( q i 4 0.06 ) + ( j = 5 6 M C j q i j ) ] P i } ( 1 R e ) i = 1 4 ( j = 1 6 M C j q i j ) P i H R 1 + ε 1 H R 2 H R 1 + ε 2 H R 3 H R 1 C o Q o B o i = 1 4 C o d i o B i o { μ 1 C T F 1 + μ 2 C T F 2 + μ 3 C T F 3 θ G C Q T C T Q σ 1 + μ 1 C T F 1 + μ 2 C T F 2 + μ 3 C T F 3 + θ T C T Q G C Q σ 2 } F  
The following are the relevant restrictions:
Single period:
i = 1 n C T e i P i = Ω 1 + Ω 2 = T C T Q
0 Ω 1 G C Q σ 1
G C Q σ 2 < Ω 2 ( G C Q + U C Q ) σ 2
σ 1 + σ 2 = 1
For example, when σ 1 is 1, σ 2 must be 0. At this time, the company’s total carbon emissions will fall in the range of (0, GCQ), which means that the company will not need to purchase carbon rights and can sell the used part to other enterprises, and the carbon emission cost at this time is μ 1 C T F 1 + μ 2 C T F 2 + μ 3 C T F 3 θ G C Q T C T Q σ 1 .

4. Model Analysis

Faced with net-zero carbon emissions in 2050, the government has successfully formulated tax collection and trading mechanisms regarding international carbon tax and rights norms. Relevant policies will significantly impact the profitability of the glass manufacturing industry and even affect the original product mix. Therefore, this article proposes a sample company to help glass manufacturing companies find possible product mixes under the new carbon tax and rights policies. This section will refer to the production data of glass manufacturing companies to simulate the optimal product mix in each model under different carbon taxes and carbon rights calculations. This study uses mathematical programming models to solve the problem, mainly using mathematical programming techniques to search for the best solution. Linear Programming (LP) is an essential tool in the mathematical programming model. Under the condition that various constraints are met, the maximum or minimum objective function in the problem is sought. The objective function and restriction formula are linear models. If the objective function and constraints contain nonlinear functions, this planning problem is called a nonlinear programming (nonlinear programming, NLP) problem. When this study explores the single-period production decision-making model, it is first assumed that the selling price of the case company’s products is a fixed constant and will use material costs with quantity discounts, labor costs with overtime costs, and four carbon tax collection methods—the establishment of mathematical programming formulas for costs and carbon rights purchase cost functions. The research model is mainly analyzed using LINGO to solve this complex situation.

4.1. Sample Data

The company mainly produces four glass products: sheet glass (product 1, p = 1), reflective glass (product 2, p = 2), lacquered glass (product 3, p = 3), and tempered glass (product 4, p = 4). All jobs in this ABC production process are divided into unit jobs and batch jobs. The selling price of the units remains unchanged. All machines and labor are 100% utilization: no breakdowns or other mishaps. All material costs stay the same. The agreement discounts the material cost, directly affecting the company’s final profit. The deal will not lapse during this period; the production sample data are shown in Table 2. Table 3 contains the activity-based costing production data (Capacity Cap), and Table 4 shows the direct labor, recycling, carbon tax, and credit costs.

4.2. Optimal Solution and Analysis of the Model

The carbon tax cost will depend on the combination of the dummy variables β 1, β 2, and β 3, for example: if β 1 is 1, then β 2 and β 3 must be 0, and it can be known from the constraints (27)–(33), ω 0 and ω 1 both fall between (0, 1), and the sum is 1, and ω 2 and ω 3 are both 0. At this time, the company’s total carbon emissions are ω 1 C T Q 1 , which will fall in the first range (0, C T Q 1 ), and the total carbon tax cost is ω 1 C T 1 . Table 5 shows the results of the one-period model 1.
Table 6, Table 7 and Table 8 include the results of the model as follows.
This section will analyze and discuss the final results of the model: profit maximization, carbon tax expenses, and carbon rights incomes. Table 9 below summarizes the key data of the single-period models.

4.3. Sensitivity Analysis

To provide further data for future carbon tax policies as a reference, this section will conduct a sensitivity analysis on the model, keeping other parameters unchanged and changing a single variable to explore the impact on the target model profit. This analysis will be divided into single periods. In the single-period sensitivity analysis, keep other parameters unchanged and change the unit cost of carbon rights to implement the sensitivity analysis. The parameters are from −20% to +20%, with 10% as the first step, and four additional types are generated. The data results discuss the impact of changes in the cost of carbon rights on profits. From the results of the two models as Table 10 and Table 11, it can be seen that no matter whether the unit price of carbon rights increases or decreases, the enterprise will have excess carbon rights for sale. Therefore, the change in the unit cost of carbon rights will positively correlate with profits. By lowering the unit price of carbon rights, enterprises may instead purchase more carbon rights to produce more products, but this may be due to the constraints of another production capacity, leading to the reduction of carbon rights. The result after the price is still the sale of excess carbon rights, which means that the unit cost of carbon rights from 200 to 300 will allow the company to produce a similar amount of products to maximize profits. The company cannot achieve the result of increasing profits by increasing the production of goods, which also leads to the amount of carbon emissions and excess carbon rights being close to the original data.

5. Conclusions

At the United Nations Climate Change Conference 2021, countries adopted a new agreement: the Glasgow Climate Convention. Carbon reduction and sustainable development have become international issues that governments, enterprises, and people cannot avoid [5]. Weber (2017) proposed that the emissions trading system (ETS) has long been considered the most cost-effective policy tool to address climate change [34]. The Chinese government is about to formally implement the collection of carbon fees as early as 2024 and is also actively promoting the establishment of carbon rights exchanges. Initially, it is estimated that more than 200 large carbon-emitting companies will be levied. Although the example company in this article is the glass industry, it will undoubtedly become one of them sooner or later. Therefore, this article is based on activity-based costing and the restriction theory and includes topics such as carbon emissions, carbon taxes, carbon rights, and circular economy (recycled glass) to explore the imposition of carbon taxes, the implementation of carbon rights trading, and the use of recycling to ascertain how waste glass affects the profit, production allocation, and carbon emissions of the enterprise.
The “Coase Theorem”, proposed by Coase (1960), is an essential economic achievement [26]. It points out how, under certain conditions, economic actors can find practical solutions to externalities without direct government involvement [26]. Among the production planning models in this paper, the continuous incremental tax rate model will have higher profits than the discontinuous full progressive tax rate model, indicating that if the constant tax rate is adopted, the burden on the enterprise will be smaller, and, on the contrary, it will make the government obtain less tax. However, implementing the carbon tax policy must be completed on time. Therefore, adopting a continuous tax rate at the initial stage and gradually changing to a discontinuous tax rate depending on the situation in the future may be more acceptable to enterprises. Implementing carbon rights trading can solve the problem that enterprises cannot fully utilize their production capacity due to the government’s carbon emission cap, thus generating higher profits. Therefore, from the standpoint of enterprises, adopt continuous tax rates and openly implement carbon emissions. The policy of rights trading will be the most welcome for enterprises. Compared with other advanced countries in Europe and the United States that have already implemented carbon tax-related policies, our country is far behind. This late start means that we have the experience of many countries to learn from and emulate beneficial policies. Policies that are ineffective or have received too much backlash can be avoided as much as possible, or experts can discuss how to improve and find the best balance between the sustainable development of enterprises, the government, and the environment. The results of the recycling policy adopted in this research show that it cannot only reduce carbon emissions but also reduce the carbon tax expenditure of enterprises, increase the income from selling carbon rights, and increase profits, which is more beneficial than harmful to enterprises and the environment.
The primary purpose of this study is to find out how to keep enterprises’ production capacity and profits from being affected too much while considering sustainable development. The maintenance of the environment is essential, but if the gain of the enterprise drops sharply as a result, the enterprise raises the prices of various products or services to the downstream manufacturers and consumers. If the environmental problems are not resolved, new economic problems will arise. Therefore, this paper proposes some models for the reference of the government and enterprises so that the glass industry can respond in advance and so that the government can adequately formulate relevant policies. The contribution of this study will allow for companies to better understand how carbon tax and rights will affect costs and profits after they are implemented and will provide a reference for the government and companies on the “2050 Net Zero Emissions” policy. We aim to promote the development of a circular economy among enterprises and to let the public know that using recycled raw materials will benefit enterprises, consumers, and the environment in the long run. The task of net-zero emissions requires the concerted efforts of people and governments worldwide to achieve it. We hope that through the influence of governments and enterprises, we can regulate and supervise their supply chains and industrial chains together and can cooperate to achieve the goal of “net zero emissions by 2050”.

Author Contributions

Conceptualization, C.-L.H. and W.-H.T.; Methodology, C.-L.H.; Investigation, C.-L.H.; Writing—original draft, C.-L.H.; Writing—review & editing, W.-H.T.; Supervision, W.-H.T.; Funding acquisition, C.-L.H. and W.-H.T. All authors have read and agreed to the published version of the manuscript.

Funding

The authors would like to thank the National Science and Technology Council of Taiwan for the financial support of this research under Grant No. MOST111-2410-H-008-021, MOST112-2410-H-008-061, and NSTC 112-2410-H-025-046.

Data Availability Statement

The author confirms that the data supporting the findings of this study are available within the article.

Conflicts of Interest

The authors declare no conflict of interest in this paper.

Nomenclature

πFirms maximize profits.
tt = 1~3: the label of the multi-period model, which means 1~3 periods.
iProduct category i = 1~4: product 1 (i = 1): flat glass; product 2 (i = 2): reflective glass; product 3 (i = 3): lacquered glass; product 4 (i = 4): tempered glass.
SiThe unit sales price of the i-th product (i = 1~4).
PiThe production volume of the i-th product (i = 1~4).
jRaw material type j = 1∼7: j = 1: silicon dioxide; j = 2: sodium carbonate; j = 3: lime; j = 4: petroleum coke; j = 5: metal film; j = 6: paint; j = 7: waste glass.
ReThe ratio of waste glass to all raw materials.
MCjj material unit cost (j = 1~7).
qijThe quantity of raw materials j used to produce a unit of product i (i = 1~4, j = 1~7).
HR1, HR2, HR3Under normal circumstances, the direct labor cost (HR1), the first overtime labor cost (HR2), and the second overtime labor cost (HR3).
ε0, ε1, ε2Must be a set of non-negative variables, at most two variables may be non-zero.
CoThe job cost of performing a unit of job o (o = 5~6).
QoDemand quantity under material handling operations (o = 5).
BoBatch operation quantity (o = 5) under material handling operations.
dioThe demand quantity of product i under setting operation (o = 6).
BioBatch quantity of product i under setup job (o = 6).
FOther fixed costs.
MReThe proportion of waste glass produced in the previous process to the weight of all products in the previous period.
uioThe labor hours needed to produce a unit of product i in operation o.
CHR1, CHR2, CHR3Under normal circumstances, the maximum direct labor hours (CHR1), the first period of overtime hours (CHR2), and the second period of overtime hours (CHR3).
α 1 , α 2 Dummy variables (0,1); when one of the variables is 1, the other must be exactly zero.
C T e i Carbon emissions per unit of product i.
β 1, β 2, β 3Dummy variable (0,1); only one of the three can be 1.
ctr1, ctr2, ctr3The first paragraph (ctr1), the second paragraph (ctr2), and the third paragraph (ctr3) carbon tax rate.
CTQ1,CTQ2, CTQ3The maximum carbon emissions are in the first segment (CTQ1), the second segment (CTQ2), and the third segment (CTQ3).
TCTQThe company’s total carbon emissions.
ψ 1 ,   ψ 2 , ψ 3 Dummy variable (0,1); only one of the three can be 1.
ctfr1, ctfr2, ctfr3First segment (ctfr1), second segment (ctfr2), and third segment (ctfr3) carbon tax rates.
CTFQ0,CTFQ1, CTFQ2,CTFQ3Tax-free carbon emissions (CTFQ0); the maximum carbon emissions in the first paragraph (CTFQ1), the second paragraph (CTFQ2), and the third paragraph (CTFQ3) (the maximum carbon emission in the third paragraph is the implementation of the mathematical programming model and is formulated with no upper limit).

References

  1. Zhao, C. Carbon Neutrality: Aiming for a net-zero carbon future. Carbon Neutrality 2022, 1, 2. [Google Scholar] [CrossRef]
  2. Höhne, N.; Gidden, M.J.; den Elzen, M.; Hans, F.; Fyson, C.; Geiges, A.; Jeffery, M.L.; Gonzales-Zuñiga, S.; Mooldijk, S.; Hare, W. Wave of net zero emission targets opens window to meeting the Paris Agreement. Nat. Clim. Chang. 2021, 11, 820–822. [Google Scholar] [CrossRef]
  3. Van Soest, H.L.; den Elzen, M.G.; van Vuuren, D.P. Net-zero emission targets for major emitting countries consistent with the Paris Agreement. Nat. Commun. 2021, 12, 2140. [Google Scholar] [CrossRef] [PubMed]
  4. Rogelj, J.; Geden, O.; Cowie, A.; Reisinger, A. Net-zero emissions targets are vague: Three ways to fix. Nature 2021, 591, 365–368. [Google Scholar] [CrossRef]
  5. Dixon, J.; Bell, K.; Brush, S. Which way to net zero? a comparative analysis of seven UK 2050 decarbonisation pathways. Renew. Sustain. Energy Transit. 2022, 2, 100016. [Google Scholar] [CrossRef]
  6. Chen, P.-H.; Lee, C.-H.; Wu, J.-Y.; Chen, W.-S. Perspectives on Taiwan’s Pathway to Net-Zero Emissions. Sustainability 2023, 15, 5587. [Google Scholar] [CrossRef]
  7. Wu, H.-H. Moving Toward Net-Zero Emission Society: With Special Reference to the Recent Law and Policy Development in Some Selected Countries. In Moving Toward Net-Zero Carbon Society: Challenges and Opportunities; Springer International Publishing: Cham, Switzerland, 2023; pp. 151–169. [Google Scholar]
  8. Del Rio, D.D.F.; Sovacool, B.K.; Foley, A.M.; Griffiths, S.; Bazilian, M.; Kim, J.; Rooney, D. Decarbonizing the glass industry: A critical and systematic review of developments, sociotechnical systems and policy options. Renew. Sustain. Energy Rev. 2022, 155, 111885. [Google Scholar] [CrossRef]
  9. Springer, C.; Hasanbeigi, A. Emerging Energy Efficiency and Carbon Dioxide Emissions-Reduction Technologies for the Glass Industry; Energy Analysis and Environmental Impacts Division, Lawrence Berkeley National Laboratory [LBNL], University of California: Berkeley, CA, USA, 2017. [Google Scholar]
  10. Eid, J. Glass is the hidden gem in a carbon-neutral future. Nature 2021, 599, 7. [Google Scholar]
  11. Deng, W.; Backhouse, D.J.; Kabir Kazi, F.; Janani, R.; Holcroft, C.; Magallanes, M.; Marshall, M.; Jackson, C.M.; Bingham, P.A. Alternative raw material research for decarbonization of UK glass manufacture. Int. J. Appl. Glass Sci. 2023, 14, 341–365. [Google Scholar] [CrossRef]
  12. Gärtner, S.; Marx-Schubach, T.; Gaderer, M.; Schmitz, G.; Sterner, M. Techno-economic analysis of carbon dioxide separation for an innovative energy concept towards low-emission glass melting. Energies 2023, 16, 2140. [Google Scholar] [CrossRef]
  13. Tsai, W.-H.; Lu, Y.-H.; Hsieh, C.-L. Comparison of production decision-making models under carbon tax and carbon rights trading. J. Clean. Prod. 2022, 379, 134462. [Google Scholar] [CrossRef]
  14. Tsai, W.-H.; Lai, S.-Y.; Hsieh, C.-L. Exploring the impact of different carbon emission cost models on corporate profitability. Ann. Oper. Res. 2023, 322, 41–74. [Google Scholar] [CrossRef]
  15. Al-Eidan, D.; Al-Ahmad, M.; Al-Ajmi, M.; Al-Sayed, N.; Al-Ajmi, R.; Smew, W. Activity-based costing (ABC) for manufacturing costs reduction and continuous improvement: A case study. In Proceedings of the International Conference on Industrial Engineering and Operations Management Issue, Pilsen, Czech Republic, 23–26 July 2019; pp. 23–26. [Google Scholar]
  16. Skousen, C.J.; Walther, L.M. Process and Activity-Based Costing. In Managerial and Cost Accounting; Ventus Publishing: Telluride, CO, USA, 2010; p. 39. [Google Scholar]
  17. Ingrao, C.; Saja, C.; Primerano, P. Application of Life Cycle Assessment to chemical recycling of post-use glass containers on the laboratory scale towards circular economy implementation. J. Clean. Prod. 2021, 307, 127319. [Google Scholar] [CrossRef]
  18. Schmitz, A.; Kamiński, J.; Scalet, B.M.; Soria, A. Energy consumption and CO2 emissions of the European glass industry. Energy Policy 2011, 39, 142–155. [Google Scholar] [CrossRef]
  19. Nodehi, M.; Mohamad Taghvaee, V. Sustainable concrete for circular economy: A review on use of waste glass. Glass Struct. Eng. 2022, 7, 3–22. [Google Scholar] [CrossRef]
  20. Lin, K.-Y. User experience-based product design for smart production to empower industry 4.0 in the glass recycling circular economy. Comput. Ind. Eng. 2018, 125, 729–738. [Google Scholar] [CrossRef]
  21. Allwood, J.M. Squaring the circular economy: The role of recycling within a hierarchy of material management strategies. In Handbook of Recycling; Elsevier: Amsterdam, The Netherlands, 2014; pp. 445–477. [Google Scholar]
  22. Chan, Y.T.; Zhao, H. Optimal carbon tax rates in a dynamic stochastic general equilibrium model with a supply chain. Econ. Model. 2023, 119, 106109. [Google Scholar] [CrossRef]
  23. Bebbington, J.; Larrinaga-González, C. Carbon trading: Accounting and reporting issues. Eur. Account. Rev. 2008, 17, 697–717. [Google Scholar] [CrossRef]
  24. Streck, C.; von Unger, M. Creating, regulating and allocating rights to offset and pollute: Carbon rights in practice. Carbon Clim. Law Rev. 2016, 10, 178–189. [Google Scholar] [CrossRef]
  25. Matschoss, P.; Welsch, H. International emissions trading and induced carbon-saving technological change: Effects of restricting the trade in carbon rights. Environ. Resour. Econ. 2006, 33, 169–198. [Google Scholar] [CrossRef]
  26. Coase, R.H. The Problem of Social Cost. J. Law Econ. 1960, 3, 1–44. [Google Scholar] [CrossRef]
  27. Liu, Y.; Liu, S.; Shao, X.; He, Y. Policy spillover effect and action mechanism for environmental rights trading on green innovation: Evidence from China’s carbon emissions trading policy. Renew. Sustain. Energy Rev. 2022, 153, 111779. [Google Scholar] [CrossRef]
  28. Kaplan, R.S.; Anderson, S.R. Time-Driven Activity-Based Costing: A Simpler and More Powerful Path to Higher Profits; Harvard Business Press: Brighton, MA, USA, 2007. [Google Scholar]
  29. Kaplan, R.S.; Cooper, R. Cost & Effect: Using Integrated Cost Systems to Drive Profitability and Performance; Harvard Business Press: Brighton, MA, USA, 1998. [Google Scholar]
  30. Kaplan, R.S.; Witkowski, M.; Abbott, M.; Guzman, A.B.; Higgins, L.D.; Meara, J.G.; Padden, E.; Shah, A.S.; Waters, P.; Weidemeier, M. Using time-driven activity-based costing to identify value improvement opportunities in healthcare. J. Healthc. Manag. 2014, 59, 399–412. [Google Scholar] [CrossRef] [PubMed]
  31. Tsai, W.-H.; Tsaur, T.-S.; Chou, Y.-W.; Liu, J.-Y.; Hsu, J.-L.; Hsieh, C.-L. Integrating the activity-based costing system and life-cycle assessment into green decision-making. Int. J. Prod. Res. 2015, 53, 451–465. [Google Scholar] [CrossRef]
  32. Goldratt, E.M. Theory of Constraints; North River: Croton-on-Hudson, NY, USA, 1990. [Google Scholar]
  33. Gupta, M.C.; Boyd, L.H. Theory of constraints: A theory for operations management. Int. J. Oper. Prod. Manag. 2008, 28, 991–1012. [Google Scholar] [CrossRef]
  34. Weber, R.H. Emission Trading Schemes: A Coasean Answer to Climate Change? In Environmental Law and Economics; Mathis, K., Huber, B.R., Eds.; Springer International Publishing: Cham, Switzerland, 2017; pp. 355–377. [Google Scholar]
Figure 1. Production process of the glass industry.
Energies 16 07570 g001
Figure 2. Direct labor cost function.
Energies 16 07570 g002
Figure 3. Continuous carbon tax cost function.
Energies 16 07570 g003
Table 1. Proportion of recycled glass usage by Taiwan Glass.
Year/ProductSheet GlassGlass Container
201919.40%51.35%
202021.06%47.92%
202119.37%47.92%
Source: “2021 Taiwan Glass Sustainable Development Report”.
Table 2. Glass production sample data.
Products
SymbolSheet GlassReflective GlassLacquered
Glass
Tempered
Glass
Minimum demand
(production volume)/ton
Pi>8,400,000>850,000>900,000>1,575,000
Sales price/ton SiTWD 7297TWD 11,512TWD 14,583TWD 9942
Carbon tax CTei0.50.80.80.7
Unit Level Material Price
silicon dioxide (j = 1)MC1 = TWD 1546/tonqi10.70.70.70.7
Sodium carbonate (j = 2)MC2 = TWD 13,168/tonqi20.20.20.20.2
lime (j = 3)MC3 = TWD 1676/tonqi30.10.10.10.1
fuel: Petroleum Coke (j = 4)MC4 = TWD 12,590/tonqi40.20.250.250.3
metallic film (j = 5)MC5 = TWD 18,000/tonqi500.100
paint (j = 6)MC6 = TWD 20,000/tonqi6000.20
glass (j = 7)MC7 = TWD 3000/tonqi71111
Table 3. Activity-based costing production data (Capacity Cap).
Products
oSymbolSheet GlassReflective GlassLacquered GlassTempered GlassCapacity Cap
Batch-Level Activity
Material handlingC5 = TWD 10,000/batch5Q51PC5 = 20,000
η510,000
SetC6 = TWD 27,000/batch6di62343PC6 = 500,000
Γi6100505070
machine hoursProcessing1mhi15555LMP1 = 71,837,823
Coating2mhi20300LMP2 = 4,910,394
Printing3mhi30030LMP2 = 4,910,394
Reheating 4mhi40002LMP4 = 4,067,684
Table 4. Direct labor, recycling, carbon tax, and credit costs.
Direct Labor Cost
CostHR1 = TWD 4,489,777,600HR2 = TWD 8,319,117,500HR3 = TWD 14,186,373,000
Labor hourCHR1 = 25,510,100CHR2 = 35,400,500CHR3 = 48,089,400
Wage rateTWD 176/hTWD 235/hTWD 295/h
Cost of each segmentCT1 = TWD 1,050,000,000CT2 = TWD 4,073,840,100CT3 = TWD 148,436,978,600
Upper limit of carbon emissions in each stageCTQ1 = 7,000,000CTQ2 = 13,579,467CTQ3 = 395,831,943
Various tax ratesctr1 = TWD 150/tonctr2 = TWD 300/tonctr3 = TWD 375/ton
Carbon credit cost θ   = TWD 250/ton
Recycling operations (use ratio of glass)
Single period R e = 0.3
Recycling glass from the previous period M R e = 0.1
Table 5. The optimal solution of the continuous carbon tax function (one-period model 1).
ProductOptimal Solution
P 1 9,029,200 ε 1 (E11)0.3639651 B 5 1084 B 16 90,292 ω 0 (W01)0
P 2 1,605,350 ε 2 (E21)0 B 26 32,107 ω 1 (W11)0.9552286
P 3 1,699,100 π 7,913,538,000 B 36 33,982 ω 2 (W21)0.0447714
P 4 2,033,842Tax1,185,382,000 B 46 29,055 ω 3 (W31)0
Table 6. The optimal solution of the continuous carbon tax function of carbon-containing rights (single-period model 2).
ProductOptimal Solution
P 1 9,029,100 ε 1 (E11)0.3639651 B 5 1084 B 16 90,291 ω 0 ( W 0 1)0
P 2 1,605,400 ε 2 (E21)0 π 8,589,894,000 B 26 32,108 ω 1 ( W 11)0.9552299
P 3 1,699,100 Tax1,185,378,000 B 36 33,982 ω 2 (W21)0.0447701
P 4 2,033,842 Carbon right+676,359,100 B 46 29,055 ω 3 (W31)0
Table 7. The optimal solution of the continuous carbon tax function with allowances (one-period model 3).
ProductsOptimal Solution
P 1 9,029,284 ε 1 (E11)0.3639694 B 5 1084 B 16 90,293 ω 0 ( W 0 1)0.0293422
P 2 1,605,400 ε 2 (E21)0 B 26 32,108 ω 1 ( W 11)0.9706578
P 3 1,699,100 π 8,079,743,000 B 36 33,982 ω 2 (W21)0
P 4 2,033,780 Tax1,019,191,000 B 46 29,054 ω 3 (W31)0
Table 8. The optimal solution of the continuous carbon tax function, including tax allowances and carbon rights (single-period model 4).
ProductsOptimal Solution
P 1 9,029,200 ε 1 (E11)0.3639651 B 5 1084 B 16 90,292 ω 0 ( W 0 1)0.0293469
P 2 1,605,350 ε 2 (E21)0 π 8,756,091,000 B 26 32,107 ω 1 ( W 11)0.9706531
P 3 1,699,100 Tax1,019,186,000 B 36 33,982 ω 2 (W21)0
P 4 2,033,842 Carbon right+676,357,000 B 46 29,055 ω 3 (W31)0
Table 9. Integration of key data of the single-period model.
Model 1Model 3
π 7,913,538,000 π 8,079,743,000
Tax1,185,382,000Tax1,019,191,000
Model 2Model 4
π 8,589,894,000 π 8,756,091,000
Tax1,185,378,000Tax1,019,186,000
Carbon right+676,359,100Carbon right+676,357,000
Table 10. Single-period model 2: key data of sensitivity analysis.
Carbon Credit Unit Cost
(Decrease/Increase: 250 Is the Base Period)
Carbon Tax CostCarbon Credit IncomeProfitProfit Change (%)
200
(−20%)
1,185,385,000541,083,9008,454,625,000−1.57%
225
(−10%)
1,185,382,000608,721,3008,522,260,000−0.79%
2501,185,378,000676,359,1008,589,894,0000.00%
275
(+10%)
1,185,382,000743,992,7008,657,531,0000.79%
300
(+20%)
1,185,382,000811,628,4008,725,167,0001.57%
Table 11. Single-period model 4: key data of sensitivity analysis.
Carbon Credit Unit Cost
(Decrease/Increase: 250 Is the Base Period)
Carbon Tax CostCarbon Credit IncomeProfitProfit Change (%)
200
(−20%)
1,019,187,000541,083,9008,620,824,000−1.54%
225
(−10%)
1,019,191,000608,713,9008,688,457,000−0.77%
2501,019,186,000676,357,0008,756,091,0000.00%
275
(+10%)
1,019,186,000743,992,7008,823,727,0000.77%
300
(+20%)
1,019,186,000811,628,4008,891,363,0001.54%
Disclaimer/Publisher’s Note: The statements, opinions and data contained in all publications are solely those of the individual author(s) and contributor(s) and not of MDPI and/or the editor(s). MDPI and/or the editor(s) disclaim responsibility for any injury to people or property resulting from any ideas, methods, instructions or products referred to in the content.

