Article

Inventive Activity for Climate Change Mitigation: An Insight into the Maritime Industry

Faculty of Economics and Transport Engineering, Maritime University of Szczecin, 11 Pobożnego Str., 70-507 Szczecin, Poland
Energies 2023, 16(21), 7403; https://doi.org/10.3390/en16217403
Submission received: 20 September 2023 / Revised: 25 October 2023 / Accepted: 31 October 2023 / Published: 2 November 2023
(This article belongs to the Special Issue Climate Change, Energy Efficiency and Technological Innovation)

Abstract

:
Climate change mitigation is one of the most important challenges facing the modern world. It is necessary to monitor the development of new concepts and technologies and take a stab at identifying disruptive innovations, which have the potential of becoming real climate-friendly game changers. The aim of this paper is to examine the patterns of inventive activity aimed at mitigating climate change in the maritime industry with respect to other transport modes. Appropriate research tools in the area of patent analysis were selected and utilised. A new class of patents related to climate change in maritime transport (CPC-Y02T70/00) was used as a data source. The original value of the study consists of offering a complete picture of the efforts made in patenting activity in climate change mitigation in the maritime transport, with a look at leading applicants and countries, knowledge flows, the most robustly developed and underdeveloped technical fields. A map of technical knowledge flows for climate change mitigation in transport was constructed. The research results show that inventions for the maritime industry are less hermetic than those for air and road transport; however, they are not as much linked with previously developed solutions. The most intensively developed technical fields include the design and construction of watercraft hulls (1) and measures to reduce greenhouse gas emissions related to the propulsion system (2). Among the technologies whose further development merits close attention are solutions related to electrical propulsion and wave energy. At the same time, inventive activity in the area of climate change adaptation dedicated to ports is insignificant and definitely needs more support from the community of scientists and inventors. Building knowledge based on patent information can help universities, research institutions, shipyards, manufacturers of marine equipment and other business entities to identify the technologies of the greatest potential for further development.

1. Introduction

The maritime transport has been undergoing truly revolutionary changes in recent years, which are bound to intensify going forward. Although they do not occur unexpectedly or overnight, they have become prominent enough to create a new reality in which the maritime industry will operate in the years to come. The transformation takes place on two complementary planes, namely the mitigation of climate change and the use of emerging technologies.
The activities in the maritime industry aimed at climate change mitigation are largely driven by the relevant new regulations created at the global level by the International Maritime Organization (IMO), as well as at the regional level. Net-zero targets have been established by, among others, the European Union [1], the USA [2] and China [3]. The EU is considered a leader of changes in the area of new regulations aimed at encouraging businesses operating in the maritime industry to intensify their climate change mitigation measures. The inclusion of maritime transport in the European Green Deal has been deemed necessary for the achievement of the ambitious climate goals set by the EU—hence the pressure put on the maritime industry and the ultimate decision not to leave the maritime transport regulations under the exclusive authority of the IMO. Moreover, the environmental, social and governance (ESG) reporting standards have been made more stringent, in line with the Corporate Sustainability Reporting Directive becoming effective. Revealing the carbon footprint will become mandatory across the economy, including transport companies participating in the supply chain.
The latter plane is related to the growing use of new technologies in the area of, among others, Maritime 4.0, i.e., the utilisation of digital tools in ship management and maritime supply chain management. The future of the maritime industry is built upon the use of state-of-the-art technological solutions, such as digital twins, virtual reality, augmented reality, smart ship, autonomous ship, blockchain and others [4,5,6]. The ship’s structure, equipment and propulsion are also developed with the application of emerging technologies. In mid-2022, the share of ships powered by alternative fuels, such as LNG, LPG, methanol, ethane, bio-fuel and hydrogen, constituted as much as 24.6% of the global orderbook for new ships [7].
Maritime transport is on the verge of a technological transformation aimed at decarbonisation of the industry. Innovations, which stem from the climate-friendly approach and are introduced by early adopters, are becoming a springboard for devising new business strategies and building a modern image of shipping companies or even the whole blue economy [8,9]. According to the theory of disruptive innovation, it is necessary to monitor the development of new concepts and technologies and take a stab at identifying disruptive innovations, which have the potential of becoming real game changers. Each new solution may carry the potential of becoming a disruptive innovation [10]. It is the responsibility of business decision makers to predict whether a new technology is likely to be disruptive to a marketplace or to their organisation [11]. It must be reiterated here that the technologies implemented today do not guarantee success tomorrow. For instance, although LNG is regarded as the most widely recognised alternative marine fuel, the authors of research studies increasingly recommend other options, e.g., hydrogen fuels [12,13]. The fears and controversies regarding the importance of LNG in the energy transformation of the maritime industry [14] open the door to other options and stimulate further research in this area.
This paper, based on the theory of diffusion of innovations, looks into the first phase of the innovation development process. The decisions made in this phase, prior to application of an innovation by early adopters, are of utmost importance to the diffusion process [15] (p. 136). It is very difficult to identify the leading technologies of the future, as many factors determine the scale of their final market presence. On the other hand, it is worth pointing out the areas in which they can be searched for and the knowledge centres, which conduct advanced research in the areas of interest. According to Rogers [15] (p. 140), one of the measures of success of research is whether or not it leads to a patent. Therefore, only patents were examined in this study.
The research combines two current strong trends in the maritime market, namely the emergence of new technologies in maritime transport and the mitigation of climate change. The aim of this paper is to examine the patterns of inventive activity aimed at mitigating climate change in maritime transport with respect to other transport modes. To this end, appropriate research tools in the area of patent analysis were selected and utilised.
The research questions posed in this study cover the pre-phase of the first stage of the innovation diffusion process. This is the stage of generating novel ideas and concepts. It is still insufficiently researched; therefore, the evidence from individual industries may contribute to its better understanding. The research process consisted of finding answers to the following research questions (RQ):
RQ1:
Which countries and knowledge centres are leaders in the area of climate change mitigation technologies related to maritime or waterway transport?
RQ2:
Is the inventive activity in the area of climate change mitigation in maritime transport as intensified as it is in other transport modes?
RQ3:
Which areas of technical knowledge in the field of climate change mitigation in maritime or waterway transport are the primary focus of development?
Decarbonisation of the shipping industry is widely discussed in the literature, with the current research dealing with, inter alia, the application of alternative marine fuels [16,17], operational practices and solutions minimising the GHG emissions [18,19], improvement in energy efficiency [20,21], and international regulations, measures and policy strategies [22,23]. However, the concepts of decarbonisation of the shipping industry through intensified inventive activity and clever technology management are still scarcely represented in the literature.
This paper offers a complete picture of the efforts made in patenting activity in climate change mitigation in maritime transport, with a look at the leading applicants and countries, knowledge flows, the most robustly developed technical fields and major problems. The novelty of the paper lies in the use of a new class in the patent hierarchy (CPC–Y02T70/00) for the purpose of analysing the still insufficiently explored topic of innovation in maritime transport aimed at climate change mitigation. Research work is required to understand the process of creating and developing inventions in maritime transport, which is characterised by many unique features, such as the cyclical nature of freight rates, strong relations with the shipbuilding sector, dependency on the economic growth rate and volume of shipping by sea, and the requirement to comply with international conventions and regulations issued by the IMO.
The remainder of this study is organised as follows. The research background relating to building knowledge based on patent analysis with a special focus on climate change is discussed in Section 2. The research methodology is described in Section 3, and the results obtained are discussed in Section 4. Section 5 contains the limitations of the study and proposes the directions for future research. Section 6 draws the conclusions, presents the answers to research questions and suggests managerial implications for the shipping industry and policy makers.

2. Research Background

2.1. Building Knowledge Based on Patent Analysis

The contemporary advances in technology have elevated the need for managing knowledge scattered across diverse sources of information [24]. Technology management offers the methods, techniques and tools to tackle the problem. The management of technology bridges “the knowledge and practice gap” between science, engineering and business management [25]. It is emphasised that the management of technology should be seen as the main engine of economic growth and wealth creation [26]. Technology management is sometimes referred to as the management of technology and innovation, engineering technology management, or technology and innovation management [27].
One of the tools used in technology management, and applied in this research, is patent analysis [28]. Patent analysis is utilised in the planning of technology development at a national, industry or company level [29]. A patent is defined by the World Intellectual Property Organization as “an exclusive right granted for an invention, which is a product or a process that provides, in general, a new way of doing something, or offers a new technical solution to a problem” [30]. Perceived as a barometer of research and development activities, patents can provide an important insight into the stage of technological development [31]. They are considered to be a more reliable gauge of inventive activity than expenditures on R&D, which do not reveal information on the outcomes of the innovation process [32]. However, they do have their drawbacks, the major one being no guarantee that a solution protected under patent law will find practical application. Nevertheless, most significant inventions from business practice are patented, whether based on R&D or not [33].
The creation of a new solution often precedes many years of work, and the process of obtaining patent protection is not always quick either. However, this is still only the beginning of the journey of bringing an innovation to the market. An invention is a promising idea, a concept with a potential to become an innovation [34]. An invention may also be defined as something not previously demonstrated to be possible in practice [35]. The process of commercialisation converts an invention into an innovation [36]. This study focuses on the stage of generating novel ideas, not on the process of commercialising them to the market.
E. Rogers, the author of the Diffusion of Innovations, proposed a definition of innovation, which is currently one of the most popular ones. He also conceptualised the incentives for adopting the innovations and characterised the process of adoption and diffusion of innovations. He defines innovation as “an idea, practice, or object that is perceived as new by an individual or other unit of adoption” [15]. The innovation decision process involves five steps: (1) knowledge, (2) persuasion, (3) decision, (4) implementation and (5) confirmation [15]. These stages usually follow one after the other. However, the diffusion process is not always successful, and there are frequent scenarios where innovations are introduced and do not diffuse [37].
The theory of diffusion of innovation also draws attention to the figure of the inventor, who is at the very beginning of the process of creation of innovation. The innovators’ dominant feature is the will to experience new ideas. They should be prepared for the fact that not all innovations are successful and profitable. The risk of failure and a certain degree of uncertainty always accompany innovation [38].
Research institutions, business entities and policy makers apply patent analysis to, inter alia, determine technical novelty, analyse patent trends and diffusion speed, forecast technological developments in a particular field, devise strategic technology plans, identify promising patents and research fields, devise technology road maps, identify insufficiently developed areas and identify technological competitors [24,39]. Owing to its diversity of capabilities, patent analysis can be used both to analyse technological trends and business opportunities based on technological capabilities [40].
From the point of view of knowledge centres and companies developing existing technologies and anticipating the emergence of new ideas, it is important to monitor “who is doing what now with respect to a technology” [41]. Patent analysis can be used for assistance in designing new technologies [42]. The use of patent analysis for research and forecasting of emerging IT-related technologies is becoming increasingly popular [43], such as blockchain [44]. This technology is also used in maritime logistics chains.
Obtaining patent protection means a successful completion of the innovation process [45]. For many companies, patents are the basis for building a business strategy. Two main groups of incentives can be distinguished, which motivate companies to participate in the patent race. The first is the positive incentive, which aims to exclude competitors and be the only beneficiary from the inventions in the product market, and the second is the negative incentive, which is to protect the company from the risk of being blocked by patents owned by others [46]. Therefore, three main patent strategies can be distinguished: offensive, defensive and leveraging strategy [47]. The traditional motivation for patenting to protect product technology is still dominant [48]. The leveraging strategy, on the other hand, takes into account various forms of cooperation, such as sale, licensing and cross-licensing, patent pooling, alliances and joint ventures, donation of patent rights and their abandonment, as well as mutual hold up [49]. Patents are a priceless source of information on the latest technical and technological advancements in a wide array of technology areas. The solutions protected under patent law include those in the area of computer sciences, biotechnology, electrical engineering, engineering, agriculture, transport and many others. Patent analysis makes it possible to identify the directions of further development and the degree of innovation across industries. Patent analysis research is conducted with reference to specific technologies, e.g., internal combustion engines [50], assessment of the innovation potential of cities [51,52], regions [53], enterprises [54], individual industries [55] and countries [56,57].
Patents can not only provide a competitive advantage; they are also a measure of technological progress. The collection of patents in a particular field of technology is part of the accumulated knowledge of that discipline of science and technology [58].
As a tool for the assessment of innovation potential in the shipping industry, patent analysis has been discussed in the literature, although its use for this purpose is rare, perhaps due to the prevailing view of the shipping industry as technically conservative [59]. The research conducted so far focuses on several research areas, such as ship power systems [60] analysed from several distinct perspectives, including, without limitation, the perspective of technological competitiveness of ship integrated power system enterprises [61] or the trends and development of those systems in China [62]. Other studies seek solutions to such research problems as the assessment of patent activity of liner shipping companies [63], technological competitiveness of enterprises [61], corporate sustainability (in a broad sense) in shipping companies [64] and autonomous ships [65,66]. None of the papers referred to above examines the technologies or applications for the mitigation or adaptation against climate change in the maritime industry.

2.2. Patents versus Climate Change

The patent information on green technologies is considered in the literature as a good approximation of green innovations [67,68]. The recent extension of the classification of patents to include a new class of patents related to climate change has brought new opportunities for the analysis of technological solutions and assessment of the status quo of technology in this area.
The system of patent classification is updated on a regular basis to conform to the global trends in technologies, taking into consideration the prevailing social and economic needs. One of the major challenges facing, inter alia, the world of science, is the mitigation of climate change. Therefore, in response to the needs of scientists and the economic environment, the European Patent Office (EPO), acting jointly with the United States Patent and Trademark Office (USPTO), launched the new class Y02 in the patent hierarchy, i.e., the technologies or applications for mitigation or adaptation against climate change. Class Y02 covers selected technologies developed to control, reduce or prevent anthropogenic emissions of greenhouse gases—in accordance with the Kyoto Protocol and the Paris Agreement—and also technologies, which allow adapting to the adverse effects of climate change [69]. Initially, it was composed of two subclasses, and none of them was dedicated to transport [70]. Gradually expanded with new Y-codes, the class has proven itself to be addressing the current needs. A clear list of solutions in the field of climate change has contributed to expanding the group of entities interested in information on patents [71].
At present, the class is composed of eight subclasses, which are presented in Table 1.
The aforementioned subclasses are broken down into main groups. Subclass Y02T includes the following main groups:
  • Road transport of goods or passengers (Y02T10/00);
  • Transportation of goods or passengers via railways, e.g., energy recovery or reducing air resistance (Y02T30/00);
  • Aeronautics or air transport (Y02T50/00);
  • Maritime or waterway transport (Y02T70/00);
  • Enabling technologies or technologies with a potential or indirect contribution to GHG emissions mitigation (Y02T90/00).
Delving deeper into the hierarchy, each main group is subdivided into a number of subgroups. For example, Y02T70/00 is composed of six subgroups, which can be further broken down into smaller units. Subclass Y02T as a whole and the main group Y02T70/00 (maritime or waterway transport) are the subject of the analysis conducted in Section 4 hereof.
The first studies based on data from the new Y02 class are already available in the literature. Y02 tagged patent data are appreciated by scientists as a reliable source of information on the scale and directions of inventive activity in the area of mitigation and adaptation against climate change. Hötte and Jee [73] propose an interesting analysis based on class Y02A and several selected Y02 four-digit level groups, showing the potential synergies between technologies aimed at adaptation to and mitigation of climate change. Dechezlepretre et al. [74] focus on technologies dedicated to adaptation to climate change. In an analysis of the technology fields of subclass Y02A, they point to the low cross-border diffusion of innovations, especially in the area of agriculture. They prove that cross-border transfers of climate-oriented patented inventions predominantly occur between a small group of countries consisting of high-income economies and China. Su and Moaniba [75] use Y02 tagged data and carbon dioxide and other greenhouse gas emissions data to prove that the number of climate-change-related innovations corresponds positively to the increasing levels of carbon dioxide emissions. Research into maritime transport based on an analysis of class Y02T70 is still non-existent in the literature. This paper addresses that gap.
Research conducted in recent years has devoted much attention to carbon emissions. For example, patent analysis has been used to assess trends in the development of adsorption technologies for carbon capture [76], the reduction in CO2 emissions from fossil fuel energy consumption [77] and to assess the level of technological development of alternative fuels for shipping, such as LNG [78]. Global warming is addressed in Sustainability Development Goal 13: “Take urgent action to combat climate change and its impacts by regulating emissions and promoting developments in renewable energy”. According to a recent UN report, the action taken to meet SDG 13 is insufficient [79]. It emphasises that deep and sustained reductions in greenhouse gas (GHG) emissions are essential in all sectors throughout this decade. Expectations related to the possibilities of its implementation are largely related to the development and application of new technologies [80].
The dependencies between the environmental policy and growth in the number of patents are investigated in the literature [81]. Environmental policies and private sector initiatives can promote environmental technologies and development of low-carbon energy technologies [82]. In maritime transport, such dependency has been shown for the sulfur emission regulation [83]. Looking for similar relationships with regard to the decarbonisation of shipping, it should be stressed that there is a growing number of stimuli strengthening the inventive activity in this area, mainly owing to the increasing number of relevant cross-border regulations. The first obligatory international policy instruments concerning the GHG emissions were implemented by the IMO as early as 2011 [84]; however, it has not been until recent years that the IMO has strongly focused on decarbonisation of the industry. In 2016, the IMO Data Collection System (IMO DCS) was introduced, which imposes a requirement and provides a framework for reporting CO2 emissions in international shipping. A year before, in 2015, the EU implemented a system for monitoring, reporting and verification of emissions (UE MRV Regulation) [85].
The Paris Agreement, adopted in 2016, is considered by some to be a breakthrough in the awareness and attitude of industries and societies towards decarbonisation of national economies. Although maritime transport was left out in the Paris Agreement—a fact, which may be deemed as discouraging from investment in the development of technologies aimed at decarbonisation of the industry—this significant event stimulated a discussion in the shipping industry on accountability for climate change.
The following years saw an acceleration in the global initiative for maritime transport. The Initial IMO GHG Strategy of 2018 was a publication considered by the maritime market players as extremely important in drawing attention to reducing the GHG emissions [86]. Its updated version from 2023 responds to doubts about whether the measures created were sufficient to achieve the targets set by the IMO [22]. A need for more ambitious and decisive measures in the maritime sector was highlighted, since neither policy makers nor industry actors had been considering climate change issues seriously enough [87,88,89]. The revised IMO GHG Strategy is more ambitious and adopts a target of net-zero GHG emissions from international shipping close to 2050 [90].
The abovementioned forces driving the inventive activity in the area of climate change mitigation in maritime transport are accompanied by factors hindering it. Limited financial resources for research and insufficient political or economic stimuli to conduct research and implement innovations in business practice are only some of them. The policy environment has an impact on the growth of innovation [91]. The financing of scientific research and the expected return on investment in the implementation of inventions are firmly embedded in the social and economic reality. On many occasions, research projects have to compete for financing. The COVID-19 pandemic redirected the focus of investors towards research in the pharmaceutical industry. According to the EPO statistics for 2020, the strongest annual growth in patent applications was recorded for pharmaceuticals (+10.2%), followed by biotechnology (+6.3%), with a slump in engines, pumps and turbines (−16.4%) and mechanical elements (−9.5) for the same period [92]. Patents in the area of maritime transport do not fall into the key patenting trends.
Moreover, the condition of the global shipbuilding industry, measured by the orderbook volume and prices of new ships, as well as the cyclical nature of the industry, are also of significance here. As shown further in the paper, the shipbuilding industry is one of the main types of knowledge centres, which file patent applications, and, at the same time, it is the direct user of patented solutions, utilising new technologies in newly built ships. A boom in the shipbuilding industry can lead to better opportunities for R&D financing. The prevailing broad uncertainty over fuel and technology choices has been the main factor hindering shipowners from placing orders for new vessels [14].

3. Research Methodology

In this paper, the Cooperative Patent Classification (CPC) was used because of its more detailed breakdown into the hierarchy levels compared to the equally commonly applied International Patent Classification (IPC) and—what is of the utmost importance here—its isolated section on climate change mitigation and adaptation technologies. Each patent document in the CPC has a title, an abstract and a detailed description, as well as one or more CPC codes assigned.
Two patent collections in the area of climate change mitigation technologies, namely transportation collection and maritime collection, were analysed in this paper. The former has a broader scope, including the entire subclass Y02T (climate change mitigation technologies related to transportation), whereas the latter is composed of one of the main groups of subclass Y02T related to the climate change mitigation technologies assigned specifically to maritime transport (Y02T70/00). Both collections were analysed in terms of the dynamics of inventions on the basis of temporal trends and the country of applicants. In the next step, the analysis was deepened, and the main research subject—maritime collection—was analysed with regard to several features, such as the identity of applicants, applicant–country relations, technology influence, patent power, CPC codes most frequently used, CPC codes whose number of instances in the collection increased most and the most common noun groups in patent titles and abstracts. The technology influence and patent power analyses were conducted against other transport modes. The research framework utilised is shown in Figure 1.
The value of a patent can be assessed using various indices and indicators. The metrics used for comparison and analysis of technological developments include, in particular, the number of patent applications, number of applicants, number of rejected applicants. In addition, other frequently used indicators are patent discontinuance rates (comparing the counts of expired patents with the number of granted patents), patent failure rates (comparing the counts of rejected or abandoned patent applications with the overall number of patent applications), success rate (comparing the count of granted patents with the overall number of patent applications) [93]. For international comparisons, the revealed technology advantage (RTA) index can be used, which provides an indication of the relative specialisation of a country in selected technological domains [94]. For specific technologies, it is also possible to match the logistic curve model or Gompertz model to the time series of patents and then read from it properties such as technology maturity rate and saturation level [95]. For the present study, too many different technological solutions are included in the subgroups studied to justify such study. The choice of indicators always depends on the specificity of the studied area and the purpose of the study.
In this paper, indicators adapted to the purpose and specificity of the study are used. One of them is the number of citations of a certain patent document in other patent applications filed in the following years. This index provides an indication of the technological importance of a patent [96] (p. 18) and is referred to as the technological influence [97] or the technology diffusion speed [98]. However, its drawback is that it is not until several years after a patent is granted protection that its value or importance can be assessed (similarly to the analysis of the number of citations of scientific papers in other publications). Therefore, in order to trace the evolution of technology, it may be useful to conduct an analysis of backward citations, which has the advantage of providing data about the cited patents as soon as a patent is published [99]. Both indices represent the knowledge flows in a technological field [100]. In this paper, the number of forward and backward citations was used, each of them referring to the number of patents in a certain collection. Forward citations per patent (1) for a certain collection were calculated using a formula proposed by Kim and Bae [101]. Correspondingly, the number of backward citations per patent was calculated for a certain patent collection.
T e c h n o l o g i c a l   i n f l u e n c e   F o r w a r d   c i t e s   p e r   p a t e n t = F C i T i
where FCi—number of forward citations of collection i; Ti—number of patents of collection i.
Another index used in this paper is the patent power, defined according to a Formula (2) taken from Ref [98]:
P a t e n t   p o w e r = M i T i
where Mi—number of main groups of patents of collection i; Ti—number of patents of collection i.
A higher patent power value indicates a higher spillover of technology across different technology fields and sectors and a higher probability of creating new sectors [98]. The patent power and technological influence (forward citations per patent) indices provided two dimensions, which were used to construct a map of technical knowledge flows according to the mode of transport.
All the statistical data used in the research were analysed in terms of the number of patent families rather than the number of single patents. Thus, the collections do not contain duplicates of the same inventions protected under patent law in different countries. Such approach is often applied in research using patent analysis [102,103].
The tools supporting this research include, without limitation, the Patent Inspiration analytics platform (http://www.patentinspiration.com, accessed on 15 August 2023). Recommended as a research tool for technical problem solving and presentation of results [104], Patent Inspiration is based on EPO’s master documentation database and contains data from more than 100 countries.

4. Results and Discussion

4.1. The Transportation and Maritime Collections—General Overview

In 2000–2022, more than 2 million inventions, which were granted protection under patent law, fell into the class of technologies or applications for mitigation or adaptation against climate change. They were all tagged with the Y02 code (Table 2). The large number of Y02 tagged patents points to a high interest on the part of scientists in solutions allowing for mitigation or adaptation against climate change and shows the commitment of knowledge centres managing the research. A share of 13.3% of the total patents in this class is dedicated to the climate change mitigation technologies related to transportation.
In step one of the study, the time series of the transportation Y02T collection and the maritime Y02T70/00 collection were compared (see Figure 2).
Both collections show similar time series of the number of published patent documents; however, the dynamics of change varies. Considering the large share of transportation in the global GHG emissions, estimated at 20% [105], one could expect a constant growth in the interest in this area on the part of scientists. Meanwhile, a decline in the number of published patent documents can be observed over several years, which reaches its local minimum in 2019. This decrease is not an isolated case in the history of each of the collections. In 2013, the inventive activity slumped across the entire class Y02, presumably as a result of the global financial crisis [106]. An attempt can be made to look for the cause of the 2019 decline in the number of patents, followed by a slow recovery over the following years, in external factors, although looking for synchronicities between economic or political developments and the growth of technology is not an easy task. The possible stimulants and inhibitors of research into technologies in the area of climate change mitigation in the maritime sector are discussed in Section 2.2. The introduction of regulations and frameworks aimed at a more and more stringent reduction in CO2 emissions dates back to the years directly preceding and during growth in the analysed inventive activity in maritime transport. The difficulty in determining the precise dependency is caused by the delay resulting from the fact that a certain amount of time is needed for the development of an invention, followed by a several-year process of granting protection under patent law.
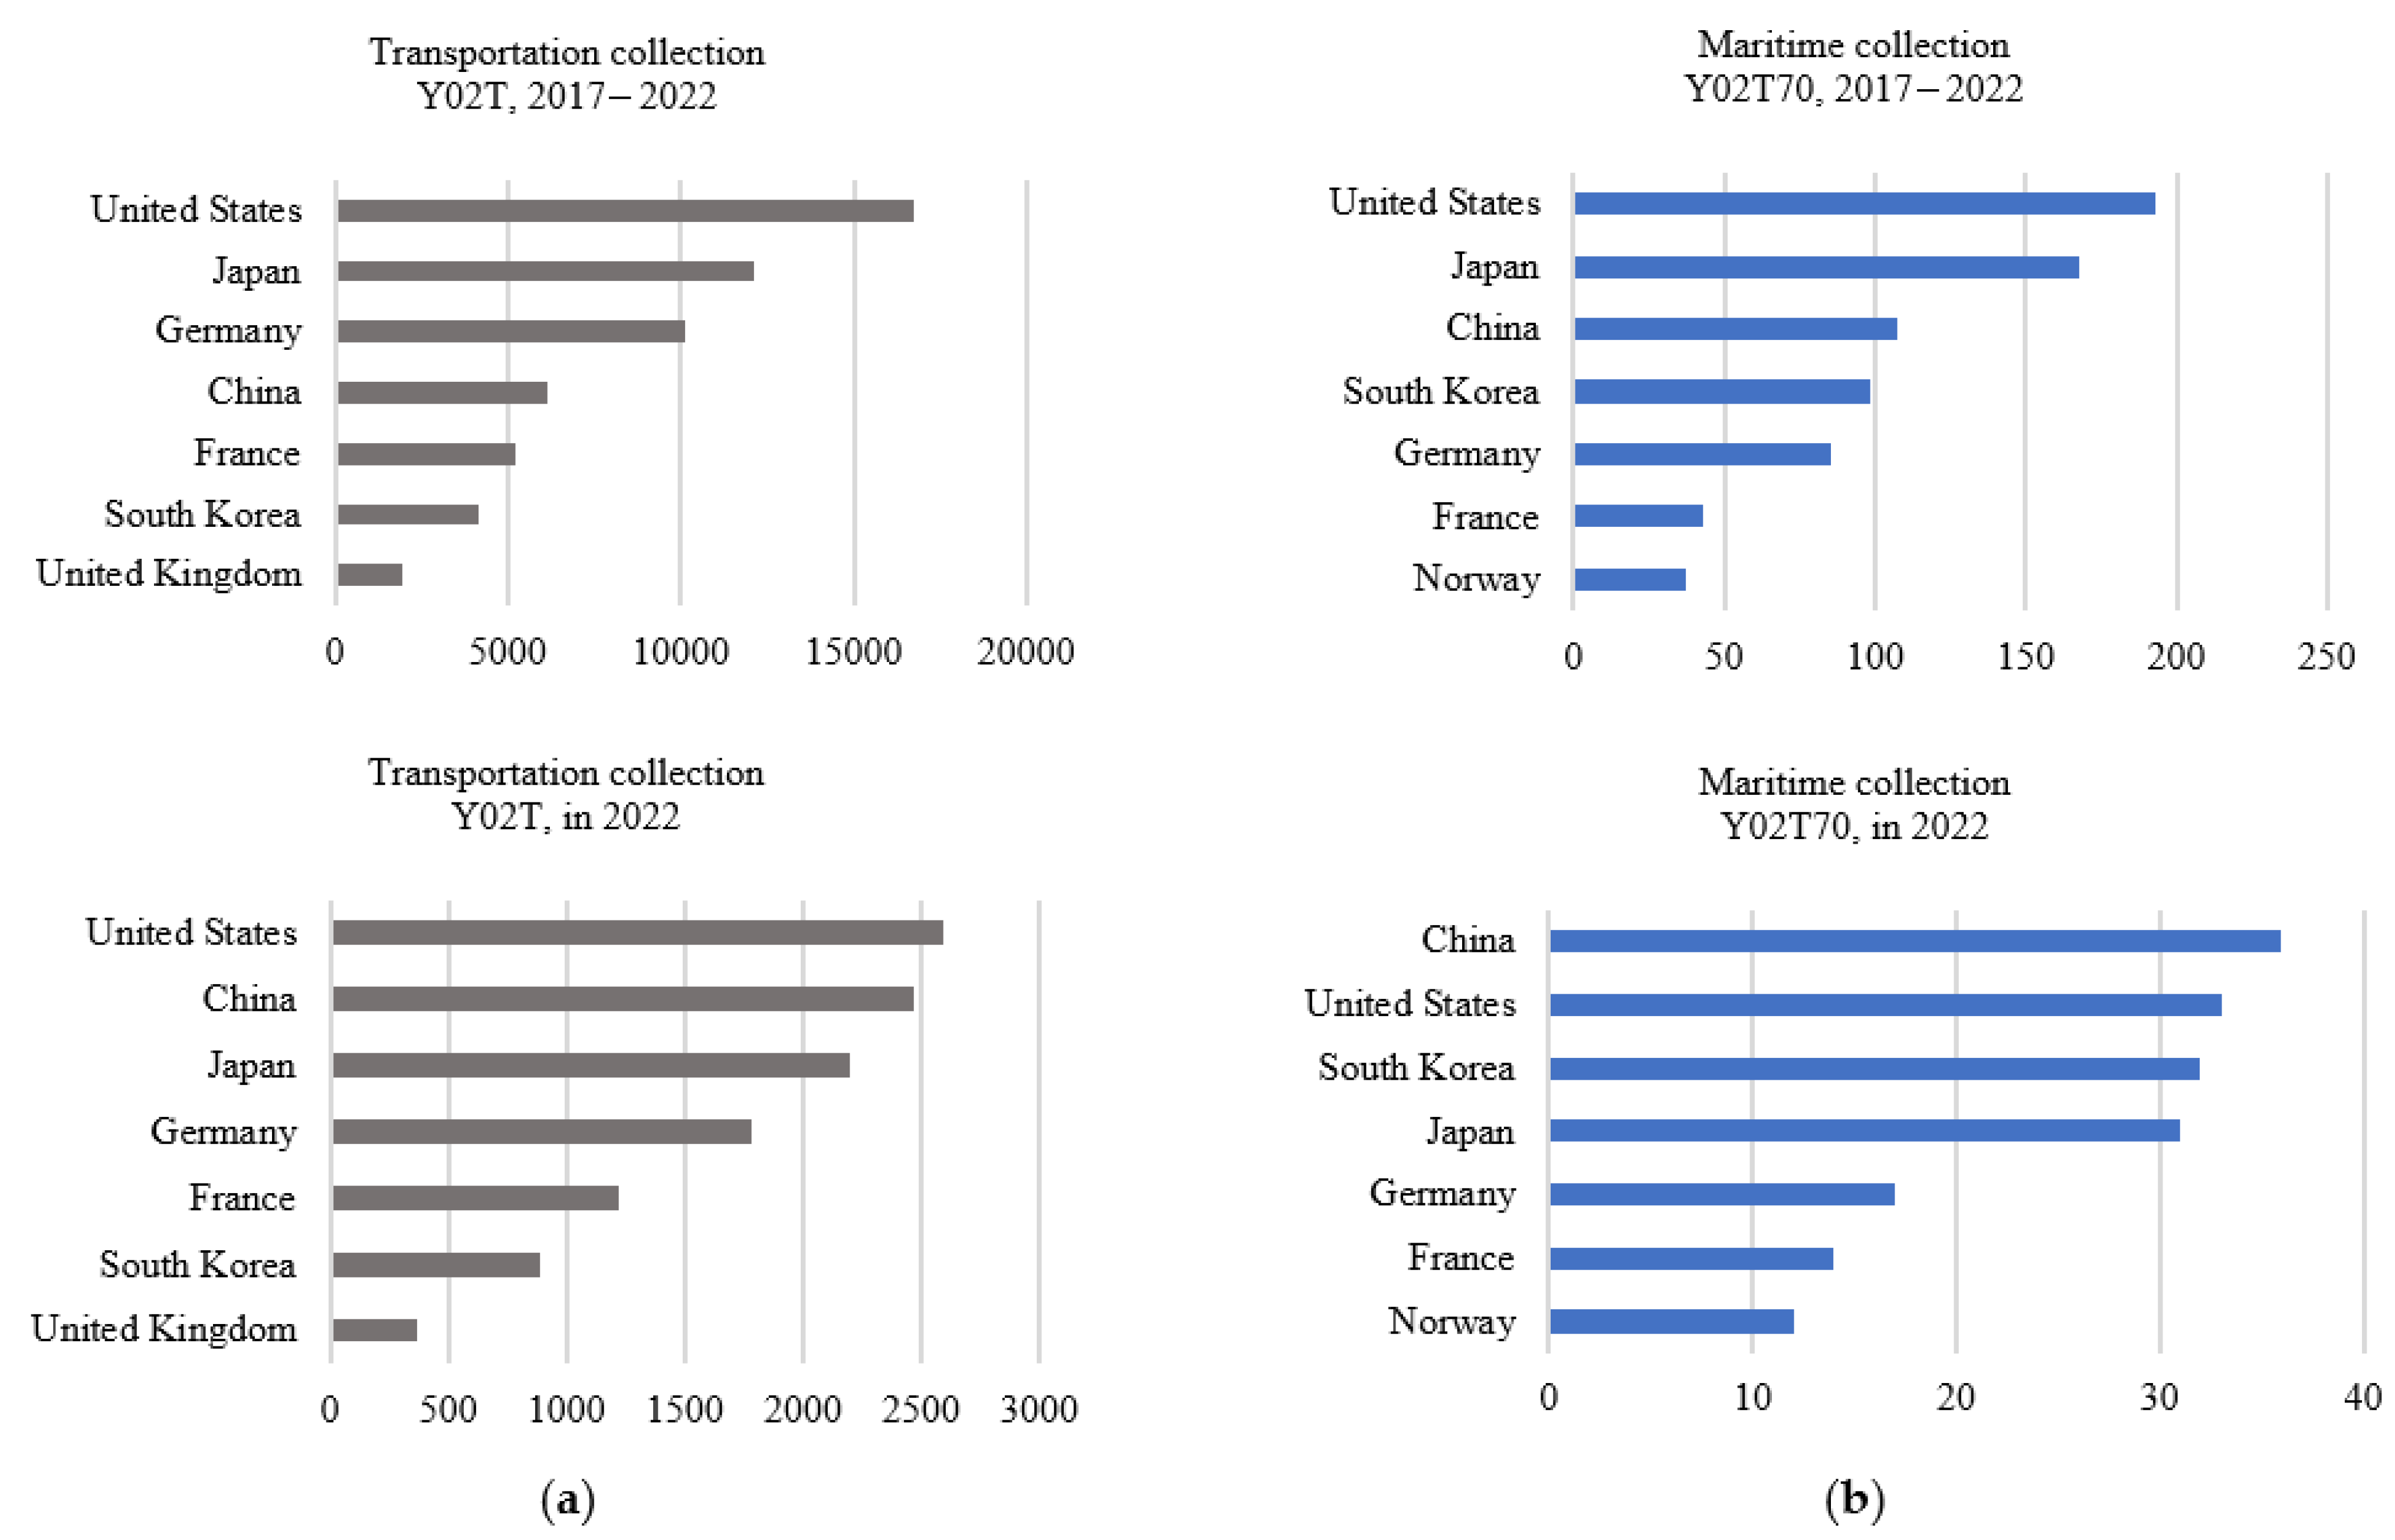
The assessment of the innovative activity in geographical terms covers an analysis of countries, which are leaders in the patent activity, and the applicants. Its importance lies in the fact that the address of a patent usually corresponds to the R&D centre of the company receiving it, which provides an overview of locations of the knowledge centres in the world. It follows from Figure 3 that in 2017–2022, the mitigation of climate change, both with reference to the entire transport sector and specifically to maritime transport, was of the greatest interest to applicants based in the USA and Japan. A dynamic change in this state of affairs is observed in the last year under analysis, to the advantage of China. China’s activity in this area had been growing consistently year on year, only to come second in the area of transport in general and first in the area of maritime transport in 2022.
A more detailed analysis of the maritime collection based on the company and university as patent applicants revealed further interesting characteristics. The results showed that the top five companies filed almost 58.9% of the patents filed by all companies together. The remaining 41.1% of patents were filed by 1543 companies. The situation was similar for academic units. The leading five universities filed 58% of the patents, and the remaining 42% of the patents were filed by the other universities, and there were 154 of them. In both cases, the five leading entities applied for around 60% of the number of total patents, which leads to the conclusion of a high concentration of inventive activities.
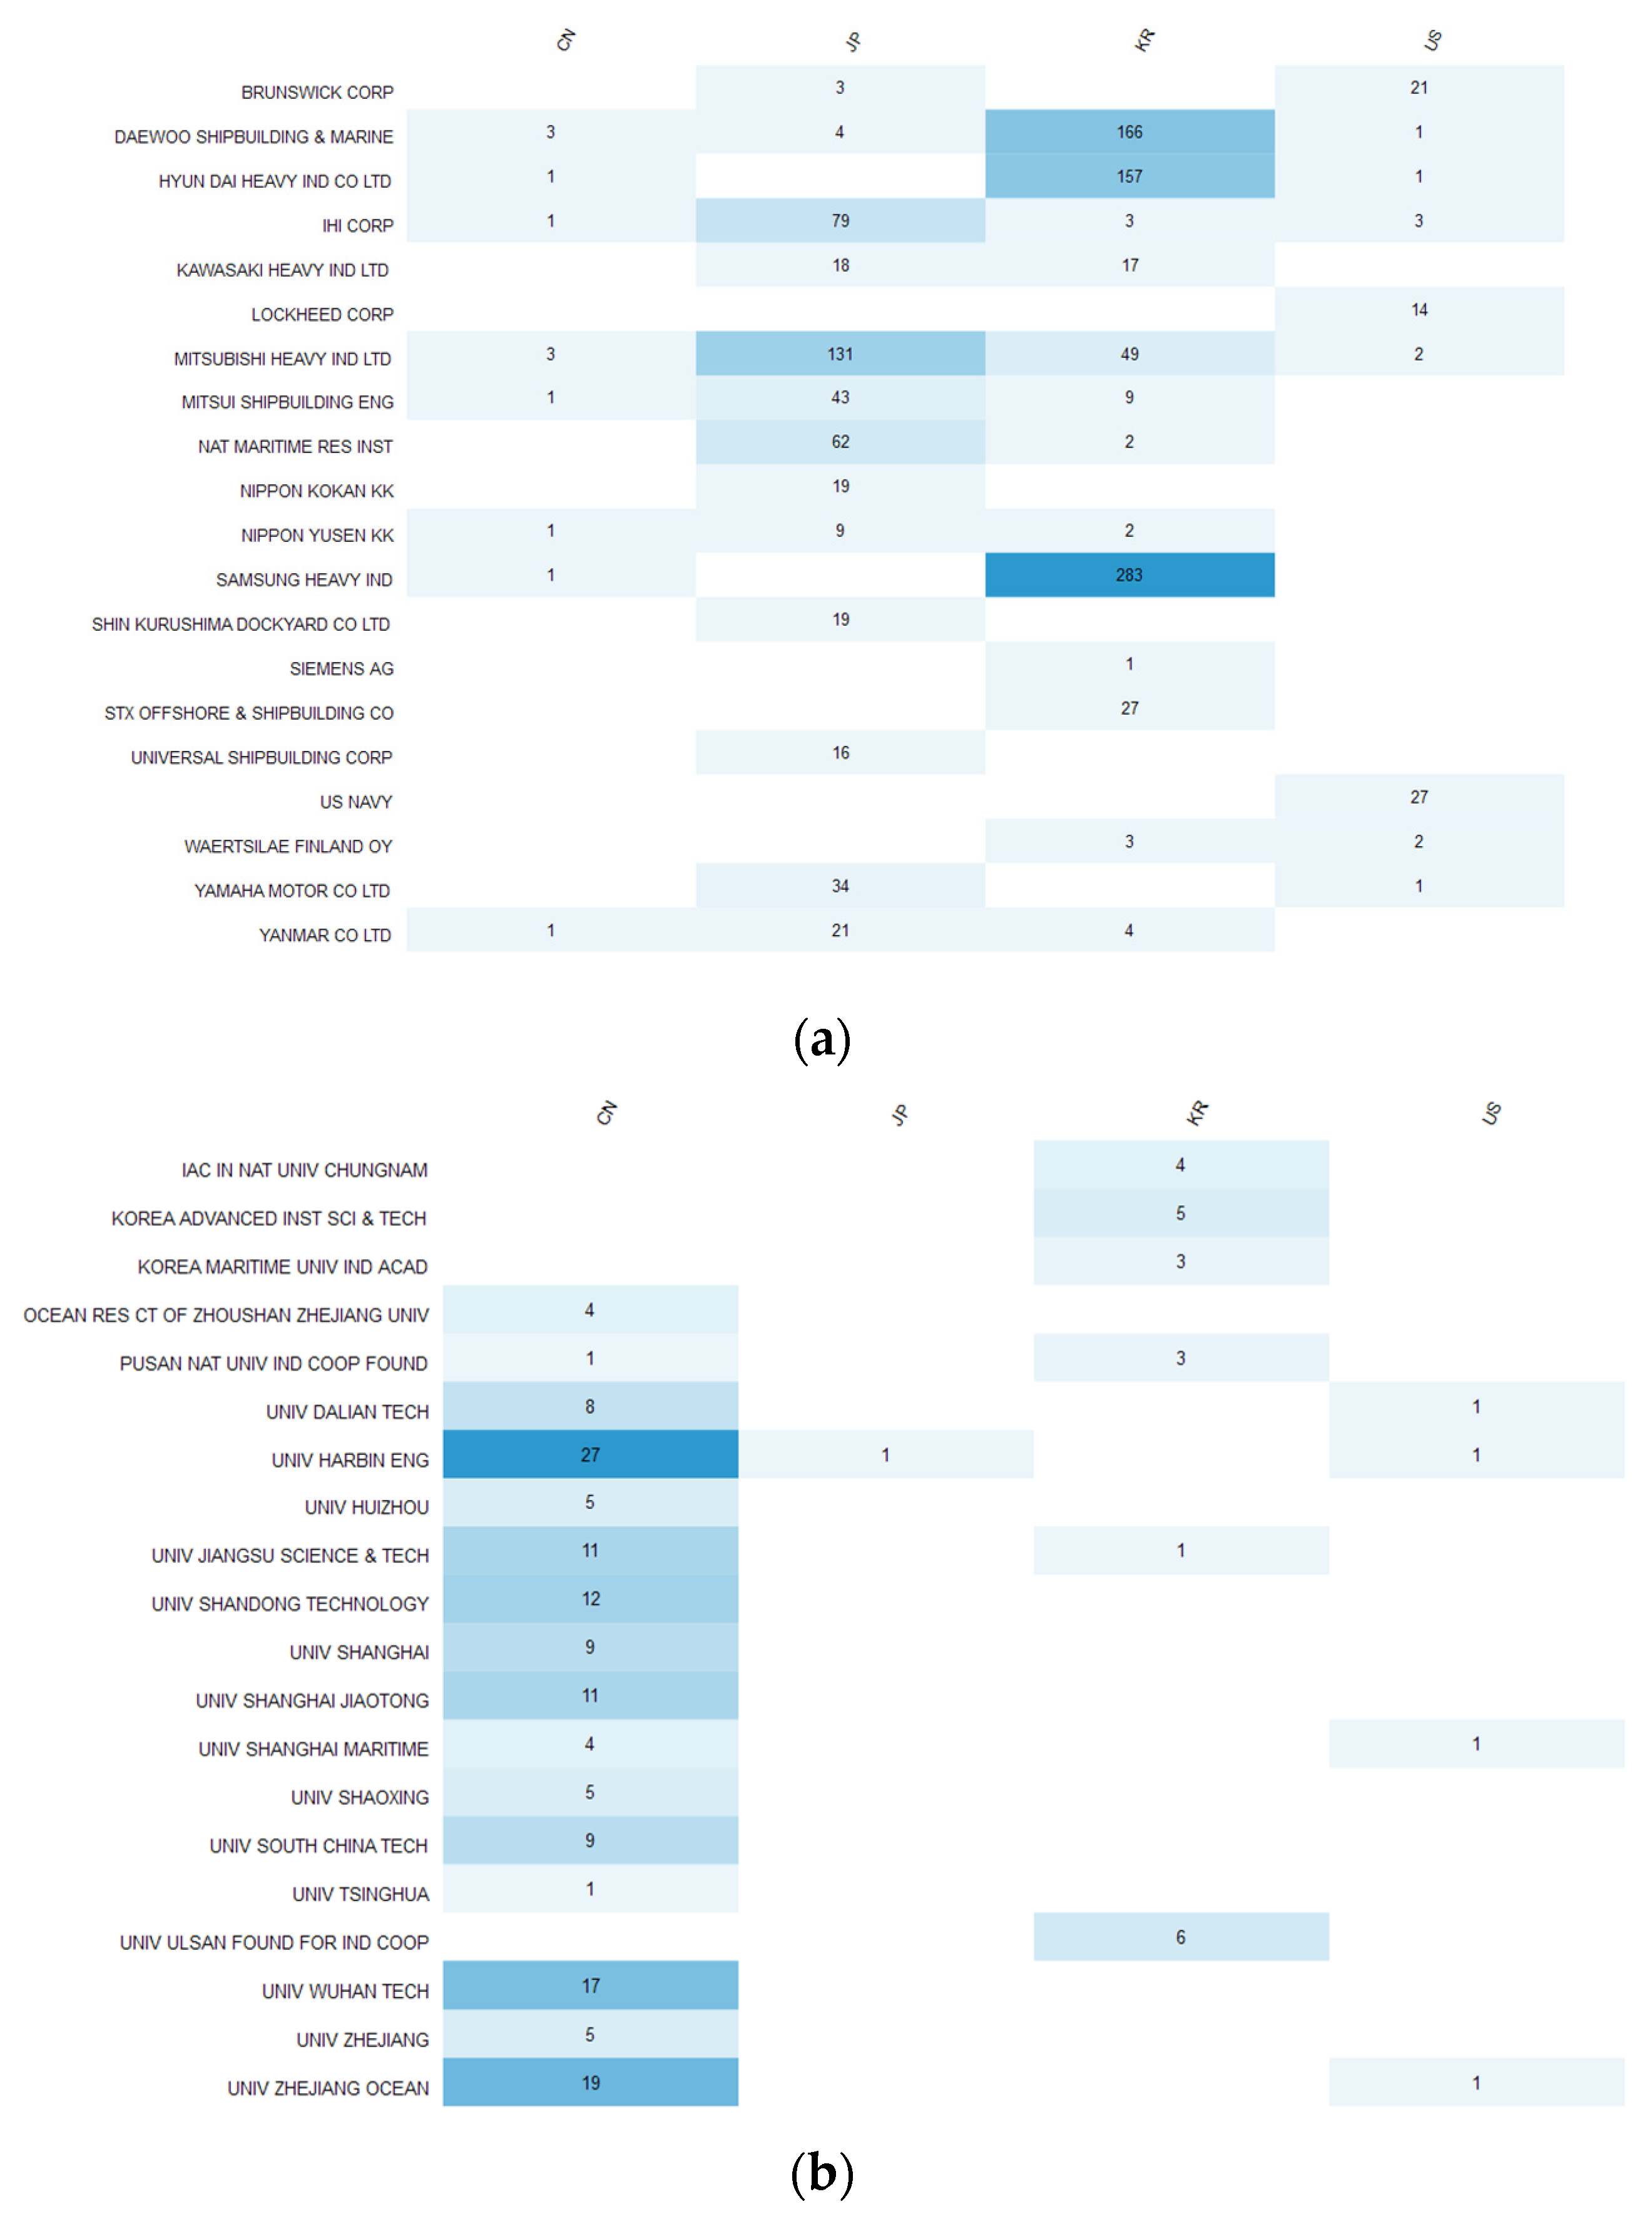
The results shown in Figure 4 represent the dissimilarity of knowledge centres in the leading countries. The analysis extracts only the top twenty results within the maritime collection.
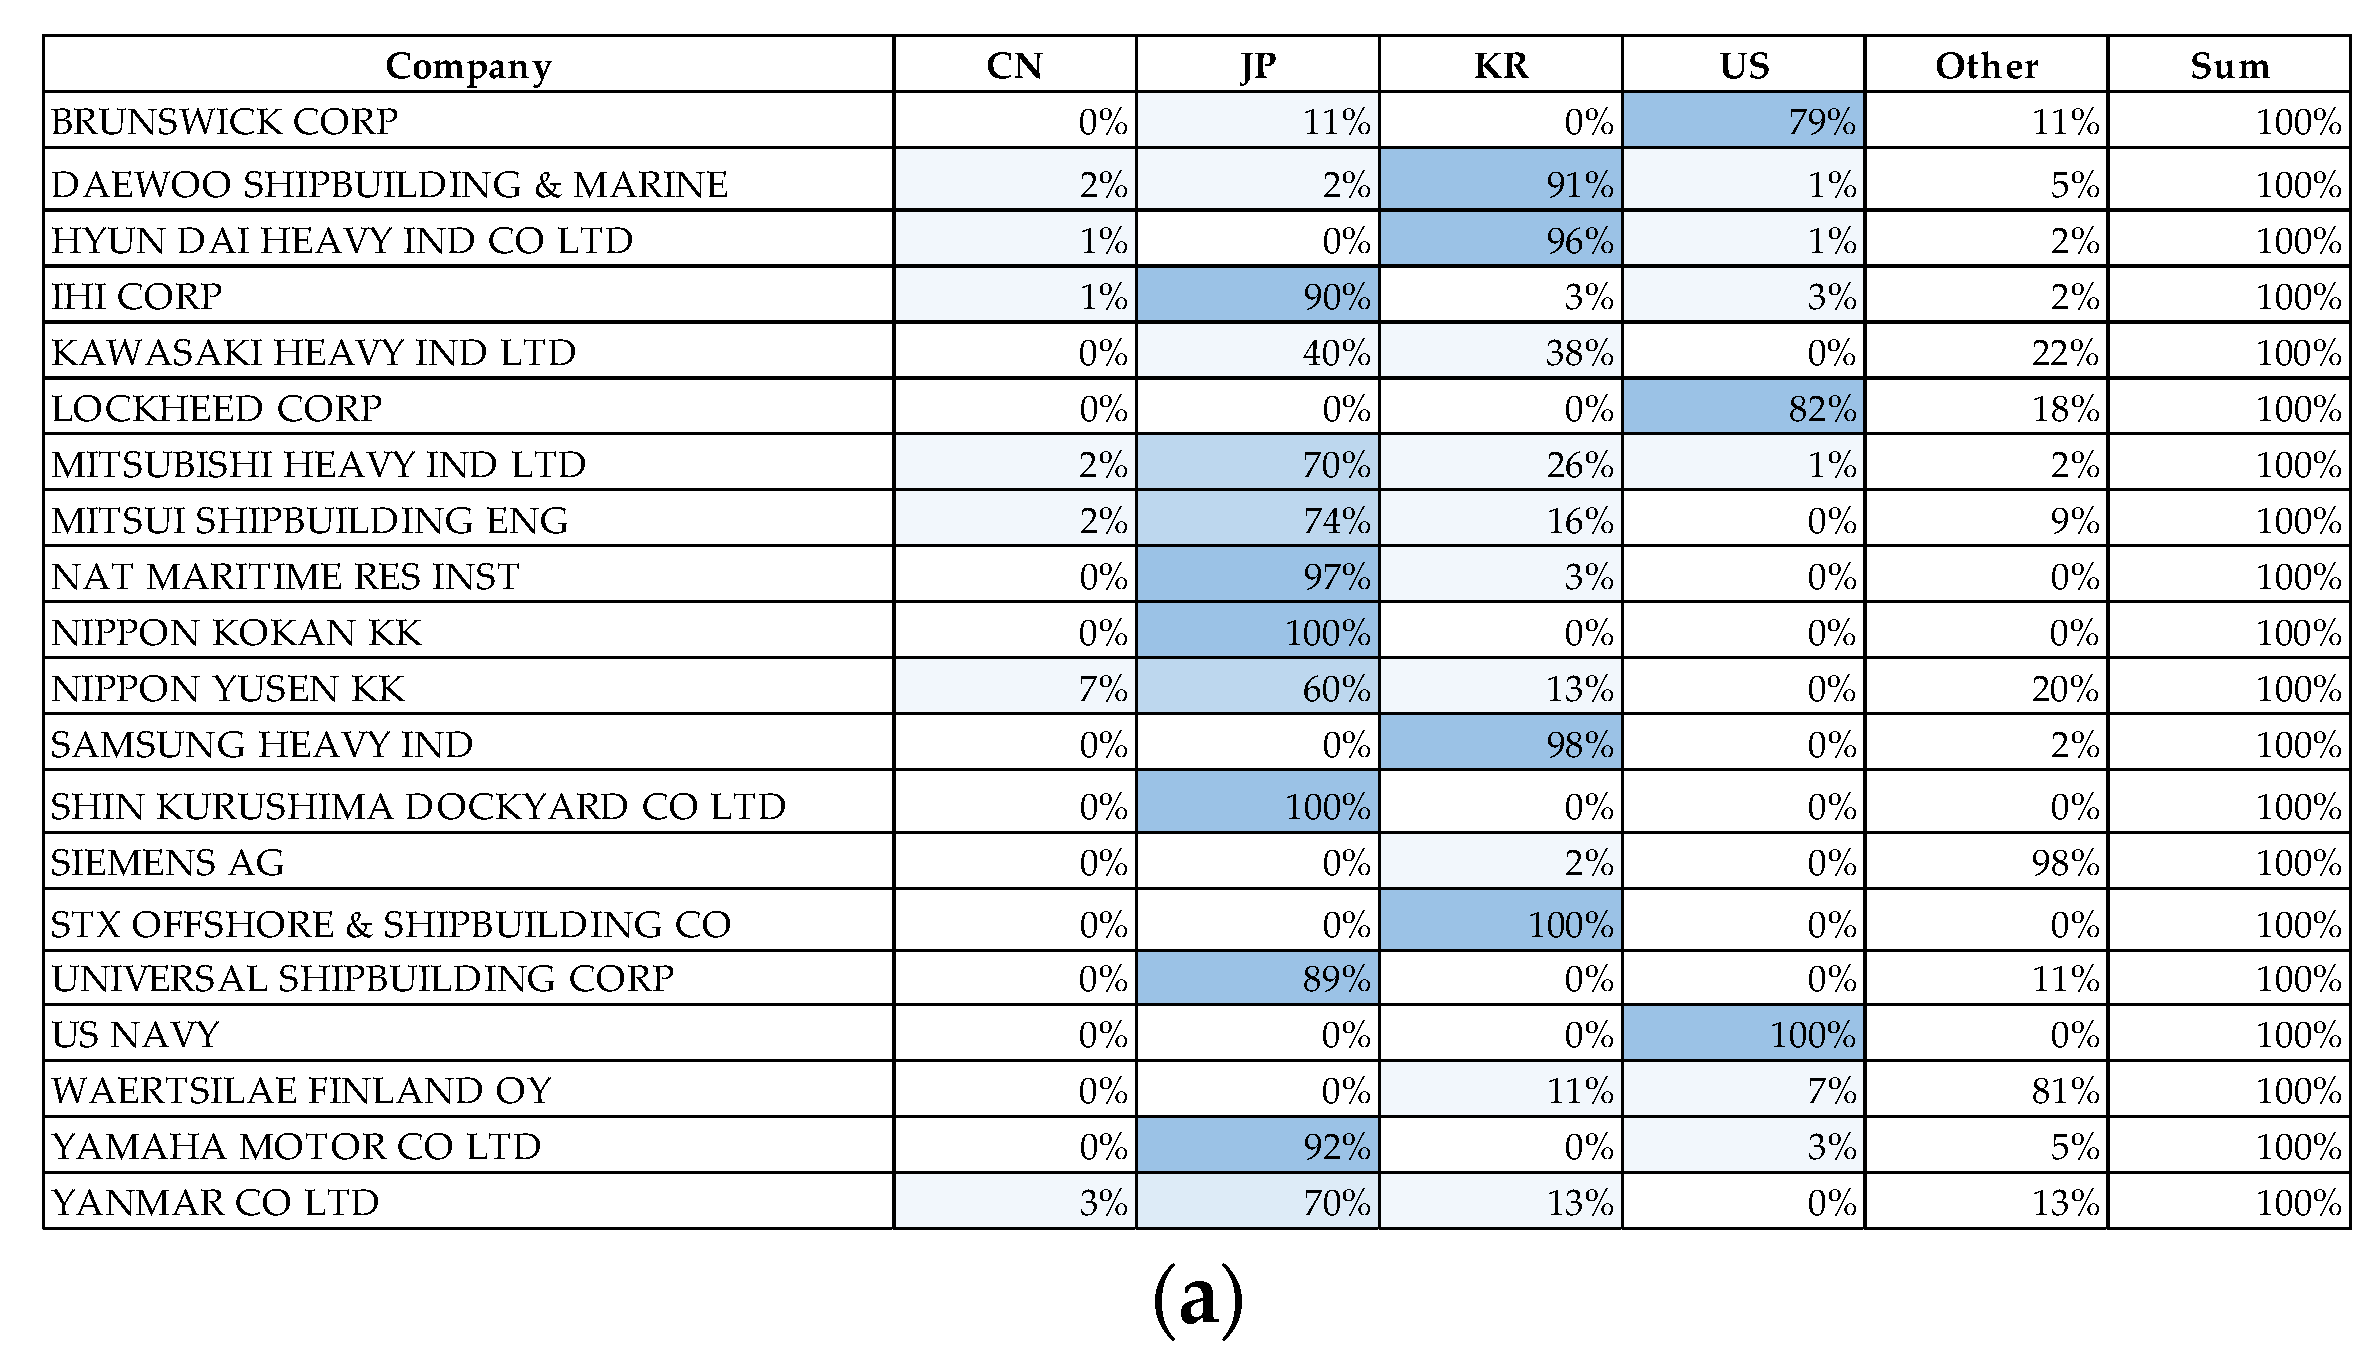
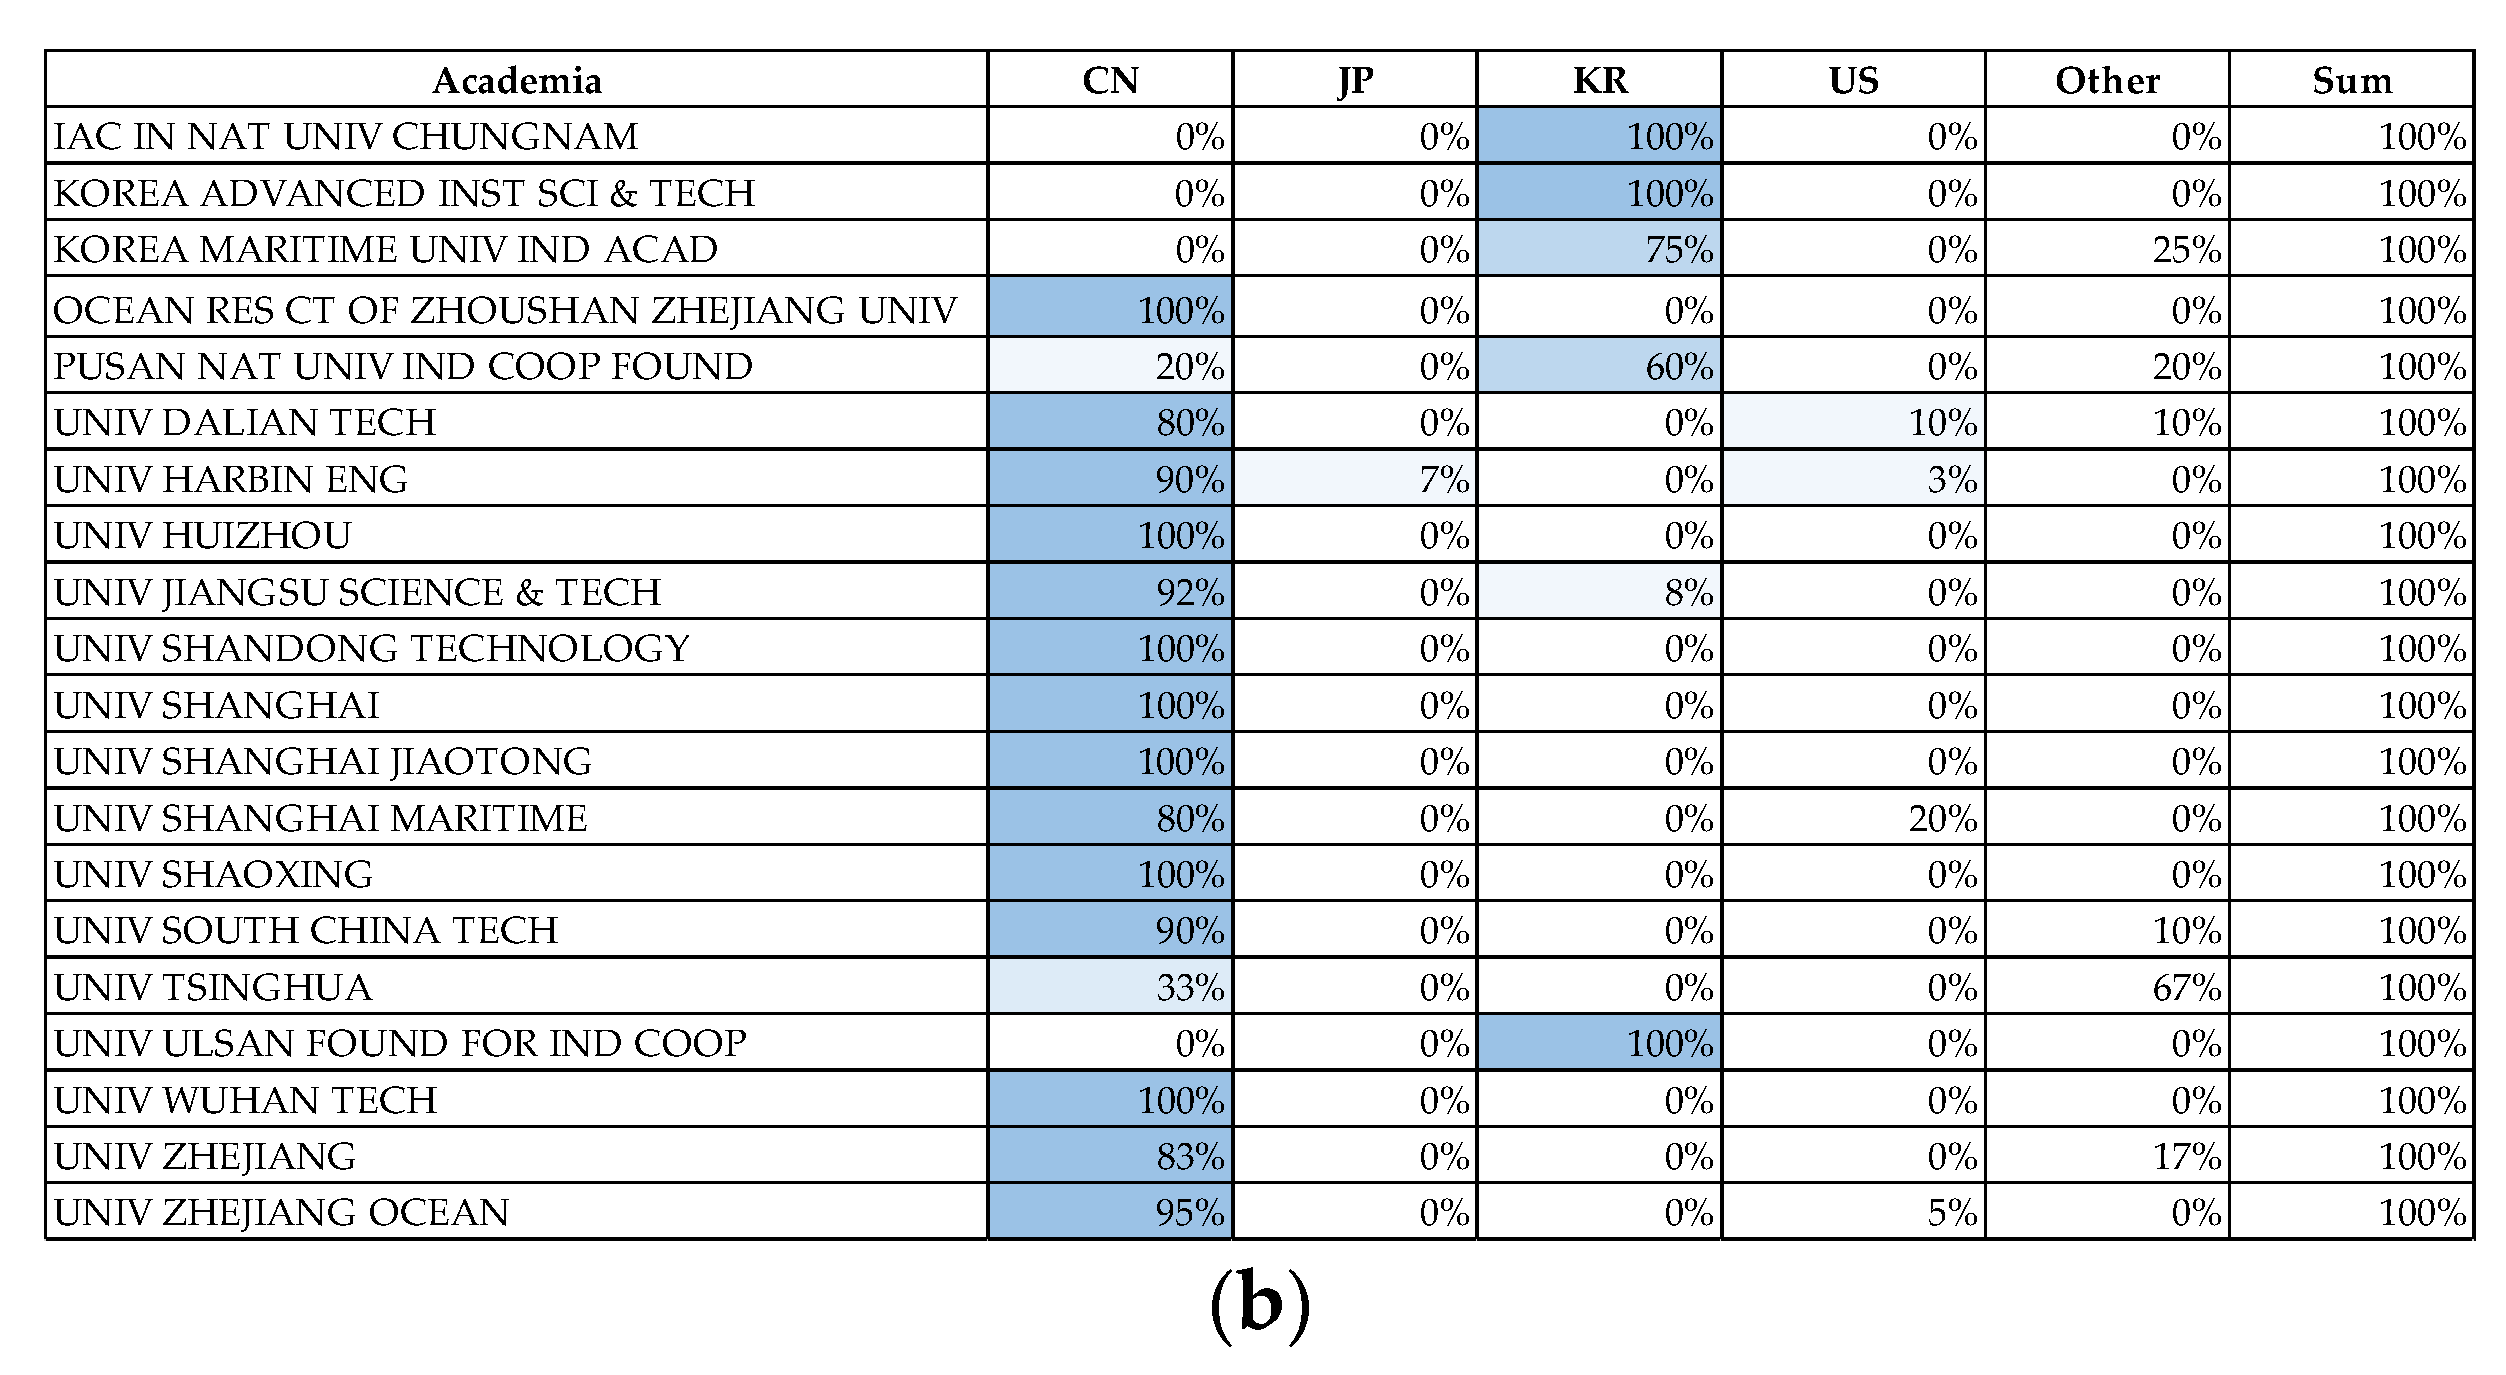
Among the companies, most patents are held by companies from South Korea and Japan. In those countries, the applicants are mainly companies operating in the shipbuilding industry. The three major knowledge centres filing patent applications in South Korea are the country’s major shipyards. In the four countries presented, the companies analysed in Figure 4a and Figure 5a filed 90.4% of the total number of their patents. The structure of the applicants in China is different from that in other Asian countries because patent applications are filed primarily by universities. This is confirmed by the percentages shown in Figure 5. This specific feature of the process of filing patent applications is unrelated to any sector of the economy and results from the academic policy in China. Whether a Chinese academic teacher is promoted or not depends to a large extent on the number of patent applications filed. This explains the large number of patent documents filed by universities, some of which are of compromised quality [81]. As a result, in spite of a high patent output, patent commercialisation is relatively low [107]. In the USA, the major applicants are enterprises, including multinational companies, as well as the US Navy.

4.2. Maritime Transport versus Other Transport Modes

The rate of growth of new technologies in the area of climate change mitigation varies across the modes of transport. The knowledge flows and relations of the maritime collection with different technology fields were assessed with reference to other transport modes (Table 3). Considering the fact that no reference values of the indices under analysis exist, the one and only reasonable way to conduct the analysis is to compare the results obtained for maritime transport with those obtained for other transport modes within the same time period and position in the patent hierarchy.
Climate change mitigation technologies related to road transport have the greatest number of patented inventions, followed by patents related to air transport, and maritime and waterway transport, respectively. Rail transport closes the list with the smallest number of patented inventions. Group Y02T90/00, where no specific mode of transport is indicated, is also relatively large, with its contribution to the mitigation of GHG emissions referred to as potential or indirect.
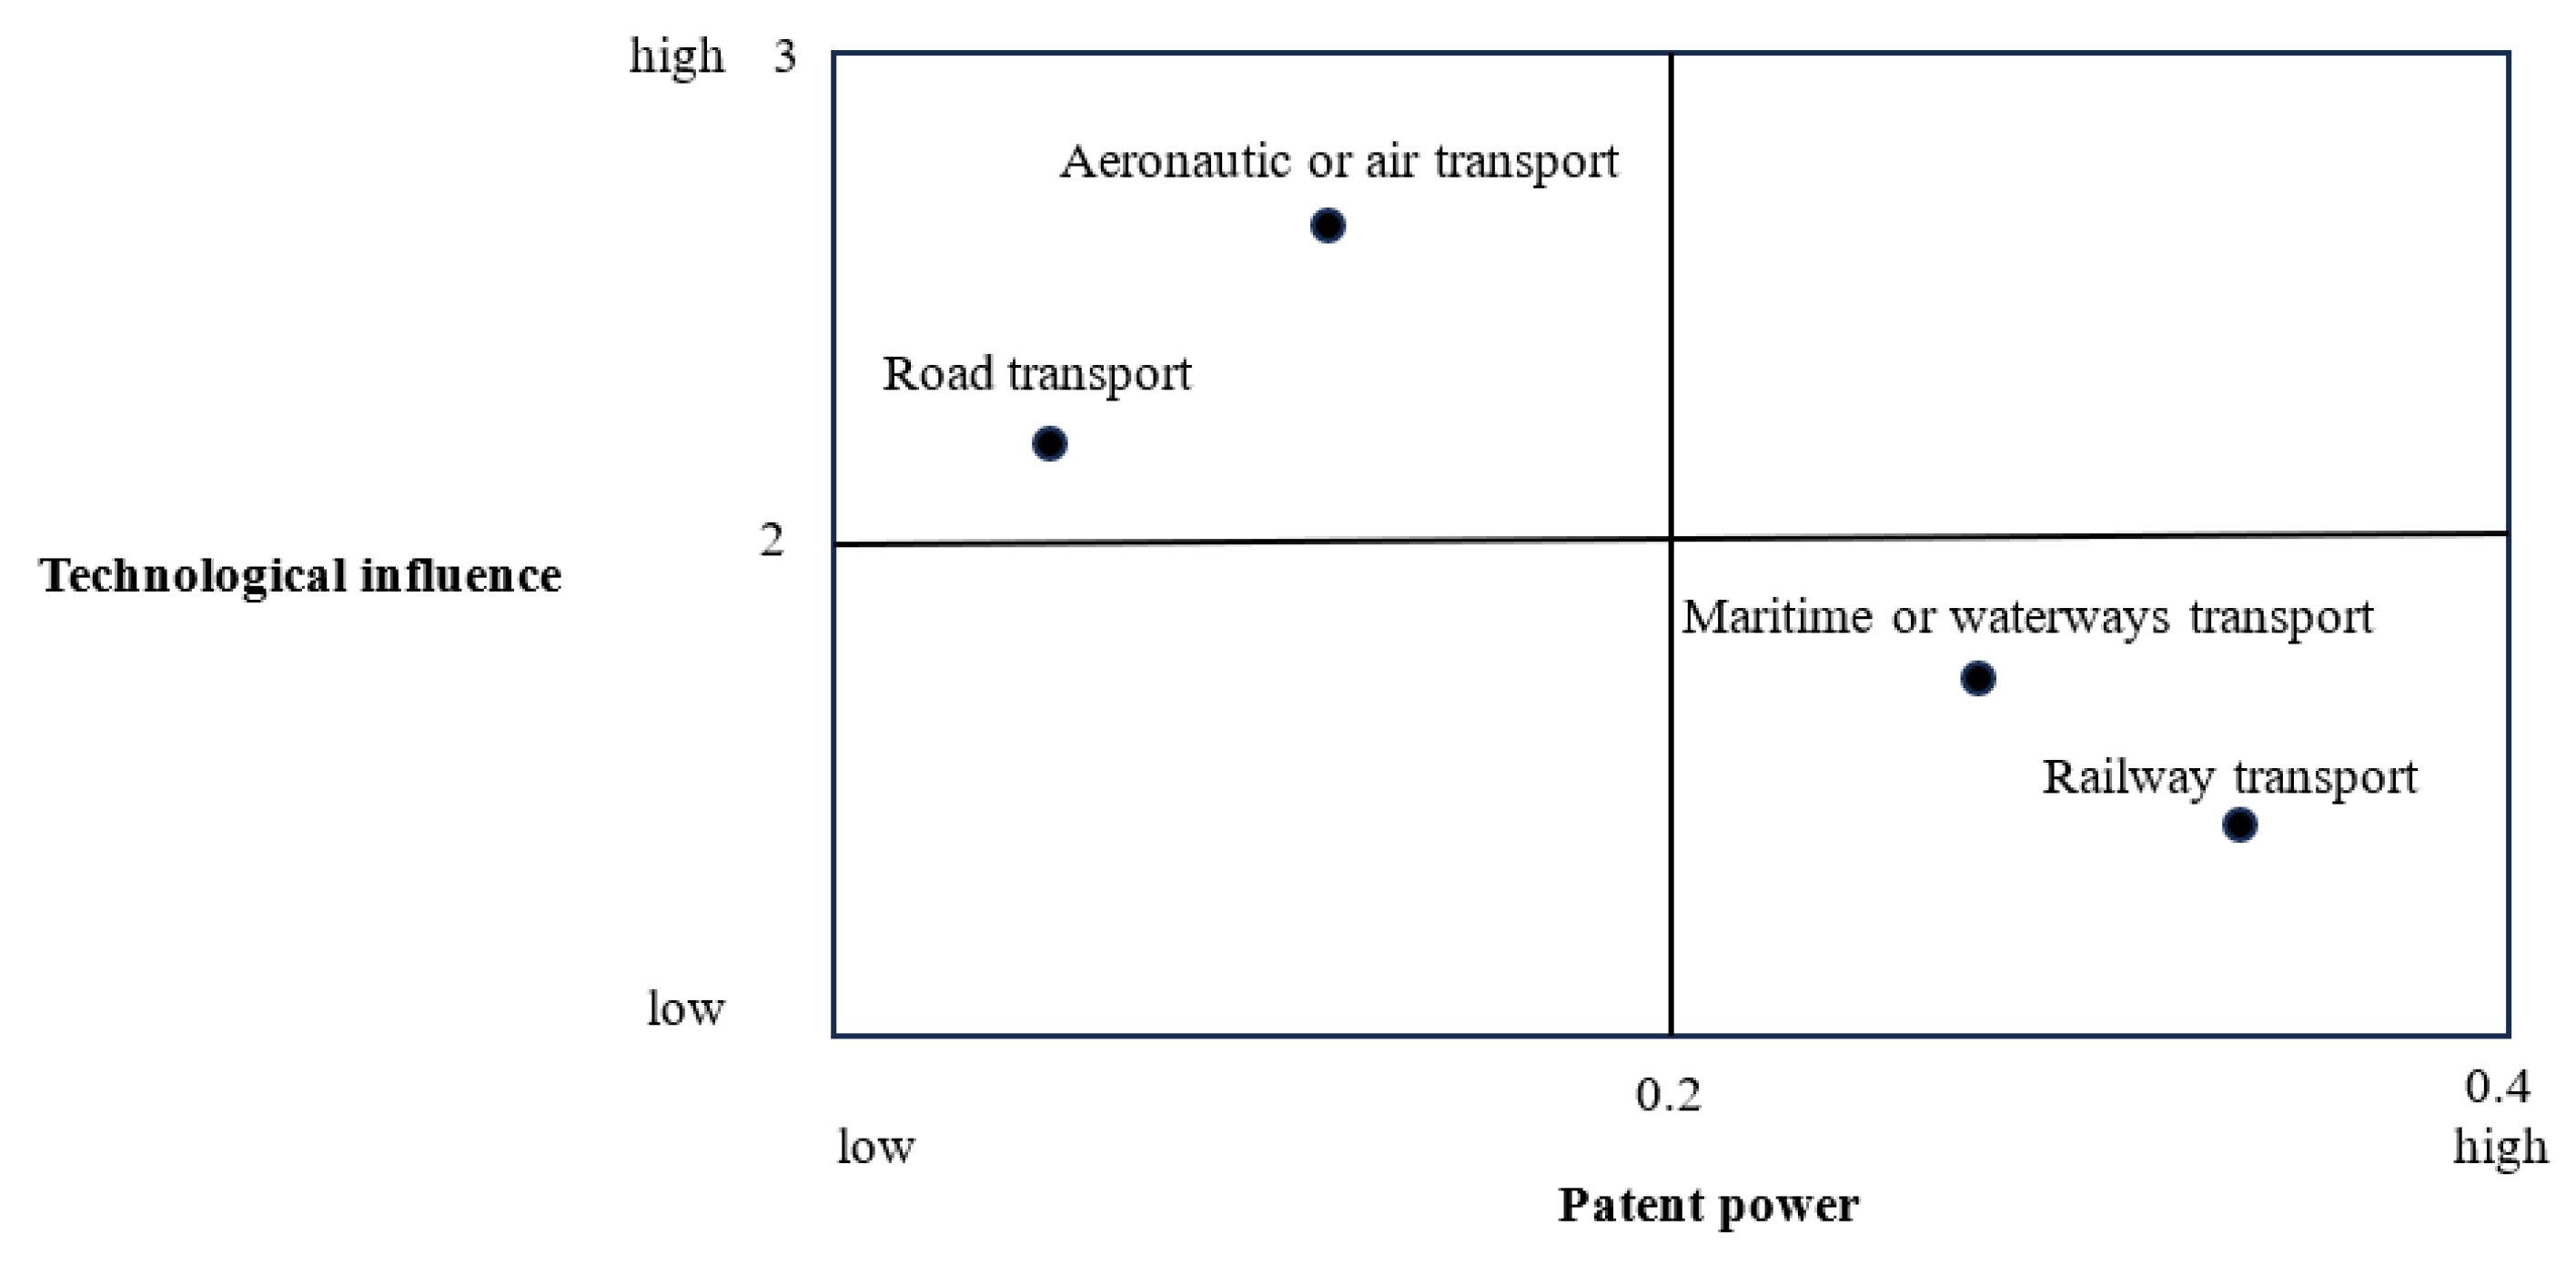
It follows from the analysis that patents in the area of air transport exert the strongest technological influence, measured by the number of forward citations per patent. On average, a single patent document in the collection is cited in 2.47 patent documents filed later. Patents in this mode of transport build on previously patented solutions to the greatest degree. Maritime transport is low on the forward citation index; however, it is placed second on the backward citations per patent index.
The results of the patent power analysis show the degree to which the patented solutions are used across different areas of technology. The best results are obtained for the rail and maritime transport, i.e., these modes of transport develop new solutions to a large degree based on knowledge from various technology areas. The worse results obtained for the road and air transport prove that the technological concepts assigned to them are more hermetic in nature compared to those proposed for other transport modes.
Two of the calculated indices, i.e., the technological influence (forward citations per patent) and the patent power, were used as dimensions, allowing for the drawing of a technical knowledge flow map shown in Figure 6.
The presentation of the results on a map makes it easy to identify which dimension of the technical knowledge flows, for a specific transport mode, should be higher to ensure a high knowledge flow both in time and across various technical fields. A wide use of achievements in other areas of technology supports further development of emerging technologies in maritime transport; however, there is little correlation between new and previously patented solutions. This may reveal little continuity of the research projects conducted, as well as an approach focused on seeking novelties rather than building on the previously patented solutions.

4.3. Technology Fields in Maritime Transport

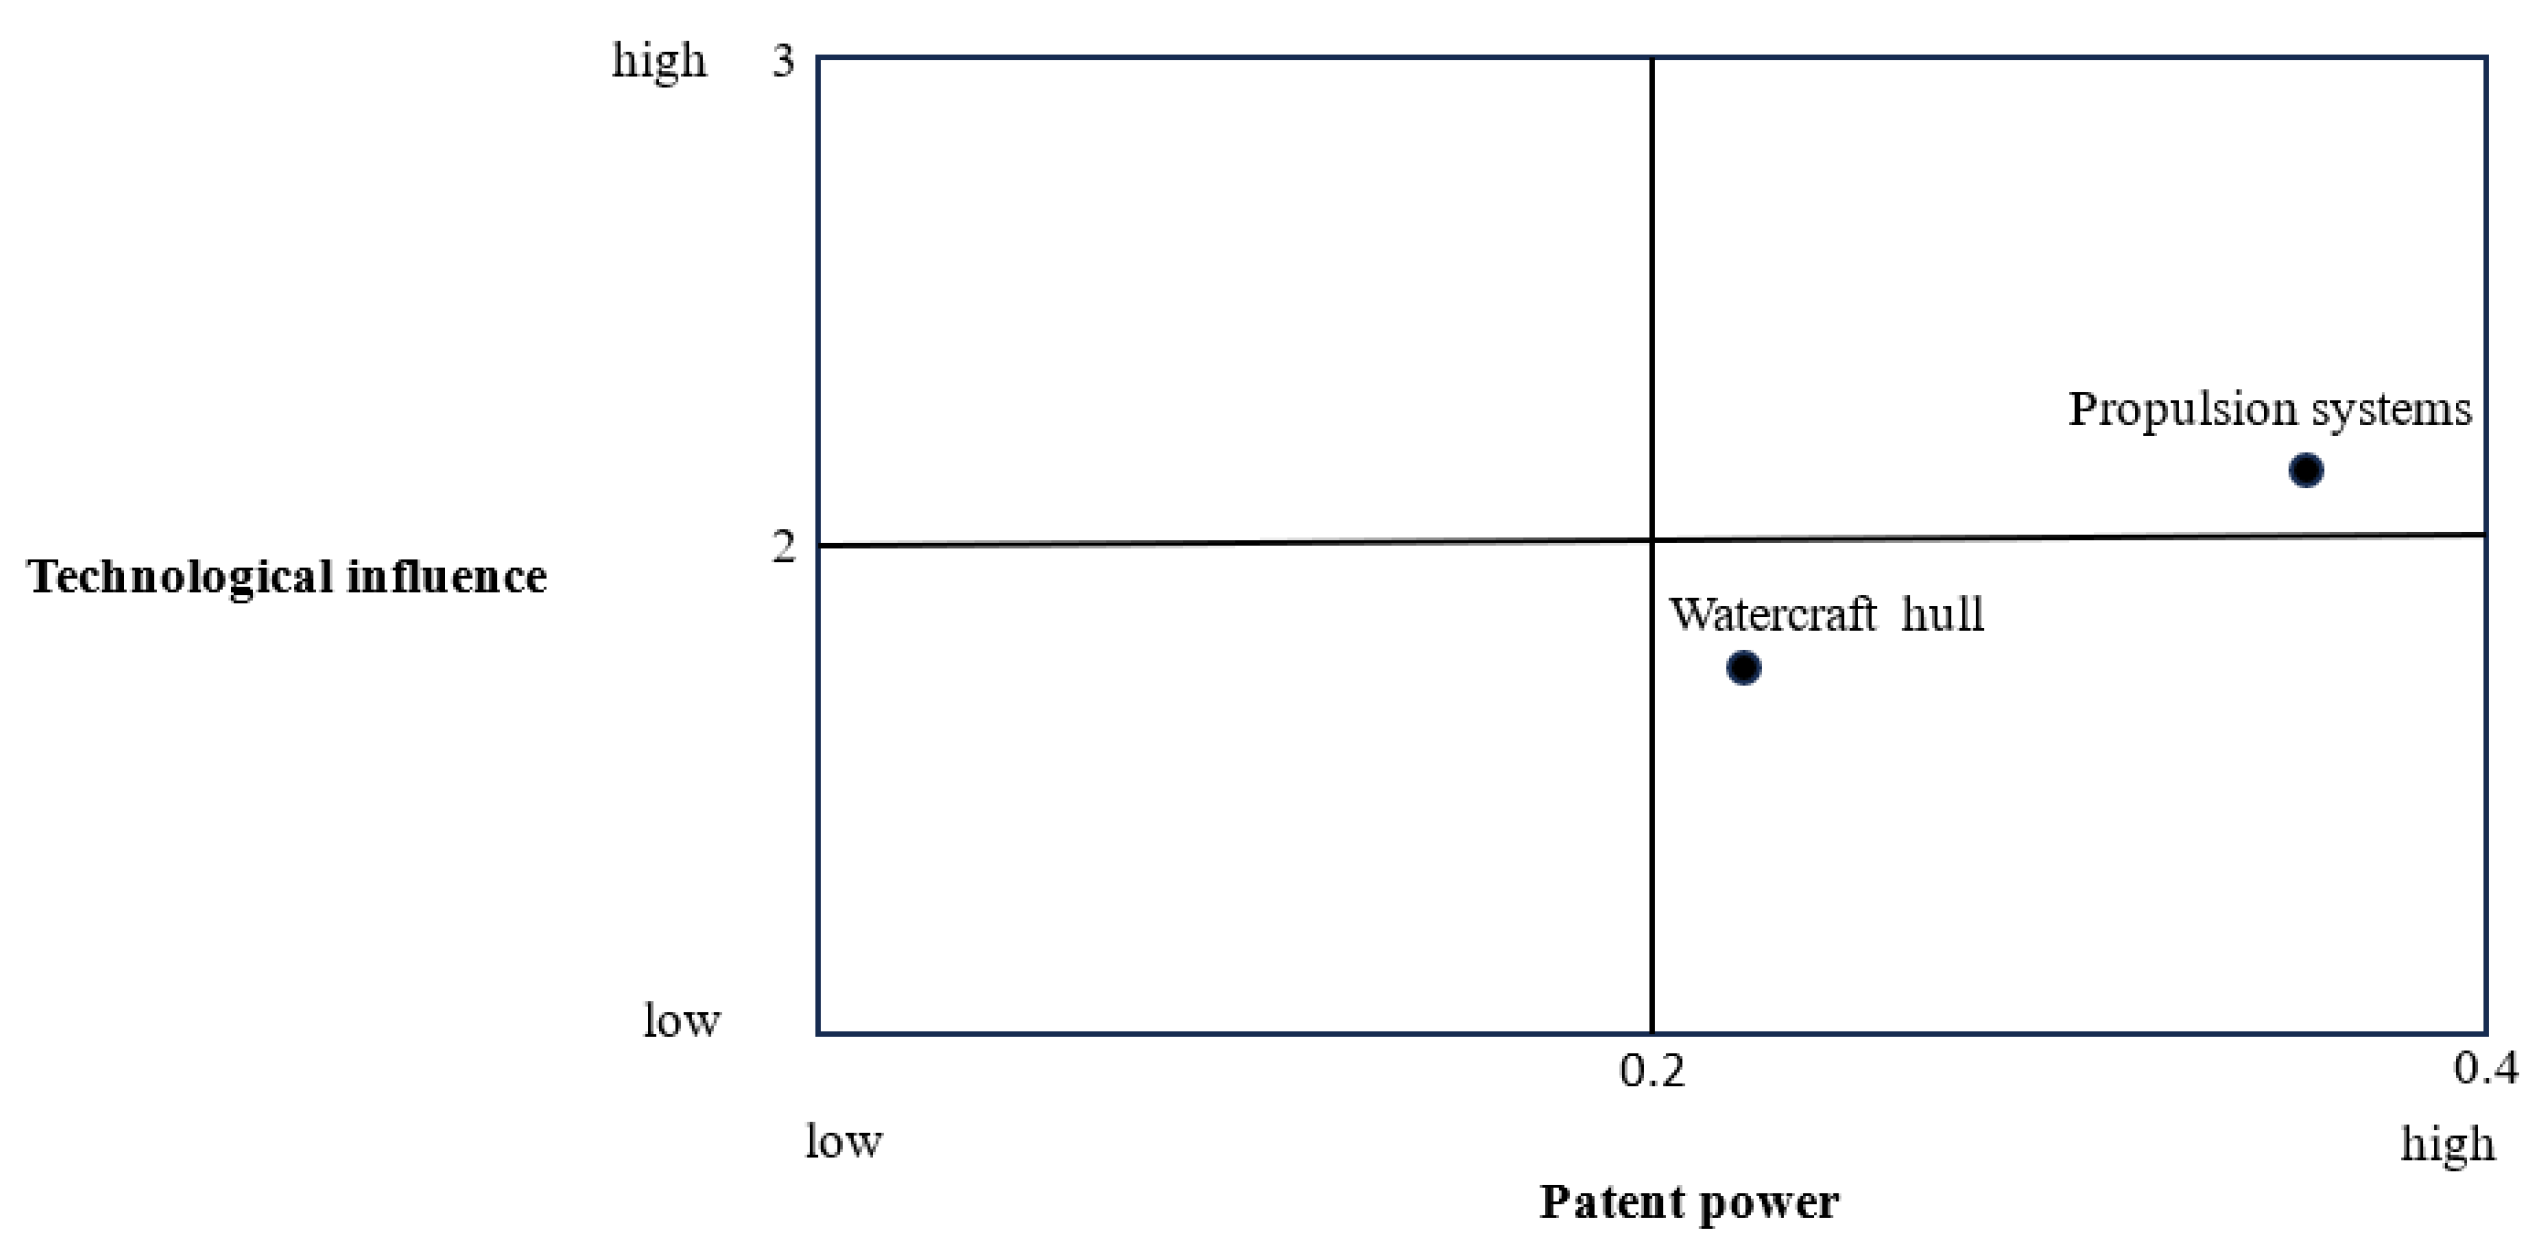
An analysis of the maritime collection broken down into subgroups reveals the areas of technology, which are developing exceptionally rapidly. The maritime collection is composed of six subgroups, two of which are the most numerous, with the number of patents at between two and three thousand. Detailed characteristics of the two subgroups are shown in Table 4. One of them includes solutions related to the design or construction of watercraft hulls, such as hull coatings, bow shape, materials for the construction of the hull, e.g., ultralight steels, composites, etc. The other one includes concepts related to propulsion systems, e.g., less carbon-intensive fuels (e.g., natural gas, biofuels), using solar generated electricity, using wind motor to generate electricity, etc. The solutions in this subgroup obtain the highest technological influence (both forward and backward citations) and patent power indices, which means that, compared to the other groups, they are built to a greater extent based on the technical knowledge available, are known to a greater number of scientists and are more strongly related to other fields of technology.
The innovative activity in the other four groups appears relatively low. Here is an overview of patents tagged with codes for these subgroups: Y02T70/10—measures at the maintenance or repair stage specially aiming at greenhouse gas emissions reduction (13 patents); Y02T70/30—technologies for a more efficient operation of the waterborne vessel not otherwise provided for, e.g., related to heating, course optimisation or others (40 patents); Y02T70/80—measures concerning recycling, retrofitting or dismantling of waterborne vessels (3 patents); Y02T70/90—port equipment or systems reducing GHG emissions (2 patents). In practice, this means that harbour or shipyard recycling facility managers cannot look to using game-changing inventions or new technical knowledge based on novelty concepts, and the climate change mitigation plans should be devised on the basis of the existing solutions.
The results of the technological influence and patent power analyses were utilised to construct a two-dimensional map of technical knowledge flows for climate change mitigation in maritime transport (see Figure 7). It follows from the map that the knowledge flows for propulsion systems are better than those for watercraft hull, both in time and across various technical fields.
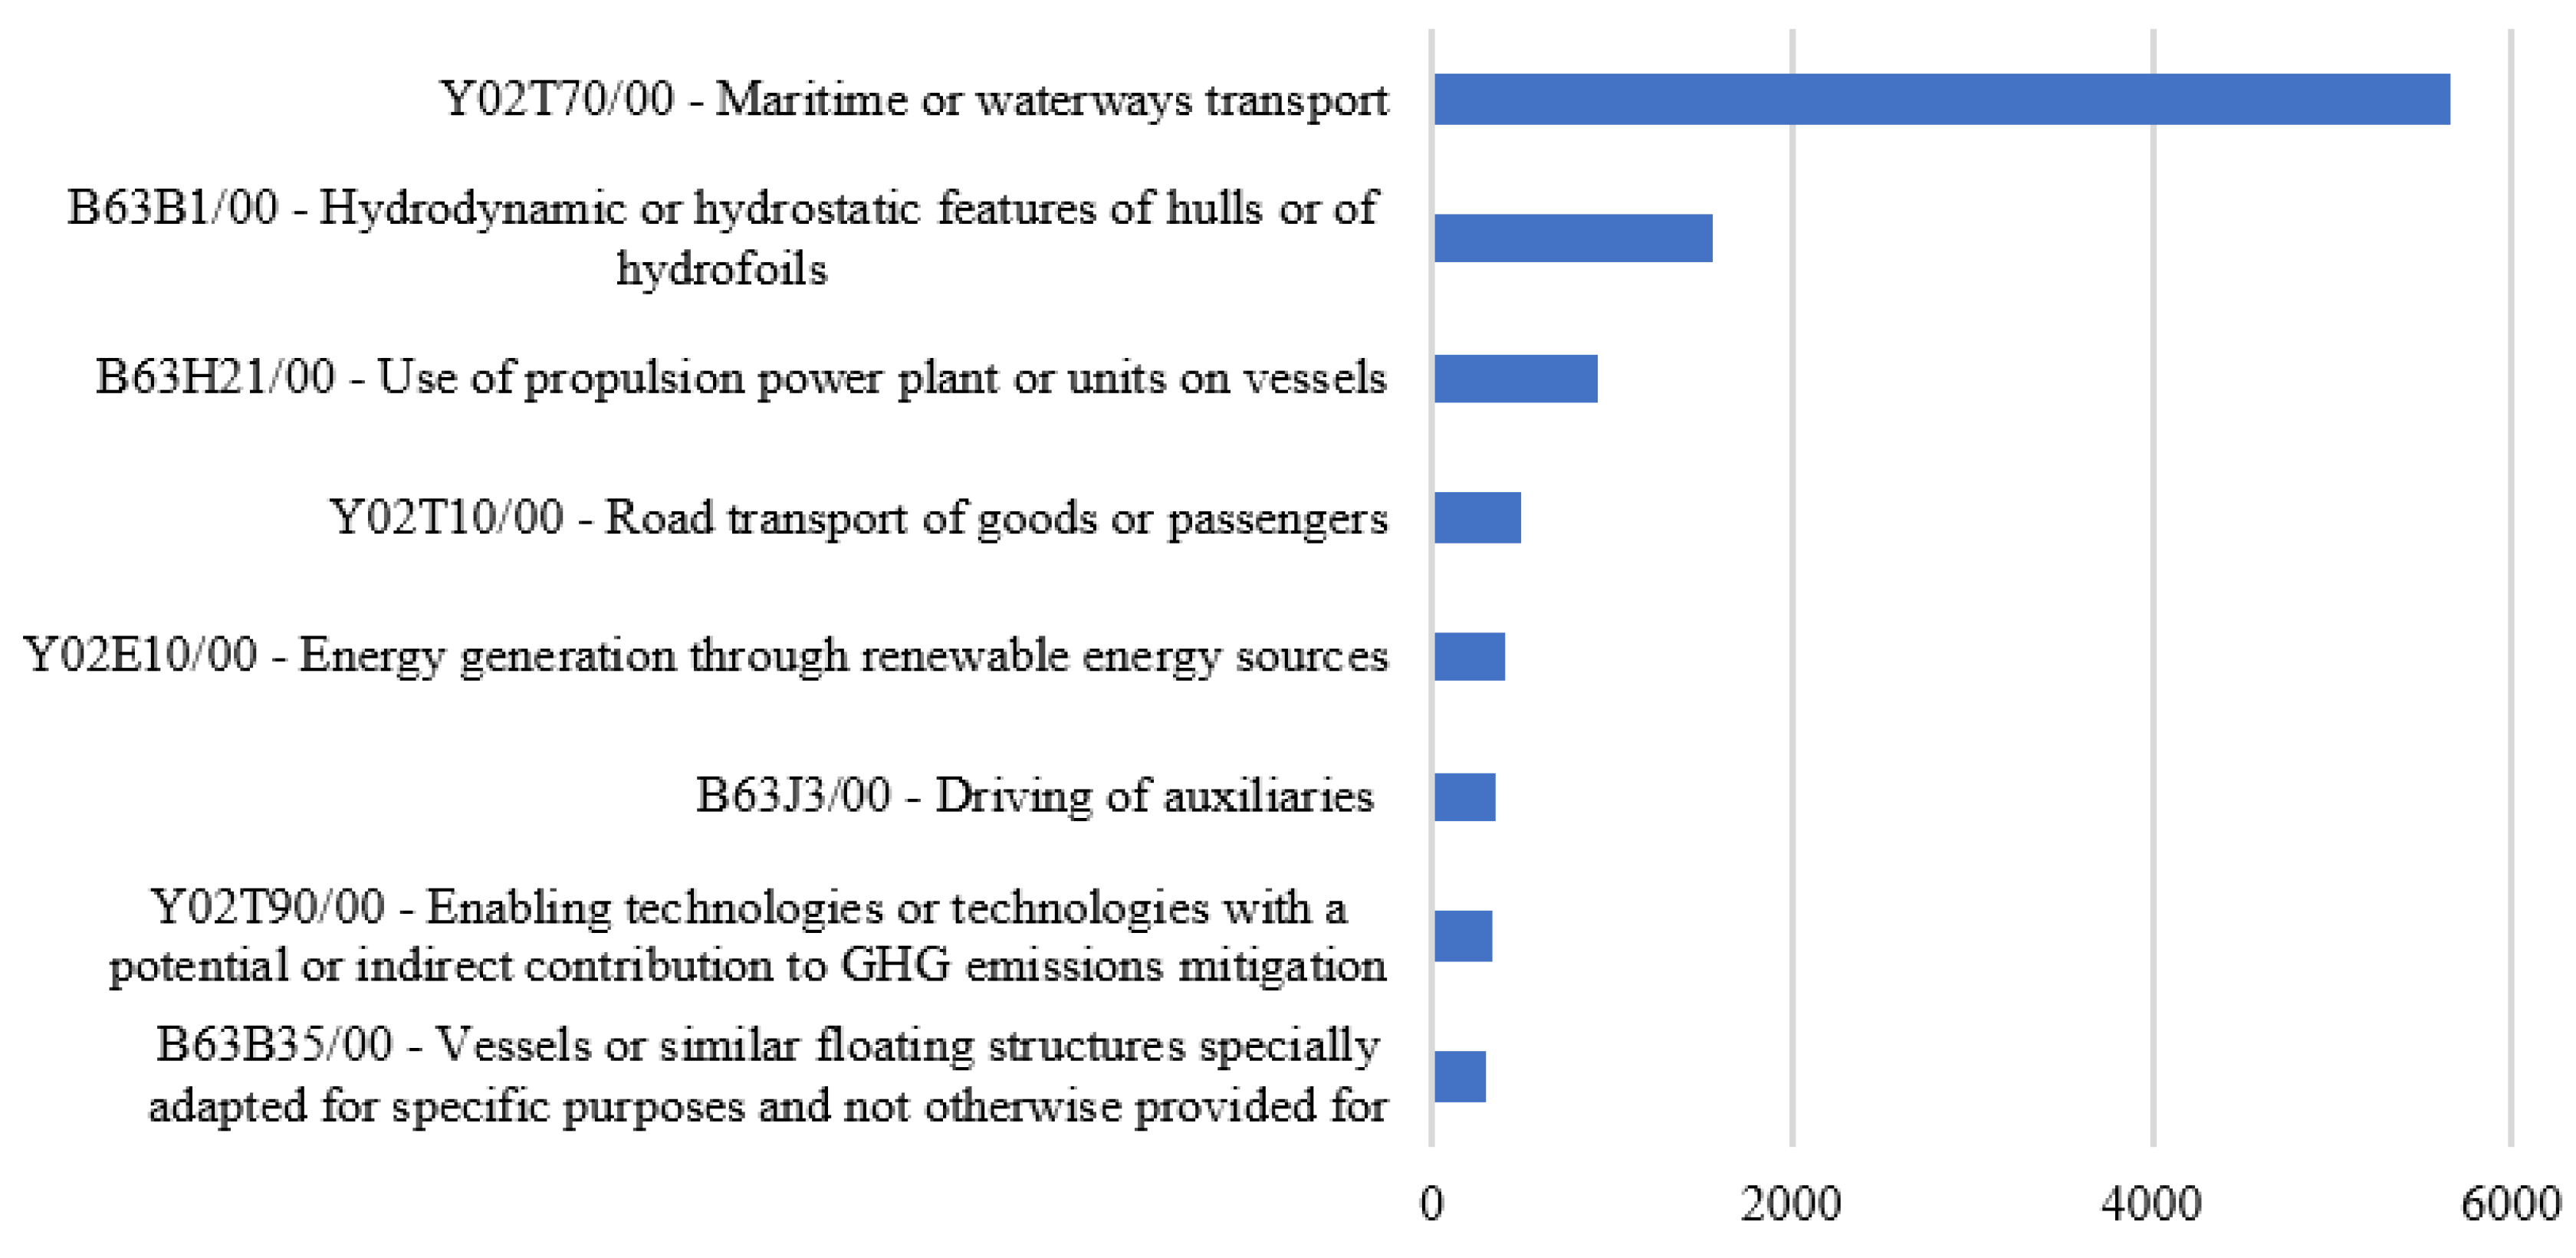
A further analysis of the relations between maritime technologies and other areas of technical knowledge is possible owing to the fact that the patent documents related to the area of climate change mitigation or adaptation are assigned to one of the Y02 subclasses, as well as being indexed in several other technical fields. A single document can have several or even a dozen or so classes assigned; therefore, each patent in the maritime collection can be related to other fields of technical knowledge. The most commonly used codes are shown in Figure 8. Code Y02T70/00 is used more frequently than any other code, as it is the code originally used to create the collection. The second and third most commonly used codes confirm the commitment to the development of innovations related to the design and construction of watercraft hulls and propulsion, as presented above in Table 3. Class B63, whose several subgroups are shown in Figure 8, covers ships or other waterborne vessels and related equipment.
Another interesting property of the maritime collection can be seen in Figure 8. Many patents tagged as solutions in the area of climate change mitigation in maritime transport are also indexed as solutions either for road transport, or as general solutions without the transport mode indicated, or solutions in the area of renewable energy sources. This means that new technical concepts in the area of climate change mitigation for future implementation in maritime transport may be originally developed for application in road transport or other sectors and vice versa.
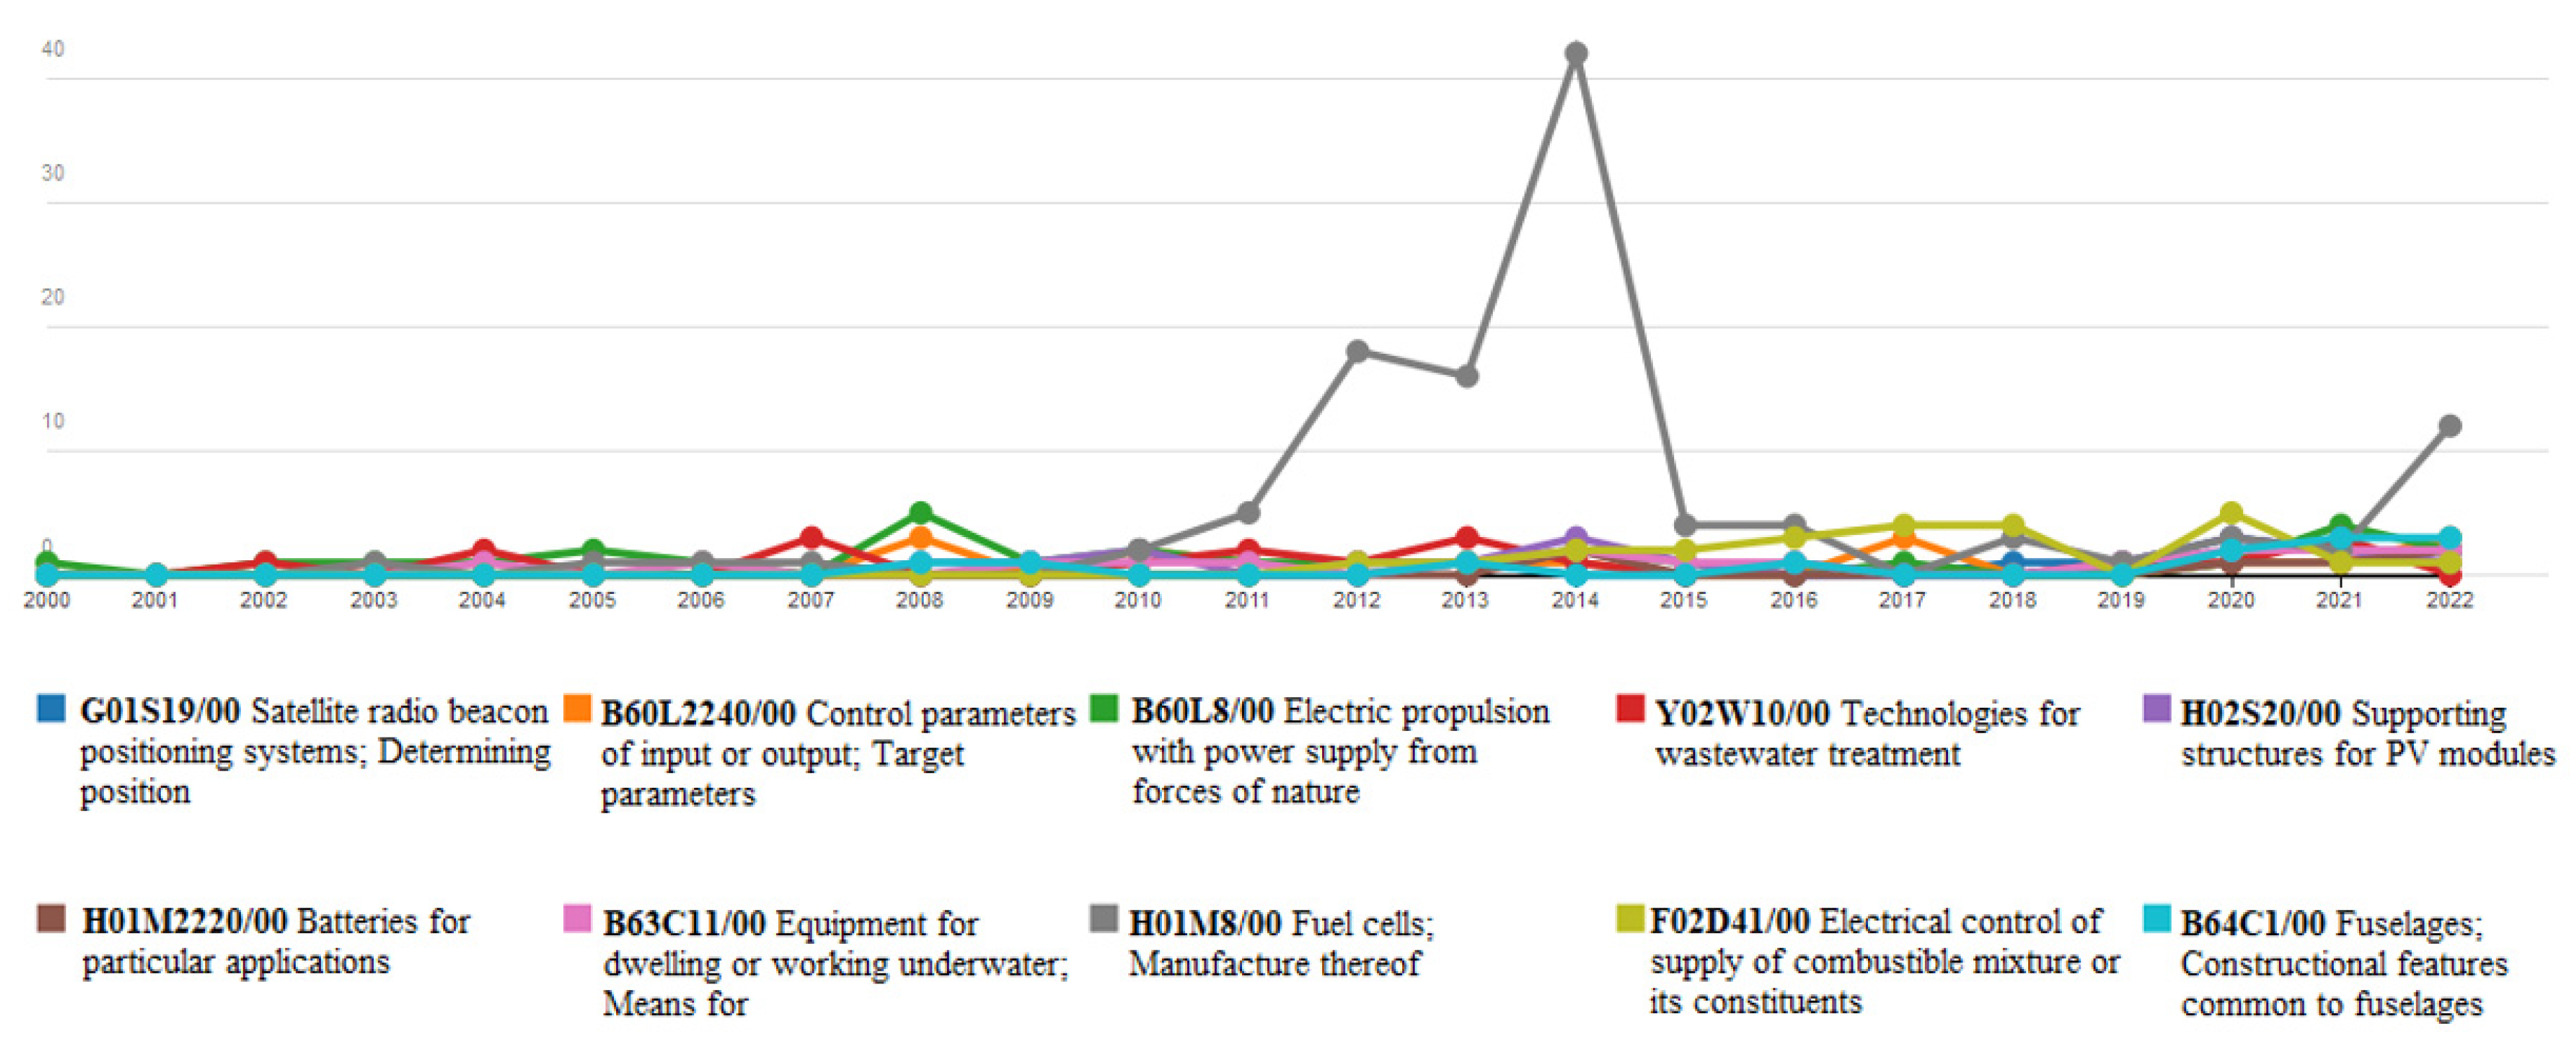
In order to assess the interest in the development of new technologies, it is necessary to analyse not only the number of patents but also the dynamics of changes in the patent activity. Codes showing an increase in patent activity for at least three succeeding years are plotted in Figure 9.
Starting from 2012, a rapid increase in the interest in the technological area of fuel cells can be observed. A large supply of new solutions in this area continues for several years only to drop dramatically, but it still holds a leading position among the areas undergoing quick development. The data for 2022 again show an above average increase in the interest in this type of propulsion. In a general overview, as many as five out of all the groups shown in Figure 9 are dedicated to electrical issues, three of which fall into Electricity, without indication of the industry in which the solution can be applied (section H). Two of them belong to the group of Electrical processes or means (e.g., batteries) for the direct conversion of chemical energy into electrical energy; one is related to PV modules. The last two fall into the area of Propulsion of electrically propelled vehicles (B60L). This means that the most continuous research into climate change mitigation in maritime transport is focused on electrical propulsion. Despite ongoing research, battery/hybrid vessels in the world shipyards’ orderbook only account for 0.80% of gross tonnage [108]. The codes indicated in Figure 9 are interesting candidates for further observation. It is worth noting here that climate change mitigation is also important in areas typically related to navigation, such as radio navigation.
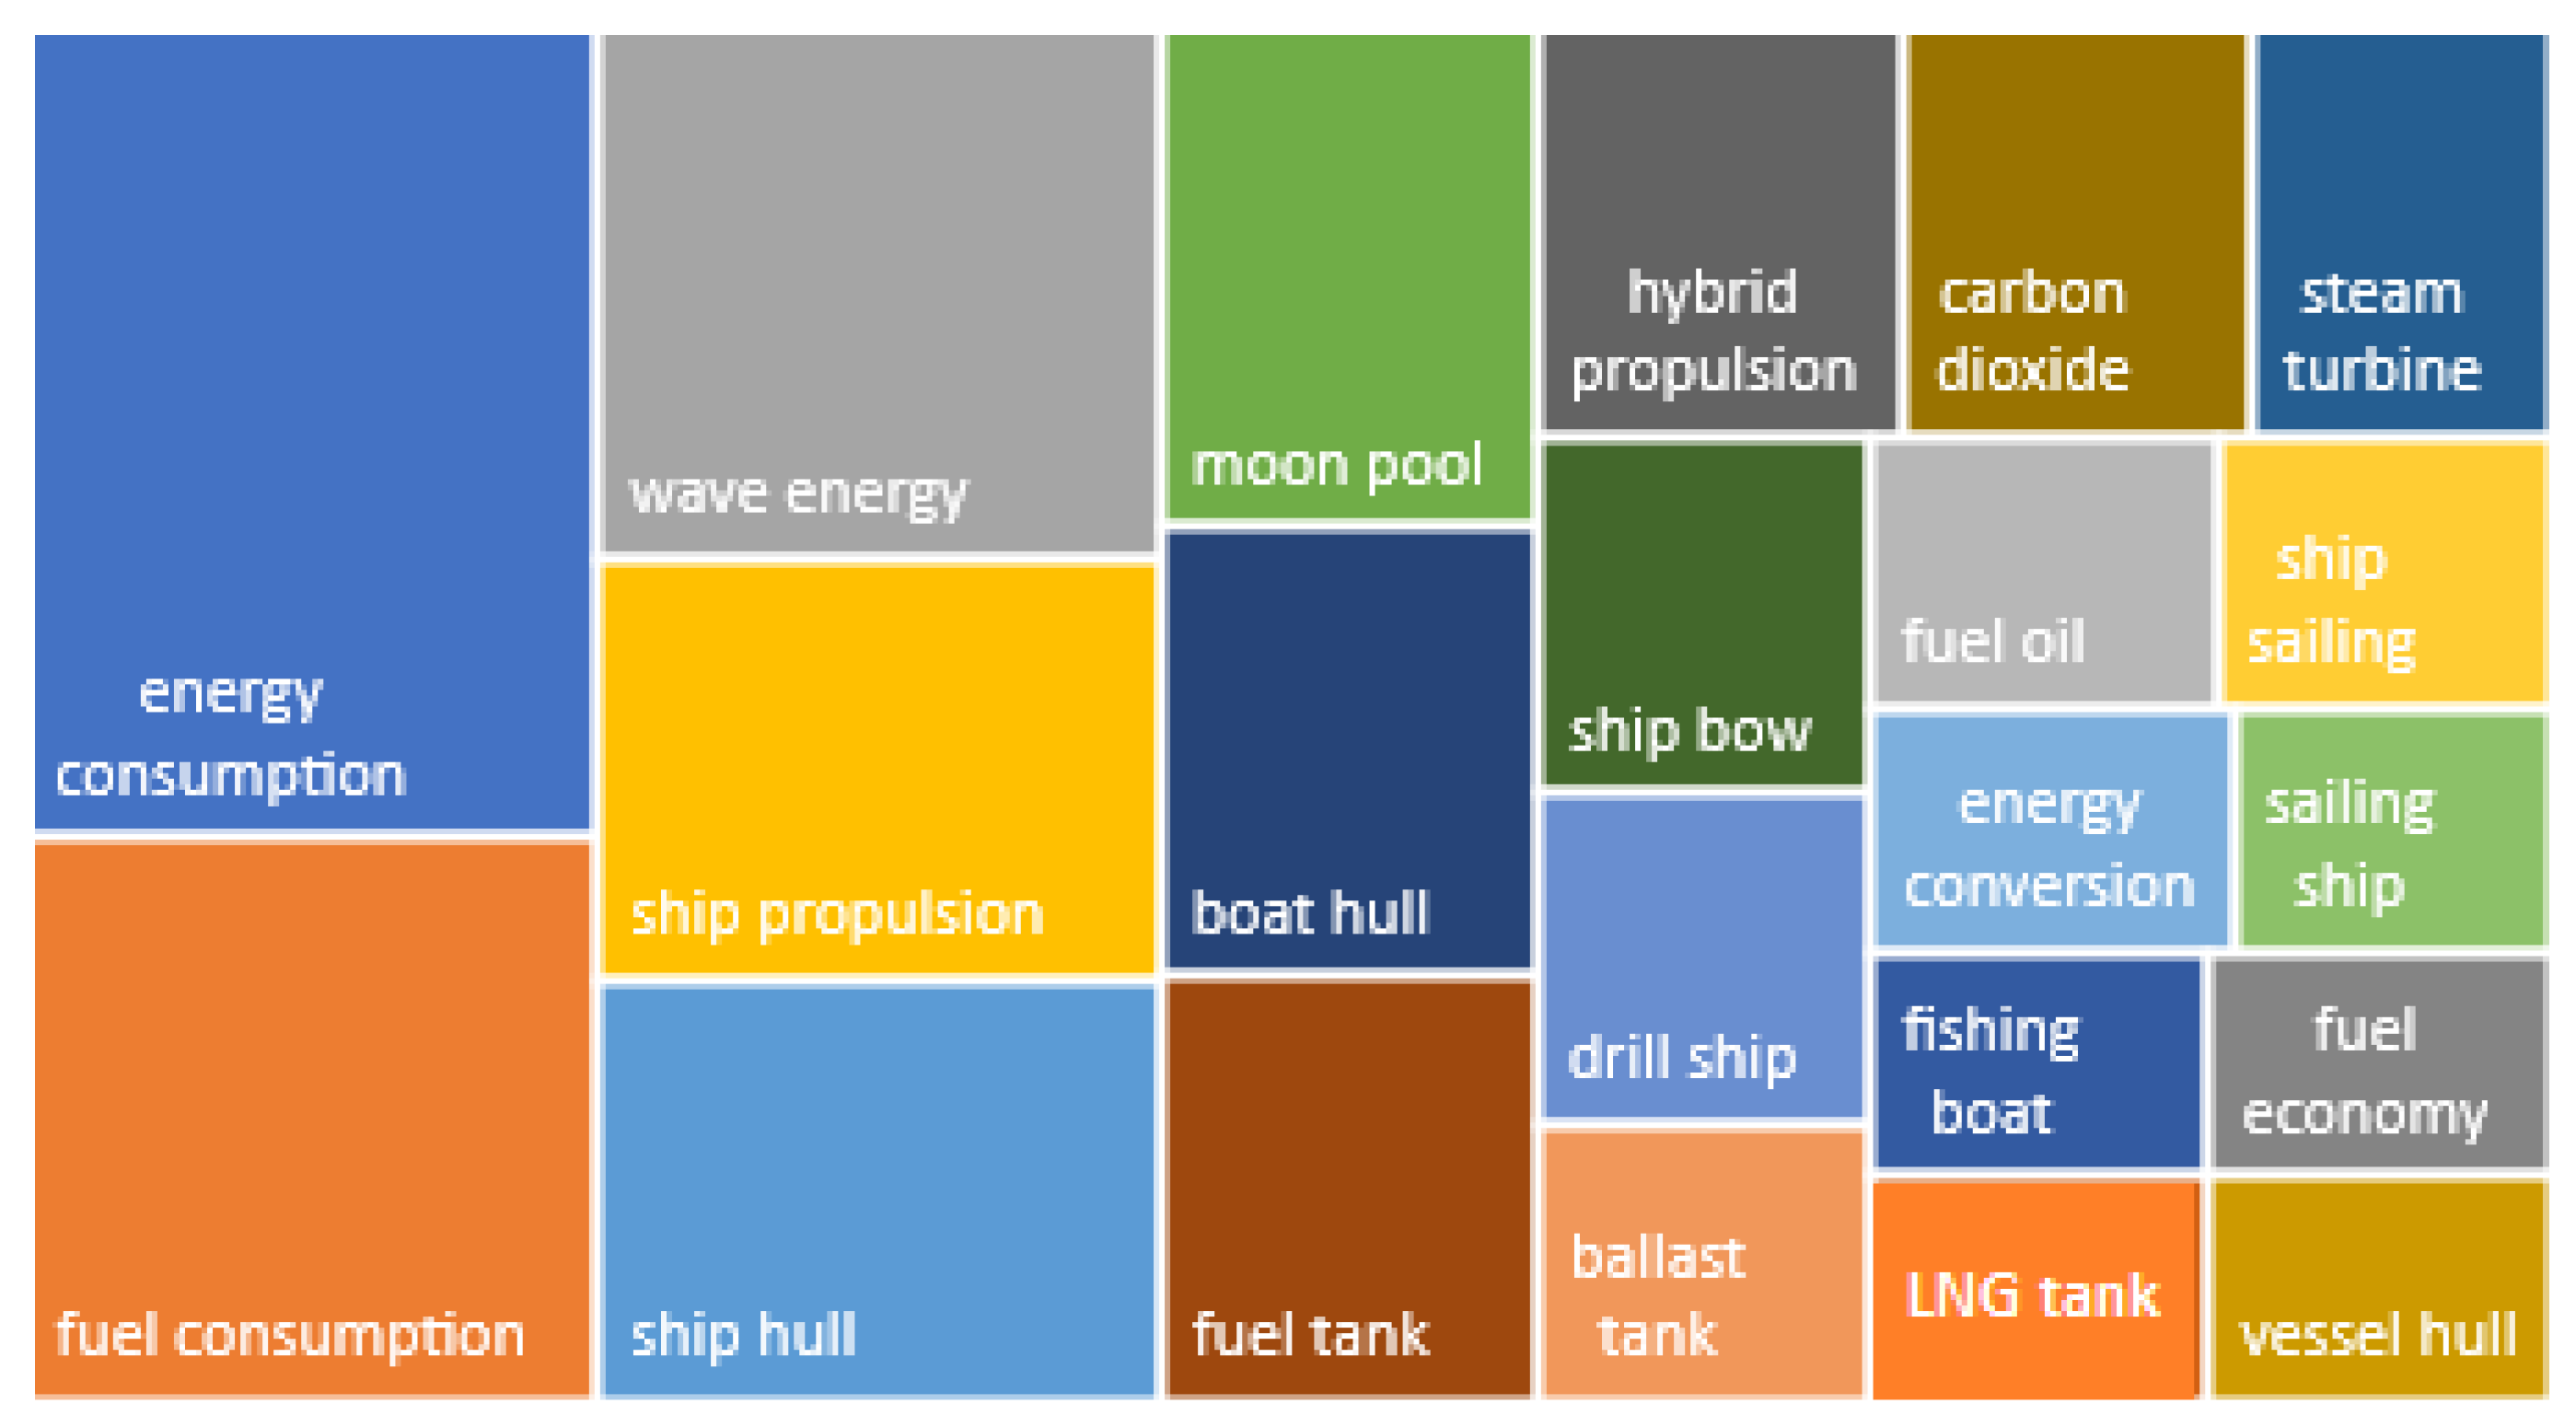
The assessment of the maritime collection undertaken in this paper can be completed with the content analysis of patent titles and abstracts. An overview of the core content of the patents gives an insight into the problems they solve. This analysis is limited to English language patents. Figure 10 shows twenty most frequently repeated noun groups.
The results of the analysis contain phrases, which could have been expected to be found there: noun groups referring to energy efficiency (e.g., energy consumption, fuel consumption, fuel economy) and the ship’s structure (e.g., fuel tank, boat hull). At the same time, the analysis points to some new properties, which were not revealed in the analysis of the patent codes. Phrases related to the area of offshore operations (e.g., moon pool, drill ship) suggest that intensified research and development work is being conducted on solutions in the area of climate change mitigation not only with reference to merchant ships but also offshore ships and structures. The most common noun group describing alternative zero-emission energy sources is “wave energy”. It received a lot of attention from inventors, which makes it possible to predict that capturing wave energy and using it for ship engine boosting may be a solution, which will go beyond the experimental phase.

5. Limitations and Future Research

The limitation of the study results from the tool used, i.e., patent analysis. The study covers the phase of creating and filing new solutions with patent offices, and it does not discuss further use of the concepts in business practice. Patent analysis does not provide for examining the applicability or scale of implementation of the inventions. The limitation of the use of patent data is that it does not take into account companies, which do not engage in the development of new technologies and do not seek patent protection but intensively apply and adapt existing technological solutions to their needs.
Regardless of this limitation, patent analysis is a versatile cognitive tool, which, when applied to the new CPC-Y02T70 group, gives an insight into the inventive activity in the area of climate change mitigation in the maritime sector. Building knowledge on patent information can help universities, research institutions, shipyards, manufacturers of marine equipment and other business entities stay updated on the status quo of technology development and conduct research into areas of the greatest potential for further progress on the one hand and engage in business activity utilising the latest solutions—which may still not have been introduced on the market—on the other. The research discussed in this paper will be continued, with a special focus on further verification of the dependencies between the increasingly stringent GHG emission regulations and the inventive activity.

6. Conclusions

Climate change mitigation is one of the most important challenges facing the modern world. Measures undertaken by the shipping industry within the scope of, inter alia, climate-friendly practices, tools and investments can largely contribute to reducing the GHG emissions. The search for ground-breaking innovations—which can provide shipowners with the competitive edge on the shipping market and help them comply with the regulations implemented at present or forecast for the future in the area of GHG reduction in regional and global shipping—is in progress.
The study presented herein leads to answers to the formulated research questions. In response to RQ1, the countries and knowledge centres holding the world leading position in the area of climate change mitigation technologies related to maritime or waterway transport were identified. It was shown that the knowledge centres located in China, the USA, South Korea and Japan are absolute leaders in this respect. In recent years, the ranking of inventive activity has experienced a significant shift to the advantage of China. Interestingly, two models of the degree of dispersion of inventive activity were identified. A highly dispersed model, with a great number of entities filing patent applications, is represented by China and the USA. A concentrated model, with several large knowledge centres, is observed in Republic of Korea and Japan.
The second research question (RQ2) inquired whether the inventive activity in the area of climate change mitigation in maritime transport is as intensified as it is in other transport modes. In order to find an answer, two indices—technological influence and patent power—were calculated and then used to construct a two-dimensional map of technical knowledge flows for climate change mitigation in transport. The results showed that the technological influence in maritime transport is lower than that in air or road transport, i.e., the flow of knowledge over time is less continuous. However, the development of new technologies aimed at climate change mitigation in maritime transport has a stronger association with technologies across various fields as compared to air or road transport. The proposed map clearly depicts theses dependencies. Considering further development of emerging technologies, the maritime transport has some advantage over other transport modes, consisting of a wide use of achievements in other fields of technology; however, new inventions do not build on previously patented solutions. This may point to little continuity in the research projects conducted, as well as an approach aimed at seeking novelties rather than improving the existing solutions.
Finally, RQ3 inquires about the areas of technical knowledge in the field of climate change mitigation technologies related to maritime or waterway transport, which are the primary focus of development. In order to answer this question, the maritime collection of patents was analysed in several cross-sections. The most numerous subgroups of patents turn out to be the design and construction of watercraft hulls (1) and measures to reduce greenhouse gas emissions related to the propulsion system (2). The former includes a larger number of patents, whereas the latter is characterised by more intensive knowledge flows both in time and across various technical fields. The choice of an alternative propulsion is a topic, which raises a lot of controversies in the shipping business community. Inventions in this technical field are characterised by a greater continuity of solutions under development and openness to other subdisciplines of knowledge, which may speed up the development process and reach the phase of technological readiness of the invention compared to inventions in the area of design and construction of watercraft hulls.
The research shows that technical solutions assigned to maritime transport are also tagged with road transport (Y02T10/00) and with processes of energy generation through renewable energy sources (Y02E19). This information is valuable to shipyard managers and suppliers of marine equipment, who, looking for disruptive technologies, should take a wide view over the available technologies, also including the areas of road transport and renewable energy sources. This observation can also be a valuable guideline for entities in the automotive and energy sectors to expand cooperation with the maritime industry.
Among the technologies, whose further development merits close attention, are solutions related to electrical propulsion. The growth in patent activity for codes dedicated to electric issues, i.e., fuel cells (H01M8), batteries (H01M2220), electrically propelled vehicles (B60L), is significant. Moreover, the knowledge centres should consider allocating greater efforts and investments into the development of technologies using wave energy.
It follows from the analysis of the subgroups in the maritime collection (Y02T70) that certain areas of the maritime industry are underdeveloped and require significantly more attention on the part of inventors. These are primarily sea ports. There is an enormous gap between the number of patents in the two most numerous subgroups and the subgroup of sea ports. This is best illustrated with figures: there are more than 3000 patent documents related to the most commonly undertaken research into the design and construction of watercraft hulls and as many as 2 patent documents dealing with port equipment or systems reducing GHG emissions. The inventive activity in the area of climate change adaptation dedicated to ports is insignificant and definitely needs more support on the part of the community of scientists and inventors. Obviously, considering the specific character of port operations, which combines various modes of transport, ports use technological solutions created for and operated with the means of transport used in them; nevertheless, an intensified development of inventions dedicated to port processes and suited to the specific nature of port operations is necessary.

Funding

This research was funded by the Maritime University of Szczecin, the research project no. 1/S/WIET/PUBL/2023, from a subsidy of the Ministry of Education and Science in Poland.

Data Availability Statement

Data available on request.

Conflicts of Interest

The authors declare no conflict of interest.

References

  1. European Commission. The European Green Deal COM/2019/640 Final; European Commission: Brussels, Belgium, 2019; Volume 53, p. 24. [Google Scholar]
  2. U.S. Department of State. The Long-Term Strategy of the United States: Pathways to Net-Zero Greenhouse Gas Emissions by 2050; U.S. Department of State: Washington, DC, USA, 2021; Available online: https://unfccc.int/sites/default/files/resource/US-LongTermStrategy-2021.pdf (accessed on 10 July 2023).
  3. Climate Watch. 2023. Available online: https://www.climatewatchdata.org/lts/country/CHN (accessed on 30 August 2023).
  4. Ichimura, Y.; Dalaklis, D.; Kitada, M.; Christodoulou, A. Shipping in the era of digitalization: Mapping the future strategic plans of major maritime commercial actors. Digit. Bus. 2022, 2, 100022. [Google Scholar] [CrossRef]
  5. de la Peña Zarzuelo, I.; Soeane, M.J.F.; Bermúdez, B.L. Industry 4.0 in the port and maritime industry: A literature review. J. Ind. Inf. Integr. 2020, 20, 100173. [Google Scholar] [CrossRef]
  6. Sullivan, B.P.; Desai, S.; Sole, J.; Rossi, M.; Ramundo, L.; Terzi, S. Maritime 4.0—Opportunities in digitalization and advanced manufacturing for vessel development. Procedia Manuf. 2020, 42, 246–253. [Google Scholar] [CrossRef]
  7. ISL. Shipping Statistics and Market Review 2022; Institute for Shipping Economics and Logistics: Bremen, Germany, 2022; Volume 66, p. 5. [Google Scholar]
  8. Di Vaio, A.; Varriale, L.; Lekakou, M.; Stefanidaki, E. Cruise and container shipping companies: A comparative analysis of sustainable development goals through environmental sustainability disclosure. Marit. Policy Manag. 2021, 48, 184–212. [Google Scholar] [CrossRef]
  9. Choudhary, P.; Khade, M.; Savant, S.; Musale, A.; Chelliah, M.S.; Dasgupta, S. Empowering blue economy: From underrated ecosystem to sustainable industry. J. Environ. Manag. 2021, 291, 112697. [Google Scholar] [CrossRef] [PubMed]
  10. Gans, J. The Disruption Dilemma; The MIT Press: Cambridge, MA, USA, 2016. [Google Scholar]
  11. Nagy, D.; Schuessler, J.; Dubinsky, A. Defining and identifying disruptive innovations. Ind. Mark. Manag. 2016, 57, 119–126. [Google Scholar] [CrossRef]
  12. Ampah, J.D.; Yusuf, A.A.; Afrane, S.; Jin, C.; Liu, H. Reviewing two decades of cleaner alternative marine fuels: Towards IMO’s decarbonization of the maritime transport sector. J. Clean. Prod. 2021, 320, 128871. [Google Scholar] [CrossRef]
  13. Sürer, M.G.; Arat, H.T. Advancements and current technologies on hydrogen fuel cell applications for marine vehicles. Int. J. Hydrogen Energy 2022, 47, 19865–19875. [Google Scholar] [CrossRef]
  14. UNCTAD. Review of Maritime Transport; United Nations: Geneva, Switzerland, 2022; Available online: https://unctad.org/system/files/official-document/rmt2022_en.pdf (accessed on 11 May 2023).
  15. Rogers, E.M. Diffusion of Innovations; Free Press: New York, NY, USA, 2003. [Google Scholar]
  16. Al-Enazi, A.; Okonkwo, E.C.; Bicer, Y.; Al-Ansari, T. A review of cleaner alternative fuels for maritime transportation. Energy Rep. 2021, 7, 1962–1985. [Google Scholar] [CrossRef]
  17. Balcombe, P.; Brierley, J.; Lewis, C.; Skatvedt, L.; Speirs, J.; Hawkes, A.; Staffell, I. How to decarbonise international shipping: Options for fuels, technologies and policies. Energy Convers. Manag. 2019, 182, 72–88. [Google Scholar] [CrossRef]
  18. Bouman, E.A.; Lindstad, E.; Rialland, A.I.; Strømman, A.H. State-of-the-art technologies, measures, and potential for reducing GHG emissions from shipping—A review. Transp. Res. Part D Transp. Environ. 2017, 52, 408–421. [Google Scholar] [CrossRef]
  19. Wagner, N. Bibliometric Analysis of Research on Green Shipping Practices. In Challenges of Urban Mobility, Transport Companies and Systems: 2018 TranSopot Conference; Springer International Publishing: Cham, Switzerland, 2019; pp. 323–332. [Google Scholar]
  20. Czermański, E.; Oniszczuk-Jastrząbek, A.; Spangenberg, E.F.; Kozłowski, Ł.; Adamowicz, M.; Jankiewicz, J.; Cirella, G.T. Implementation of the Energy Efficiency Existing Ship Index: An important but costly step towards ocean protection. Mar. Policy 2022, 145, 105259. [Google Scholar] [CrossRef]
  21. Kim, H.; Yeo, S.; Lee, J.; Lee, W.J. Proposal and analysis for effective implementation of new measures to reduce the operational carbon intensity of ships. Ocean Eng. 2023, 280, 114827. [Google Scholar] [CrossRef]
  22. Bach, H.; Hansen, T. IMO off course for decarbonisation of shipping? Three challenges for stricter policy. Mar. Policy 2023, 147, 105379. [Google Scholar] [CrossRef]
  23. Song, M.J.; Seo, Y.J.; Lee, H.Y. The dynamic relationship between industrialization, urbanization, CO2 emissions, and transportation modes in Korea: Empirical evidence from maritime and air transport. Transportation 2022, 50, 2111–2137. [Google Scholar] [CrossRef]
  24. Abbas, A.; Zhang, L.; Khan, S.U. A literature review on the state-of-the-art in patent analysis. World Pat. Inf. 2014, 37, 3–13. [Google Scholar]
  25. Khalil, T.M. Management of Technology: The Key to Competitiveness and Wealth Creation; McGraw-Hill Science, Engineering & Mathematics: San Clemente, CA, USA, 2000. [Google Scholar]
  26. Li-Hua, R.; Khalil, T.M. Technology management in China: A global perspective and challenging issues. J. Technol. Manag. China 2006, 1, 9–26. [Google Scholar] [CrossRef]
  27. Yanez, M.; Khalil, T.M.; Walsh, S.T. IAMOT and education: Defining a technology and innovation management (TIM) body-of-knowledge (BoK) for graduate education (TIM BoK). Technovation 2010, 30, 389–400. [Google Scholar] [CrossRef]
  28. Cetindamar, D.; Phaal, R.; Probert, D. Technology Management: Activities and Tools; Macmillan International Higher Education: London, UK, 2016. [Google Scholar]
  29. Abraham, B.; Morita, S. Innovation Assessment Through Patent Analysis. Technovation 2001, 21, 245–252. [Google Scholar] [CrossRef]
  30. World Intellectual Property Organization. Available online: https://www.wipo.int/patents/en/ (accessed on 3 April 2023).
  31. Jeong, Y.; Yoon, B. Development of Patent Roadmap Based on Technology Roadmap by Analyzing Patterns of Patent Development. Technovation 2015, 39–40, 37–52. [Google Scholar] [CrossRef]
  32. Popp, D. Environmental Policy and Innovation: A Decade of Research; NBER: Cambridge, MA, USA, 2019. [Google Scholar]
  33. OECD. OECD Patent Statistics Manual; OECD Publishing: Paris, France, 2009; Available online: https://www.oecd-ilibrary.org/science-and-technology/oecd-patent-statistics-manual_9789264056442-en (accessed on 14 October 2023). [CrossRef]
  34. Chandy, R.; Hopstaken, B.; Narasimhan, O.; Prabhu, J. From invention to innovation: Conversion ability in product development. J. Mark. Res. 2006, 43, 494–508. [Google Scholar] [CrossRef]
  35. Lane, J.P.; Flagg, J.L. Translating three states of knowledge–discovery, invention, and innovation. Implement. Sci. 2010, 5, 9. [Google Scholar] [CrossRef] [PubMed]
  36. Vinokurova, N.; Kapoor, R. Converting inventions into innovations in large firms: How inventors at Xerox navigated the innovation process to commercialize their ideas. Strateg. Manag. J. 2020, 41, 2372–2399. [Google Scholar] [CrossRef]
  37. Dearing, J.W.; Cox, J.G. Diffusion of innovations theory, principles, and practice. Health Aff. 2018, 37, 183–190. [Google Scholar] [CrossRef]
  38. Sahin, I. Detailed review of Rogers’ diffusion of innovations theory and educational technology-related studies based on Rogers’ theory. Turk. Online J. Educ. Technol.-TOJET 2006, 5, 14–23. [Google Scholar]
  39. Losacker, S.; Horbach, J.; Liefner, I. Geography and the speed of green technology diffusion. Ind. Innov. 2023, 30, 531–555. [Google Scholar] [CrossRef]
  40. Lee, S. Linking technology roadmapping to patent analysis. In Technology Roadmapping for Strategy and Innovation: Charting the Route to Success; Springer: Berlin/Heidelberg, Germany, 2013; pp. 267–284. [Google Scholar] [CrossRef]
  41. Watts, R.J.; Porter, A.L. Innovation forecasting. Technol. Forecast. Soc. Chang. 1997, 56, 25–47. [Google Scholar]
  42. Qiu, Z.; Wang, Z. What is your next invention?—A framework of mining technological development rules and assisting in designing new technologies based on BERT as well as patent citations. Comput. Ind. 2023, 145, 103829. [Google Scholar]
  43. Adamuthe, A.C.; Thampi, G.T. Technology forecasting: A case study of computational technologies. Technol. Forecast. Soc. Chang. 2019, 143, 181–189. [Google Scholar]
  44. Tseng, F.M.; Liu, J.; Gil, E.I.N.P.; Lu, L.Y. Identifying and monitoring emerging blockchain technologies using patent analysis. World Pat. Inf. 2023, 75, 102236. [Google Scholar] [CrossRef]
  45. Zanella, G.; Liu, C.Z.; Choo, K.K.R. Understanding the trends in blockchain domain through an unsupervised systematic patent analysis. In IEEE Transactions on Engineering Management; IEEE: Piscataway, NJ, USA, 2021. [Google Scholar]
  46. Cappelli, R.; Corsino, M.; Laursen, K.; Torrisi, S. Technological competition and patent strategy: Protecting innovation, preempting rivals and defending the freedom to operate. Res. Policy 2023, 52, 104785. [Google Scholar]
  47. Grzegorczyk, T.; Głowiński, R. Patent management strategies: A review. J. Econ. Manag. 2020, 40, 36–51. [Google Scholar] [CrossRef]
  48. Holgersson, M.; Granstrand, O. Patenting motives, technology strategies, and open innovation. Manag. Decis. 2017, 55, 1265–1284. [Google Scholar]
  49. Grzegorczyk, T. Managing intellectual property: Strategies for patent holders. J. High Technol. Manag. Res. 2020, 31, 100374. [Google Scholar]
  50. Sinigaglia, T.; Martins, M.E.S.; Siluk, J.C.M. Technological evolution of internal combustion engine vehicle: A patent data analysis. Appl. Energy 2022, 306, 118003. [Google Scholar] [CrossRef]
  51. Stek, P.E. Mapping high R&D city-regions worldwide: A patent heat map approach. Qual. Quant. 2020, 54, 279–296. [Google Scholar] [CrossRef]
  52. Xu, L.; Fan, M.; Yang, L.; Shao, S. Heterogeneous green innovations and carbon emission performance: Evidence at China’s city level. Energy Econ. 2021, 99, 105269. [Google Scholar] [CrossRef]
  53. Klincewicz, K.; Marczewska, M.; Tucci, C.L. Regional smart specializations in Central and Eastern Europe: Between political decisions and revealed technological potential. In Partnerships for Regional Innovation and Development; Routledge: London, UK, 2021; pp. 21–48. [Google Scholar]
  54. Joo, S.H.; Oh, C.; Lee, K. Catch-up strategy of an emerging firm in an emerging country: Analysing the case of Huawei vs. Ericsson with patent data. Int. J. Technol. Manag. 2016, 72, 19–42. [Google Scholar] [CrossRef]
  55. Ghaffari, M.; Aliahmadi, A.; Khalkhali, A.; Zakery, A.; Daim, T.U.; Yalcin, H. Topic-based technology mapping using patent data analysis: A case study of vehicle tires. Technol. Forecast. Soc. Chang. 2023, 193, 122576. [Google Scholar]
  56. Wang, X.; Khurshid, A.; Qayyum, S.; Calin, A.C. The role of green innovations, environmental policies and carbon taxes in achieving the sustainable development goals of carbon neutrality. Environ. Sci. Pollut. Res. 2022, 29, 8393–8407. [Google Scholar] [CrossRef]
  57. Sierotowicz, T. Patent activity as an effect of the research and development of the business enterprise sectors in the countries of the European Union. J. Int. Stud. 2015, 8, 101–113. [Google Scholar] [CrossRef]
  58. Sinigaglia, T.; Martins, M.E.S.; Siluk, J.C.M. Technological forecasting for fuel cell electric vehicle: A comparison with electric vehicles and internal combustion engine vehicles. World Pat. Inf. 2022, 71, 102152. [Google Scholar] [CrossRef]
  59. Stopford, M. Three Maritime Scenarios 2020–2050; Seatrade Maritime: Colchester, UK, 2020. [Google Scholar]
  60. Sun, M.; Jia, Y.; Wei, J.; Zhu, J.X. Exploring the Green-Oriented Transition Process of Ship Power Systems: A Patent-Based Overview on Innovation Trends and Patterns. Energies 2023, 16, 2566. [Google Scholar] [CrossRef]
  61. Li, D.; Li, X. Which ship-integrated power system enterprises are more competitive from the perspective of patent? PLoS ONE 2021, 16, e0252020. [Google Scholar] [CrossRef]
  62. Zhao, R.; Li, D.; Li, X. Research on the Development Trend of Ship Integrated Power System Based on Patent Analysis. In Smart Trends in Computing and Communications: Proceedings of SmartCom 2019; Springer: Singapore, 2020; pp. 123–132. [Google Scholar]
  63. Chlomoudis, C.; Styliadis, T. Innovation and Patenting within Containerized Liner Shipping. Sustainability 2022, 14, 892. [Google Scholar] [CrossRef]
  64. Wagner, N.; Wiśnicki, B. The Importance of Emerging Technologies to the Increasing of Corporate Sustainability in Shipping Companies. Sustainability 2022, 14, 12475. [Google Scholar] [CrossRef]
  65. Wiśnicki, B.; Wagner, N.; Wołejsza, P. Critical areas for successful adoption of technological innovations in sea shipping–the autonomous ship case study. Innov. Eur. J. Soc. Sci. Res. 2021. [Google Scholar] [CrossRef]
  66. Ivanova, A.; Butsanets, A.; Breskich, V.; Zhilkina, T. Autonomous Shipping Means: The Main Areas of Patenting Research and Development Results. Transp. Res. Procedia 2021, 54, 793–801. [Google Scholar] [CrossRef]
  67. Favot, M.; Vesnic, L.; Priore, R.; Bincoletto, A.; Morea, F. Green patents and green codes: How different methodologies lead to different results. Resour. Conserv. Recycl. Adv. 2023, 18, 200132. [Google Scholar] [CrossRef]
  68. Ghisetti, C.; Quatraro, F. Green technologies and environmental productivity: A cross-sectoral analysis of direct and indirect effects in Italian regions. Ecol. Econ. 2017, 132, 1–13. [Google Scholar] [CrossRef]
  69. Espacenet. Available online: https://worldwide.espacenet.com/patent/cpc-browser#!/CPC=Y02 (accessed on 24 August 2023).
  70. Veefkind, V.; Hurtado-Albir, J.; Angelucci, S.; Karachalios, K.; Thumm, N. A new EPO classification scheme for climate change mitigation technologies. World Pat. Inf. 2012, 34, 106–111. [Google Scholar] [CrossRef]
  71. Angelucci, S.; Hurtado-Albir, F.J.; Volpe, A. Supporting global initiatives on climate change: The EPO’s “Y02-Y04S” tagging scheme. World Pat. Inf. 2018, 54, S85–S92. [Google Scholar] [CrossRef]
  72. Cooperative Patent Classification. Available online: https://www.cooperativepatentclassification.org/sites/default/files/cpc/scheme/Y/scheme-Y02T.pdf (accessed on 14 October 2023).
  73. Hötte, K.; Jee, S.J. Knowledge for a warmer world: A patent analysis of climate change adaptation technologies. Technol. Forecast. Soc. Change 2022, 183, 121879. [Google Scholar] [CrossRef]
  74. Dechezlepretre, A.; Fankhauser, S.; Glachant, M.; Stoever, J.; Touboul, S. Invention and Global Diffusion of Technologies for Climate Change Adaptation. Invention and North-South Transfer of Technologies for Climate Change Adaptation Report; World Bank: Washington, DC, USA, 2020; Available online: https://documents1.worldbank.org/curated/en/648341591630145546/pdf/Invention-and-Global-Diffusion-of-Technologies-for-Climate-Change-Adaptation-A-Patent-Analysis.pdf (accessed on 3 September 2023).
  75. Su, H.N.; Moaniba, I.M. Does innovation respond to climate change? Empirical evidence from patents and greenhouse gas emissions. Technol. Forecast. Soc. Chang. 2017, 122, 49–62. [Google Scholar] [CrossRef]
  76. Hussin, F.; Aroua, M.K. Recent trends in the development of adsorption technologies for carbon dioxide capture: A brief literature and patent reviews (2014–2018). J. Clean. Prod. 2020, 253, 119707. [Google Scholar] [CrossRef]
  77. Cho, H.H.; Strezov, V.; Evans, T.J. A review on global warming potential, challenges and opportunities of renewable hydrogen production technologies. Sustain. Mater. Technol. 2023, 35, e00567. [Google Scholar] [CrossRef]
  78. Li, T.; He, X.; Gao, P. Analysis of offshore LNG storage and transportation technologies based on patent informatics. Clean. Eng. Technol. 2021, 5, 100317. [Google Scholar] [CrossRef]
  79. UN. The Sustainable Development Goals Report 2023: Special Edition. Available online: https://unstats.un.org/sdgs/report/2023 (accessed on 13 October 2023).
  80. Yu, Y.S.; Zhang, X.; Liu, J.W.; Lee, Y.; Li, X.S. Natural gas hydrate resources and hydrate technologies: A review and analysis of the associated energy and global warming challenges. Energy Environ. Sci. 2021, 14, 5611–5668. [Google Scholar] [CrossRef]
  81. Zheng, X.; Aborisade, M.A.; Liu, S.; Lu, S.; Oba, B.T.; Xu, X.; Cheng, X.; He, M.; Song, Y.; Ding, H. The history and prediction of composting technology: A patent mining. J. Clean. Prod. 2020, 276, 124232. [Google Scholar] [CrossRef]
  82. Albino, V.; Ardito, L.; Dangelico, R.M.; Petruzzelli, A.M. Understanding the development trends of low-carbon energy technologies: A patent analysis. Appl. Energy 2014, 135, 836–854. [Google Scholar] [CrossRef]
  83. Lähteenmäki-Uutela, A.; Yliskylä-Peuralahti, J.; Olaniyi, E.; Haukioja, T.; Repka, S.; Prause, G.; De Andres Gonzalez, O. The impacts of the sulphur emission regulation on the sulphur emission abatement innovation system in the Baltic Sea region. Clean Technol. Environ. Policy 2019, 21, 987–1000. [Google Scholar] [CrossRef]
  84. IMO. 2021 Marks a Decade of Action Since IMO Adopted the First Set of Mandatory Energy Efficiency Measures for Ships. 15 July 2021. Available online: https://www.imo.org/en/MediaCentre/PressBriefings/pages/DecadeOfGHGAction.aspx (accessed on 12 April 2023).
  85. Adamowicz, M. Decarbonisation of maritime transport–European Union measures as an inspiration for global solutions? Mar. Policy 2022, 145, 105085. [Google Scholar] [CrossRef]
  86. IMO. Fourth IMO Greenhouse Gas Study; International Maritime Organization: London, UK, 2020. [Google Scholar]
  87. Monios, J.; Wilmsmeier, G. Deep adaptation to climate change in the maritime transport sector—A new paradigm for maritime economics? Marit. Policy Manag. 2020, 47, 853–872. [Google Scholar] [CrossRef]
  88. Bullock, S.; Mason, J.; Larkin, A. The urgent case for stronger climate targets for international shipping. Clim. Policy 2022, 22, 301–309. [Google Scholar] [CrossRef]
  89. Bows-Larkin, A. All adrift: Aviation, shipping, and climate change policy. Clim. Policy 2015, 15, 681–702. [Google Scholar] [CrossRef]
  90. IMO. 2023 IMO Strategy on Reduction of GHG Emissions from Ships, Resolution MEPC.377(80), Adopted on 7 July 2023. 2023. Available online: https://wwwcdn.imo.org/localresources/en/OurWork/Environment/Documents/annex/MEPC%2080/Annex%2015.pdf (accessed on 12 September 2023).
  91. Luan, F.; Chen, Y.; He, M.; Park, D. Do we innovate atop giants’ shoulders? Eur. J. Innov. Manag. 2022. [Google Scholar] [CrossRef]
  92. EPO. Key Patenting Trends. 2020. Available online: https://www.epo.org/about-us/annual-reports-statistics/statistics/2020.html (accessed on 20 March 2023).
  93. Klincewicz, K. Robotics in the context of industry 4.0: Patenting activities in Poland and their comparison with global developments. Probl. Zarządzania 2019, 17, 53–95. [Google Scholar]
  94. OECD. “OECD Science, Technology and Industry Outlook: Revealed Technology Advantage in Selected Fields”, OECD Science, Technology and R&D Statistics (Database). 2023. Available online: https://www.oecd-ilibrary.org/science-and-technology/data/oecd-science-technology-and-industry-outlook/revealed-technology-advantage-in-selected-fields_data-00673-en (accessed on 12 October 2023). [CrossRef]
  95. Ampah, J.D.; Jin, C.; Fattah, I.M.R.; Appiah-Otoo, I.; Afrane, S.; Geng, Z.; Yusuf, A.A.; Li, T.; Mahlia, T.I.; Liu, H. Investigating the evolutionary trends and key enablers of hydrogen production technologies: A patent-life cycle and econometric analysis. Int. J. Hydrogen Energy 2022. [Google Scholar] [CrossRef]
  96. Moed, H.F. Citation analysis in research evaluation. In Information Science and Knowledge Management Series; Springer: Dordrecht, The Netherlands, 2005; p. 348. [Google Scholar] [CrossRef]
  97. Yuan, X.; Cai, Y. Forecasting the development trend of low emission vehicle technologies: Based on patent data. Technol. Forecast. Soc. Chang. 2021, 166, 120651. [Google Scholar] [CrossRef]
  98. Altuntas, S.; Dereli, T.; Kusiak, A. Forecasting technology success based on patent data. Technol. Forecast. Soc. Chang. 2015, 96, 202–214. [Google Scholar] [CrossRef]
  99. Kyebambe, M.N.; Cheng, G.; Huang, Y.; He, C.; Zhang, Z. Forecasting emerging technologies: A supervised learning approach through patent analysis. Technol. Forecast. Soc. Chang. 2017, 125, 236–244. [Google Scholar]
  100. No, H.J.; An, Y.; Park, Y. A structured approach to explore knowledge flows through technology-based business methods by integrating patent citation analysis and text mining. Technol. Forecast. Soc. Chang. 2015, 97, 181–192. [Google Scholar] [CrossRef]
  101. Kim, G.; Bae, J. A novel approach to forecast promising technology through patent analysis. Technol. Forecast. Soc. Chang. 2017, 117, 228–237. [Google Scholar] [CrossRef]
  102. Caviggioli, F.; Colombelli, A.; De Marco, A.; Scellato, G.; Ughetto, E. The impact of university patenting on the technological specialization of European regions: A technology-level analysis. Technol. Forecast. Soc. Chang. 2023, 188, 122216. [Google Scholar] [CrossRef]
  103. Higham, K.; Contisciani, M.; De Bacco, C. Multilayer patent citation networks: A comprehensive analytical framework for studying explicit technological relationships. Technol. Forecast. Soc. Chang. 2022, 179, 121628. [Google Scholar]
  104. Jürgens, B.; Clarke, N. Study and Comparison of the Unique Selling Propositions (USPs) of Free-to-Use Multinational Patent Search Systems. World Pat. Inf. 2018, 52, 9–16. [Google Scholar]
  105. Rodrigue, J. The Geography of Transport Systems; Routledge: New York, NY, USA, 2020; 456p, ISBN 978-0-367-36463-2. [Google Scholar] [CrossRef]
  106. Naik, B.K.R.; Mishra, R.; Choudhary, V. Linking innovation dynamics with scientific knowledge of climate change mitigation technologies. In Proceedings of the 2022 IEEE 28th International Conference on Engineering, Technology and Innovation (ICE/ITMC) & 31st International Association For Management of Technology (IAMOT) Joint Conference, Nancy, France, 19–23 June 2022; IEEE: Piscataway, NJ, USA, 2022; pp. 1–7. [Google Scholar]
  107. Gong, H.; Peng, S. Effects of patent policy on innovation outputs and commercialization: Evidence from universities in China. Scientometrics 2018, 117, 687–703. [Google Scholar] [CrossRef]
  108. DNV. Energy Transition Outlook 2023. Maritime Forecast to 2050. 2023. Available online: https://www.dnv.com/maritime/publications/maritime-forecast-2023/download-the-report.html (accessed on 15 October 2023).
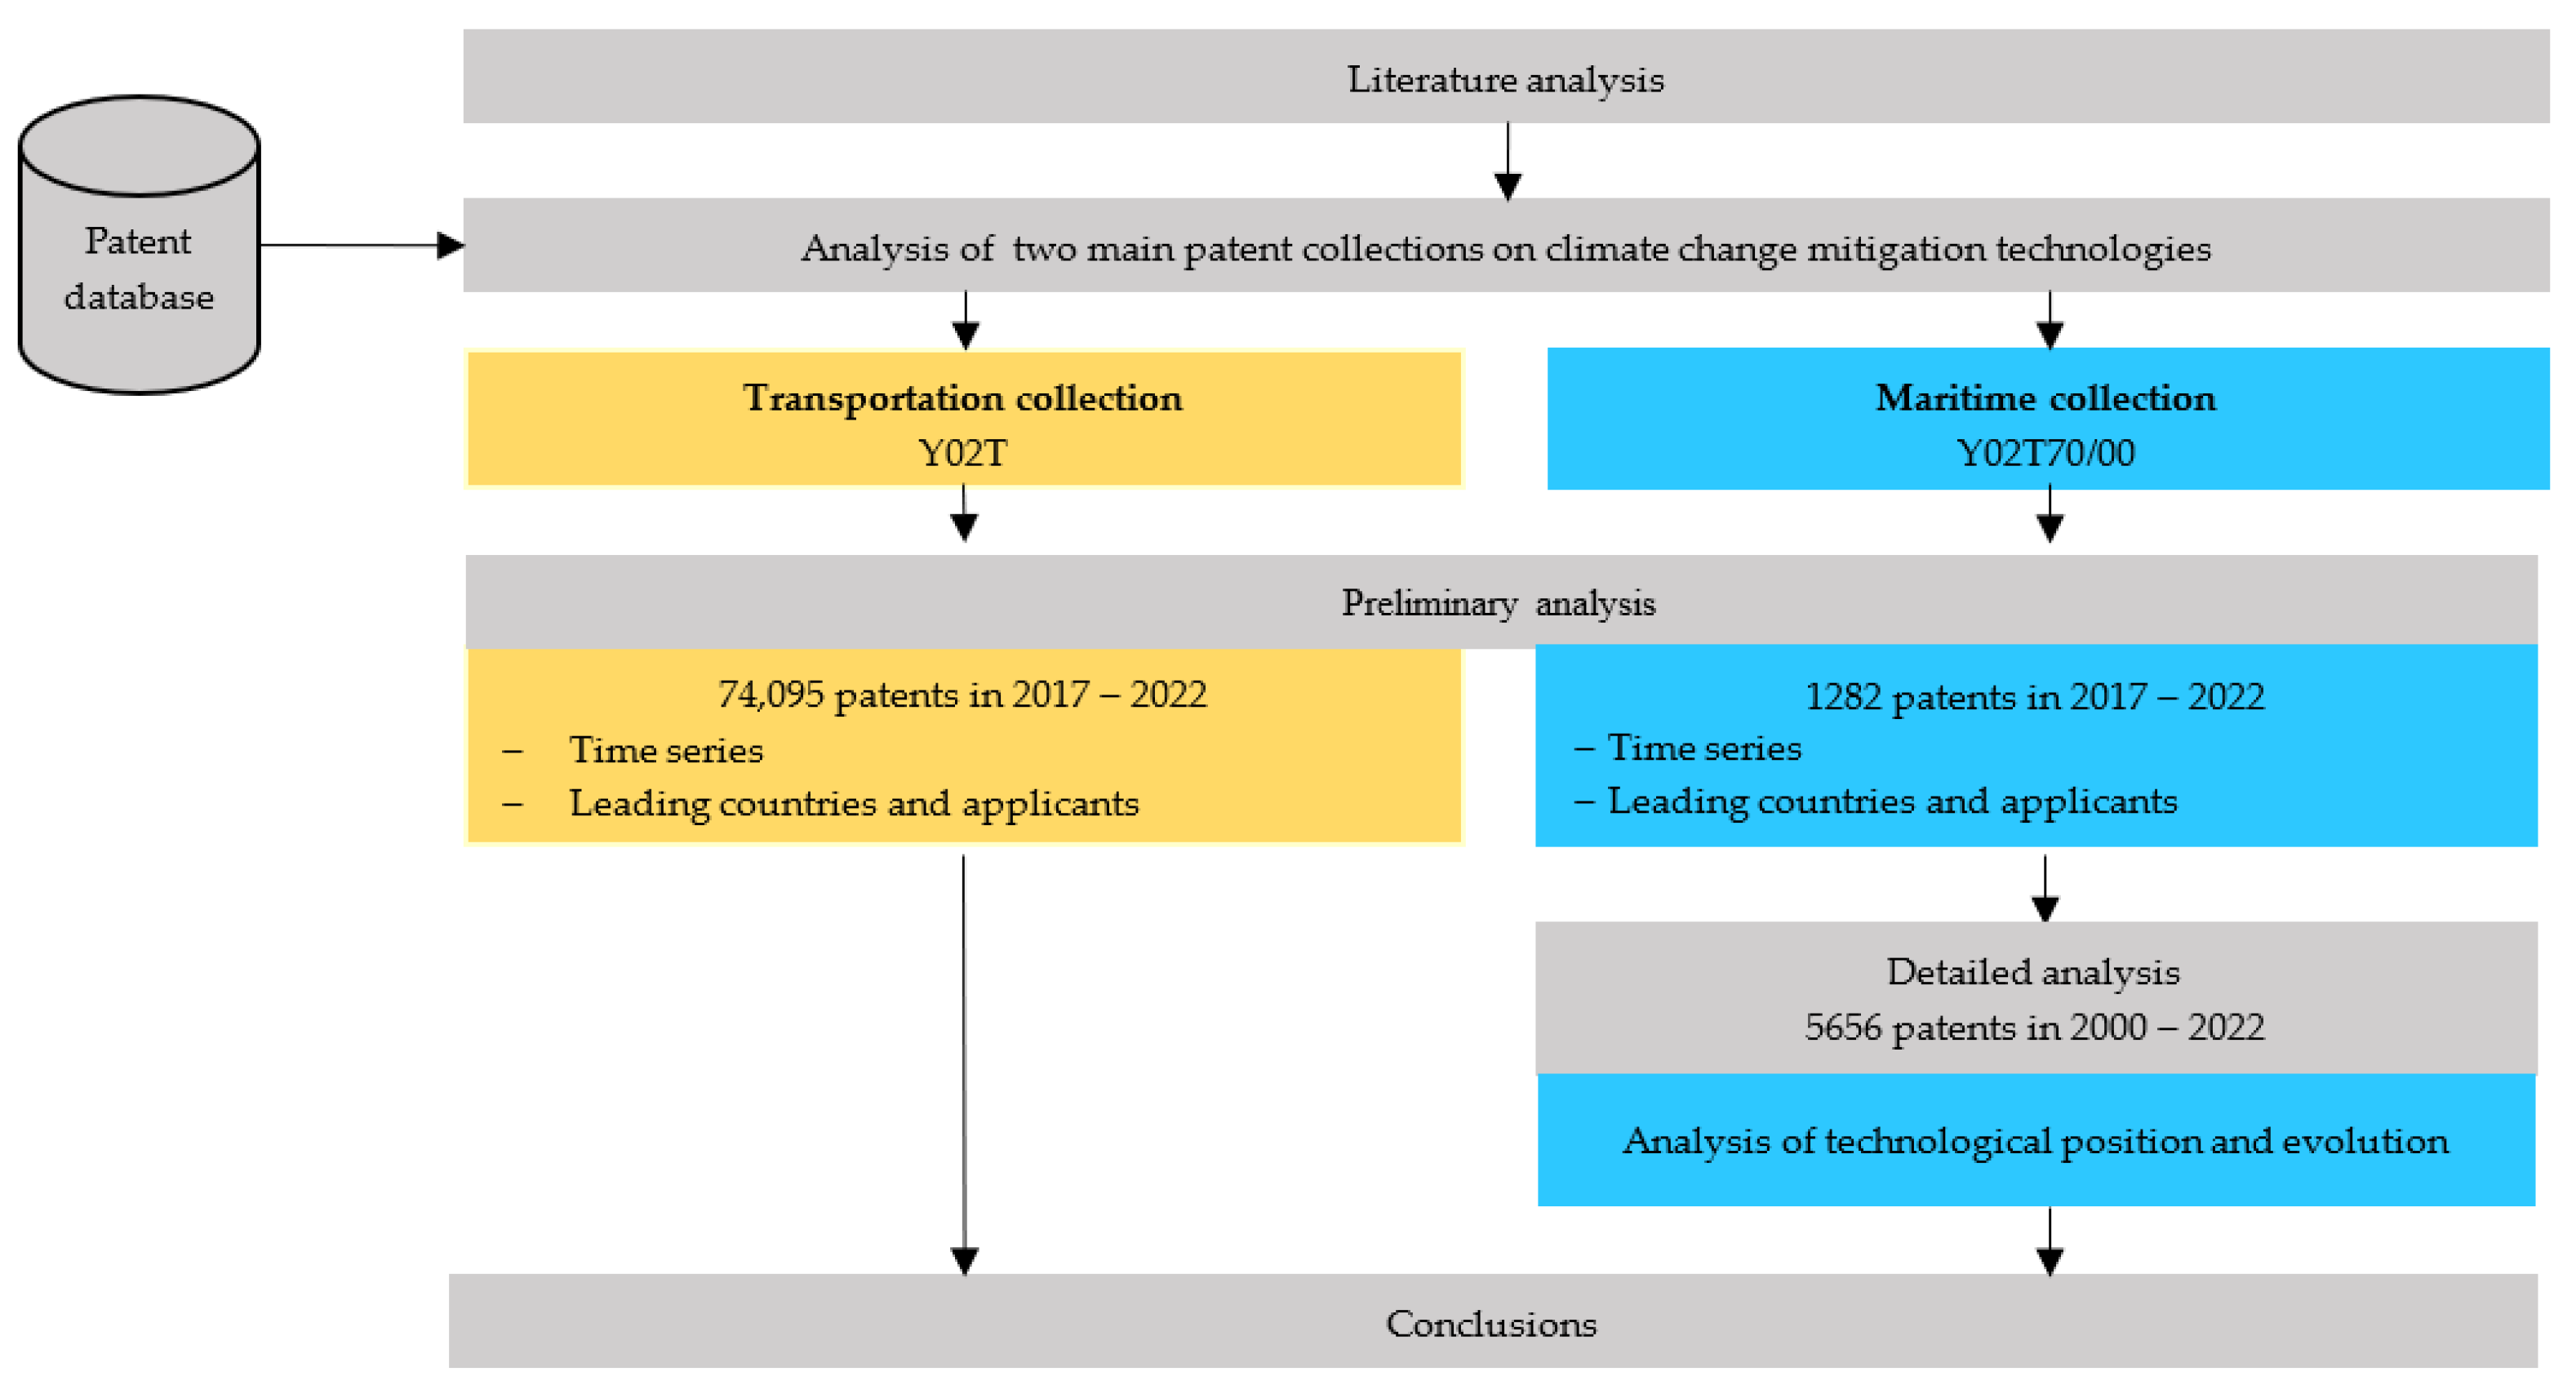
Figure 1. Research framework.
Energies 16 07403 g001
Figure 2. Number of patents in two collections: (a) Transportation—climate change mitigation technologies related to transportation (Y02T); (b) Maritime—climate change mitigation technologies related to transportation (maritime or waterway transport (Y02T70/00)) in 2017–2022.
Energies 16 07403 g002
Figure 3. Countries leading patenting activity for (a) Y02T—climate change mitigation technologies related to transportation; (b) Y02T70/00—climate change mitigation technologies related to transportation (maritime or waterway transport (number of patents)) in 2017–2022 and in 2022 alone.
Energies 16 07403 g003
Figure 4. (a) Number of patents in the maritime collection by leading applicant company versus country, (b) Number of patents in the maritime collection by leading applicant university versus country in four leading countries, 2000–2022. Countries: CN—China; JP—Japan; KR—South Republic of Korea; US—United States of America.
Energies 16 07403 g004
Figure 5. (a) Percentage of patents in the maritime collection by leading applicant company versus country, (b) Percentage of patents in the maritime collection by leading applicant university versus country in four leading countries, 2000–2022. Countries: CN—China; JP—Japan; KR—Republic of Korea; US—United States of America.
Energies 16 07403 g005aEnergies 16 07403 g005b
Figure 6. A map of technical knowledge flows for climate change mitigation in transport. Source: Own study.
Energies 16 07403 g006
Figure 7. A map of technical knowledge flows for climate change mitigation in maritime transport. Source: Own study.
Energies 16 07403 g007
Figure 8. First eight codes tagged in maritime collection (Y02T70) (number of patents).
Energies 16 07403 g008
Figure 9. Codes showing an increase in patent activity for at least three succeeding years for the maritime collection (Y02T70/00) in 2000–2022.
Energies 16 07403 g009
Figure 10. Noun groups most commonly repeated in titles and abstracts of patents of the maritime collection Y02T70/00 in 2000–2022.
Energies 16 07403 g010
Table 1. Subclasses in class Y of Cooperative Patent Classification (CPC).
CPC Subclass CodeTitle
Y02ATechnologies for adaptation to climate change.
Y02BClimate change mitigation technologies related to buildings, e.g., housing, house appliances or related end-user applications.
Y02CCapture, storage, sequestration or disposal of greenhouse gases.
Y02DClimate change mitigation technologies in information and communication technologies, i.e., information and communication technologies aiming at reduction in their own energy use.
Y02EReduction in greenhouse gas emissions, related to energy generation, transmission or distribution.
Y02PClimate change mitigation technologies in the production or processing of goods.
Y02TClimate change mitigation technologies related to transportation.
Y02WClimate change mitigation technologies related to wastewater treatment or waste management.
Source: Ref [72].
Table 2. Position of the maritime collection (main group Y02T70/00) in the CPC hierarchy.
CPC CodeTittleNumber of Patent Families
1 January 2000–31 December 2022
Section:YGeneral tagging of new technological developments.3,299,613
Class: Y02Technologies or applications for mitigation or adaptation against climate change.2,152,976
Subclass: Y02TClimate change mitigation technologies related to transportation.285,119
Main group:Y02T70/00Maritime or waterway transport.5656
Table 3. Overview of selected technical knowledge flow indices for the patent collections analysed.
Main GroupsTitleNumber of PatentsNumber of Backward CitationsNumber of Forward CitationsTechnological InfluenceBackward Citations per PatentNumber of Main GroupsPatent Power
Y02T10/00Road transport of goods or passengers 238,332551,143505,1862.122.3148660.02
Y02T30/00Transportation of goods or passengers via railways, e.g., energy recovery or reducing air resistance 4190955969411.662.2811600.28
Y02T50/00Aeronautics or air transport 29,18598,97472,2012.473.3934960.12
Y02T70/00Maritime or waterway transport 565613,25910,3411.832.3413210.23
Y02T90/00Enabling technologies or technologies with a potential or indirect contribution to GHG emissions mitigation38,96590,15595,0952.442.3128530.07
Table 4. Overview of selected knowledge flow indices for the most numerous subgroups in the maritime collection.
SubgroupTitleNumber of PatentsNumber of Backward Citations Number of Forward Citations Technological InfluenceBackward Citations per PatentNumber of Main GroupsPatent Power
Y02T70/10 Measures concerning design or construction of watercraft hulls3060680148981.602.226860.22
Y02T70/50 Measures to reduce greenhouse gas emissions related to the propulsion system2178545446742.152.507410.34
Disclaimer/Publisher’s Note: The statements, opinions and data contained in all publications are solely those of the individual author(s) and contributor(s) and not of MDPI and/or the editor(s). MDPI and/or the editor(s) disclaim responsibility for any injury to people or property resulting from any ideas, methods, instructions or products referred to in the content.