Article

Decarbonization Pathways, Strategies, and Use Cases to Achieve Net-Zero CO2 Emissions in the Steelmaking Industry

by
Josué Rodríguez Diez
1,2,*,
Silvia Tomé-Torquemada
1,
Asier Vicente
1,
Jon Reyes
1 and
G. Alonso Orcajo
2
1
ArcelorMittal Global R&D Basque Country Research Centre, 48910 Sestao, Spain
2
Electrical Engineering Department, University of Oviedo, 33204 Gijón, Spain
*
Author to whom correspondence should be addressed.
Energies 2023, 16(21), 7360; https://doi.org/10.3390/en16217360
Submission received: 24 September 2023 / Revised: 23 October 2023 / Accepted: 25 October 2023 / Published: 31 October 2023
(This article belongs to the Special Issue Policies for Carbon-Neutral Energy System)

Abstract

:
The steelmaking industry is responsible for 7% of global CO2 emissions, making decarbonization a significant challenge. This review provides a comprehensive analysis of current steel-production processes, assessing their environmental impact in terms of CO2 emissions at a global level. Limitations of the current pathways are outlined by using objective criteria and a detailed review of the relevant literature. Decarbonization strategies are rigorously evaluated across various scenarios, emphasizing technology feasibility. Focusing on three pivotal areas—scrap utilization, hydrogen integration, and electricity consumption—in-depth assessments are provided, backed by notable contributions from both industrial and scientific fields. The intricate interplay of technical, economic, and regulatory considerations substantially affects CO2 emissions, particularly considering the EU Emissions Trading System. Leading steel producers have established challenging targets for achieving carbon neutrality, requiring a thorough evaluation of industry practices. This paper emphasizes tactics to be employed within short-, medium-, and long-term periods. This article explores two distinct case studies: One involves a hot rolling mill that utilizes advanced energy techniques and uses H2 for the reheating furnace, resulting in a reduction of 229 kt CO2-eq per year. The second case examines DRI production incorporating H2 and achieves over 90% CO2 reduction per ton of DRI.

1. Introduction

Although steel is less carbon emitting per application than many other materials from primary sources, the sheer scale of global steel production means the steelmaking industry contributes to around 7% of global CO2 emissions, 5% of the CO2 emissions in the European Union (EU), and 6% of the emissions in the United States of America (USA) [1,2,3,4,5,6,7,8,9,10]. Emissions per ton of steel vary widely between countries, and the differences are based on the production routes, product mix, energy efficiency, fuel used, and the carbon intensity from the fuel and electricity [11]. The environmental impact of steel assumes more significance when viewed within the context of wider global industries. In a net-zero projection for 2030, direct CO2 emissions resulting from the iron and steel sector represent a substantial 30% [12]. Steel is positioned at the forefront of industries that generate significant emissions, followed by cement at 20%, the chemical and petrochemical sector at 15%, pulp and paper at 10%, and aluminum at 5% [12]. Globally, energy production is the primary contributor to greenhouse gas emissions (GHGs), responsible for 73% of total emissions, with electricity and heat accounting for approximately 42% [13,14]. Agriculture, forestry, and land use (AFOLU) rank second with about 24% of the total emissions. Subsequently, the industry (21%), transport (14%), and building (3%) sectors are reported to emit greenhouse gases [14].
Global steel demand is forecast to increase by 2050 under the current consumption pattern, driven primarily by continued growth in the developing world, as well as increased steel demand to support the global energy transition since more steel will be needed per unit of renewable electricity than conventional technologies [1,15]. The industry growth forecast reaches an annual production of 200 Mt in 2050 for the EU-27 and the United Kingdom (UK) [16]. In other scenarios, such as in the USA, production is forecasted to increase by 12% by 2050 [10]. Nevertheless, the proportion of worldwide manufacturing controlled by the People’s Republic of China is projected to decrease from its current 50% to 35% by 2050, as India’s output is expected to grow more than threefold to fulfill domestic requirements [2], in addition to the imposition of levies by the EU, the USA, and other nations [17,18].
Over the last 150 years, the steel industry has seen significant energy and yield improvements. While incremental improvements will continue, far more is needed to meet the objectives of the Paris Agreement such as a 55% reduction in GHGs by 2030 compared to 1990 levels and CO2 neutrality by 2050, whilst at the same time responding to the growing demand for steel and preserving competitiveness [8,19,20].
Steel can be produced through different routes: the primary or integrated route and the secondary or electric route. In the primary route, steel is produced from iron ore and coal or coke in a blast furnace (BF) and a basic oxygen furnace (BOF), and it has high CO2 emissions despite being very efficient when it comes to energy consumption [2,4,20]. As can be seen in Figure 1a, the CO2 emissions are around 2.2 tons of CO2 per ton of produced crude steel [2,4,5,16,20]. It should be noted that these emissions vary from country to country and that the CO2 emissions are between 1.8 and 4.0 tons of CO2 per ton of crude steel for most of the countries, with China and the EU reporting lower CO2 emissions (1.84 tons of CO2 and 1.81 tons of CO2, respectively) and South Africa and India generating more than 3.8 tons of CO2 per ton of steel [5,20]. The integrated route is predominant in worldwide crude production, accounting for almost 71% of crude steel production. The BF-BOF route for European steel production accounts for around 56% of the total steel production, whereas in the USA, only 31% of the steel is produced through the primary route [6].
The secondary route produces steel by melting scrap in the electric arc furnace (EAF) with much lower CO2 emissions than those produced with the BF-BOF route. Another alternative that still reduces the CO2 emissions from the integrated route is to use an alternative iron input in the EAF such as direct reduced iron (DRI) produced with natural gas (NG) [2,3]. Emissions from the scrap-EAF and DRI-EAF can be seen in Figure 1b. The CO2 emissions from the electric route range from 0.6 to 1.4 tons of CO2 per ton of crude steel, depending on the raw material used, in nearly all countries [20]. Most of the crude production in the USA, specifically 69%, is produced through the secondary route, whilst in the EU and worldwide, the EAF route accounts for 44% and 30% of the total crude production, respectively, according to the data from 2021 [6].
The electrification of steel production significantly decreases CO2 emissions, enabled by the EAF’s advantages: using scrap steel and adapting to cleaner energy sources. Despite this, there are essential factors that ensure the continued widespread use of the BF-BOF route. Historical roots of the existing BOF infrastructure demand significant capital and time for successful BF/BOF-to-EAF conversion. Areas with abundant, reasonably priced coal and iron ore maintain the appeal of the BOF. The integration of CCU in BOF facilities moderates the push for complete electrification. Meeting demands for the exact steel chemical compositions, particularly in Europe, presents obstacles. Although minimills have shifted towards a more environmentally conscious approach, they encounter difficulties in matching the integrated techniques for top-notch steel production. Given the intricacy of maintaining precise residual control over scrap to produce high-quality steel while rigorously monitoring its chemistry, the EAF with DRI and scrap route satisfies all criteria: high-grade steel production, minimal CO2 emissions, and ample potential for implementing CO2-free processes [23]. As a result, the industry is compelled to balance emissions reduction with competitiveness and long-term sustainability as it strives towards achieving ambitious environmental objectives.
When both steelmaking routes are considered, the country with the lowest CO2 emissions per ton of steel produced is the USA, as most of the steel is produced through the secondary route. This is followed by Turkey and Europe (EU-27, UK, and Norway). Among the countries that produce over 50% of their steel via the integrated route, the EU has the lowest CO2 emissions whilst China has the highest [8,10].
Figure 2 and Figure 3 show the latest data related to steel production and CO2 emissions. The CO2 intensity of electricity primarily influences the EU and United States’ emissions, while in China and India, the type of raw material used plays a significant role. For the secondary route, the EU relies on scrap as the main raw material, whilst India and Russia widely utilize DRI. In China, approximately 45% of the raw material comes from pig iron produced in blast furnaces, resulting in higher emissions [24]. The CO2 footprint of DRI in India is substantial, as around 80% is derived from coal [25], which is significantly more carbon-intensive than natural-gas-based DRI [26]. In the United States, electric steel mills use a combination of pig iron, DRI, and scrap to achieve higher-quality steel production [8,10].
Previous research has investigated the effects of pricing policies on the steel industry [27,28], as well as examined the decarbonization processes within domestic steel manufacturing [29,30]. The impact of hydrogen production on CO2 emissions has been analyzed [31], and recommendations on how to identify suitable low-emission steel plant configurations have been provided [32]. This paper aims to conduct a comprehensive review of the literature, with a specific focus on three potential decarbonization pathways: developments in scrap utilization, the integration of hydrogen, and finishing processes’ electrification by using local renewable energy sources. A range of detailed case studies is presented, demonstrating effective CO2 emission-reduction strategies.
The rest of this paper is structured as follows: Section 2 describes the decarbonization pathways in the steelmaking industry, focusing on the current state of the technology. Section 3 details the decarbonization strategies adopted by the main steelmakers. Section 4 presents some use cases of hydrogen and new electrification approaches in the steel industry. Finally, Section 5 depicts the conclusions reached from the proposed review.

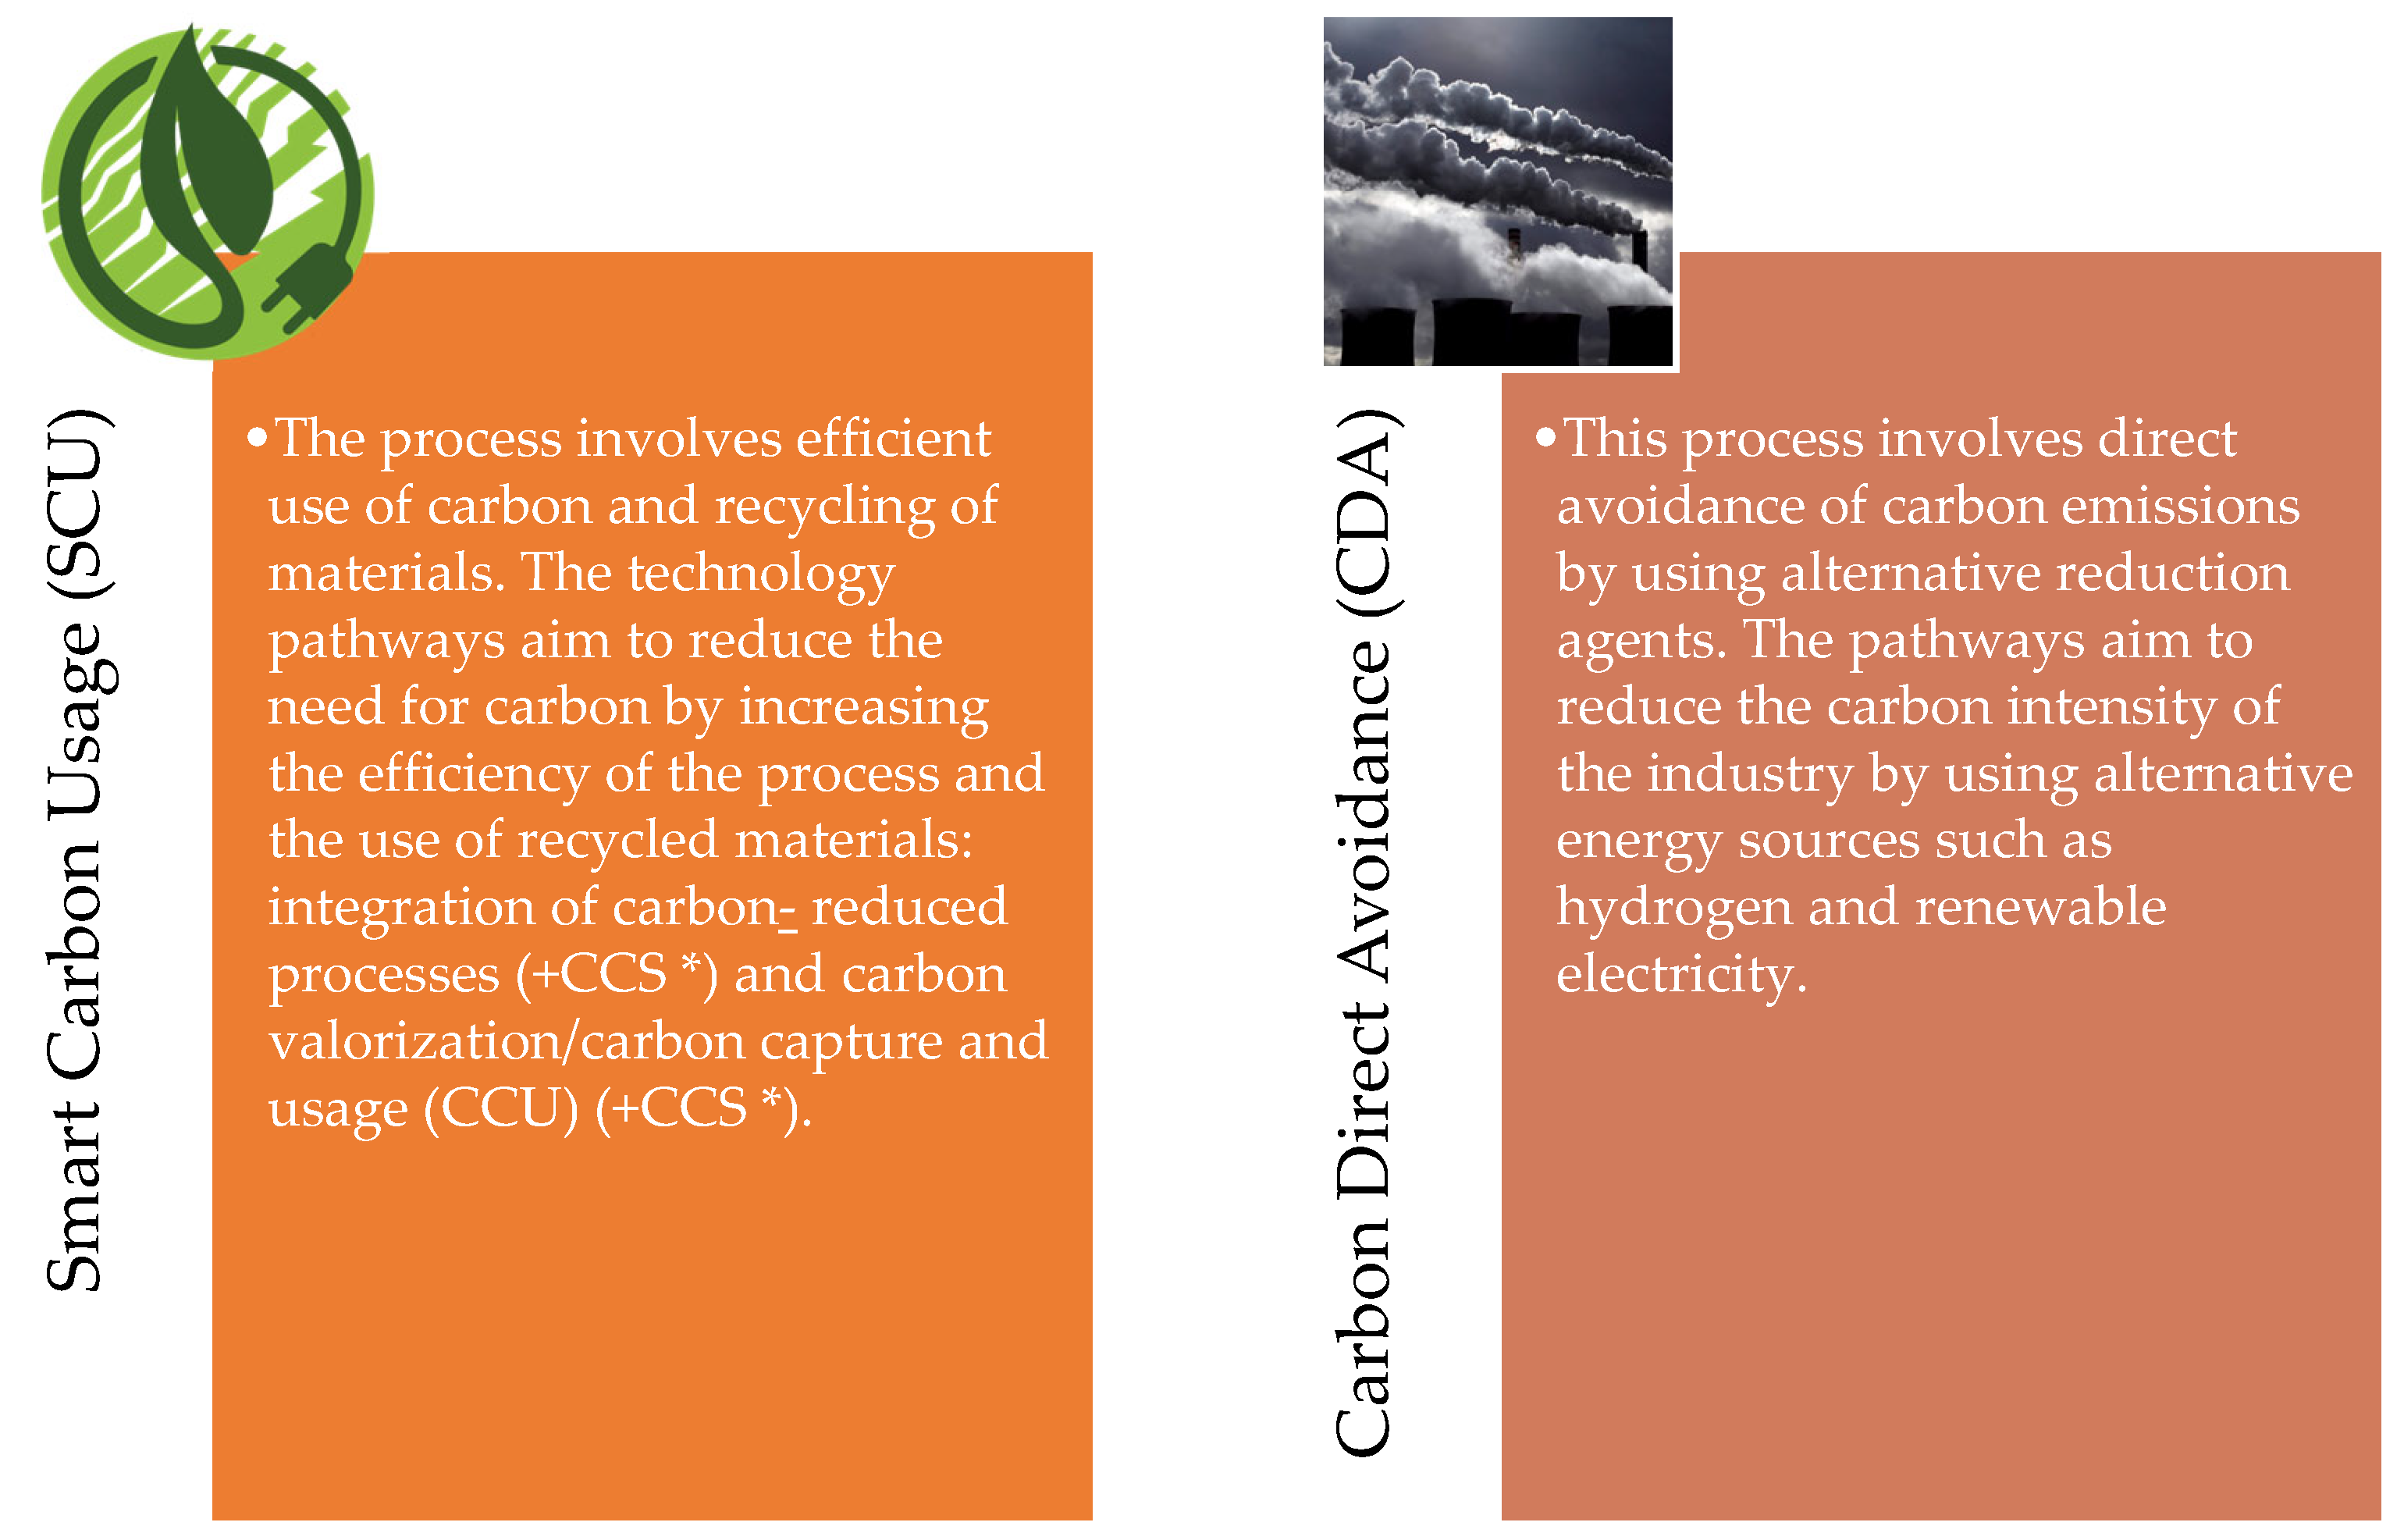
2. Decarbonization Pathways

Different literature sources [26,33,34,35,36,37,38,39,40,41,42] highlight how changes through new disruptive technologies in the steel industry are required to bring emissions on trend to meet the GHG reduction target by 2050 [8]. This entails a change in the steel industry’s production processes and a greater sense of immediacy in implementing them. Due to the long-lived capital assets of this industry, 2050 is only one investment cycle away [8]. This urge to act is reflected not only in the update by the European Commission in its Industrial Strategy 2020 and accompanying steel working roll [43] but also in steel industry assessments [16], as well as in the plans and strategies of the manufacturing companies [21,44,45,46,47,48]. These commitments are not only within the EU framework, but the USA Administration has also set targets of 100% CO2-free electricity by 2035 and net-zero GHG emissions by 2050 [49]. The US Long-Term Strategy, called LTS [50], presents, like those of the EU, multiple pathways to achieve a zero-emission economy by 2050 [10].
A growing industrial deployment of decarbonization technologies is being implemented not only in the steel industry but in all sectors where GHG production has a strong impact. In broad terms, there is a common strategy: the use of alternative energies and renewable sources, improvement in the efficiency of the processes and the materials, reduction in methane and other non-CO2 emissions, increased removal of the CO2 produced by capturing it, and use of alternative carbon sources [10,50].
Focusing on the steel process, the availability of the energy and material flow required for steel production should be evaluated as key elements for decarbonization. In this context, eight points are presented as critical by Green Steel for Europe [51]:
  • The consumption of electrical energy from renewable sources.
  • The use and generation of green hydrogen (H2).
  • The consumption of NG.
  • The transition to alternative carbon sources.
  • The consumption of iron ore and pellets.
  • The increased use of scrap.
  • The development and implementation of CO2 storage technologies.
  • The production and use of CCU products.
All of them must be complemented by other framework conditions: the technological maturity of each solution, supply aspects, availability of infrastructure, energy and raw materials, plant-specific investment cycles, as well as financial and legislative conditions, including the EU ETS and the CBAM [7,16,22,51].
Decarbonization in the steel industry requires substantial changes in the supply and production chains. Consequently, the challenge could be likened to a new industrial revolution, both in terms of complexity and duration. The current scenario presents a situation where the global transformation would be possible thanks to a hydrogen-based steel industry, as well as the adaptation of fossil-fuel-based steel processes for residual carbon capture and utilization technologies and, finally, an increase in the consumption of scrap as a raw material and the recycling of steel byproducts. To this end, as illustrated in Figure 4, there are two technological pathways for CO2 reduction in the sector: smart carbon utilization (SCU) and carbon direct avoidance (CDA) [16]. Some proposed and ongoing projects of the EU steel industry have been identified for this purpose [16,52]. Energy, feedstock, and carbon storage are therefore the most important elements in this major challenge.
While it is important to reduce demand for primary steel by increasing the circularity of materials and expanding the secondary steelmaking, achieving net-zero-emissions steel will require reducing emissions from conventional steelmaking as well. To build the groundwork for net-zero steel by 2050, it is essential to commercialize and expand near-zero-emissions primary steelmaking. Several studies have presented a roadmap for achieving net-zero emissions in the production of primary steel, utilizing predictive modeling to outline the essential objectives that need to be met in the medium term [22,53]. These objectives encompass various aspects such as increasing near-zero primary steel production; addressing energy requirements; developing the necessary infrastructure; and incorporating renewable electricity; H2; and carbon capture, utilization, and storage (CCUS) technologies. Additionally, the concept of the Technology Readiness Level (TRL) has been introduced to assess the maturity and feasibility of different technologies during each projected period.
Determining the mix of technologies that will be used in the future for the EU steel industry is challenging due to state and regional conditions such as energy costs, availability, infrastructure, legal restrictions, and the degree of local industrialization. However, a global provider of consultancy services and some steel manufacturers have proposed several scenarios for steel production between now and 2050 based on a CO2 reduction options analysis. These scenarios include business as usual, continued retrofitting, current projects with low-CO2 energy, alternative low-CO2 energy, current projects with CO2-free energy, and alternative pathways with CO2-free energy. Emission reductions ranging from 10% to 95% by 2050 compared to 1990 levels could be achieved depending on the scenario, with energy, raw materials, and carbon storage being critical factors. The scenarios highlight the need for the steel industry to undergo significant changes to reduce its emissions in all energy channels (gas and electricity) used in the steel-production process [16].
Once several promising decarbonization technologies have been identified, they can be grouped into four technological routes and subdivided based on some specific actions [3,10,51]:
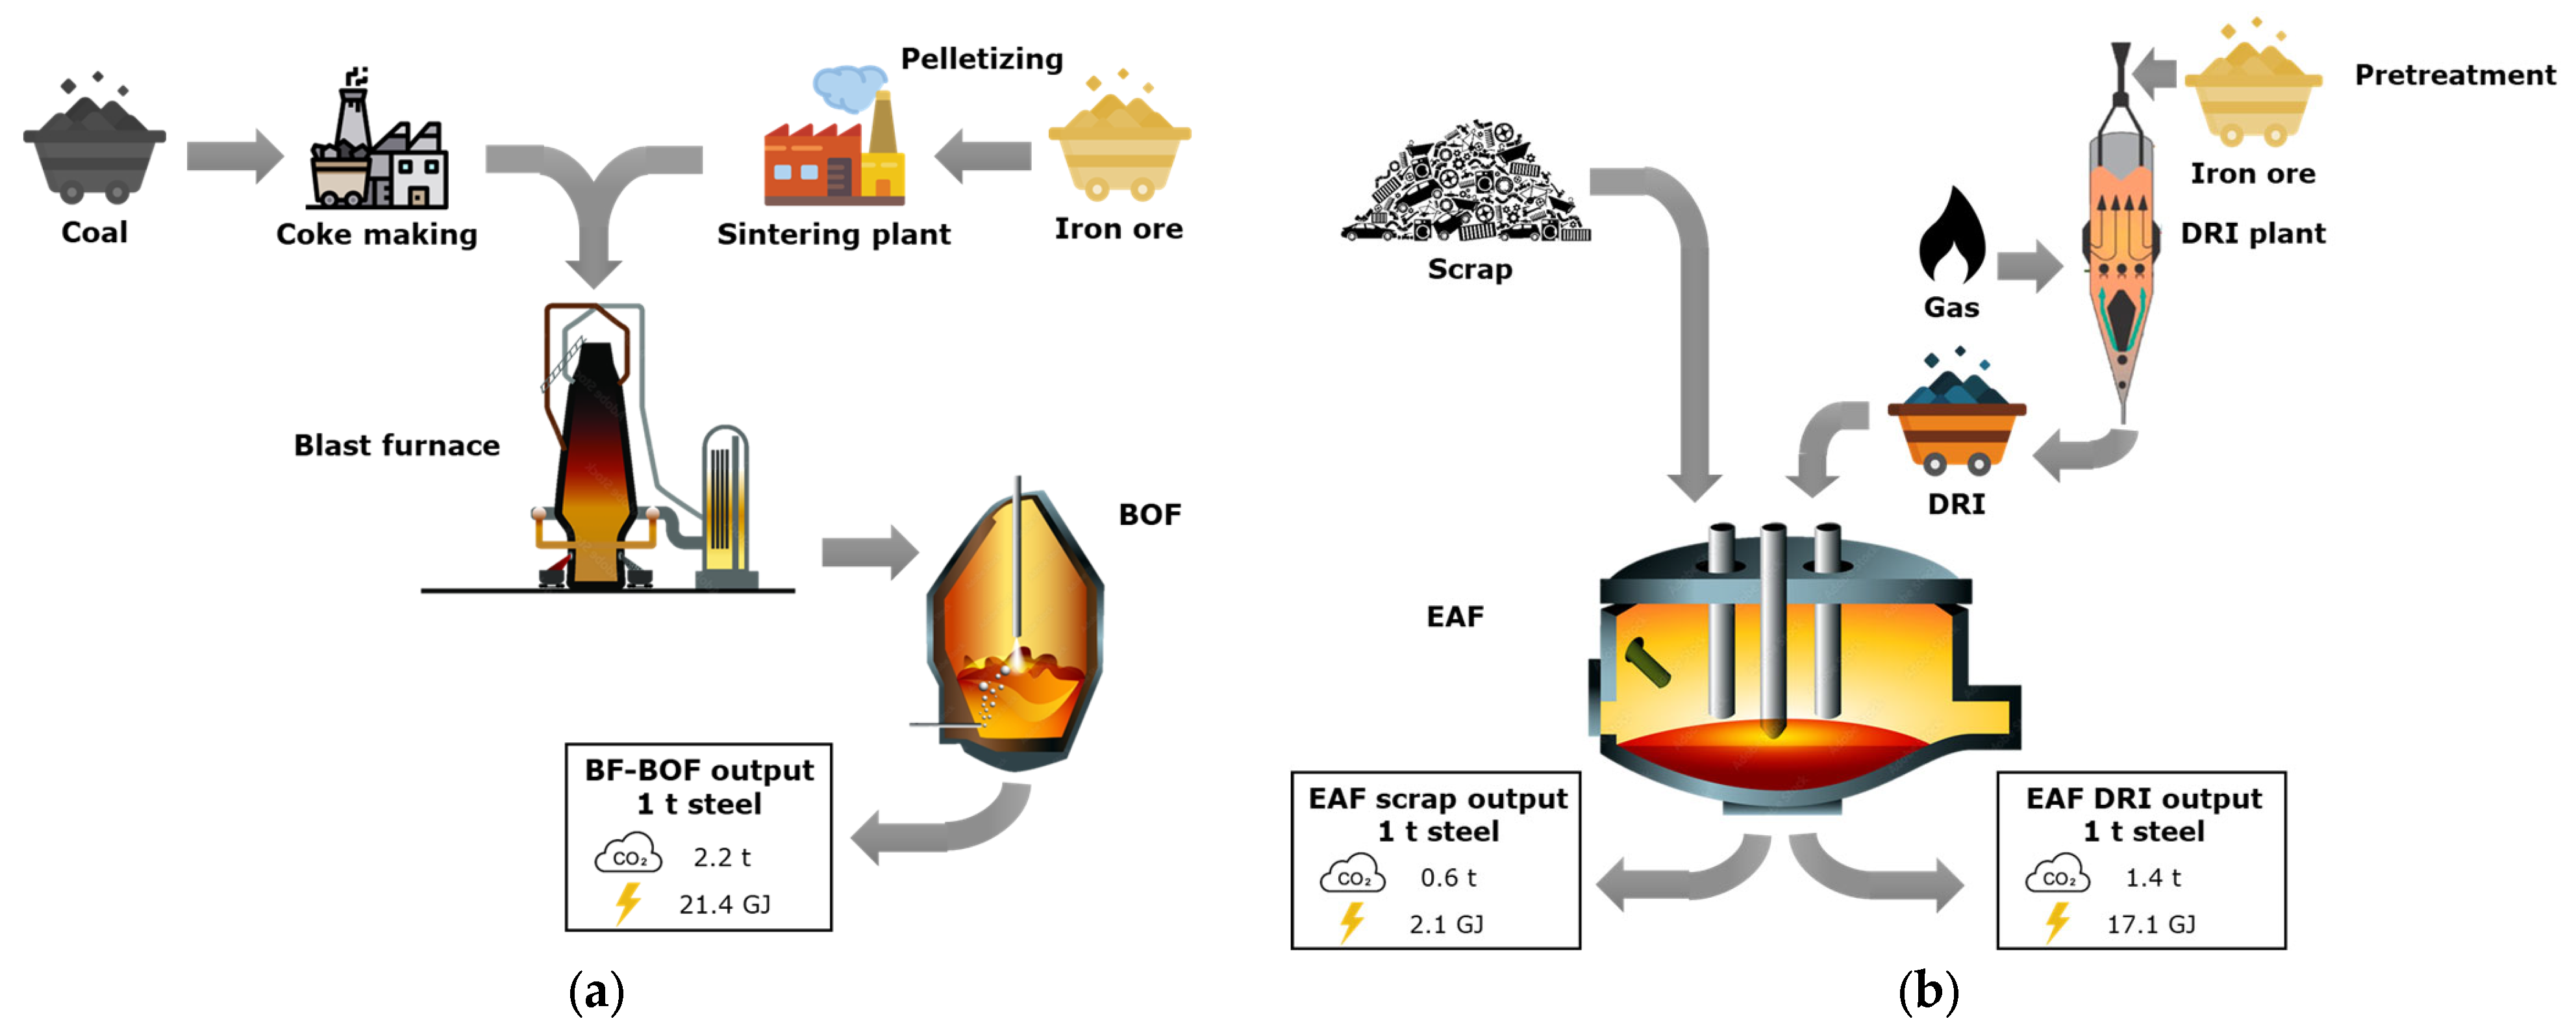
  • The optimized blast furnace–basic oxygen furnace (BF-BOF) route (Route 1).
  • A route based on direct reduction (DR) (Route 2).
  • Reduction by smelting (Route 3).
  • The electrolysis of iron ore (Route 4).
Route 1 is subdivided into the use of alternative carbon sources, CCUS, and other actions (Route 1A, 1B, and 1C, respectively). The DR route is divided into NG (Route 2A) and hydrogen-based reduction (Route 2B). Potential CO2 reduction ranging from 17% to 95% could be achieved depending on the technological route between 2030 and 2050 [51]. Optimized BF-BOF routes (Routes 1A/B/C) and direct reduction-based routes (Routes 2A/B) are considered to reach TRL 9 in 2030–2035 and would start industrial deployment, while smelter reduction (Route 3) and iron ore electrolysis (Route 4) could become options for later industrial deployment in 2050 [51]. Of course, the use of scrap as a raw material must be considered for all routes, as well as HBI for routes where an EAF is present.

2.1. Energy, Raw Materials, and Carbon Capture Overview

The industrial sector, including the iron and steel, chemicals, petroleum refining, and cement subsectors, accounts for a significant portion of energy-related CO2 emissions in the United States. The industrial sector is considered challenging to decarbonize due to its diverse energy consumption and complex processes. In the US steel industry, electricity consumption constitutes around 17% of the total energy consumption [10], with NG being the dominant resource used, making up 37% of the final energy used [54]. Furthermore, NG represented less than 1% in China [24]. Process heating is the largest energy-consuming process in the steel industry, representing around 63%, followed by electric drives at 12% [54]. The future steel sector will have a substantial energy demand, estimated to be around 400 TWh/year in the EU, requiring low-carbon electricity, 162 TWh/year, and green hydrogen, 234 TWh/year, for a production of 5.5 million tons in 2050 [16]. However, there are challenges in terms of the availability of emission-reduction technologies, such as CCS, which may not be universally accessible in the EU. The lack of CCS could limit CO2 reduction to 67% instead of the targeted 74% [16]. Alternative pathways may require increased CO2-free electricity and H2, as well as an enhanced CO2 storage capacity.
Another challenge that arises is the lack of suppliers for key emission-reduction technologies. The availability of an adequate quantity and quality of scrap is also crucial for the decarbonization pathways. Ensuring a steady supply of scrap is essential for achieving the desired emission-reduction targets in the steel industry. Additionally, the development of advanced technologies that enable the efficient use of scrap and promote circular economy principles will be critical for addressing this challenge [55,56]. Table 1 tackles these challenges by demonstrating the primary research strategies to address them, enumerating multiple analyses, solutions, and studies.
Collaboration between stakeholders, including steel producers, scrap suppliers, and policymakers, is necessary to overcome these obstacles and establish a sustainable and low-carbon steel industry.

2.2. Hydrogen

Hydrogen is emerging as a critical component in the decarbonization of the steel industry [31,32,53,77,78]. It serves as a versatile resource, finding applications in the production of DRI as well as in various processes that require thermal energy provided by burners, such as the reheating furnaces and the refractory heating in the ladles. By using or increasing the use of H2 to replace NG in these processes, the industry can significantly reduce its carbon footprint. Currently, 70 million tons of H2 are directly produced, 76% of which are derived from NG, 23% from coal, and 1–2% from electrolyzers, while 48 million tons of H2 are produced as byproducts. Considering that almost all these tons of H2 are produced from fossil fuels, the annual production of H2 results in the emission of approximately 830 million tons of CO2 per year [79]. The analysis of CO2 emissions associated with various H2 productions reveals important insights into both production technology and energy origins, as revealed by the inclusive dataset [79,80]. Electrolysis with 100% renewable energy is the greenest option, emitting no CO2. In stark contrast, coal-based electrolysis emits a significant 51.6 kg CO2/kg H2, while NG and nuclear energy emit 23 kg and 1 kg CO2/kg H2, respectively. Among the steam methane reforming (SMR) technologies, those based on biowaste and landfill gas exhibit the lowest CO2 emissions. Alternative gasification methods feature numerous variations, wherein waste wood and solid recovered fuel (SRF) emit less than coal-based techniques. This exhaustive analysis highlights the pivotal significance of factoring in both the technology and energy source to create a carbon-neutral course for hydrogen production, thus supporting the reduction in CO2 emissions [81]. Onsite renewable-based hydrogen production could drive 35–45% of steel production by 2050, demanding 52–75 million tons of H2 yearly [22,82].
In 2018, Europe had a total annual H2 production capacity of 11.5 Mt [51]. The International Energy Agency (IEA) [83] estimates a range of 47–68 kg H2/t DRI for hydrogen-based DRI production, so assuming a H2 demand of 60 kg H2/ton of crude steel through direct reduction, this H2 production capacity would only cover 0.2% of the primary steel-production demand [51,84]. Current H2 production capacities are either onsite for self-consumption in commercial production facilities or in plants where hydrogen is a byproduct coming from other processes. The distribution of production capacities varies among different countries, with Germany leading in hydrogen production, followed by the Netherlands, Poland, and Italy [51]. Thus far, most of the produced H2 has been used in oil refineries and chemical synthesis production (ammonia and methanol, among others), with only a small portion, around 2%, being utilized by other industries [9,54].
Hydrogen-production methods differ in technology and energy sources, leading to varying CO2 emissions. Produced hydrogen is categorized and classified with different colors based on the method used [85,86]. “Green” or “renewable hydrogen” is made through water electrolysis with renewable energy, resulting in minimal CO2 emissions [24,82,87]. Water-based production is less than 1%, using Alkaline, PEM, and the less-mature SOEC electrolysis [79]. Currently, the EU primarily produces grey hydrogen, with steam methane reforming being the most common production process [9,87]. Depending on the technology and feedstock used, fossil-based processes emit between 12 and 30 t CO2-eq./t H2 [82].
It is important to emphasize that H2 production, transportation, storage, and corresponding infrastructure are crucial for the successful deployment of hydrogen-based technologies. Assuming a strong grid connection to supply the necessary electricity, steel producers can potentially produce hydrogen onsite, significantly reducing transportation costs [51]. Other options for H2 production include locations with easy access to large quantities of low-cost renewable electricity or locations where electricity availability fluctuates drastically and H2 production can be used for grid balancing, such as large offshore wind farms connected to the national grid [88]. The main drawback of H2 is its low density, which makes its storage and transportation complex. A classification of the different technologies for storage and transportation is presented in [89].
Currently, there are approximately 1500 km of hydrogen pipelines in operation in Europe, but most H2 is currently produced at the point of demand [88]. According to the Hydrogen Backbone Initiative [90], a hydrogen network of 6800 km is projected for 2030, expanding it to 22,900 km by 2040 [51]. The EU and several countries have already published hydrogen strategies to foster its development by 2050 [85]. Other national strategies are still under development [9,51].

2.3. Electricity

This decarbonization paradigm leads to the highest-ever need for affordable and CO2-free electricity. The 5700–6700 TWh/year of clean electricity required by the global steel sector by the midcentury would be more than twice the total energy production of the European Union member states in 2020 [22]. Providing a robust and secure supply for these enormous amounts of clean energy represents a critical factor in unlocking decarbonization in the steelmaking industry and will require extensive infrastructure construction and improvement [91]. Given the high level of planning required for this infrastructure, as well as for the transmission and the distribution networks and the generation assets, preparation must start now.
In 2020, the total electricity production in Europe was 2760 TWh, 38% of which was generated from renewable sources, 25% from nuclear power, and 37% from fossil fuels [51,92]. Most of the energy generated in the past was based on fossil fuels. However, in recent years, the share of electricity generation from fossil fuels has decreased in all European countries due to the development and expansion of renewable energy generation, as well as the decommissioning of several thermal power plants [92]. Since cross-border electricity flows account for less than 10% of total electricity production in the EU-27 [93], electricity generation was assessed at the national level.
From 2010 to 2020, the average annual growth of wind and solar energy was 38 TWh, which means that the annual increase would need to nearly triple between 2020 and 2030 to achieve the European Green Deal target for 2030 [94]. According to the literature, national energy and climate plans currently reach around 72 TWh/year, which would mean that the necessary increase of 100 TWh/year and the associated energy targets would not be met [51,92].
Alongside the increase in renewable energy generation, carbon intensity has decreased in the EU from an average of 317 g of CO2/kWh in 2015 to 226 g in 2020 [51]. This represents a 29% decrease between 2015 and 2020. In addition to considering the CO2 intensity of electricity production and its price, the overall availability of electricity must be considered. Approximately 43% of steel plants are in areas with access to low-cost renewable energy and resources, including locations that also have access to low-cost NG. On the other hand, up to 39% of the current steel plants may not be situated in optimally suited areas for low-cost renewables, NG, or CO2 storage. The remaining 17% is attributed to plants that have access to low-cost CO2 storage [91].
Forecasts for the year 2050 estimate a demand of approximately 400 TWh/year of CO2-free electricity solely for the European steel industry. This quantity also includes the production and use of hydrogen and is equivalent to 15% of the current total electricity production in the EU-27 [51].
Although the trajectory of scenarios is to achieve net zero by 2050, early advancements in the 2030s are essential. Gradual improvements in current steel technology and the progressive decarbonization of electricity grids could reduce emissions by 10% in 2030 compared to 2020, with a reduced additional cost. However, incentivizing an early transition to technologies with a higher reduction potential could achieve much more pronounced reductions in this decade and drastically reduce cumulative emissions [22].

2.4. Policy and Decarbonization Barriers

Decarbonizing the steel industry is crucial, but it faces numerous complex challenges. It is essential to integrate decarbonization technologies into existing steel plants due to their extended investment cycles, coupled with the need for energy, material, and cost efficiency in mixed integrated facilities. Nevertheless, the staggering cost, potentially amounting to EUR 20 billion per year, presents a significant financial hurdle [7]. Although funding opportunities have expanded, there is still a significant shortfall. Creating a policy environment that promotes low-carbon steel production through funding mechanisms is crucial. Moreover, ensuring the availability of affordable renewable electricity is essential, despite facing obstacles such as permitting procedures, electricity storage, and regional pricing disparities.
Decarbonization strategies entail CCUS, yet face regulatory-, infrastructural-, and consciousness-related obstacles. Tackling these difficulties calls for more flexible regulations, enhanced infrastructure, and greater public awareness. Vital components of steel decarbonization comprise the Carbon Border Adjustment Mechanism (CBAM) and green procurement. The CBAM stimulates demand for low-carbon steel, ensuring equitable pricing and generating revenue. Public procurement constitutes a significant share of the EU’s gross domestic product and can bolster the demand for low-carbon steel by integrating environmental criteria. An enabling policy framework is necessary to promote the circular economy, specifically with regard to high-quality steel scrap. It is highly desirable to have public support for research and to restrict scrap exports. Stakeholders have highlighted the considerable challenges posed by financial barriers to decarbonization. Addressing these obstacles requires policy-driven solutions, which are of critical importance. In addition, stakeholders have stressed the need to ensure the availability of renewable energy and long-term environmental legislation. Overcoming these obstacles requires policy adjustments at both national and European levels [7,95].
To overcome the challenges of decarbonizing the steel industry, a thorough policy framework, innovation, and cross-sectoral collaboration are indispensable. The European Union Emissions Trading System (EU ETS) is a significant factor in this regard, as it has a considerable impact on carbon emissions [96]. Figure 5 shows the progression of EU ETS prices from the beginning of 2021 to the end of 2022. Although the steel industry has been shielded from carbon pricing by the allocation of free emission allowances within the EU ETS, it has not been incentivized to adopt low-carbon technologies [97]. Innovative breakthrough technologies may be disadvantaged, and low-carbon investments have been hindered by low and volatile carbon prices [8]. The introduction of the CBAM is proposed as an alternative to free allowances to mitigate carbon leakage risks and integrate the carbon cost into production [98]. This is especially pertinent to the steel sector. Addressing the decarbonization challenges faced by the steelmaking industry necessitates the implementation of wide-ranging policy measures that properly align carbon pricing, encourage innovation, and promote investments in low-carbon technologies.

3. Decarbonization Strategies by Top Steel Producers

In the second decade of the 21st century, overcapacity became one of the main concerns from the industrial benefits’ point of view due to the global economic situation. This concern needs a major focus on innovation to face the new challenging scenario. Apart from this, the need for new measures to abate global climate change is provoking a new shift in the steelmaking paradigm as the steel industry is responsible for 7–9% [100] of the 40 Gt of CO2 emitted by human activities each year. Consequently, the international steel industry is under immense pressure to lower its CO2 emissions.
Top steel producers have already set ambitious goals to become carbon neutral in the coming years (EU by 2050 [101] and China, by far the largest steel-producing country, by 2060 [102]). To fulfill these goals, many technologies are being proposed, developed, and evaluated.
The proposed roadmap of some of the main steelmakers [103,104,105,106,107,108,109,110,111] can be simplified as follows:
  • Short term: sinter replacement by pellets, ferrous scrap usage’s increase, increase the energy efficiency of the processes, and start replacing NG with H2.
  • Midterm: include CCS and start using pure H2 as a reductant.
  • Long term: full deployment of H2 technologies to produce steel and use renewable energy sources.
Within this context, H2 plays a critical role in the decarbonization pathway in steelmaking, and this can be seen by looking at some of the ongoing hydrogen-based projects in Europe [107].
Although replacing NG with H2 as a reductant element seems to be one of the main pillars in the decarbonization roadmap, no technoeconomic feasibility study nor the industrial gas volume availability for coping with future steel demands are assured for the time frame set by the steelmakers. Moreover, all the models are based on predictions over energy markets, CO2 taxes, and novel technologies’ prices’ evolution.
Apart from the hydrogen-based technologies, near-net-shape casting, smelting reduction, top gas recycling in the BF, CCU, and iron ore electrolysis are other technology near-zero-emissions options [111].
Table 2 depicts a simplified technological view of different decarbonization strategies, highlighting the main challenges, the time horizon for implementation, as well as the cost impact.
The other main driver for achieving decarbonization is steel recycling. The endless cyclic use of scrap as a raw material is one of the most important characteristics from a sustainability point of view and one of the strengths of steel. In fact, when scrap is recycled, the new steel inherits the properties of the original materials, and these can be modified during the steelmaking process or through ulterior thermal processes.
Consequently, scrap-based steelmaking and the replacement of the BF-BOF route with the DRI-EAF route seem to be the industrial trend for most steelmakers.
Although scrap-based processes will gain importance in future steelmaking, primary steel production will be kept. One of the main reasons for this is the scrap’s availability, which is defined by the past production and the current recycling rate. Nowadays, steel’s recycling rate is around 85% since there is some low-quality scrap that is not being reused.
To increase the recycling capacity and energy efficiency, innovative technologies to “treat” the scrap before it reaches the steelmaking reactors need to be implemented; impurities in postconsumer scrap should be reduced before melting the scrap with a better-classified one. In this way, scrap use would increase while achieving the same quality in the finished product. To achieve this, the following goals have been proposed [55]:
  • Identify and characterize new opportunities to use and reuse lower-quality scrap by having a better understanding of the scrap market and the opportunities.
  • Select and integrate the best available technologies to upgrade, sort, and characterize lower-quality scrap to enhance the scrap quality.
  • Create industrial demonstrators of scrap sorting/cleaning based on innovative combinations of BATs.
  • Define valorization routes of the waste generated by the upgrading schemas.
To outline a path towards climate-neutral steelmaking, Table 3 shows the four pillars for decarbonizing: (1) efficiency; (2) industrial electrification; (3) the adoption of low-carbon fuels, feedstocks, and energy sources; and (4) carbon capture and utilization [10]. Energy efficiency pillars offer the greatest opportunities for short-term decarbonization solutions. In many cases, it does not require major changes in the industrial processes and can immediately contribute to emission reductions. Regarding industrial electrification, more than 50% of all energy is used for thermal processes, and less than 5% of these operations are electrified [112]. Low-carbon fuels, feedstocks, and energy sources (LCFFES) propose the adoption of clean energy technologies that do not release GHGs into the atmosphere from energy production or use. Finally, the energy efficiency, LCFFES, and electrification pillars can be implemented before CCUS and, together, can reduce 40% of the projected emissions [14]. These pillars offer a framework for implementing sustainable practices and achieving near-zero CO2 emissions.

4. Use Cases

The decarbonization of the steel industry necessitates exploring various vectors; hydrogen has emerged as a promising solution, and electricity is considered one of the key pathways. This section describes the incorporation of hydrogen and the advantages of integrating renewables and storage and their impact on efficiency and emissions. By exploring these use cases, valuable insights are gained into the transformative potential of hydrogen and new electrification approaches in driving decarbonization and shaping the future of the steel industry.

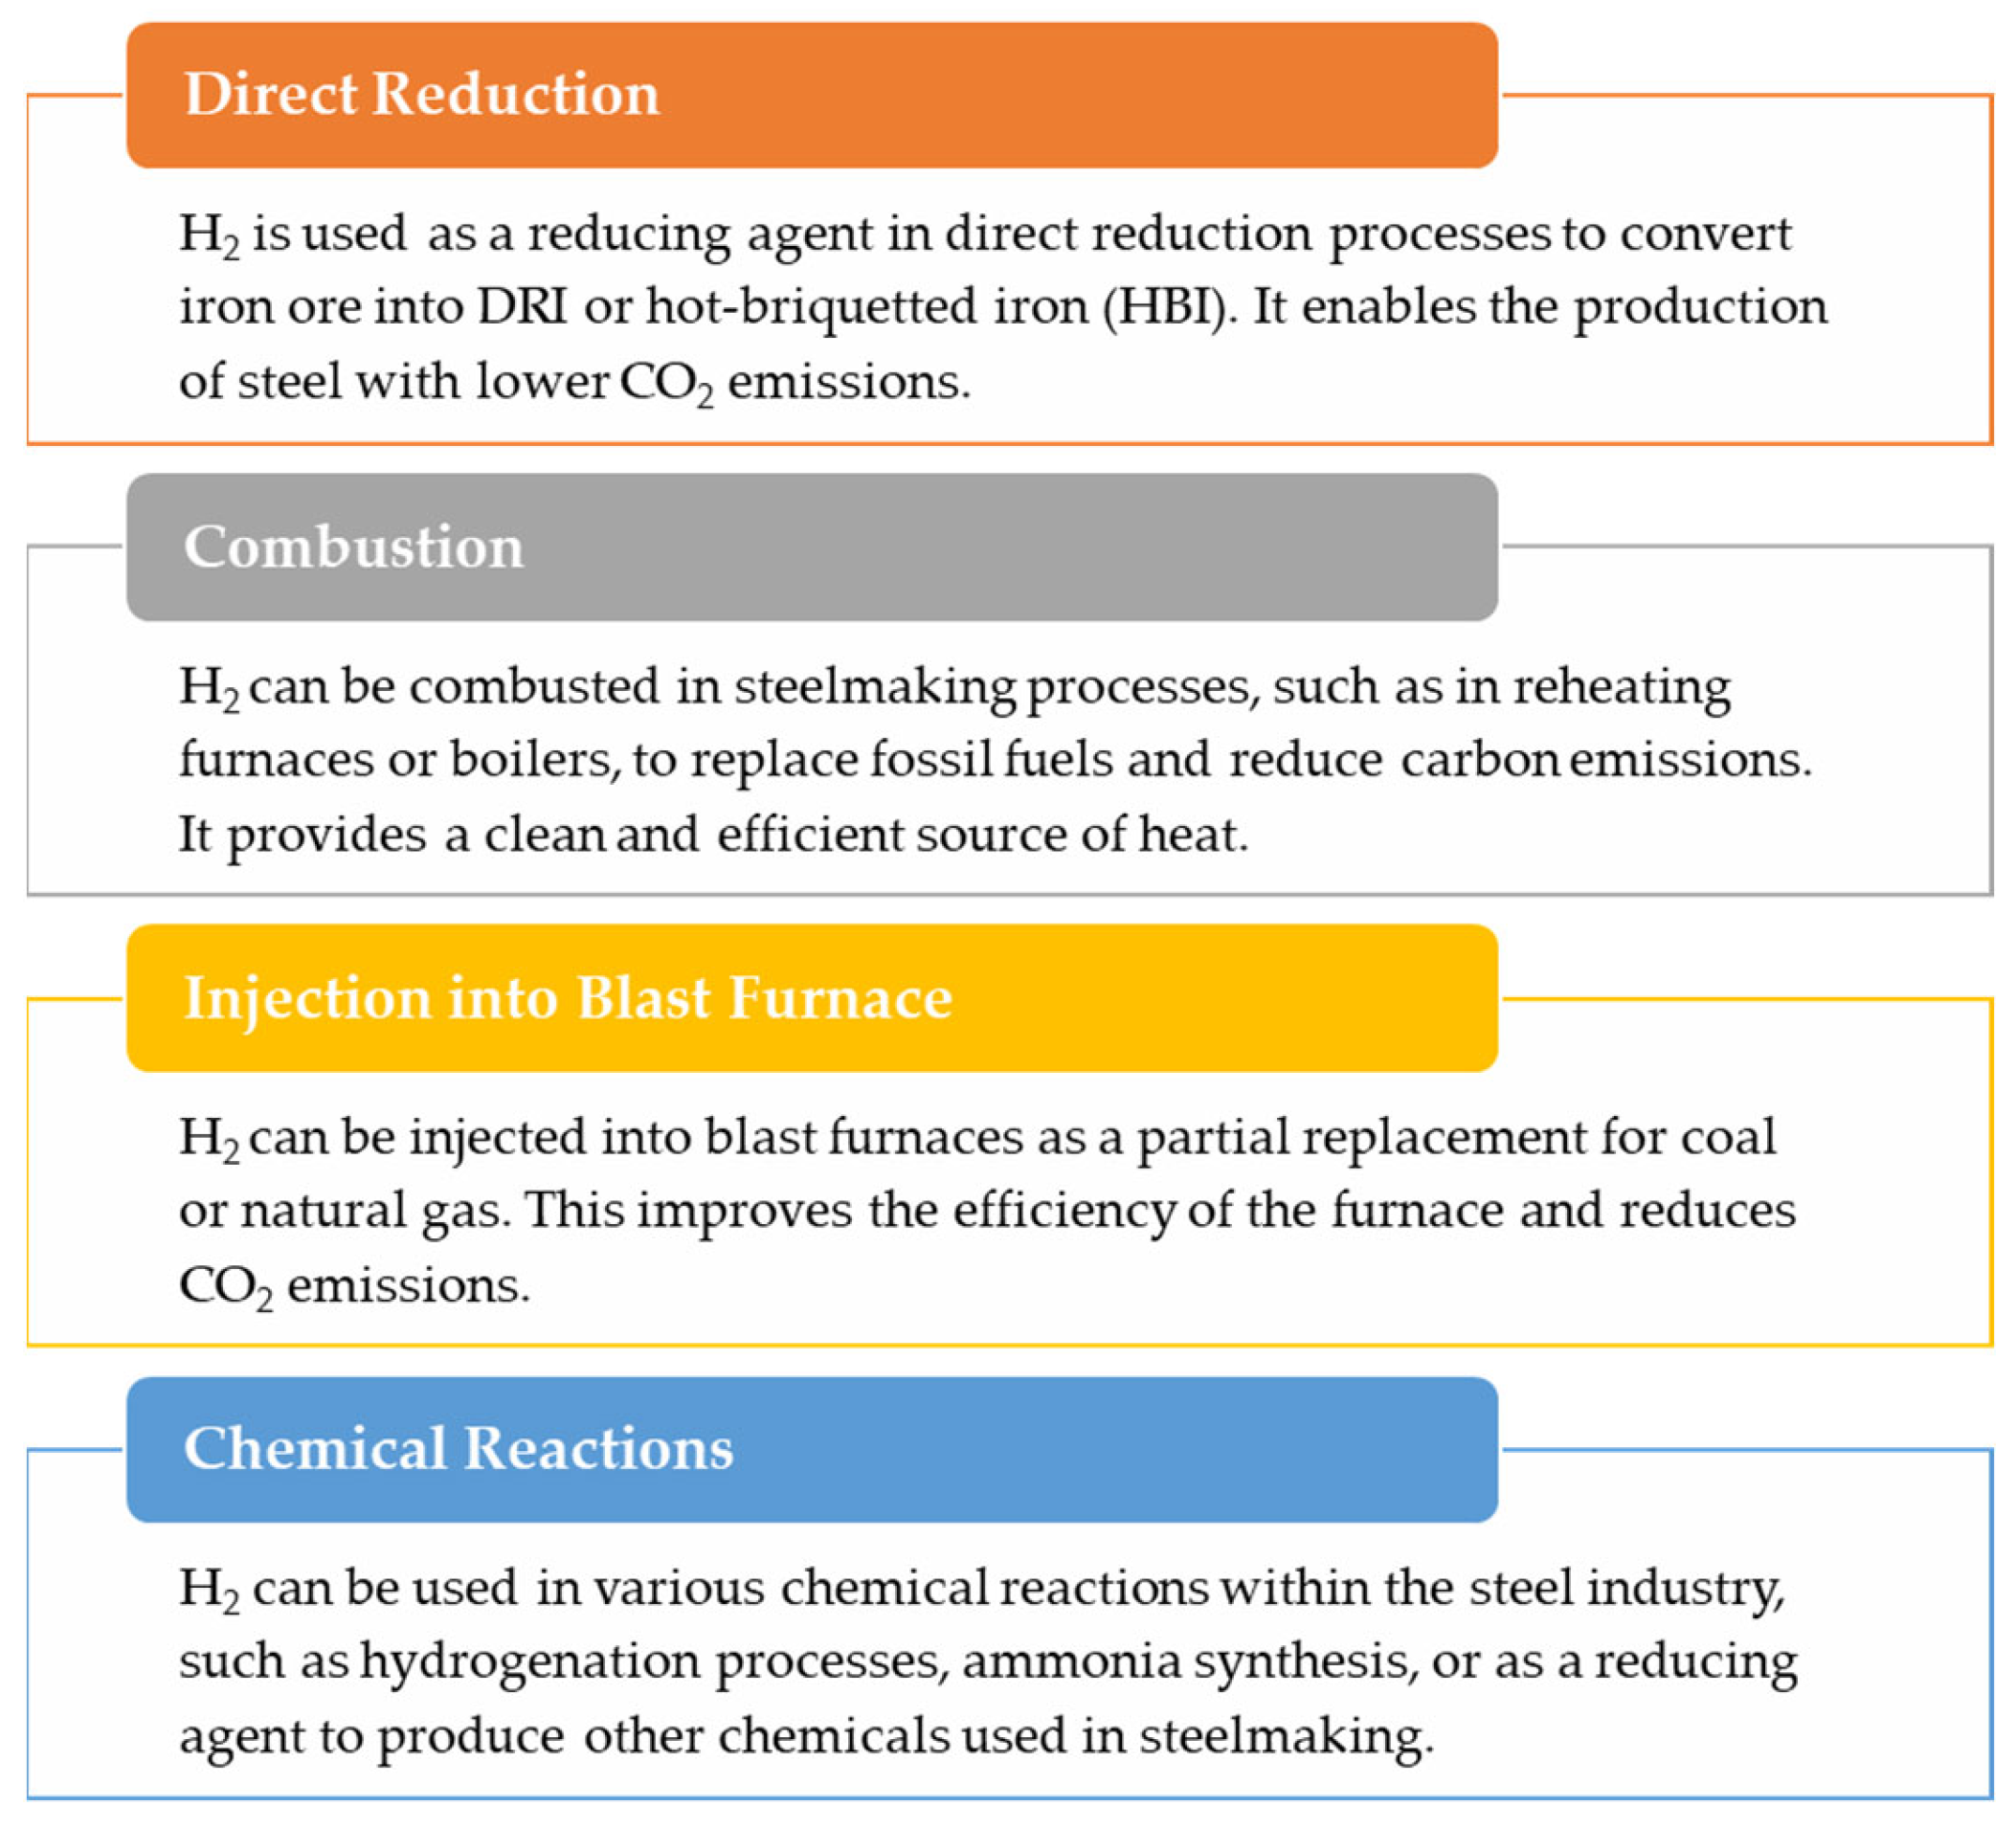
4.1. Hydrogen in the Steel Sector

Nowadays, the steel industry demands 4 million tons of H2 per year through the DRI route. Additionally, in the integrated route (BF-BOF), approximately 14 million tons of H2 are produced annually as a byproduct of steel gases, mainly coke oven gas (COG) and blast furnace gas (BFG). Of all the H2 produced as a byproduct, around 9 million tons of H2 are consumed internally, while the remaining amount is exported to other sectors. The primary use of this internal H2 is for combustion or electricity generation. However, the use of H2 contained in COG for injection into the BF or for chemical synthesis purposes is gaining importance [79]. Currently, around 60% by volume of COG is H2 gas.
Figure 6 shows different applications of hydrogen in the steel sector, ranging from direct reduction processes to combustion, injection into blast furnaces, synthesis gas production, and participation in chemical reactions. Each utilization method offers unique benefits in terms of CO2 emission reduction, energy efficiency, and process optimization, contributing to the overall goal of decarbonizing the steel industry.
Focusing on the DRI route, the goal is to gradually decarbonize the process. Several stages have been identified to achieve this objective:
  • Utilize renewable energy for the EAF operation.
  • If fossil fuels such as NG are still being used:
    • Gradually increase the H2 content.
    • Capture CO2 emissions from the DRI process.
    • Reuse the captured CO2 within the process.
  • Incorporate H2 in the DRI process:
    • Use blue hydrogen.
    • Transition to 100% green hydrogen.
    • Achieve the goal of complete decarbonization.
On the other hand, for the BF route, various initiatives to decarbonize this pathway using H2 include:
  • Injecting H2-rich streams or biogas to replace coke consumption.
  • Fix CO2 into a chemical compound by using additional H2.
These strategies aim to progressively reduce carbon emissions in the steelmaking industry, both in the DRI and BF routes. By implementing these steps, the sector can move towards its decarbonization goals while considering the specific challenges and opportunities associated with each process. It is important to note, as stated in Section 2.2, that a thorough evaluation of the carbon emissions related to hydrogen production necessitates a dual approach. This entails examining both the production technology and the energy source used in the process with equal consideration.

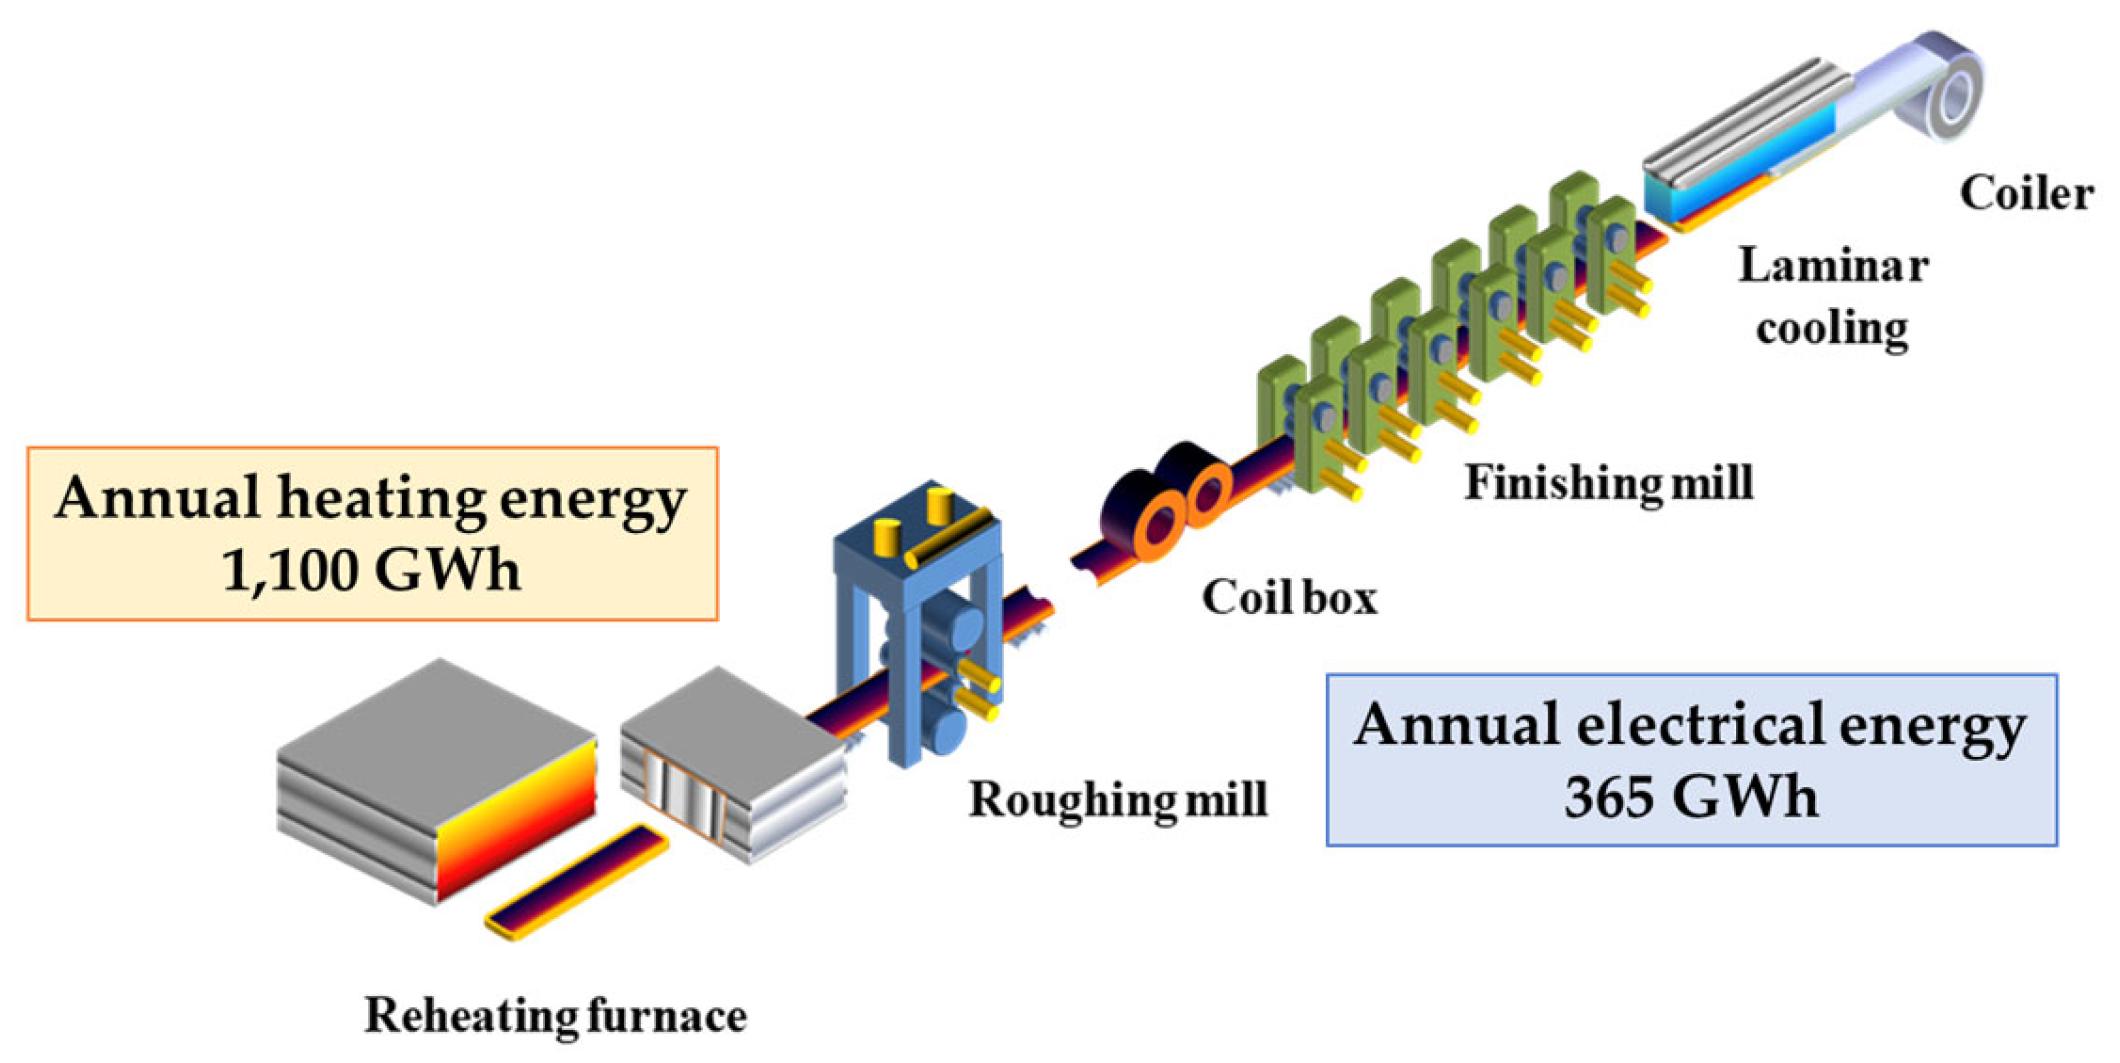
4.2. Use Case 1: Hot Rolling Mill

4.2.1. Average Values of Electrical Energy Demand in a Hot Rolling Mill

For the calculation of the average values of the electrical energy demanded, an average consumption of between 70 and 80 kWh/tsteel is considered; it is also considered that the rolling mill is capable of rolling between 20 and 30 slabs/h, that each slab has a weight of between 22 and 26 t-steel/slab, and that between 470 and 530 slabs/day are rolled daily. The result of these numbers means that the average daily consumption of electrical energy is 1 GWh. The annual electricity consumption of a classical hot rolling mill is thus estimated at 365 GWh.
The heating furnace serving the rolling mill is assumed to consume 1.2 GJ/tsteel [145,146] or 333 kWh/tsteel. Multiple parameters (some related to the dimensions of the steel slabs, others to the characteristics of the furnace itself) affect the average energy consumption. Depending on the type of fuel and the combustion technology, energy consumption is also different (air-fuel combustion using methane as fuel would demand 400 kWh/tsteel while conventional oxyfuel using methane as fuel would demand 290 kWh/tsteel and flameless oxyfuel using methane as fuel would demand 270 kWh/tsteel) [147]. Considering that an average of 500 slabs are rolled daily and that each slab has a weight of 24 tons, this means the average consumption is 3.9 GWh/day. The slab heating can be optimized with existing techniques and achieve a reduction in the heat losses in the furnace by up to 20%. An average daily consumption of 3.2 GWh is therefore considered, which results in an annual energy consumption of 1100 GWh. Figure 7 depicts a standard layout of a hot rolling mill, with the consumption values justified above.

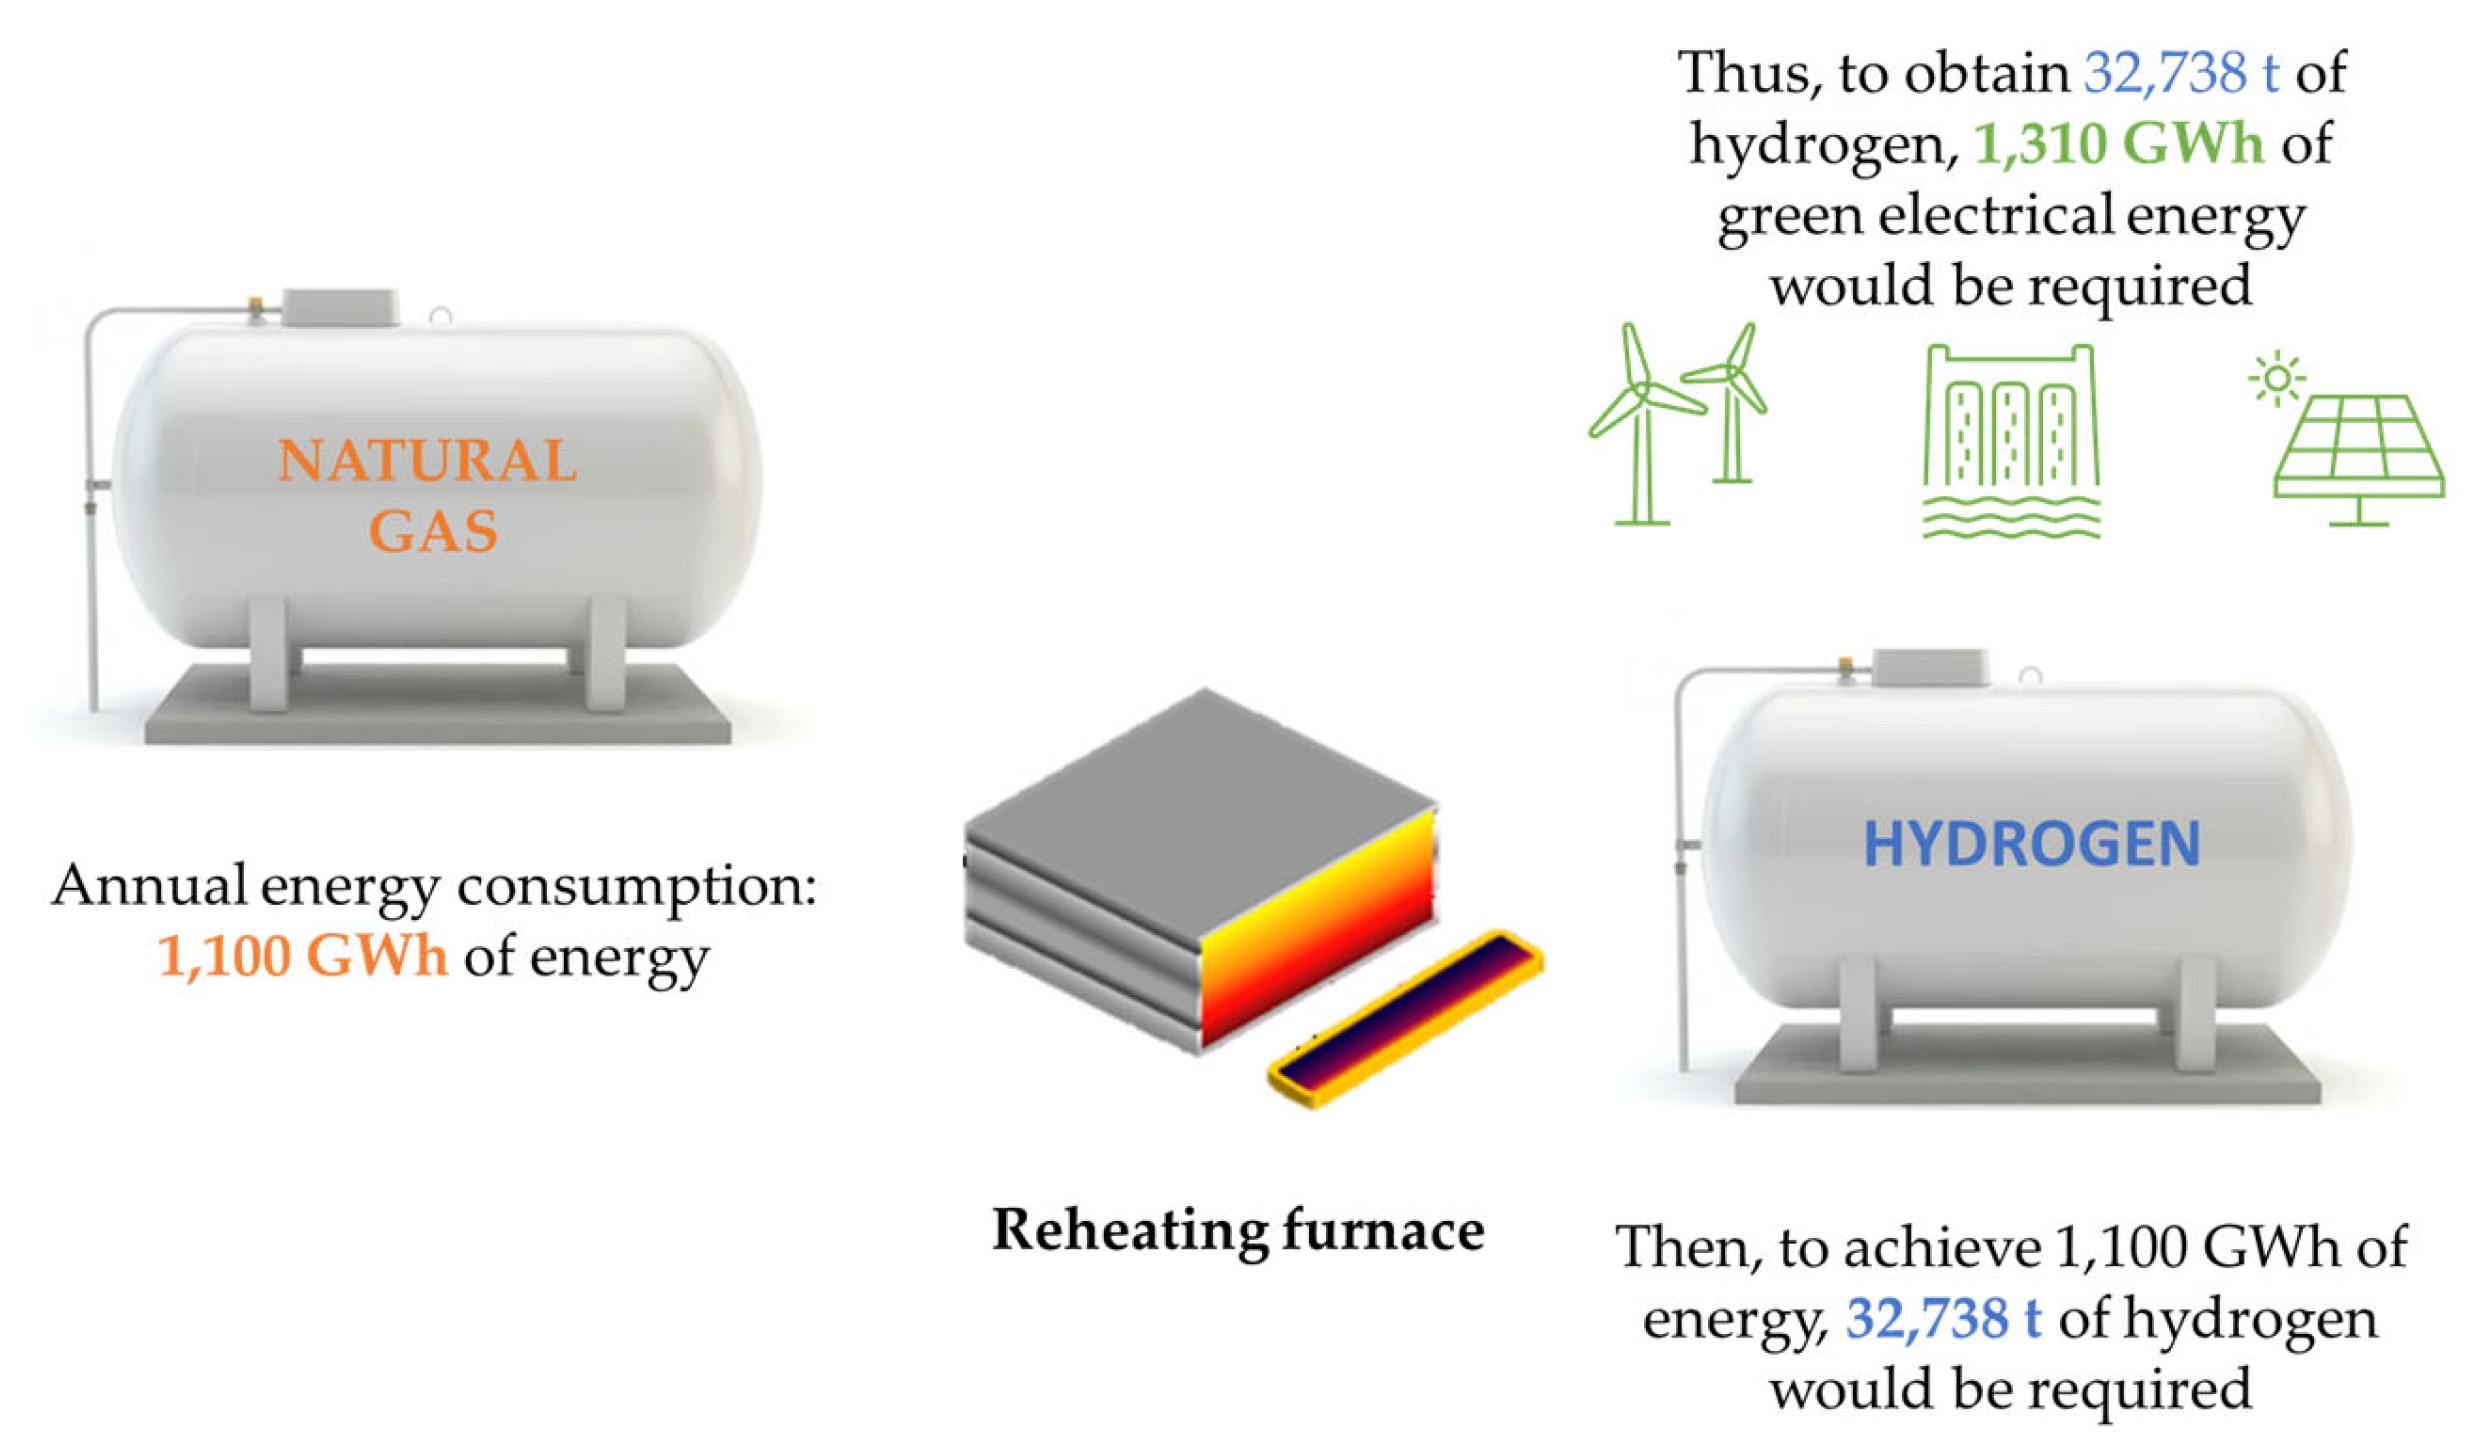
4.2.2. Hydrogen as a Reheating Furnace Fuel

To ascertain the required quantity of green hydrogen to achieve the target of 1100 GWh illustrated in Section 4.1, it is imperative to account for the energy content inherent in the hydrogen. The lower heating value (LHV) of hydrogen is approximately 33.6 kWh/kg. It is important to note that this value may vary slightly depending on the production method and the purity of the hydrogen. However, as a general approximation, 33.6 kWh/kg is commonly used as the specific energy of green hydrogen. Thus, to obtain 1100 GWh of energy, 32,738 tons of hydrogen would be required.
On average, modern electrolyzers have an electrical energy consumption of approximately 45 to 60 kWh per kilogram of hydrogen produced [80]. This value represents the amount of electrical energy required to split water molecules into hydrogen and oxygen through the electrolysis process. It should be emphasized that Figure 8 solely reflects the energy consumption attributed to the electrolysis process and does not encompass any supplementary energy losses occurring during hydrogen compression, storage, or transportation. Thus, to obtain the required 32,738 tons of hydrogen, 1310 GWh of green electrical energy would be needed. Nevertheless, it is noteworthy to mention that continuous advancements in electrolyzer technology and ongoing system optimizations are steadily enhancing the energy efficiency of green hydrogen production. Newer electrolyzers may achieve higher efficiencies and reduce the energy consumption required per kilogram of hydrogen produced.
Figure 8 presents a summary of the energy requirements and hydrogen levels needed to decarbonize the reheating furnace based on the given assumptions.
One observation to make is that while H2 is employed as a fuel in other sectors like petrochemical or steam production, manufacturers of air burners for reheating purposes have recently begun improving their best low NOx technique burners to operate solely on 100% H2. This is due to a spike in NOx during the combustion process for H2. Many industrial suppliers have conducted successful trials and integrated these new burners, along with innovative advancements for H2 combustion applications [148,149,150,151].

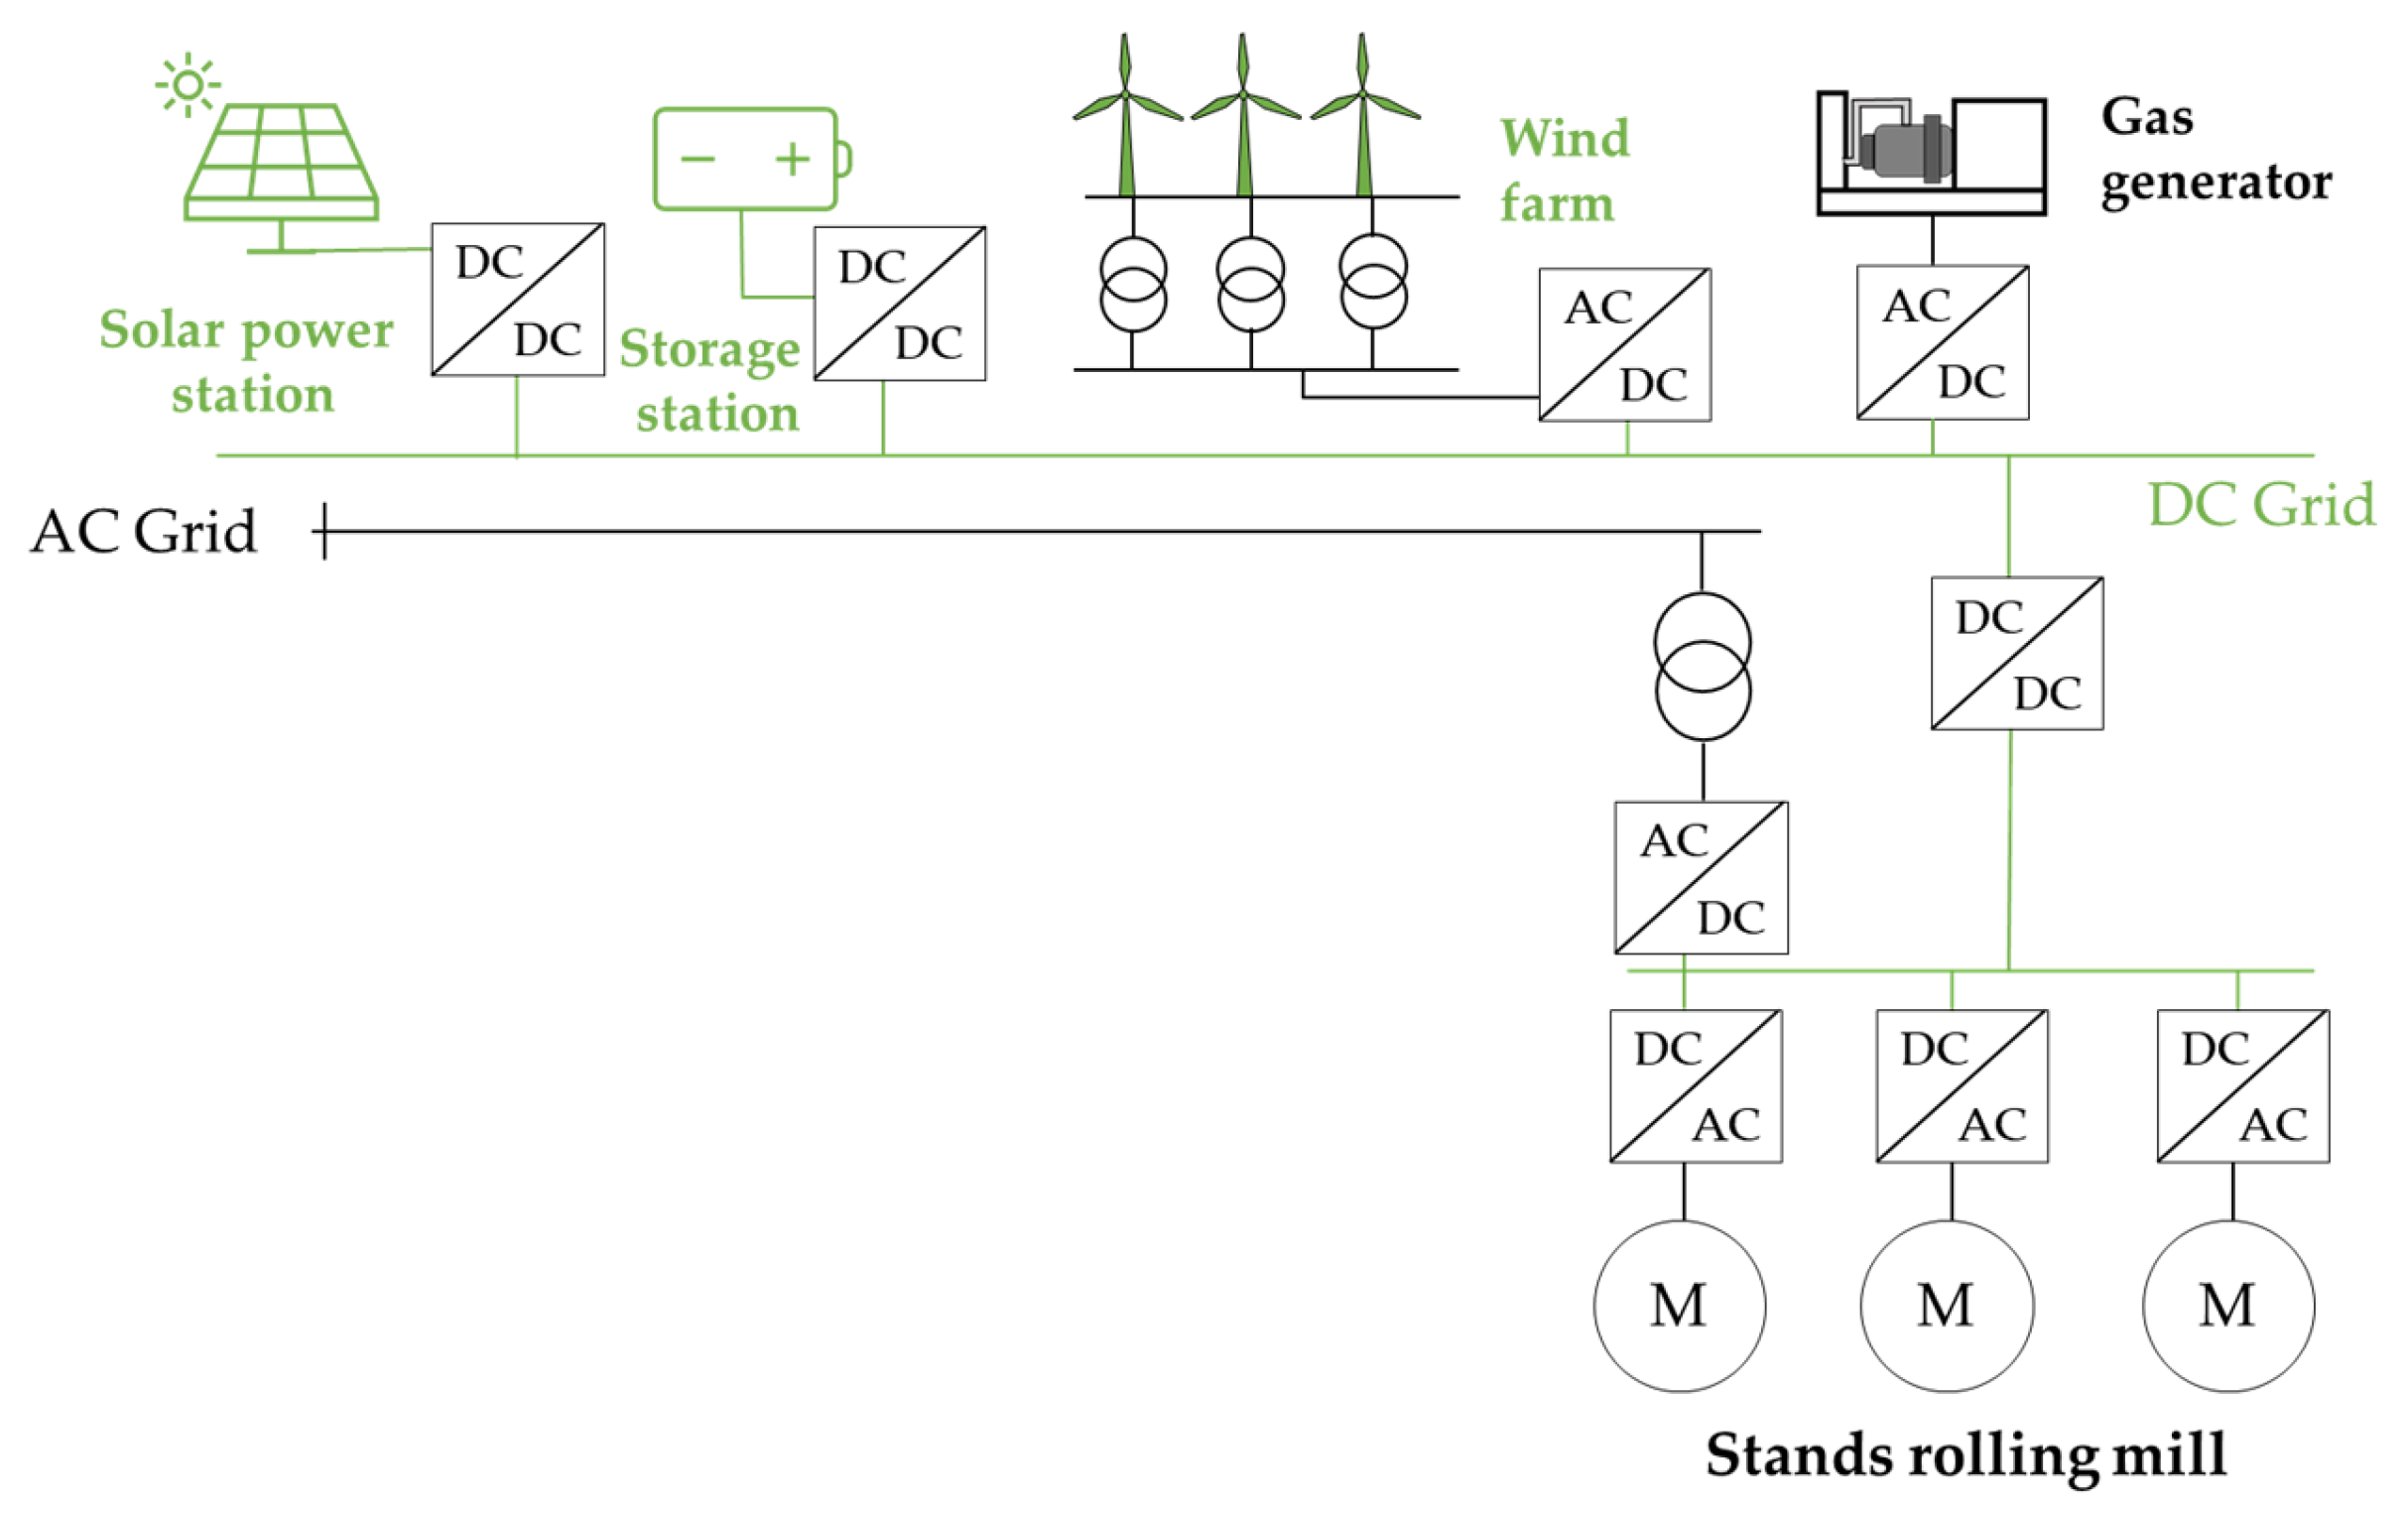
4.2.3. New Electrification Approaches

The steel industry is actively pursuing decarbonization strategies, and one promising avenue is the incorporation of new power system approaches. This section explores renewable energy production, battery storage systems, drive upgrading, and the use cases of direct current (DC) buses with a focus on two inspiring concepts [152,153] and energy-management optimizers. The emission reductions resulting from the incorporation of these cases are quantified and presented in Section 4.2.4. These concepts and innovative technologies leverage these advantages in use cases to revolutionize steel production and minimize its environmental impact.

Renewable-Energy-Production Systems

Overall, as outlined in Section 4.2.2, the hot rolling mill and the reheating furnace would require 1675 GWh of electrical energy annually from renewable sources. Four renewable-energy-production systems are evaluated to meet this energy requirement.
This includes two wind farms. Each wind farm consists of 25 wind turbines with a rated power of 4.5 MW/turbine that forms a wind farm with a rated power of 112.5 MW. The wind farms are in an area where the average annual wind speed has been estimated at 7 m/s. Under these conditions and considering that the manufacturer’s estimated annual production for that wind speed is 13.5 GWh (Figure 9), each wind farm could potentially generate 337.5 GWh/year, thus covering 20.15% of the electricity needs. Globally, the two wind farms would cover 40.3% of the energy needs.
A solar photovoltaic plant consists of two plants with a peak power of 60 MWp. Based on the annual peak sun hours (PSH) forecast for the chosen location (1800 PSH) and the global average performance ratio (of an approximate value of 85%), each of them would cover 91.8 GWh/year. Overall, the solar plant would produce 183.6 GWh/year, which would provide 11% of the energy needs of the rolling mill.
A biomass power plant is capable of producing 50 MW of electrical power from agricultural and forestry byproducts from areas near the facility. The biomass power plant produces 400 GWh/year, which would provide 23.88% of the energy needs of the rolling mill.
The remaining energy required to meet the demand will be acquired from a power plant that uses residual gases from the steel-manufacturing process as fuel to drive a 125 MW gas turbine. The capacity factor of gas turbines in industrial plants that use residual gases can vary greatly. It may vary from as little as 20% to as much as 80% or more, depending on the following factors. Maintaining a reliable and abundant supply of high-quality residual gases and optimizing the gas turbine for the specific gas composition can result in a higher capacity factor for the industrial plant. However, the limited availability of residual gases or inferior quality with lower heating values can lead to a lower gas turbine capacity factor. Given a capacity factor of 40%, the residual gas-based system can generate up to 438 GWh/year, accounting for approximately 26.15% of the plant’s energy requirements. Together, the three systems can provide 101.3% coverage of the energy demand. The surplus of 1.3% is consumed during storage system charging and discharging processes and energy-distribution periods. Obviously, with the current technology and considering an ambitious scenario in which all the energy used is of renewable origin, the rated power of the generation units required is, at present, high.
Figure 10 summarizes the integration of renewable energy systems in production, highlighting the high energy demands and the requirement for various systems to address the annual production of a hot rolling mill.

Battery Storage Systems

Wind and photovoltaic systems rely on highly variable primary sources of energy throughout the day and year. Therefore, to fully utilize the energy they generate, it is essential to have energy-storage systems to stock energy during periods of low demand and incorporate that energy into the grid during periods when energy generation does not meet the demand. It is important to consider that the power demand from the rolling mill also varies, depending on the position of the slab in the roughing and finishing mill. During those hourly periods when the rolling mill stops to change the rolls or simply due to production needs, the energy generated can exceed the energy consumed. To take advantage of the possible energy generated during these periods of stoppage or low demand, it is proposed to transfer this surplus to the energy-storage system.
The power-generation unit based on the utilization of residual gases would be manageable, just like the storage system.

Upgrading of the Rolling Mill Drives

The transformation of the electrical system of the rolling mill, within the framework of decarbonization, is not only based on the incorporation of renewable energy generation systems, but also considers an update of the drives of each of the rolling mill stands, replacing the classic drives based on cycloconverters by multilevel back-to-back converters with active rectification stages capable of controlling the facility’s displacement factor, minimizing harmonic distortion and even helping to cancel pre-existing distortion rates, and with inverter stages capable of performing regenerative braking. Between the two converters, there is a DC bus operating under standardized voltage. In this way, the DC bus is connected to the existing DC distribution circuit in the plant. The remodeling of a traditional hot rolling mill plant by incorporating new technology into its mill drives makes it possible to improve the efficiency and productivity thanks to (a) the elimination of the passive filtering stages responsible for maximizing the displacement factor and minimizing the harmonic distortion rate in the classic installation based on cycloconverters; (b) the dynamic adjustment of the reactive injection/demand according to the reactive setpoints integrated in the facility, which would allow the reactive flows to be canceled, leading to a reduction in the rms current value and therefore a reduction in the losses and an adjustment in the voltage according to the setpoint conditions; and (c) an improvement in the efficiency of the AC/AC conversion and improvement in the controllability of the driven synchronous motor [118].
Figure 11 illustrates the integration of the proposed new topologies into the electrical installation to address the system updates that facilitate all the previously mentioned improvements in efficiency and productivity.

Integration of Renewable Energy Sources into the Distribution Network

To facilitate the integration of solar power plants, wind power systems, and energy-storage systems, it is proposed that AC and DC distribution systems be deployed simultaneously. To this end, two types of distribution networks are built, one in DC and the other one in AC. The objective is twofold. On the one hand, unnecessary DC/AC transformations are avoided, which would subsequently require AC/DC conversions, thus improving the performance of the installation by reducing losses and eliminating maintenance costs. On the other hand, the DC distribution network to which the storage system is connected might have a direct connection to the DC bus of the back-to-back converters of the rolling mill drives, offering backup in the event of anomalies in the AC distribution network (such as a voltage sag) and a more efficient distribution network of energy recovery during braking processes.
Figure 12 depicts the integration of the proposed electrical systems with the back-to-back converters of the rolling mill in a simplified manner, using a DC bus.

Energy-Management Optimization

The need for the correct management of the grid’s energy resources requires a control system that charges the storage batteries when surplus power is generated. This same control stage will facilitate the discharge of this available stored energy in those periods of time when power demand exceeds generation. Additionally, the storage system can perform load leveling or frequency-regulation tasks.
Similarly, reactive power management is also possible, considering the different systems that participate in the grid with the capacity to control this variable. With the new configuration, it is possible to manage reactive power with the power margins of the rolling stands, solar inverters, and DFIG-type wind turbines. The appropriate management of reactive power can obey different setpoints: the minimization of losses in the distribution network, minimization of voltage variations at certain nodes of the network, or maximization of the displacement factor at the point of coupling to the network.
The management algorithms can be based on metaheuristic techniques, neural networks, or genetic algorithms. The reactive power references sent to the various dispatchable elements in the virtual plant must be updated in a few seconds to maximize the positive impact of this solution. Some studies have shown that it is possible to reduce the consumption of losses in the distribution network of a steel plant by up to 20% by managing the reactive power flow with such algorithms [115].

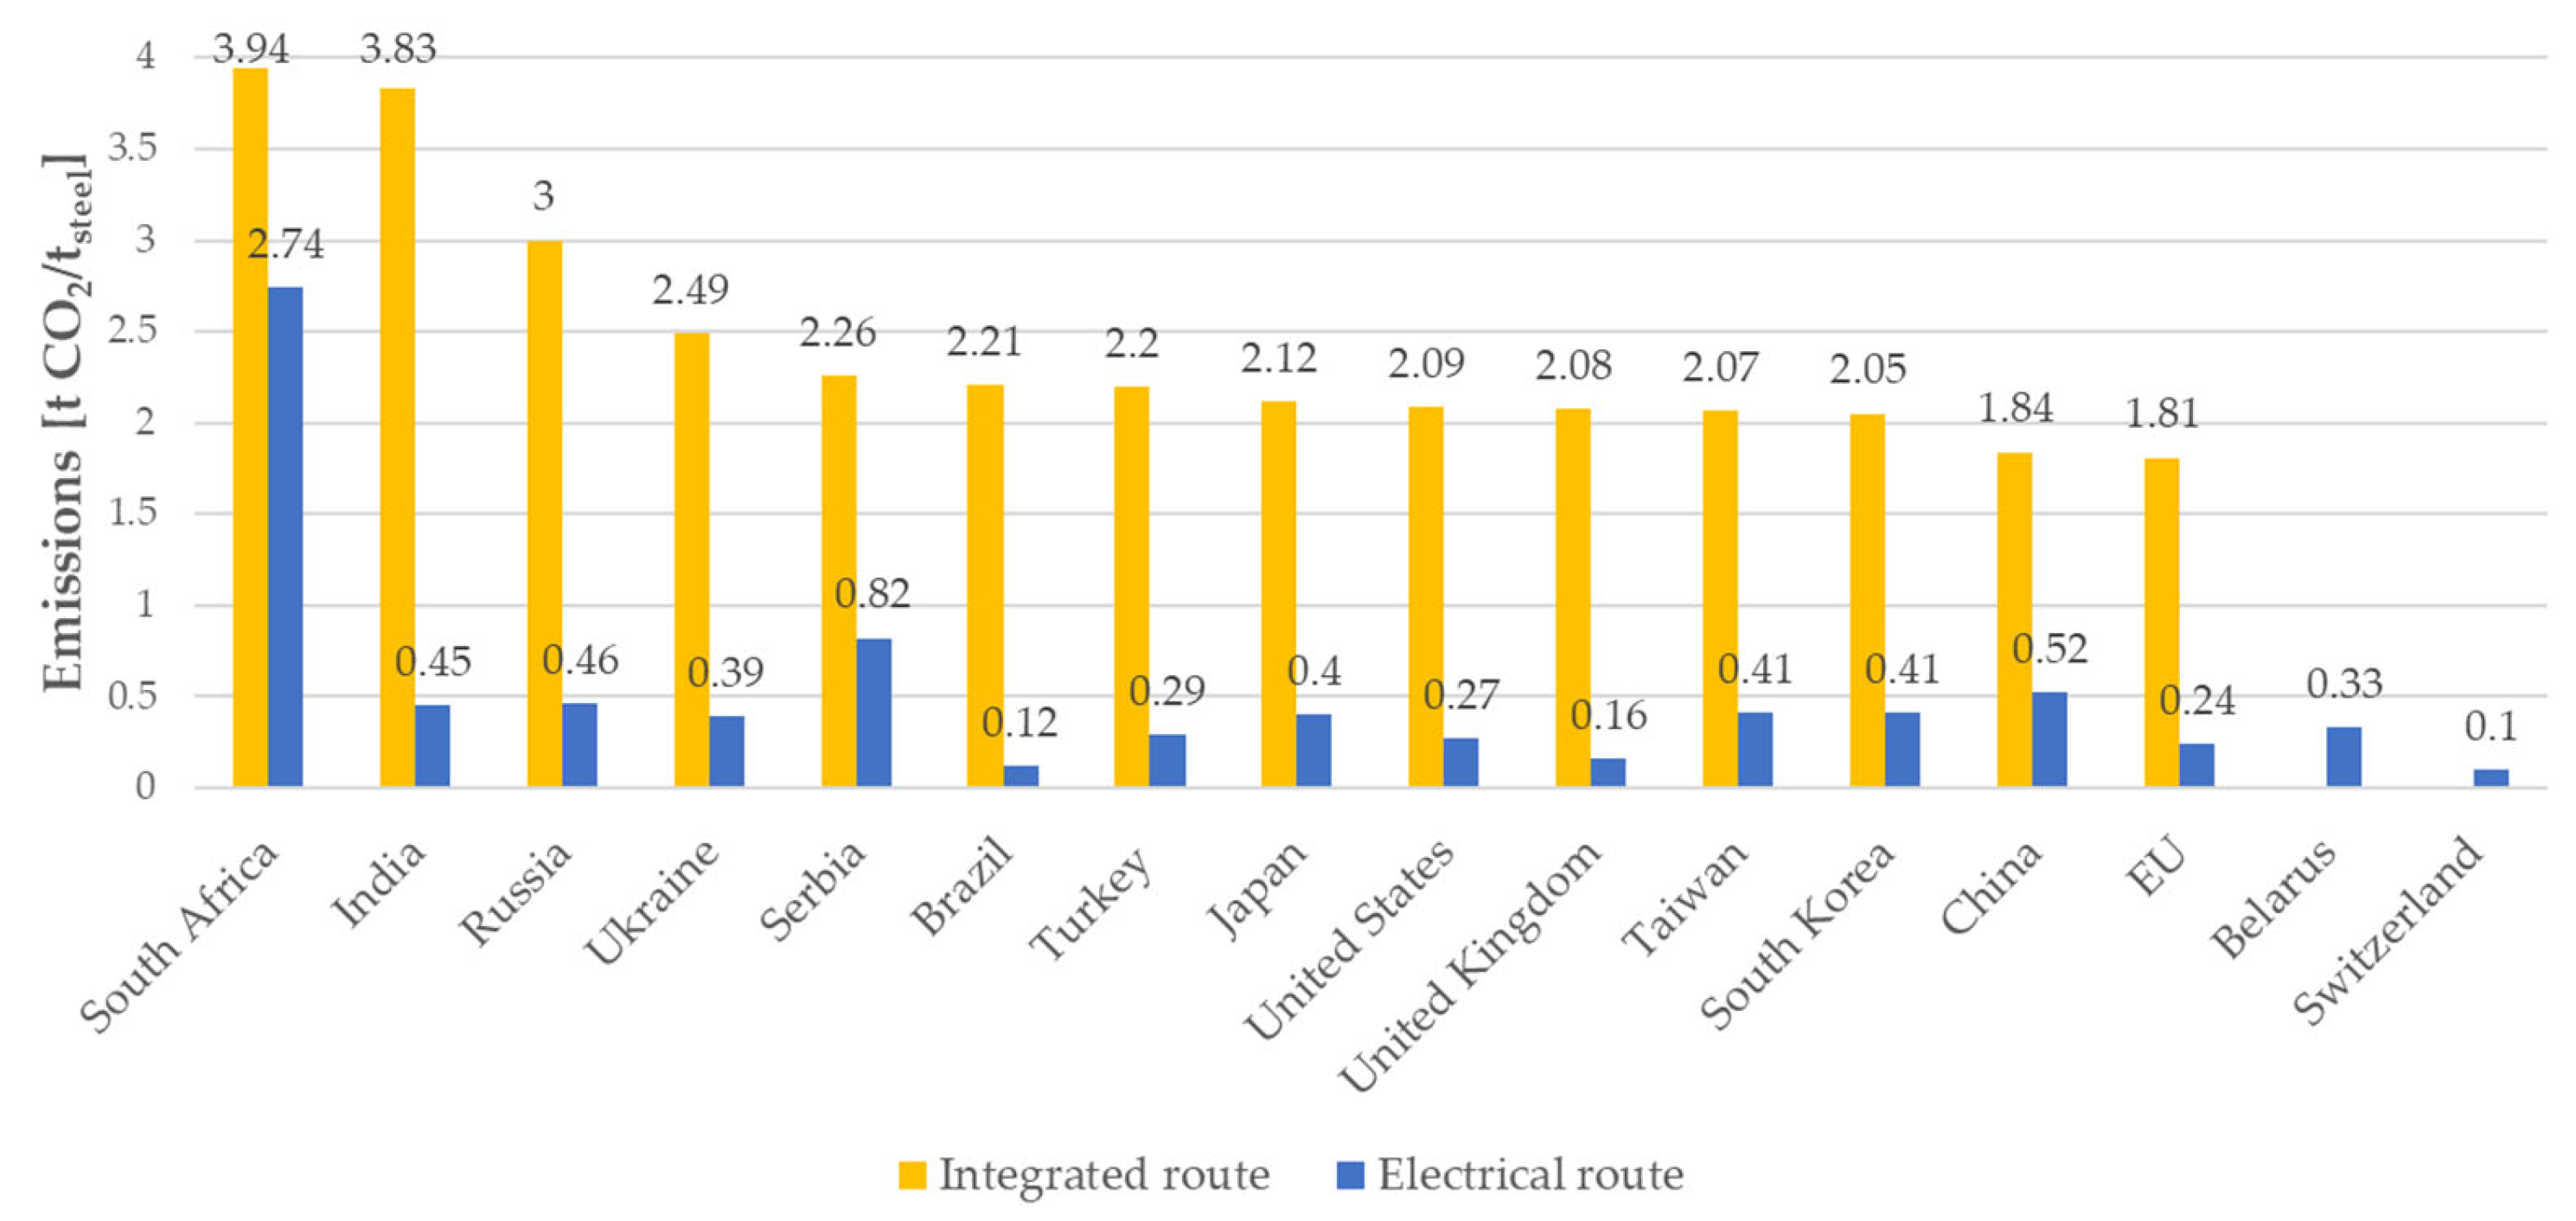
4.2.4. CO2 Emissions

CO2 emissions per kWh are determined by the primary energy source used in power generation. Consequently, a wind farm emits 6 g of CO2 per kWh. The Intergovernmental Panel on Climate Change (IPCC) has reported that the median life cycle emissions for rooftop solar energy, based on peer-reviewed studies, stand at 41 g of CO2-eq./kWh for electricity production. Biomass (BM) is generally regarded as a carbon-neutral fuel source. According to data released by the CNMC on 20 April 2022, the carbon emissions associated with the Spanish electricity grid’s energy mix amount to 259 g CO2-eq./kWh.
Carbon footprint estimates for high-temperature industrial heating distinguish emissions according to the primary source. In the case of methane, the carbon footprint varies depending on the efficiency (and age) of the different systems. The range in the variation is between 200 and 330 g of CO2-eq./kWh [155].
If it is considered that the 365 GWh of electrical energy consumed by the rolling mill is provided by a distribution network that is supplied by the Spanish energy mix, this 365 GWh represents 94,535 t of CO2-eq emitted annually. However, if 40.3% of this energy is covered by wind energy (WF) (882.5 t CO2-eq), 11% comes from the solar generator (PV) (1646 t CO2-eq), and 26.15% comes from the use of waste gases (WG) (23,862 t CO2-eq), the 365 GWh would result in 26,390 t CO2-eq. Thus, with this new energy-supply scheme, a saving of 68,145 t CO2-eq is achieved.
The 1100 GWh consumed by the reheating furnace is obtained from the natural gas distribution network, amounting to 247,500 t CO2-eq emitted annually. If the primary source is replaced by electricity from renewable sources as described in Section 4.2.1, 1310 GWh would be required. With the same distribution ratio as in the previous section (40.3% WF, 11% PV, 26.15% WG, and 23.88% BM), emissions of 86,152 t CO2-eq would be achieved (3167 t by WF; 5908 t by PV; and 77,077 t by WG). Thus, with this new energy-supply scheme, a saving of 161,350 t CO2eq is achieved. Overall, the emission savings achieved are in the order of 229 kt CO2-eq per year.

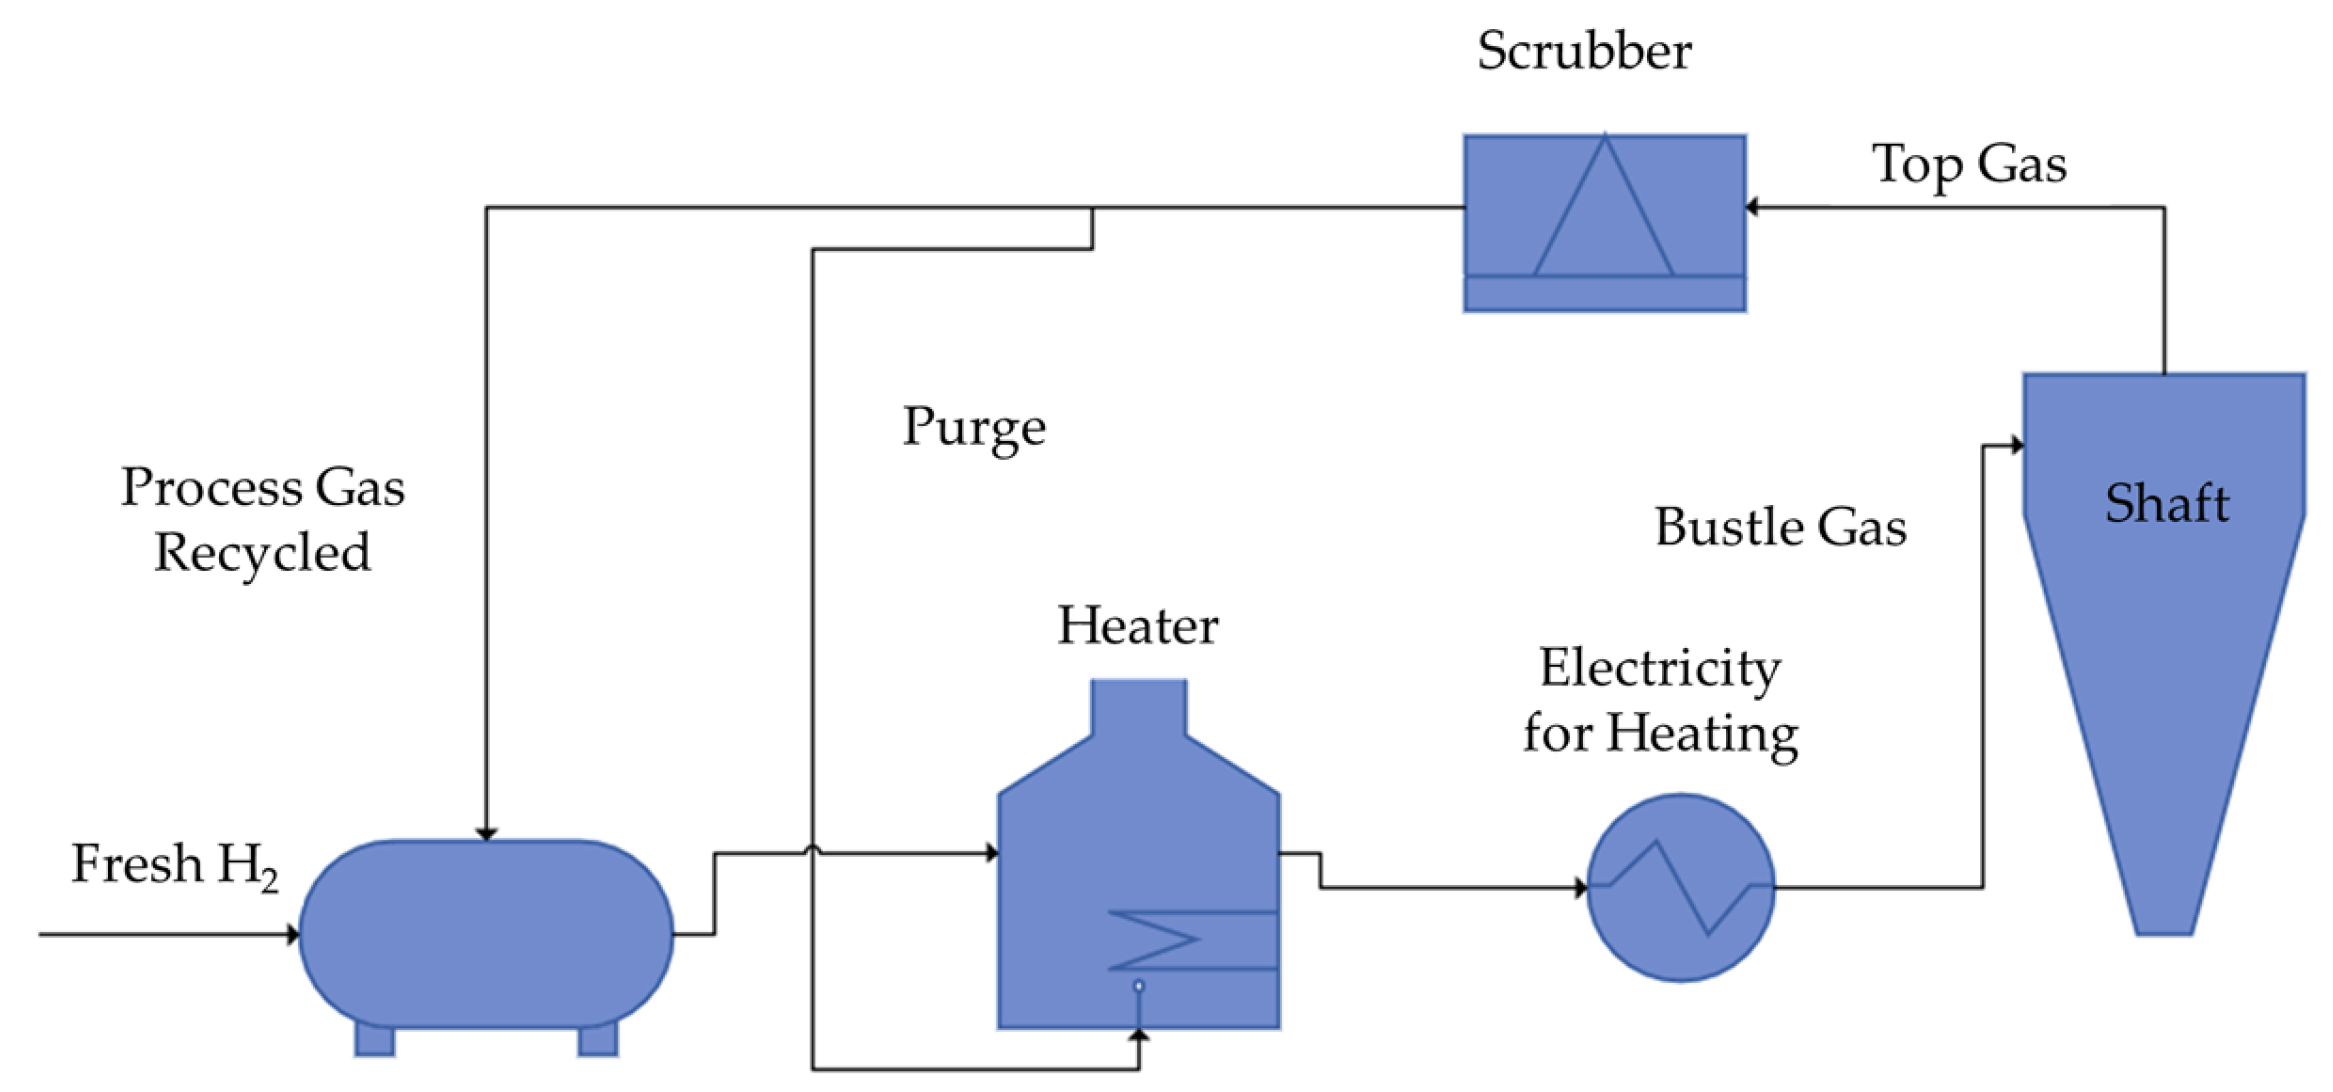
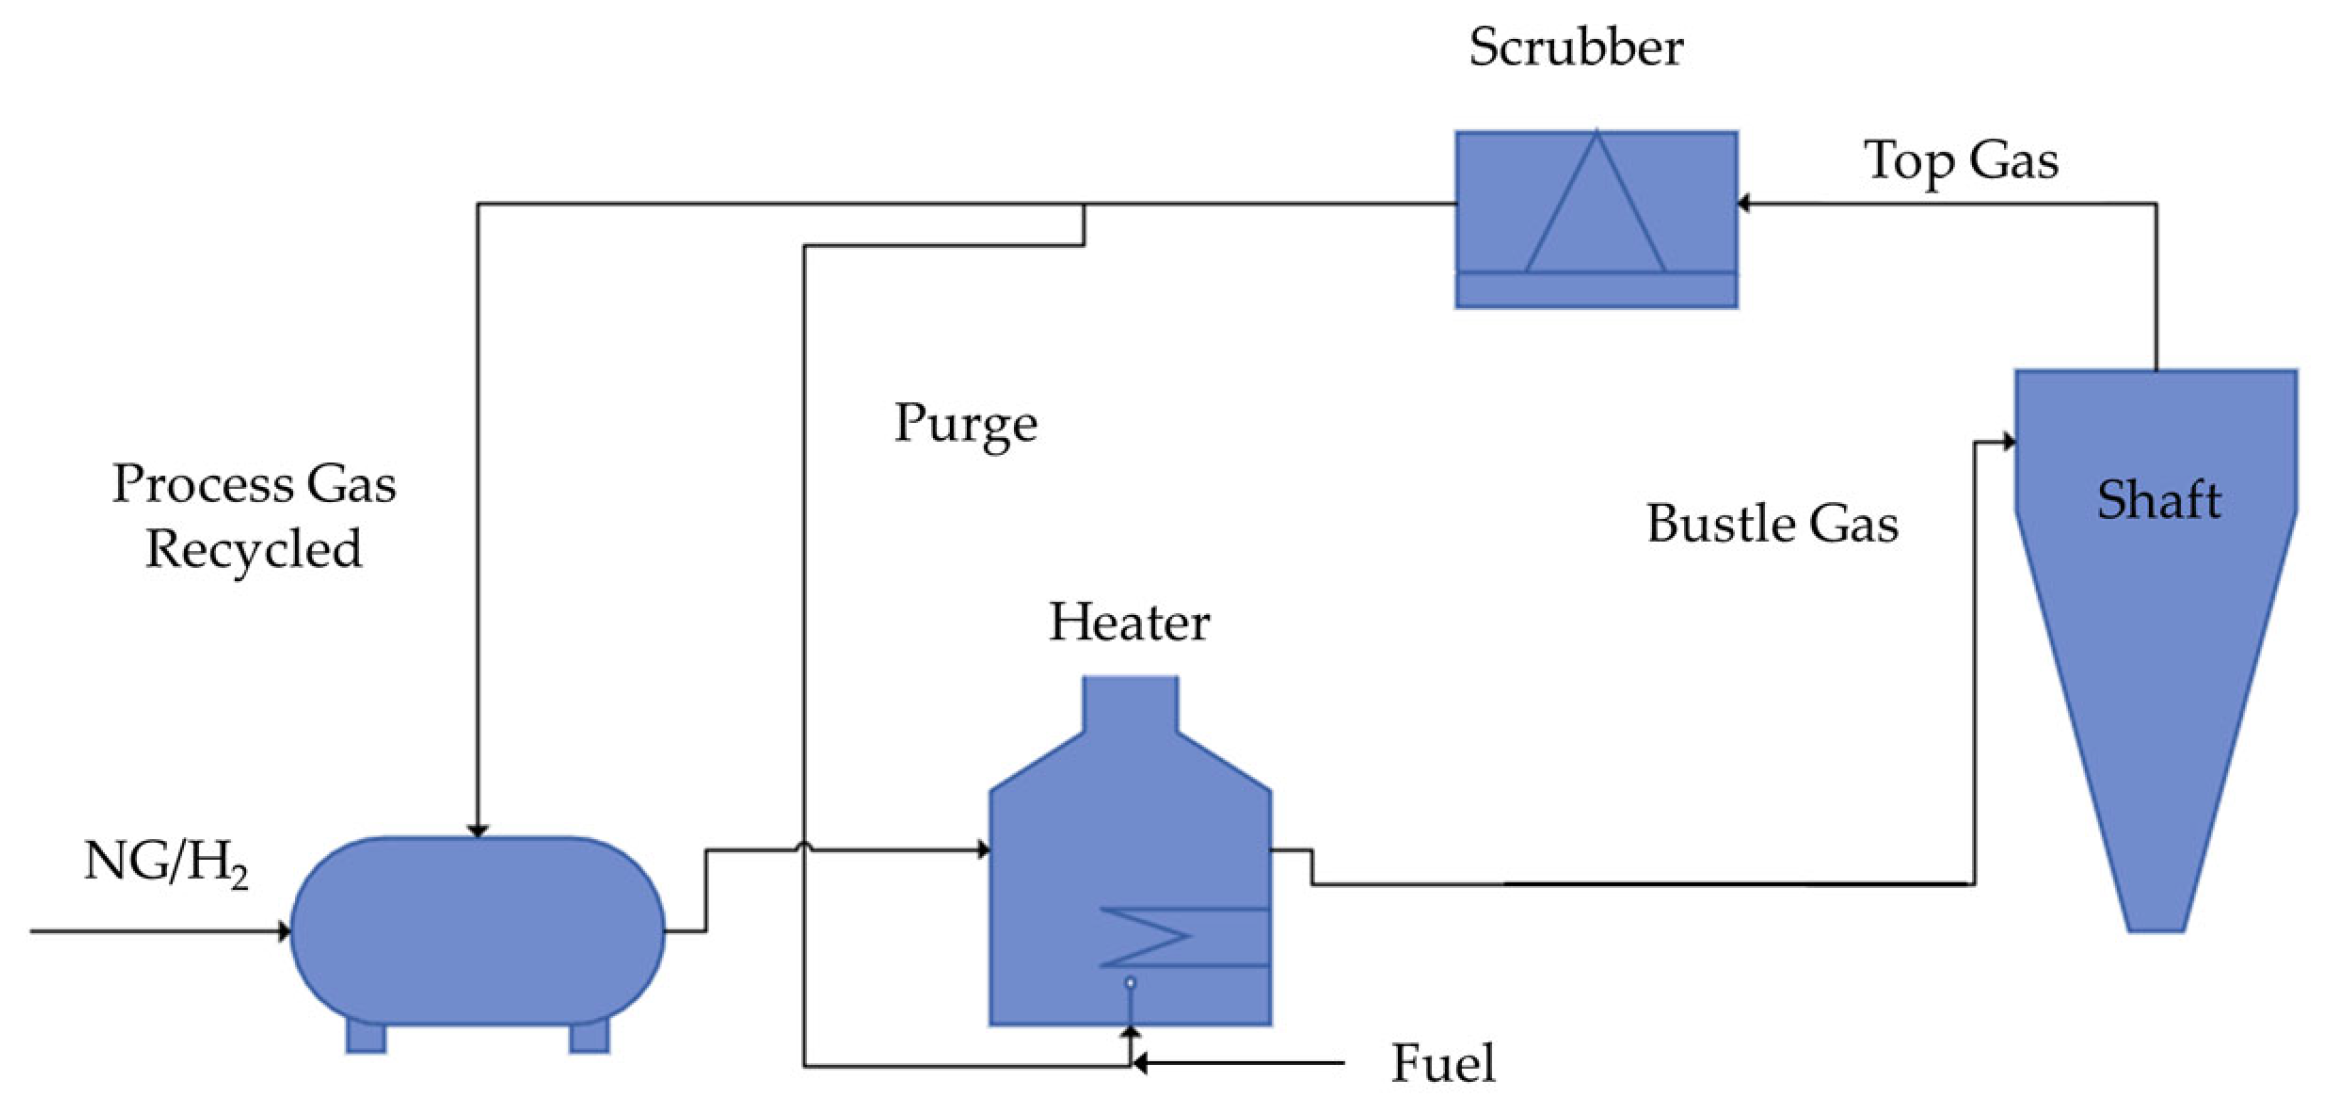
4.3. Use Case 2: DRI Production—CO2 Emissions and H2 Break-Even Price for H2-DRI

The H2 break-even price is the maximum cost that H2 has to be to be competitive in the scenario of the NG and CO2 selected. This study assumes the MIDREX™ process [156,157,158,159,160] harnessing full H2 for the iron ore reduction; for heating requirements, we assume the use of part of the purge, and for the remaining energy requirements, we assume the use of different heat sources [161]. The NG-MIDREX™ process is the most widely used technology for DRI production [162]. In this analysis, a portion of the exiting top gas in the shaft furnace, following the water removal step in the scrubber, undergoes purging to serve as fuel for heating the fresh reducing gas injected into the shaft. However, the purged gas alone does not provide sufficient energy to heat the reducing gas entirely. To compensate for this shortfall, additional energy is sourced from fuel or electricity. Table 4 illustrates a simplified diagram depicting the gas flow, wherein a volume of gas is recycled, another portion is consumed within the shaft furnace, and the remainder is purged for use in the heater. Considering that some H2 is consumed during the process, it is replenished with fresh H2. Fresh H2 is not pure but rather part of a stream with its composition and characteristics.
Before proceeding with the analysis, it should be noted that the carbon (C) content of DRI using 100% H2 as a reducing agent is virtually zero, which is a significant advantage in terms of reducing carbon emissions in the steel industry. However, most EAF steelmakers prefer to use DRI with a carbon content of 1.5–3% to have adequate conditions in the EAF fusion process [160,163]. As the amount of H2 in the reduction increases, it is necessary to add hydrocarbons somewhere in the process to achieve the required carbon levels. There are several options for injecting natural gas into the DRI process [163,164]. By injecting natural gas in appropriate percentages, the reduction conditions can be controlled and, as a result, the carbon content of the final DRI can be adjusted [160,163].
The main carbon input in the DRI process with NG is through the NG used in gas reduction or heating. In the case of H2-based production, the main input is also via NG for the carburization of DRI if this is used. Then, through this simple approximation, the CO2 associated with the NG is calculated. The first step is to fix the composition of the NG. Table 4 shows an example of a typical NG composition.
Table 4. NG composition [165,166,167].
ComponentComposition (%)Mass (kg)LHV * (MJ/Nm3)ElementMass (kg)Mass (%)
Nitrogen0.030.8412.6N0.80.05
Methane91.211459.3635.8H422.824
Ethane6.43192.963.73C1337.375.94
Propane1.9585.891.16
Butane0.3822118.6
Total1001760.938,979.32 1760.9100
* Lower heating value.
Several scenarios can be envisaged. The carbon content of DRI can vary between 1.5 and 3% [162]. Based on [81,156,160,163,164,168], the following assumptions are made:
  • Around 10 GJ of NG is needed per ton of DRI.
  • Data coming from Table 4:
    • The NG LHV is 38,979.32 MJ/Nm3.
    • The NG density is 0.79 kg/Nm3.
    • 75.94% is the NG carbon mass in %.
  • In total, 1 mol of C is equal to 1 mol of CO2.
  • The ratio of kmol of CO2 to kg of CO2 is 44.
  • H2 harnesses and electricity are green.
Table 5 shows the CO2 emissions for several scenarios that were studied. The first three scenarios refer to DRI that uses NG for gas reduction and heating. Scenario 4 refers to DRI considering a H2-based production that uses NG to maintain the desired reduction temperature [163]. Scenario 1: DRI containing 1.5% carbon corresponds to −15 kg C in the DRI (the value is negative because the carbon stays inside the DRI, it does not “leave”). Scenario 2: for DRI with 3.5% carbon, it is −35 kg C. Scenario 3: as the CO2 is finally released to the atmosphere in the later steelmaking processes, the value set can be 0. Scenario 4: the addition of 50 Nm3/tDRI of NG for temperature control leads to a DRI carbon content of approximately 1.4–1.7% in H2-DRI production [160,163]. Equation (1) relates the volume of NG used per ton of DRI, VolNG, to the ratio between the energy input of NG per ton of DRI, ENG, and the LHV of the NG, dENG. Equation (2) then calculates the kilograms of NG per ton of DRI by multiplying the equality by the density, ρNG. A similar exercise is carried out to determine the mass of CO2 per ton of DRI. It is first necessary to determine the amount of carbon present, which is dependent on the composition of the NG (see Table 4) and the mass percentage of C extracted. To calculate the required mass of carbon (kg) for a particular case, one can use the straightforward ratio of the mass of a compound or mixture to the % mass of the element:
V o l N G = E N G d E N G ,
V o l N G   · r   N G   = E N G d E N G   · r   N G   .
This simple approximation shows that by partially replacing NG with H2, it is possible to achieve a CO2 reduction of 89.2% per ton of DRI for DRI with a carbon content of 1.5% (a comparison between scenario 2 and 4). The production of H2-DRI with an appropriate addition of NG results in DRI containing an acceptable percentage of carbon for steelmakers whilst also significantly reducing CO2 emissions [163].
A comparative analysis of the MIDREX™ process with H2 instead of NG is presented. Three key parameters are considered: the NG amount, which is substituted by H2; the CO2 emissions associated with this NG; and finally, the H2 cost per kg. Based on the literature reviewed [79,80,81,84,156,158,163,168], the following assumptions are made:
  • Around 10 GJ of NG is needed per each DRI ton. NG prices usually oscillate between 1 and 12 EUR/GJ [169].
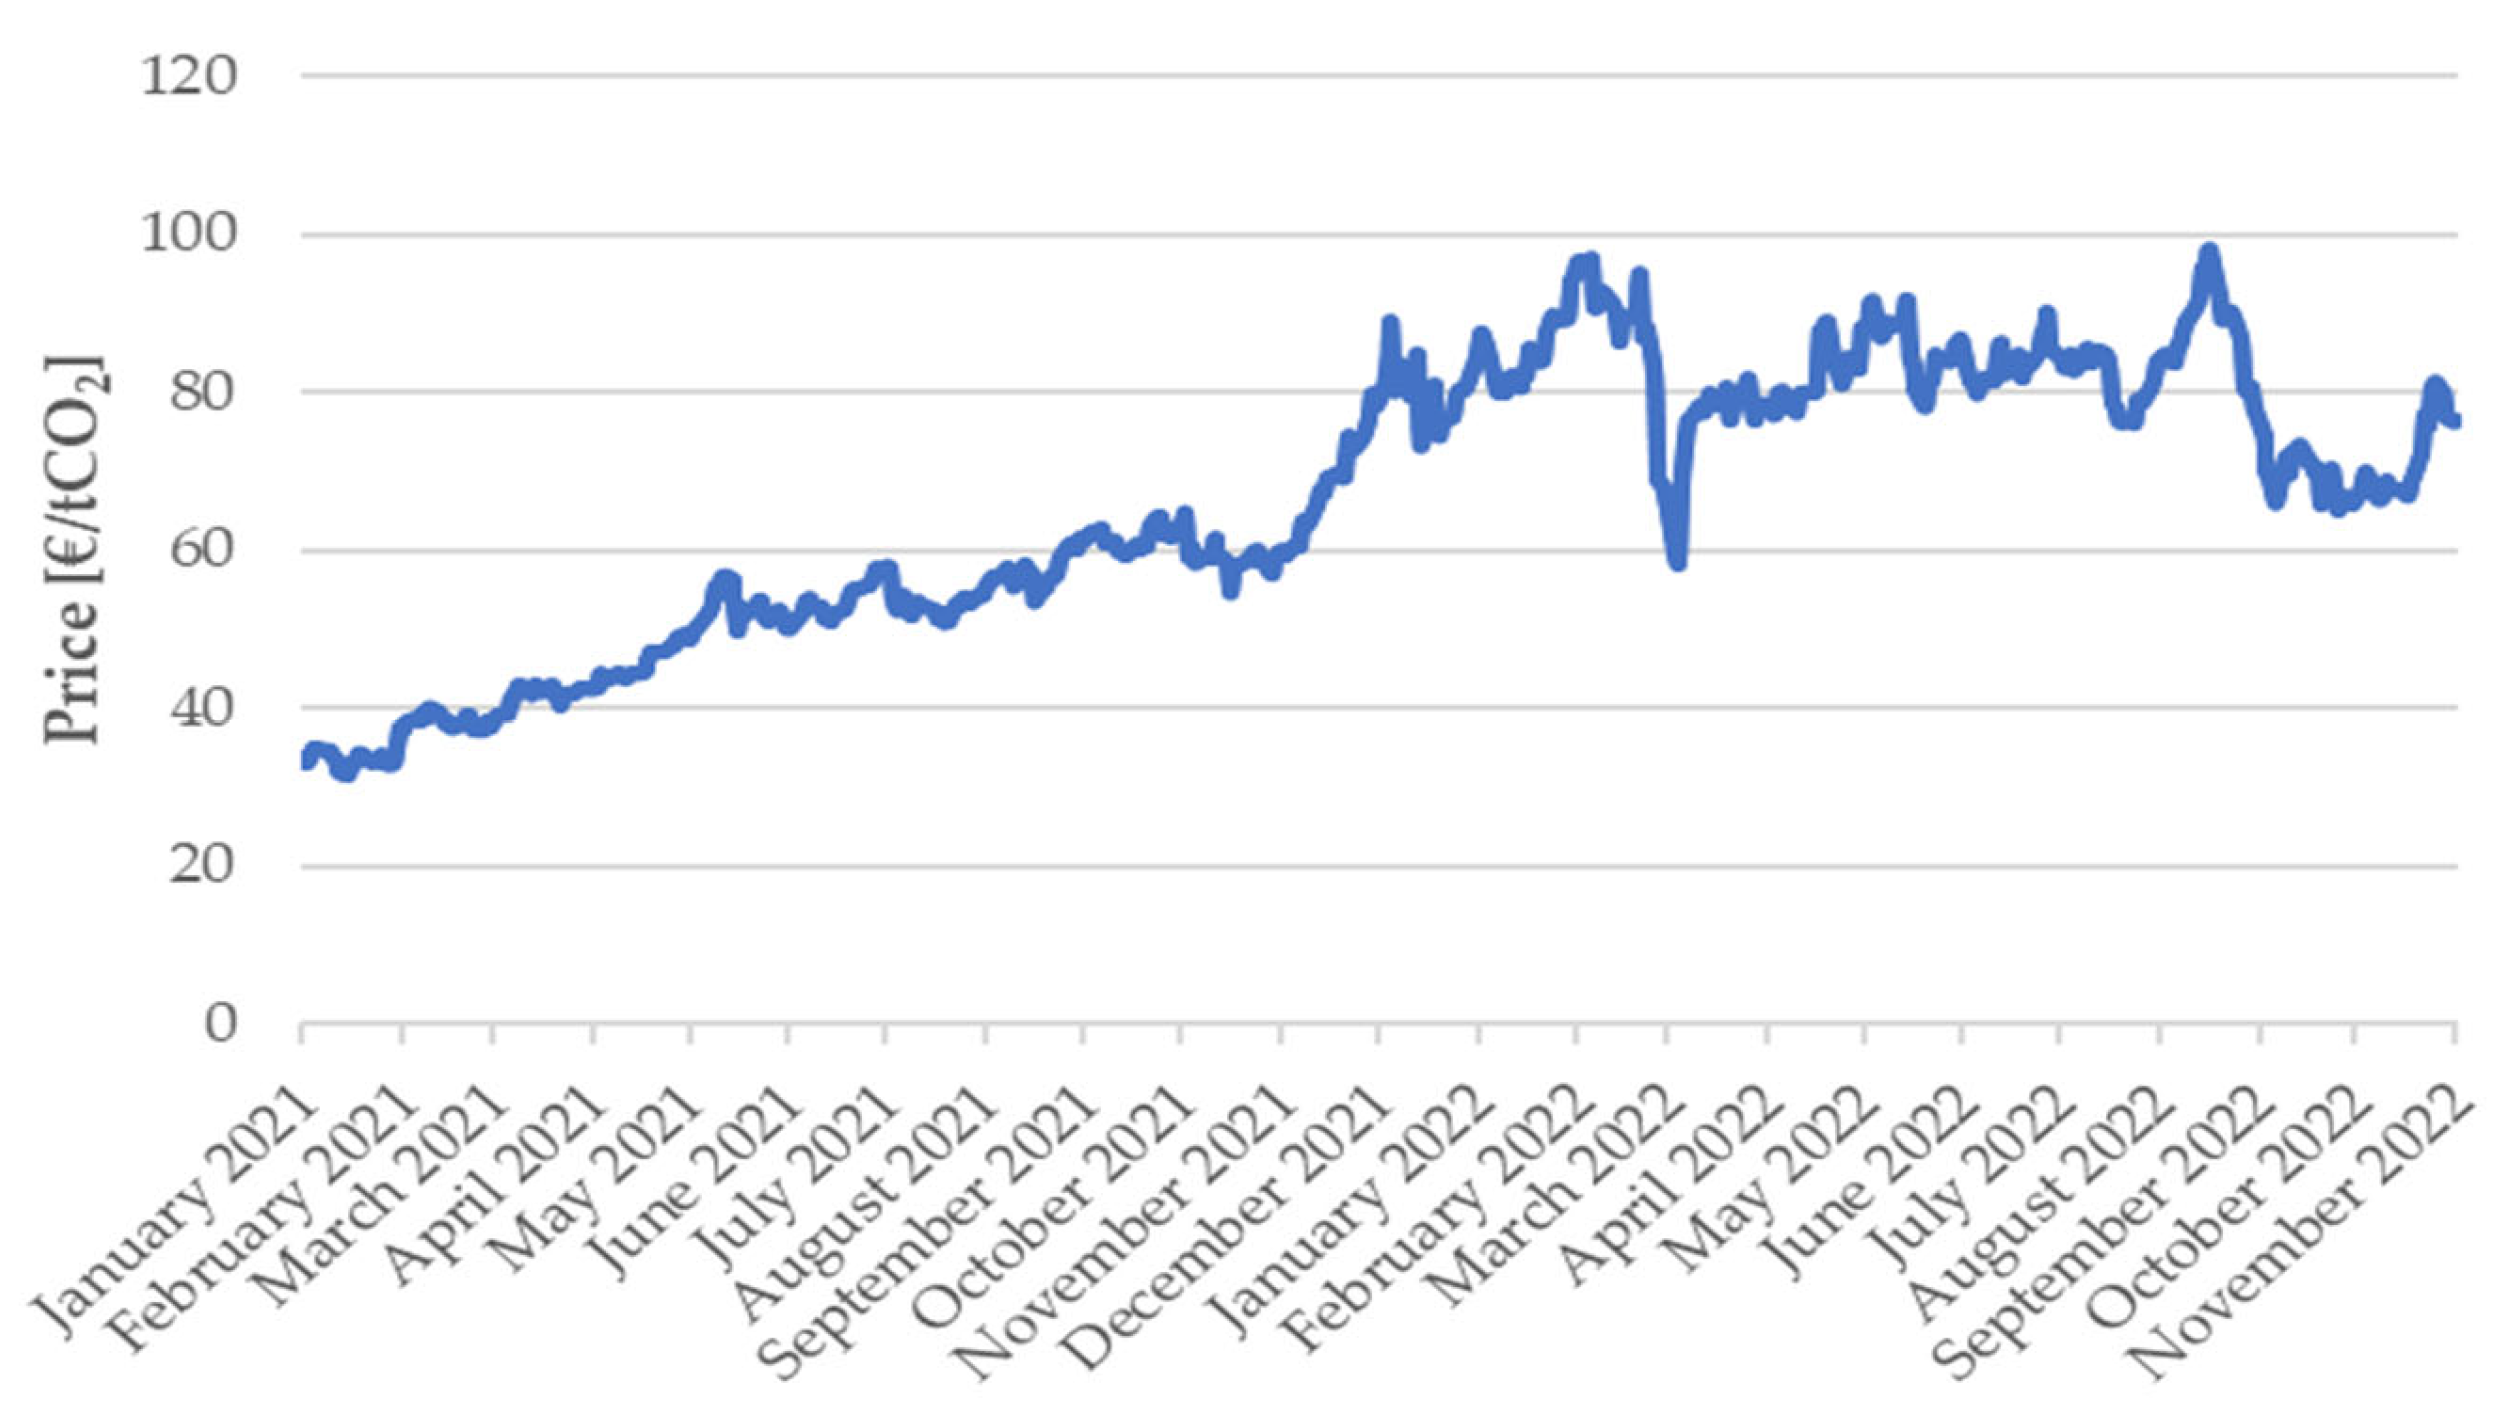
  • CO2 prices oscillate between 0 and 100 EUR/tCO2 [93], and per GJ of NG, 56 kg of CO2 is associated, considering 257 Nm3 NG/tDRI, 1 mol C = 1 mol CO2, and around 500 kg of CO2/tDRI.
  • A total of 550 Nm3 H2/tDRI is fixed. Additionally, up to 250 Nm3 H2/tDRI or other heat sources, e.g., NG or electricity, are required as fuel for the reduction gas heater.
  • H2 harnesses and electricity for heating is green; therefore, no CO2 emissions are associated.
  • The theoretical energy required for H2 heating is set to 450 kWh/tDRI (considering that the electrical heating efficiency is 85%, 530 kWh/tDRI, using gas and with an efficiency of 60%, 750 kWh/tDRI is needed).
  • The cost of electricity is set at 100 EUR/MWh.
Applying a relation between H2, the price of electricity, the NG required per ton of DRI, and the associated CO2, Equation (3) is obtained. Then, by adjusting (3) as a function of H2, a ratio of euro/kg H2 is acquired. Based on the literature [160,163,164] and using NG as a reference, replacing NG with H2 in the process results in reduced electricity consumption:
H2 required tDRI + Δ ElectricityNG-H2 per tDRI = NG required per tDRI + CO2 associated per GJNG.
Table 6 and Table 7 provide the required information to calculate the price of H2 according to Equation (3) and perform the analyses presented. Figure 13 and Figure 14 show the various scenarios discussed in this section.
Table 8 shows the H2 break-even price results for the comparison between 100% NG and H2 with NG as fuel. This exercise helps in identifying the highest cost at which H2 should be available, based on the price of NG and CO2, to produce DRI with a percentage of carbon that is acceptable to those involved in steel production.
The cost of green hydrogen is currently 3.5–5 USD/kg, but projections suggest it could be around 1.8 EUR/kg by 2030 [44,54,87]. Green hydrogen production costs for 2050 vary from 17 EUR/MWh to 84 EUR/MWh [82]. In comparison, grey hydrogen costs 1 to 2 EUR/kg H2, while electrolysis-based hydrogen ranges from 3 to 6 USD/kg H2 [9,87]. For ArcelorMittal, achieving green hydrogen costs of 1.5 EUR/kg through initiatives like the Hydeal consortium [171] is crucial for competitive steel [44]. This value of 1.5 EUR/kg puts the focus on the middle of Table 8 to set the price limit values for NG and CO2 at 7 EUR/GJ and 60 EUR/t, respectively.

5. Conclusions

The steel industry is at a crucial turning point, driven by the challenges of overcapacity and the imperative to address climate change by meeting the EU, USA, and China’s carbon targets. As a significant contributor to global CO2 emissions, decarbonization in the steelmaking sector has become a priority. In this context, the present work reviews the existing steel production pathways, highlighting their current limitations and comparing them in terms of CO2 emissions versus production levels according to the current global situation. For a complete evaluation and contextualization, an extensive bibliography is analyzed to show in a clear and forceful way the decarbonization paths that are and will be considered in the steel industry. After presenting the technologies that have been implemented, their level of impact is assessed and compared under different scenarios, providing a clear vision of the prospects and the impact they will have. For the three main pillars, scrap utilization, hydrogen, and electricity consumption, a more in-depth assessment is presented, supported by a review of the main industrial–scientific contributions. Conversely, the article suggests that achieving carbon neutrality requires navigating complex technical, economic, and regulatory landscapes. CO2 emissions are significantly influenced by the EU ETS and have the potential to have an impact on them. Implementing the CBAM as a substitute for free emission allowances could prove advantageous for the steel industry. These topics are also explored in detail.
Major steel manufacturers have set out ambitious goals to achieve carbon neutrality, requiring a comprehensive review of the industry’s operations. This article assesses the decarbonization roadmap proposed for leading steel producers, emphasizing strategies to be implemented in the short, medium, and long term. These include measures such as increasing the use of ferrous scrap and its characterization, improving the process’s energy efficiency, and the gradual integration of hydrogen. While hydrogen is a promising abatement alternative, its widespread adoption depends on the evolution of energy markets, the dynamics of CO2 taxation, technological developments, and availability.
In addition to hydrogen, there are alternative decarbonization technologies, including near-net-shape casting, smelter reduction, and iron ore electrolysis, which can result in significant emission reductions and energy savings. These technologies, each with their own TRL, are presented in this paper and demonstrate their potential to reduce emissions and save energy.
Two specific use cases are explored in the text. The first pertains to the hot rolling mill, which implements new methodologies for electricity, such as renewable energy sources, battery storage, advanced drives, innovative distribution systems, and optimized energy management. This use case also considers the energy necessary to produce H2 for the reheating furnace. On the other hand, the second use case addresses the production of DRI incorporating H2. All of this provides important ways to further reduce emissions. The first approach for the case of the rolling mill, which is connected to the reheating furnace mentioned earlier, achieves an emissions savings of 229 kt CO2-eq per year, which involves the rolling mill’s annual electricity consumption of 365 GWh/year. For the second case, the analysis shows that for DRI production in which NG is partially replaced with H2, providing an energy of 10 GJ/tDRI, a CO2 reduction of more than 90% per ton of DRI with a carbon content of about 1.5% occurs. For this case, the studies end with an analysis of the result of the equilibrium price of H2, comparing a typical DRI production with 100% NG and H2 with NG as fuel. A price of 7 EUR/GJ NG and 60 EUR/t CO2 are justified so that the steel produced is competitive. These accomplishments represent a significant step forward in the decarbonization of the industry.
The steel industry’s journey toward decarbonization involves a complicated mix of technological innovation, economic realignment, and sustainable energy sourcing. To achieve carbon neutrality, the principal steel producers must carefully negotiate delicate technical, economic, and regulatory landscapes. Continuous advancements, collaborative efforts, and adaptive strategies are necessary to pursue sustainable steel production and to align with global climate objectives for a more environmentally responsible future.

Author Contributions

Conceptualization, J.R.D. and G.A.O.; methodology, J.R.D. and G.A.O.; formal analysis, J.R.D. and G.A.O.; investigation, J.R.D. and G.A.O.; resources, J.R.D., A.V., J.R. and G.A.O.; writing—original draft preparation, J.R.D., S.T.-T., G.A.O. and A.V.; writing—review and editing, J.R.D., G.A.O., S.T.-T., A.V. and J.R.; visualization, J.R.D. and S.T.-T.; supervision, J.R.D., G.A.O., S.T.-T., A.V. and J.R.; project administration, G.A.O.; funding acquisition, G.A.O. All authors have read and agreed to the published version of the manuscript.

Funding

This work was supported by the Spanish Government, MCIN/AEI/FEDER, and the EU under grants PID2021-122704OB-I00 and TED2021-131498B-I00.

Acknowledgments

The authors gratefully acknowledge the ArcelorMittal Global Basque Country Research Center, University of Oviedo, and the Spanish Ministry of Economy and Competitiveness, within the framework of the National Plan for Scientific and Technical Research and Innovation, for their technical and financial support during this study.

Conflicts of Interest

The authors declare no conflict of interest.

Abbreviations

AFOLUAgriculture, forestry, and land use
BATBest Available Technique
BFBlast furnace
BFGBlast furnace gas
BMBiomass
BOFBasic oxygen furnace
CCarbon
CBAMCarbon Border Adjustment Mechanism
CCSCarbon capture and storage
CCUCarbon capture and usage
CCUSCarbon capture, utilization, and storage
CDACarbon direct avoidance
COGCoke oven gas
DCDirect current
DRDirect reduction
DRIDirect reduced iron
EAFElectric arc furnace
ETSEmissions Trading Scheme
EUEuropean Union
EU ETSEuropean Union Emissions Trading System
GHGGreenhouse gases
H2Hydrogen
HBIHot Briquetted Iron
IEAInternational Energy Agency
IPCCIntergovernmental Panel on Climate Change
LCFFESLow-carbon fuels, feedstocks, and energy sources
LHVLower heating value
LTSUS Long-Term Strategy
NGNatural gas
PSHPeak sun hours
PSOParticle Swarm Optimization
PVSolar generator
SCUSmart carbon utilization
SMRSteam methane reforming
SRFSolid recovered fuel
TBDTo Be Defined
TRLTechnology Readiness Level
UKUnited Kingdom
USAUnited States of America
WFWind energy
WGWaste gases

References

  1. Beck, A.; Unterluggauer, J.; Helminger, F.; Solís-Gallego, I. Decarbonisation Pathways for the Finishing Line in a Steel Plant and Their Implications for Heat Recovery Measures. Energies 2023, 16, 852. [Google Scholar] [CrossRef]
  2. International Energy Agency. Iron and Steel Technology Roadmap—Towards a More Sustainable Steelmaking; IEA: Paris, France, 2020. [Google Scholar]
  3. Draxler, M.; Sormann, A.; Kempken, T.; Hauck, T.; Pierret, J.-C.; Borlee, J.; Di Donato, A.; De Santis, M.; Wang, C. Technology Assesment and Roadmapping (Deliverable 1.2); Green Steel for Europe Consortium: Brussels, Belgium, 2021. [Google Scholar]
  4. Mandova, H.; Patrizio, P.; Leduc, S.; Kjärstad, J.; Wang, C.; Wetterlund, E.; Kraxner, F.; Gale, W. Achieving Carbon-Neutral Iron and Steelmaking in Europe through the Deployment of Bioenergy with Carbon Capture and Storage. J. Clean. Prod. 2019, 218, 118–129. [Google Scholar] [CrossRef]
  5. Kim, Y.; Worrell, E. International Comparison of CO2 Emission Trends in the Iron and Steel Industry. Energy Policy 2002, 30, 827–838. [Google Scholar] [CrossRef]
  6. Worlsteel Association. 2022 World Steel in Figures; World Steel Association: Brussels, Belgium, 2022. [Google Scholar]
  7. European Commission; European Research Executive Agency; Vu, H.; Cecchin, F.; Iacob, N.; Stroia, C. Climate-Neutral Steelmaking in Europe: Decarbonisation Pathways, Investment Needs, Policy Conditions, Recommendations; Stroia, C., Iacob, N., Eds.; Publications Office of the European Union: Luxembourg, 2022.
  8. Somers, J. Technologies to Decarbonise the EU Steel Industry; Publications Office of the European Union: Luxemburg, 2022.
  9. U.S. Energy Information Administration. Annual Energy Outlook 2022 with Projections to 2050; U.S. Energy Information Administration: Washington, DC, USA, 2022.
  10. U.S. Department of Energy. Industrial Decarbonization Roadmap; U.S. Department of Energy: Washington, DC, USA, 2022.
  11. Intergovernmental Panel on Climate Change (IPCC). Climate Change 2007—Mitigation of Climate Change; Contribution of Working Group III to the Fourth Assessment Report of the Intergovernmental Panel on Climate Change; Cambridge University Press: New York, NY, USA, 2007. [Google Scholar]
  12. Direct CO2 Emissions from Industry in the Net Zero Scenario, 2000–2030—Charts—Data & Statistics. Available online: https://www.iea.org/data-and-statistics/charts/direct-co2-emissions-from-industry-in-the-net-zero-scenario-2000-2030 (accessed on 21 October 2023).
  13. Campbell-Davis, R.; Graham, A.; Witteveen, M.; Gamage, C.; Hutchinson, L. Net-Zero Steel. Sector Transition Strategy; Mission Possible Partnership: 2021. Available online: https://missionpossiblepartnership.org/wp-content/uploads/2021/10/MPP-Steel-Transition-Strategy-2021.pdf (accessed on 21 October 2023).
  14. Ritchie, H.; Rosado, P.; Roser, M. Emissions by Sector; Our World in Data: Oxford, UK, 2023. [Google Scholar]
  15. Sun, Y.; Tian, S.; Ciais, P.; Zeng, Z.; Meng, J.; Zhang, Z. Decarbonising the Iron and Steel Sector for a 2 °C Target Using Inherent Waste Streams. Nat. Commun. 2022, 13, 297. [Google Scholar] [CrossRef]
  16. The European Steel Association (EUROFER). Low Carbon Roadmap Pathways to a CO2-Neutral European Steel Industry; The European Steel Association: Brussels, Belgium, 2019. [Google Scholar]
  17. Bazo, M. Nuevas Rutas Comerciales y Aranceles al Acero: La UE le Planta Cara a China. Available online: https://logistica.cdecomunicacion.es/sector-logistico/134636/nuevo-corredor-aranceles-acero-ue-china (accessed on 21 October 2023).
  18. Aplauden la Imposición de Arancel de 25% al Acero Asiático. Available online: https://www.elfinanciero.com.mx/empresas/2023/08/17/aplauden-la-imposicion-de-arancel-de-25-al-acero-asiatico/ (accessed on 21 October 2023).
  19. European Union. EU Climate Target Plan 2030—Building a Modern, Sustainable and Resilient Europe; European Union: Brussels, Belgium, 2020. [Google Scholar]
  20. Koolen, D.; Vidovik, D. Greenhouse Gas Intensities of the EU Steel Industry and Its Trading Partners; Publications Office of the European Union: Luxembourg, 2022.
  21. ArcelorMittal. Climate Action Report 1; ArcelorMittal: Luxembourg, 2019. [Google Scholar]
  22. Making Net-Zero Steel Possible. An Industry-Backed, 1.5 °C—Aligned Transition Strategy; Mission Possible Partnership: 2022. Available online: https://missionpossiblepartnership.org/wp-content/uploads/2023/01/Making-Net-Zero-Aviation-possible.pdf (accessed on 21 October 2023).
  23. Hölling, M. Decarbonising the Energy Intensive Steel Industry by Usage of Hydrogen—Technological and Economical Aspects. In Proceedings of the Hydrogen & Fuel Cells Energy Summit 2019, Madrid, Spain, 6–7 February 2019. [Google Scholar]
  24. Hasanbeigi, A.; Springer, C. How Clean Is the U.S. Steel Industry? An International Benchmarking of Energy and CO2 Intensities; Global Efficiency Intelligence: São Francisco, CA, USA, 2019. [Google Scholar]
  25. Ministry of Steel. Government of India Annual Report 2020–2021. Available online: https://steel.gov.in/sites/default/files/Annual%20Report-Ministry%20of%20Steel%202020-21.pdf (accessed on 21 October 2023).
  26. Toktarova, A.; Karlsson, I.; Rootzén, J.; Göransson, L.; Odenberger, M.; Johnsson, F. Pathways for Low-Carbon Transition of the Steel Industry—A Swedish Case Study. Energies 2020, 13, 3840. [Google Scholar] [CrossRef]
  27. Vercoulen, P.; Lee, S.; Han, X.; Zhang, W.; Cho, Y.; Pang, J. Carbon-Neutral Steel Production and Its Impact on the Economies of China, Japan, and Korea: A Simulation with E3ME-FTT:Steel. Energies 2023, 16, 4498. [Google Scholar] [CrossRef]
  28. Kim, J.; Sovacool, B.K.; Bazilian, M.; Griffiths, S.; Lee, J.; Yang, M.; Lee, J. Decarbonizing the Iron and Steel Industry: A Systematic Review of Sociotechnical Systems, Technological Innovations, and Policy Options. Energy Res. Soc. Sci. 2022, 89, 102565. [Google Scholar] [CrossRef]
  29. Gajdzik, B.; Wolniak, R.; Grebski, W. Process of Transformation to Net Zero Steelmaking: Decarbonisation Scenarios Based on the Analysis of the Polish Steel Industry. Energies 2023, 16, 3384. [Google Scholar] [CrossRef]
  30. Harpprecht, C.; Naegler, T.; Steubing, B.; Tukker, A.; Simon, S. Decarbonization Scenarios for the Iron and Steel Industry in Context of a Sectoral Carbon Budget: Germany as a Case Study. J. Clean. Prod. 2022, 380, 134846. [Google Scholar] [CrossRef]
  31. Suer, J.; Traverso, M.; Jäger, N. Carbon Footprint Assessment of Hydrogen and Steel. Energies 2022, 15, 9468. [Google Scholar] [CrossRef]
  32. Digiesi, S.; Mummolo, G.; Vitti, M. Minimum Emissions Configuration of a Green Energy–Steel System: An Analytical Model. Energies 2022, 15, 3324. [Google Scholar] [CrossRef]
  33. Arens, M.; Worrell, E.; Eichhammer, W.; Hasanbeigi, A.; Zhang, Q. Pathways to a Low-Carbon Iron and Steel Industry in the Medium-Term—the Case of Germany. J. Clean. Prod. 2017, 163, 84–98. [Google Scholar] [CrossRef]
  34. Bataille, C.; Åhman, M.; Neuhoff, K.; Nilsson, L.J.; Fischedick, M.; Lechtenböhmer, S.; Solano-Rodriquez, B.; Denis-Ryan, A.; Stiebert, S.; Waisman, H.; et al. A Review of Technology and Policy Deep Decarbonization Pathway Options for Making Energy-Intensive Industry Production Consistent with the Paris Agreement. J. Clean. Prod. 2018, 187, 960–973. [Google Scholar] [CrossRef]
  35. Fischedick, M.; Marzinkowski, J.; Winzer, P.; Weigel, M. Techno-Economic Evaluation of Innovative Steel Production Technologies. J. Clean. Prod. 2014, 84, 563–580. [Google Scholar] [CrossRef]
  36. Energiewende, A.; Institute, W. Breakthrough Strategies for Climate-Neutral Industry in Europe: Policy and Technology; Smart Energy for Europe Platform (SEFEP) gGmbH: Berlin, Germany, 2021. [Google Scholar]
  37. Bloomberg NEF. Decarbonizing Steel: Technologies and Costs; Bloomberg NEF: New York, NY, USA, 2021. [Google Scholar]
  38. Mission Possible: Reaching Net-Zero Carbon Emissions from Harder-to-Abate Sectors. 2018. Available online: https://www.energy-transitions.org/publications/mission-possible/ (accessed on 11 June 2023).
  39. Fleiter, T.; Arens, M.; Herbst, A.; Rehfeldt, M. Industrial Innovation: Pathways to Deep Decarbonisation of Industry. Part 2: Scenario Analysis and Pathways to Deep Decarbonisation; ICF: Lexington, KY, USA, 2019. [Google Scholar]
  40. Agency, I.E.; Kueppers, M.; Hodgson, D.; Levi, P.; Vass, T.; Lechtenbohmer, T. IEA 2022, Iron and Steel; IEA: Paris, France, 2022. [Google Scholar]
  41. Material Economics. Industrial Transformation 2050 Industrial Transformation 2050. 2019. Available online: https://materialeconomics.com/material-economics-industrial-transformation-2050.pdf?cms_fileid=303ee49891120acc9ea3d13bbd498d13 (accessed on 11 June 2023).
  42. McKinsey. Decarbonization of Industrial Sectors: The Next Frontier; McKinsey: London, UK, 2018. [Google Scholar]
  43. European Commission. Updating the 2020 New Industrial Strategy: Building a Stronger Single Market for Europe’s Recovery; European Commission: Brussels, Belgium, 2021. [Google Scholar]
  44. ArcelorMittal. Climate Action Report 2; ArcelorMittal: Luxembourg, 2021. [Google Scholar]
  45. Tata Steel. Carbon Neutral Steelmaking Is a Major Challenge for the Steel Industry Worldwide; Tata Steel: London, UK, 2022. [Google Scholar]
  46. Tata Steel. Tata Steel Opts for Hydrogen Route at Its IJmuiden Steelworks; Tata Steel Group: London, UK, 2021. [Google Scholar]
  47. Tata Steel. Transformation of the Steel Industry Can Become a Successful Model for the Transition to Climate Neutrality. Available online: https://www.tatasteeleurope.com/corporate/news/tata-steel-opts-for-hydrogen-route-at-its-ijmuiden-steelworks (accessed on 11 June 2023).
  48. Thyssenkrupp. Transformation of the Steel Industry Can Become a Successful Model for the Transition to Climate Neutrality. Available online: https://www.thyssenkrupp.com/en/newsroom/press-releases/pressdetailpage/transformation-of-the-steel-industry-can-become-a-successful-model-for-the-transition-to-climate-neutrality-113235 (accessed on 11 June 2023).
  49. Register, U.S.A.F. Executive Order 14008 of January 27, 2021, Tackling the Climate Crisis at Home and Abroad; Executive Office of the President: Washington, DC, USA, 2021.
  50. United States Department of State and the United States Executive Office of the President. The Long-Term Strategy of the United States: Pathways to Net-Zero Greenhouse Gas Emissions by 2050; Executive Office of the President: Washington, DC, USA, 2021.
  51. Kempken, T.; Hauck, T.; Wang, C.; Santis, M.; Szulc, W.; Draxler, M.; Sormann, A.; Queipo, P.; Miranda, M.; Croon, D.; et al. Decarbonisation Pathways 2030 and 2050 (Deliverable D1.7); Green Steel for Europe Consortium: Brussels, Belgium, 2021. [Google Scholar]
  52. Green Steel Tracker. Available online: https://www.industrytransition.org/green-steel-tracker/ (accessed on 11 June 2023).
  53. Toktarova, A.; Göransson, L.; Johnsson, F. Design of Clean Steel Production with Hydrogen: Impact of Electricity System Composition. Energies 2021, 14, 8349. [Google Scholar] [CrossRef]
  54. United States Energy Information Administration. Manufacturing Energy Consumption Survey (MECS): 2018 MECS Survey Data; United States Energy Information Administration: Washington, DC, USA, 2021.
  55. Vicente, A. Ferrous Scrap—A Key Factor in Steel Decarbonization; Steel Times International: Guildford, UK, 2022. [Google Scholar]
  56. Improve the EAF Scrap Route for a Sustainable Value Chain in the EU Circular Economy Scenario. Roadmap. An Evolution Document for a Strategic Look to the Future of European EAF Steelmaking; ESTEP: Brussels, Belgium, 2021.
  57. CirculArity Enhancements by Low Quality Scrap Analysis and Refinement; Horizon Europe: Brussels, Belgium, 2022.
  58. de la Peña, B.; Iriondo, A.; Galletebeitia, A.; Gutierrez, A.; Rodriguez, J.; Lluvia, I.; Vicente, A. Toward the Decarbonization of the Steel Sector: Development of an Artificial Intelligence Model Based on Hyperspectral Imaging at Fully Automated Scrap Characterization for Material Upgrading Operations. Steel Res. Int. 2023. [Google Scholar] [CrossRef]
  59. ArcelorMittal. ALTXOR. Proceso Robotizado Optimizado Para Mejorar La Calidad de Chatarras de Acero; ArcelorMittal: Luxembourg, 2023. [Google Scholar]
  60. Nogueira, C.A.; Trancoso, M.A.; Pedrosa, F.; Crujeira, A.T.; Oliveira, P.C.; Gonçalves, A.M.; Margarido, F.; Santos, R.N.; Durão, F.; Guimarães, C. The Role of Automated Sorting in the Recovery of Aluminium Alloys Waste. In Wastes: Solutions, Treatments and Opportunities; CRC Press: Boca Raton, FL, USA, 2015. [Google Scholar] [CrossRef]
  61. Margarido, F.; Santos, R.N.; Durão, F.; Guimarães, C.; Nogueira, C.; Oliveira, P.; Pedrosa, F.; Gonçalves, A.M. Separation of Non-Ferrous Frations of Shredded End-of-Life Vehicles for Valorising Its Alloys. In Proceedings of the Proceedings of the International Conference on Mining, Material and Metallurgical Engineering, Prague, Czech Republic, 11–12 August 2014. [Google Scholar]
  62. Vicente Rojo, A. New Methods for Ferrous Raw Materials Characterization in Electric Steelmaking; Universidad del País Vasco: Bilbao, Spain, 2020. [Google Scholar]
  63. Vicente, A.; Picon, A.; Barco, E. New Method for Estimating the Economic Penalties of Ferrous Scraps in the Steelmaking Industry Due to Material Degradation during Its Storage in Scrap Yards. Ironmak. Steelmak. 2020, 47, 473–481. [Google Scholar] [CrossRef]
  64. Rodríguez, D.J.; Vicente, A.; Jaras, R.; Sorrosal, G.; Arteche, J.A.; Lago, R.A. Digital Solution for Optimazing Scrap Yard Management. 2023. Available online: https://imis.aist.org/store/detail.aspx?id=PR-387-082 (accessed on 11 June 2023).
  65. ArcelorMittal HYPER-DEEPSCRAP. Clasificador Avanzado de Residuos Procedente Del Tratamiento de Chatarra Férrica de Acería; ArcelorMittal: Luxembourg, 2021. [Google Scholar]
  66. Le Coq, X.; Russo, P. Birat Quality of Heavy Market Scrap—Development of New and Simple Methods for Quality Assessment and Quality Improvement: Final Report; European Commission, Directorate-General for Research and Innovation; European Commission: Brussels, Belgium, 2002. [Google Scholar]
  67. Trancoso, M.A.; Nogueira, C.; Calisto, S. Validation and Setting up Quality Control for Characterization of Aluminum Alloys in Non-Ferrous Fraction of Auto-Shredders. SN Appl. Sci. 2020, 2, 1762. [Google Scholar] [CrossRef]
  68. European Commission; Directorate-General for Research and Innovation; Grieco, R.; Zani, M.; Bengtson, A.; Brunk, M.; Noll, R.; Appell, A.; Gurell, J.; Chiarotti, U.; et al. Inline Elemental Characterisation of Scrap Charging for Improved EAF Charging Control and Internal Scrap Recycling (IPRO); Publications Office: Luxembourg, 2015. [Google Scholar]
  69. Nuñez, E.; Priyadarshi, H.; Picco, A.; Vicente, A. New Methodology for Estimating the Influence of Cu Content of Ferrous Scrap Materials in the Total Cost of Operation (TCO) of Scrap Mix in Electric Arc Furnace Steelmaking. In Proceedings of the EASES (European Academic Symposium on EAF Steelmaking), Oulu, Finland, 5 June 2023. [Google Scholar]
  70. Armellini, D.; Ometto, M.; Ponton, C. 2022 International Joint Conference on Neural Networks (IJCNN); IEEE: Piscataway, NJ, USA, 2022. [Google Scholar]
  71. Bavestrelli, G. AISTech 2023. In Proceedings of the Iron & Steel Technology Conference, Detroit, MI, USA, 8–11 May 2023. [Google Scholar]
  72. European Commission; Directorate-General for Research and Innovation; Pierre, R.; Ansseau, O.; Pierret, J.; Gutierrez, J.; Frittella, P.; Unamuno, I.; Milling, O. Optimization of Scrap Charge Management and Related Process Adaptation for Performances Improvement and Cost Reduction (OPTISCRAPMANAGE): Final Report; Publications Office: Luxembourg, 2021. [Google Scholar]
  73. AUTOMATIA—Soluciones de Inteligencia Artificial Para La Automatización y Control de Sistemas y Procesos Productivos (ZE-2020/00032) 2022. Available online: https://www.hinegroup.com/es/innovacion/proyectos-hazitek/ (accessed on 11 June 2023).
  74. Romagnoli, S.; Tarabu, C.; Maleki Vishkaei, B.; De Giovanni, P. The Impact of Digital Technologies and Sustainable Practices on Circular Supply Chain Management. Logistics 2023, 7, 1. [Google Scholar] [CrossRef]
  75. SCHROTT24 GMBH Scrap Dealing in the Digital Age: A Transparent and Efficient Platform for Price and Supply Chain Management. Available online: https://cordis.europa.eu/project/id/816314 (accessed on 25 June 2023).
  76. Miletic, I.; Garbaty, R.; Waterfall, S.; Mathewson, M. Model-based optimization of scrap steel purchasing. IFAC Proc. Vol. 2007, 40, 263–266. [Google Scholar] [CrossRef]
  77. Dock, J.; Wallner, S.; Traupmann, A.; Kienberger, T. Provision of Demand-Side Flexibility through the Integration of Power-to-Gas Technologies in an Electric Steel Mill. Energies 2022, 15, 5815. [Google Scholar] [CrossRef]
  78. Bampaou, M.; Panopoulos, K.; Seferlis, P.; Sasiain, A.; Haag, S.; Wolf-Zoellner, P.; Lehner, M.; Rog, L.; Rompalski, P.; Kolb, S.; et al. Economic Evaluation of Renewable Hydrogen Integration into Steelworks for the Production of Methanol and Methane. Energies 2022, 15, 4650. [Google Scholar] [CrossRef]
  79. International Energy Agency (IEA). The Future of Hydrogen; IEA: Paris, France, 2019. [Google Scholar]
  80. International Renewable Energy (IRENA). Green Hydrogen Cost Reduction: Scaling up Electrolysers to Meet the 1.5 °C Climate Goal; IRENA: Abu Dhabi, United Arab Emirates, 2020. [Google Scholar]
  81. IEA. Global Hydrogen Review 2022; IEA: Paris, France, 2022. [Google Scholar]
  82. Turner, L.A.; Delasalle, F.; Kettleborough, I.; Wagner, A.; Hall, A.; Atreya, M.; Graham, A.; Mazzanti, T.; Meldrum, M.; Morrison, H.; et al. Making the Hydrogen Economy Possible: Accelerating Clean Hydrogen in an Electrified Economy; Mission Possible Partnership, Energy Transitions Commission: Leusden, The Netherlands, 2021. [Google Scholar]
  83. IEA—International Energy Agency. Available online: https://www.iea.org (accessed on 25 June 2023).
  84. Hölling, M.; Gellert, S. Direct Reduction: Transition from Natural Gas to Hydrogen? ASMET: Viena, Austria, 2018. [Google Scholar]
  85. Cheng, W.; Lee, S. How Green Are the National Hydrogen Strategies? Sustainability 2022, 14, 1930. [Google Scholar] [CrossRef]
  86. World Energy Council, in Collaboration with EPRI and PwC World Energy Council. National Hydrogen Strategies 2021; World Energy Council: London, UK, 2021. [Google Scholar]
  87. Pawelec, G.; Muron, M.; Bracht, J.; Boonet-Cantalloube, B.; Floristean, A.; Brahy, N. Hydrogen Europe. Clean Hydrogen Monitor 2020; Hydrogen Europe Intelligence Department: Brussels, Belgium, 2020. [Google Scholar]
  88. European Commission. A Hydrogen Strategy for a Climate-Neutral Europe; European Commission: Brussels, Belgium, 2020. [Google Scholar]
  89. Ministry for Ecological Transition and the Demographic Challenge (MITERD). Hoja de Ruta Del Hidrógeno: Una Apuesta Por El Hidrógeno Renovable; Ministry for Ecological Transition and Demographic Challenge (MITERD): Madrid, Spain, 2020.
  90. The European Hydrogen Backbone (EHB) Initiative|EHB European Hydrogen Backbone. Available online: https://www.ehb.eu/ (accessed on 11 June 2023).
  91. National Academies of Sciences, Engineering, and Medicine. Accelerating Decarbonization in the United States Energy Sector; National Academies of Sciences, Engineering, and Medicine: Washington, DC, USA, 2021. [Google Scholar]
  92. European Network of Transmission System Operators for Electriciy (ENTSO-E). Electricity in Europe 2017: Synthetic Overview of Electric System Consumption, Generation and Exchanges in 34 European Countries; ENTSO-E: Brussels, Belgium, 2017. [Google Scholar]
  93. Quarterly Report on European Electricity Markets 2022; European Commission: Brussels, Belgium, 2022.
  94. European Commission. European Green Deal: Delivering on Our Targets; European Commission: Brussels, Belgium, 2021. [Google Scholar]
  95. Kempken, T.; Hauck, T.; Santis, M.D.; Rodriguez, P.Q.; Miranda, M.; Gonzalez, D.; Simonelli, F.; Vu, H.; Szulc, W.; Croon, D.; et al. Collection of Possible Decarbonisation Barriers; Green Steel for Europe Consortium: Brussels, Belgium, 2021. [Google Scholar]
  96. EU Emissions Trading System (EU ETS) 2022; European Commission: Brussels, Belgium, 2022.
  97. Stede, J.; Pauliuk, S.; Hardadi, G.; Neuhoff, K. Carbon Pricing of Basic Materials: Incentives and Risks for the Value Chain and Consumers. Ecol. Econ. 2021, 189, 107168. [Google Scholar] [CrossRef]
  98. Establishing a Carbon Border Adjustment Mechanism 2021. Available online: https://eur-lex.europa.eu/legal-content/en/TXT/?uri=CELEX%3A52021PC0564 (accessed on 25 June 2023).
  99. Ember. EU Carbon Price Tracker; Ember: Galston, UK, 2022. [Google Scholar]
  100. World Steel Association. Climate Change and the Production of Iron and Steel; World Steel Association: Brussels, Belgium, 2021. [Google Scholar]
  101. European Commission 2050 Long-Term Strategy. Available online: https://climate.ec.europa.eu/eu-action/climate-strategies-targets/2050-long-term-strategy_en (accessed on 25 June 2023).
  102. Mallapaty, S. How China Could Be Carbon Neutral by Mid-Century. Nature 2020, 586, 482–483. [Google Scholar] [CrossRef] [PubMed]
  103. China Baowu Steel Group Corporation Limited. Corporate Social Responsibility Report; China Baowu Steel Group Corporation Limited: Shanghai, China, 2020. [Google Scholar]
  104. ArcelorMittal. ArcelorMittal Integrated Annual Review 2021; ArcelorMittal: Luxembourg, 2021. [Google Scholar]
  105. Nippon Steel. Nippon Steel Sustainability Report 2021; Nippon Steel Corporation: Tokyo, Japan, 2021. [Google Scholar]
  106. POSCO Corporate. Citizenship Report 2020; POSCO: Seoul, Republic of Korea, 2020. [Google Scholar]
  107. SALCOS Saltziger. Available online: https://salcos.salzgitter-ag.com/en/index.html?no_cache=1 (accessed on 25 June 2023).
  108. Tata Steel. Tata Steel in Europe Sustainability Report 2019/2020; Tata Steel Europe Limited: Ijmuiden, The Netherlands, 2020. [Google Scholar]
  109. Voestalpine Corporate. Responsability Report 2020; Voestalpine AG: Linz, Austria, 2020. [Google Scholar]
  110. García Higuera, A.; Van Woensel, L. Carbon-Free Steel Production: Cost Reduction Options and Usage of Existing Gas Infrastructure; European Parliamentary Research Service: Brussels, Belgium, 2021. [Google Scholar]
  111. Chan, Y.; Petithuguenin, L.; Fleiter, T.; Herbst, A.; Arens, M.; Stevenson, P. Industrial Innovation: Pathways to Deep Decarbonisation of Industry. Part 1: Technology Analysis; ICF Consulting Services Limited and Fraunhofer ISI: London, UK, 2019. [Google Scholar]
  112. U.S. Department of Energy Advanced Manufacturing Office. Manufacturing Energy and Carbon Footprint: All Manufacturing (2018 MECS); U.S. Department of Energy Advanced Manufacturing Office: Washington, DC, USA, 2021.
  113. Otto, A.; Robinius, M.; Grube, T.; Schiebahn, S.; Praktiknjo, A.; Stolten, D. Power-to-Steel: Reducing CO2 through the Integration of Renewable Energy and Hydrogen into the German Steel Industry. Energies 2017, 10, 451. [Google Scholar] [CrossRef]
  114. Orcajo, G.A.; Pedrayes, F.; Cano, J.M.; Norniella, J.G.; Rojas, C.H.; Rodríguez, J. Voltage Sag Ride-Through in a Joint Installation of a Hot Rolling Mill Plant and a Wind Farm. IEEE Trans. Ind. Appl. 2023, 59, 5190–5200. [Google Scholar] [CrossRef]
  115. Orcajo, G.A.; Diez, J.R.; Cano, J.M.; Norniella, J.G.; Pedrayes González, J.F.; Rojas, C.H. Coordinated Management of Electrical Energy in a Steelworks and a Wind Farm. IEEE Trans. Ind. Appl. 2022, 58, 5488–5502. [Google Scholar] [CrossRef]
  116. Rodríguez, D.J.; Alonso Orcajo, G.; Cano, J.M.; GNorniella, J.; Vicente, A. Thermal Analysis of Dry-Type Air-Core Coils for the Optimization of Passive Filtering Systems. Energies 2020, 13, 4540. [Google Scholar] [CrossRef]
  117. Alonso Orcajo, G.A.; Rodríguez Diez, J.; Cano, J.M.; Norniella, J.G.; Pedrayes González, J.F.; Rojas, C.H.; Ardura, G.P.; Cifrián, R.D. Enhancement of Power Quality in an Actual Hot Rolling Mill Plant Through a STATCOM. IEEE Trans. Ind. Appl. 2020, 56, 3238–3249. [Google Scholar] [CrossRef]
  118. Orcajo, G.A.; Rodríguez, J.; Cano, J.M.; Norniella, J.G.; Ardura, P.; Llera, R.; Cifrián, D. Retrofit of a Hot Rolling Mill Plant with Three-Level Active Front End Drives. IEEE Trans. Ind. Appl. 2018, 54, 2964–2974. [Google Scholar] [CrossRef]
  119. Orcajo, G.A.; Ardura, P.; Rodríguez, J.; Cano, J.M.; Norniella, J.G.; Llera, R.; Cifrián, D. Overcurrent Protection Response of a Hot Rolling Mill Filtering System: Analysis of the Process Conditions. IEEE Trans. Ind. Appl. 2017, 53, 2596–2607. [Google Scholar] [CrossRef]
  120. Dudin, M.N.; Reshetov, K.Y.; Mysachenko, V.I.; Mironova, N.N.; Divnenko, O.V. “Green Technology” and Renewable Energy in the System of the Steel Industry in Europe. IJEEP 2017, 7, 310–315. [Google Scholar]
  121. de Beer, J.; Worrell, E.; Blok, K. Future Technologies for Energy-Efficient Iron and Steel Making. Annu. Rev. Energy Environ. 1998, 23, 123–205. [Google Scholar] [CrossRef]
  122. Xu, Z.; Zheng, Z.; Gao, X. Energy-Efficient Steelmaking-Continuous Casting Scheduling Problem with Temperature Constraints and Its Solution Using a Multi-Objective Hybrid Genetic Algorithm with Local Search. Appl. Soft Comput. 2020, 95, 106554. [Google Scholar] [CrossRef]
  123. Lian, X.; Zheng, Z.; Wang, C.; Gao, X. An Energy-Efficient Hybrid Flow Shop Scheduling Problem in Steelmaking Plants. Comput. Ind. Eng. 2021, 162, 107683. [Google Scholar] [CrossRef]
  124. Energy Efficient Solutions for EAF Steelmaking|Journal of Achievements in Materials and Manufacturing Engineering. Available online: https://journalamme.org/resources/html/article/details?id=180436&language=en (accessed on 11 June 2023).
  125. Full Article: News of 50 Hertz. Available online: https://www.50hertz.com/en/News/FullarticleNewsof50Hertz/13545/using-renewables-to-ensure-grid-stability-50hertz-and-enertrag-launch-voltage-stability-pilot-project (accessed on 6 August 2023).
  126. Alvarez, M. Gobierno Vasco y Sidenor se Asocian para Comprar Ocho Parques Solares en Cataluña. Available online: https://www.elcorreo.com/Economia/gobierno-vasco-sidenor-asocian-comprar-ocho-parques-cataluna-20230728115254-nt.html (accessed on 6 August 2023).
  127. Storm Builds Belgium’s First Subsidy-Free Wind Farm at the ArcelorMittal Site in Ghent|Storm Be. Available online: https://www.storm.be/en/windfarm/haven-gent-phase-3b-0/news/storm-builds-belgiums-first-subsidy-free-wind-farm-arcelormittal-site-ghent (accessed on 6 August 2023).
  128. Fontenoy, E. Eneco and ArcelorMittal Unveil Belgium’s Largest Solar Roof. Available online: https://belgium.arcelormittal.com/en/eneco-and-arcelormittal-unveil-belgiums-largest-solar-roof/ (accessed on 6 August 2023).
  129. Wei, M.; McMillan, C.A.; de la Rue du Can, S. Electrification of Industry: Potential, Challenges and Outlook. Curr. Sustain. Renew. Energy Rep. 2019, 6, 140–148. [Google Scholar] [CrossRef]
  130. Hasanbeigi, A.; Kirshbaum, L.A. Industrial Electrification in U.S. States; Global Efficiency Intelligence: St. Petersburg, FL, USA.
  131. Lechtenböhmer, S.; Nilsson, L.J.; Åhman, M.; Schneider, C. Decarbonising the Energy Intensive Basic Materials Industry through Electrification—Implications for Future EU Electricity Demand. Energy 2016, 115, 1623–1631. [Google Scholar] [CrossRef]
  132. Barberouss, M.; Apostolou, M.; Debregeas, A.; Bono, C. Electrification of Primary Steel Production Based on ΣIDERWIN Process: Simulation the European Power System in 2050; European Council for an Energy Efficient Economy: Stockholm, Sweden, 2020. [Google Scholar]
  133. ArcelorMittal. ArcelorMittal and John Cockerill Announce Plans to Develop World’s First Industrial Scale Low Temperature, Iron Electrolysis Plant. Available online: https://corporate.arcelormittal.com/media/press-releases/arcelormittal-and-john-cockerill-announce-plans-to-develop-world-s-first-industrial-scale-low-temperature-iron-electrolysis-plant/ (accessed on 6 August 2023).
  134. Ren, L.; Zhou, S.; Peng, T.; Ou, X. A Review of CO2 Emissions Reduction Technologies and Low-Carbon Development in the Iron and Steel Industry Focusing on China. Renew. Sustain. Energy Rev. 2021, 143, 110846. [Google Scholar] [CrossRef]
  135. Fan, Z.; Friedmann, S.J. Low-Carbon Production of Iron and Steel: Technology Options, Economic Assessment, and Policy. Joule 2021, 5, 829–862. [Google Scholar] [CrossRef]
  136. Elsheikh, H.; Eveloy, V. Assessment of Variable Solar- and Grid Electricity-Driven Power-to-Hydrogen Integration with Direct Iron Ore Reduction for Low-Carbon Steel Making. Fuel 2022, 324, 124758. [Google Scholar] [CrossRef]
  137. Birat, J.-P. 16—Carbon Dioxide (CO2) Capture and Storage Technology in the Iron and Steel Industry. In Developments and Innovation in Carbon Dioxide (CO2) Capture and Storage Technology; Maroto-Valer, M.M., Ed.; Woodhead Publishing Series in Energy; Woodhead Publishing: Sawston, UK, 2010; Volume 1, pp. 492–521. ISBN 978-1-84569-533-0. [Google Scholar]
  138. Rosa, L.; Mazzotti, M. Potential for Hydrogen Production from Sustainable Biomass with Carbon Capture and Storage. Renew. Sustain. Energy Rev. 2022, 157, 112123. [Google Scholar] [CrossRef]
  139. Koukouzas, N.; Christopoulou, M.; Giannakopoulou, P.P.; Rogkala, A.; Gianni, E.; Karkalis, C.; Pyrgaki, K.; Krassakis, P.; Koutsovitis, P.; Panagiotaras, D.; et al. Current CO2 Capture and Storage Trends in Europe in a View of Social Knowledge and Acceptance. A Short Review. Energies 2022, 15, 5716. [Google Scholar] [CrossRef]
  140. Leeson, D.; Mac Dowell, N.; Shah, N.; Petit, C.; Fennell, P.S. A Techno-Economic Analysis and Systematic Review of Carbon Capture and Storage (CCS) Applied to the Iron and Steel, Cement, Oil Refining and Pulp and Paper Industries, as Well as Other High Purity Sources. Int. J. Greenh. Gas Control. 2017, 61, 71–84. [Google Scholar] [CrossRef]
  141. D’Amore, F.; Romano, M.C.; Bezzo, F. Carbon Capture and Storage from Energy and Industrial Emission Sources: A Europe-Wide Supply Chain Optimisation. J. Clean. Prod. 2021, 290, 125202. [Google Scholar] [CrossRef]
  142. Swennenhuis, F.; de Gooyert, V.; de Coninck, H. Towards a CO2-Neutral Steel Industry: Justice Aspects of CO2 Capture and Storage, Biomass- and Green Hydrogen-Based Emission Reductions. Energy Res. Soc. Sci. 2022, 88, 102598. [Google Scholar] [CrossRef]
  143. ArcelorMittal. ArcelorMittal Inaugurates Flagship Carbon Capture and Utilisation Project at Its Steel Plant in Ghent, Belgium. Available online: https://corporate.arcelormittal.com/media/press-releases/arcelormittal-inaugurates-flagship-carbon-capture-and-utilisation-project-at-its-steel-plant-in-ghent-belgium/ (accessed on 6 August 2023).
  144. ET EnergyWorld. Tata Steel Commissions India’s First Plant for CO2 Capture from Blast Furnace Gas. Available online: https://energy.economictimes.indiatimes.com/news/power/tata-steel-commissions-indias-first-plant-for-co2-capture-from-blast-furnace-gas/86219103 (accessed on 6 August 2023).
  145. Khalid, Y.; Wu, M.; Silaen, A.; Martinez, F.; Okosun, T.; Worl, B.; Low, J.; Zhou, C.; Johnson, K.; White, D. Oxygen Enrichment Combustion to Reduce Fossil Energy Consumption and Emissions in Hot Rolling Steel Production. J. Clean. Prod. 2021, 320, 128714. [Google Scholar] [CrossRef]
  146. Lu, B.; Chen, D.; Chen, G.; Yu, W. An Energy Apportionment Model for a Reheating Furnace in a Hot Rolling Mill—A Case Study. Appl. Therm. Eng. 2017, 112, 174–183. [Google Scholar] [CrossRef]
  147. Von Scheele, J. Decarbonisation and Use of Hydrogen in Reheat Furnaces. In Proceedings of the Aachener Ofenbau- und Thermprocess-Kolloquium, Aachen, Germany, 7–8 October 2021. [Google Scholar]
  148. Tenova. TSX SmartBurner Burning up to 100% Hydrogen. Available online: https://tenova.com/newsroom/latest-tenova/tsx-smartburner-burning-100-hydrogen (accessed on 22 October 2023).
  149. Reheating Furnaces for Steel. Available online: https://www.sms-group.com/es-es/plants/reheating-furnaces (accessed on 22 October 2023).
  150. Danieli. HYDRO MAB to Take a Step Ahead in Green Steel. Available online: https://www.danieli.com/en/news-media/news/danieli-hydro-mab-take-step-ahead-green-steel_37_596.htm (accessed on 22 October 2023).
  151. OVAKO. Ovako First in the World to Heat Steel Using Hydrogen. Available online: https://mb.cision.com/Main/1471/3098033/1236951.pdf (accessed on 22 October 2023).
  152. SMS. Green Power Supply with X-Pact® Eco Grid. Available online: https://www.sms-group.com/services/x-pact-eco-grid (accessed on 15 July 2023).
  153. Shuli, J.; Collini, V. The Revolutionary MIDA Hybrid Minimill for a competitive green steel production. La Metall. Ital. Int. J. Ital. Assoc. Metall. 2023, 75–80. Available online: https://www.aimnet.it/la_metallurgia_italiana/2023/gennaio/10.pdf (accessed on 22 October 2023).
  154. VESTAS. 4 MW Platform Brochure V136-4.5 MW. Available online: https://www.vestas.com/en/products/4-mw-platform/v136-4-5-mw (accessed on 15 July 2023).
  155. Intergovernmental Panel On Climate Change (IPCC). Climate Change 2022—Impacts, Adaptation and Vulnerability: Working Group II Contribution to the Sixth Assessment Report of the Intergovernmental Panel on Climate Change, 1st ed.; Cambridge University Press: Cambridge, UK, 2023; ISBN 978-1-00932-584-4. [Google Scholar]
  156. MIDREX® Process. Available online: https://www.midrex.com/technology/midrex-process/ (accessed on 6 August 2023).
  157. Energy Transition in the European Steel Industry—Reality Not Exception. Available online: https://www.midrex.com/tech-article/energy-transition-in-the-european-steel-industry-reality-not-exception/ (accessed on 6 August 2023).
  158. Atsushi, M.; Uemura, H.; Sakaguchi, T. MIDREX Processes. Kobelco Technol. Rev. 2010, 29, 50–57. [Google Scholar]
  159. Metius, G.; Gaines, H.; Riley, M.F.; Iii, L.E.B.; Damstedt, B. DRI Production Using Coke Oven Gas (COG): Results of the MIDREX® Thermal Reactor SystemTM (TRS®) Testing and Future Commercial Application; AIST: Warrendale, PA, USA, 2015. [Google Scholar]
  160. Rechberger, K.; Conde, A.S.; Spanlang, A.; Kofler, I.; Rechberger, K. Green Hydrogen for Low-Carbon Steelmaking; Primetals Technologies: London, UK, 2021. [Google Scholar]
  161. voestalpine Steel Division. Comparison of Process Technology: MIDREX vs. ENERGIRON; Voestalpine Steel Division: Linz, Austria, 2013. [Google Scholar]
  162. Midrex Technologies, Inc. 2021 World Direct Reduction Statistics; Midrex Technologies, Inc.: Charlotte, NC, USA, 2021. [Google Scholar]
  163. Cavaliere, P. Direct Reduced Iron: Most Efficient Technologies for Greenhouse Emissions Abatement. In Clean Ironmaking and Steelmaking Processes: Efficient Technologies for Greenhouse Emissions Abatement; Cavaliere, P., Ed.; Springer International Publishing: Cham, Switzerland, 2019; pp. 419–484. ISBN 978-3-03021-209-4. [Google Scholar]
  164. Duarte, P. Hydrogen-Based Steelmaking; Millennium Steel: Botany, Australia, 2019. [Google Scholar]
  165. ISO 6976:2016; Calculation of Calorific Values, Density, Relative Density and Wobbe Indices from Composition. ISO: Geneva, Switzerland, 2016. Available online: https://www.iso.org/standard/55842.html (accessed on 12 August 2023).
  166. Kidnay, A.J.; Parrish, W.R.; McCartney, D.G. Fundamentals of Natural Gas Processing; CRC Press: Boca Raton, FL, USA, 2006; ISBN 978-0-42913-564-4. [Google Scholar]
  167. Información Básica de Los Sectores de La Energía En España; Comisión Nacional de Energía (CNE): Madrid, Spain, 1999.
  168. MIDREX NGTM with H2 Addition: Moving from Natural Gas to Hydrogen in Decarbonizing Ironmaking. Available online: https://www.midrex.com/tech-article/moving-from-natural-gas-to-hydrogen-in-decarbonizing-ironmaking/ (accessed on 5 August 2023).
  169. EU Natural Gas. 2023 Data—2010–2022 Historical—2024 Forecast—Price—Quote. Available online: https://tradingeconomics.com/commodity/eu-natural-gas (accessed on 6 August 2023).
  170. Thomas, G. Overview of Storage Development DOE Hydrogen Program; Natural Gas: Livermore, CA, USA, 2000. [Google Scholar]
  171. ArcelorMittal en España. HyDeal España: Hub de Hidrógeno. Available online: https://spain.arcelormittal.com/comunicados/hydeal-espana-hub-hidrogeno/ (accessed on 18 September 2023).
Figure 1. Energy consumption and CO2 emissions in the steelmaking process: (a) BF-BOF route; (b) EAF route [2,21,22].
Energies 16 07360 g001
Figure 2. Crude steel production by production route for the year 2021 [6].
Energies 16 07360 g002
Figure 3. Total CO2 emissions from the steel industry per ton of steel produced [10,20].
Energies 16 07360 g003
Figure 4. Summary of strategic technology pathways [16]. * Carbon capture and storage.
Energies 16 07360 g004
Figure 5. Price data from 2021 to 2022 for the EU ETS [93,99].
Energies 16 07360 g005
Figure 6. Hydrogen’s potential future applications in the steel sector [79,84].
Energies 16 07360 g006
Figure 7. Average annual energy consumption values.
Energies 16 07360 g007
Figure 8. Most representative data on the decarbonization of the reheating furnace.
Energies 16 07360 g008
Figure 9. Annual energy production as a function of average wind speed by a commercial 4.5 MW wind turbine [154].
Energies 16 07360 g009
Figure 10. Most representative data on the decarbonization of the hot rolling mill and the contribution of renewable sources.
Energies 16 07360 g010
Figure 11. New topology of the roughing and finishing mill drives in the hot rolling mill.
Energies 16 07360 g011
Figure 12. Distribution networks that allow for the integration of the electrical systems that take part in the new rolling mill.
Energies 16 07360 g012
Figure 13. Simplified H2 DRI diagram with heater and electricity for heating [156,158,160,163].
Energies 16 07360 g013
Figure 14. Simplified DRI diagram with a fuel heater [156,158,160,163].
Energies 16 07360 g014
Table 1. Developments in the scrap domain.
DevelopmentDescriptionLiterature
Scrap Recycling TechnologiesAdvancements in the scrap recycling technologies, such as shredding, sorting, and separation techniques, have improved the efficiency and effectiveness of scrap processing. These technologies help maximize the recovery of valuable materials from scrap, reducing the reliance on virgin resources.[57,58,59,60,61,62]
Scrap Sorting and ClassificationInnovations in scrap sorting and classification systems enable more precise identification and segregation of different types of scrap. This allows for better material utilization and enhances the quality of the recycled steel. Automated sorting technologies, including sensors and artificial intelligence, are being employed to optimize the scrap sorting process.[57,58,62,63,64,65]
Scrap Quality
Assessment
Quality assessment techniques for scrap, such as spectroscopic analysis, enable the determination of the chemical composition and the impurity levels. Accurate assessment of the scrap quality helps optimize steelmaking processes, maintain product quality, and reduce rejections and waste.[58,62,63,66,67,68,69]
Scrap Management and Traceability SystemsDigital solutions and software platforms are being developed to facilitate scrap management and traceability. These systems enable better tracking of scrap from the collection to processing, ensuring transparency, compliance with regulations, and verification of sustainability claims. They also enhance supply chain efficiency and ease the selection of the most suitable scrap that meets specific steelmaking requirements.[64,70,71,72,73]
Scrap Supply Chain OptimizationOptimization tools and algorithms are being employed to optimize the entire scrap supply chain, including collection, transportation, and processing. These tools help minimize logistical costs, reduce carbon emissions, and improve overall operational efficiency. They consider factors such as scrap availability, transportation routes, and processing capabilities to streamline the supply chain and maximize the resource utilization.[64,69,73,74,75,76]
Table 2. Low-emission steelmaking technological pathways by different steel technologies [21,44].
Energy SourceSteel TechnologyHorizonChallengesIncremental Cost
Renewable EnergyIron electrolysisLong-term
2050
High energy requirements and cost.
Transition to electrolysis.
High
Green hydrogenDRI with green hydrogenMedium-term
2040
Scalability of production and cost.
Integration of DRI with green hydrogen.
Moderate
Smart CarbonUtilizing circular carbon and hydrogen (green or blue), carbon-based products manufactured from waste gasesMedium-term
2040
Scaling up and commercial viability.
Transition to Smart Carbon.
High
Blue HydrogenDRI with blue hydrogen (from reformed NG)Near-termCarbon capture and storage infrastructure and cost.
Integration of DRI with blue hydrogen.
Moderate
DRI and Carbon CaptureDRI current technology with CCSNear-term
2030
CCS infrastructure, integration, and cost.High
Blast Furnace and Carbon CaptureBF current technology and incorporate CCSNear-term
2030
High
Table 3. Pillars for achieving near-zero CO2 emissions in the steelmaking sector [10].
PillarDescriptionLiterature
Energy efficiencyImprove system efficiency, process performance, and thermal energy recovery.
Expand energy management practices.
Increase application of smart manufacturing strategies to reduce energy consumption.
Transition from high-carbon process heat technologies to low-carbon energy sources.
[113,114,115,116,117,118,119,120,121,122,123,124,125,126,127,128]
Industrial electrificationElectrify thermal processes to reduce emissions from fossil fuel combustion.[113,129,130,131,132,133]
LCFFESAdopt clean energy technologies that do not release GHGs.
Develop low-carbon or carbon-free energy sources, including clean hydrogen and synthetic fuels.
[32,53,77,113,114,115,134,135,136]
CCUImplement CCUS as a primary source of long-term emission reductions.
Utilize carbon utilization and storage to achieve additional carbon reductions.
[4,137,138,139,140,141,142,143,144]
Table 5. CO2 associated with DRI.
GJ/tDRINm3 NG/tDRIkg NG/tDRIkg C/tDRIScenariokg C in DRITotal C outkg CO2/tDRI
10257203154.11−15139.1510
2−35119.1437
30154.1565
5040304−151555
Table 6. Energy and gas flow required for different DRI production processes [160,163,164].
Energy100% NGH2 with NG as Fuel (1.5% C in DRI)100% H2 with
Only H2 as Fuel
100% H2 with
Only Electrical Heating
NG process (GJ/tDRI)7.5–7.9--
NG fuel (GJ/tDRI) 12.1–2.92–2.5-
H2 process (GJ/tDRI)-6.1–75.95.9
H2 fuel (GJ/tDRI) 1--2.7-
Electricity (kWh/tDRI) 290–13580–12580–125530–620
tCO2/GJ NG0.05650.0565-
The gas flow required (Nm3/tDRI)255–30060 (NG)/600 (H2)800550
1 Efficiency 60%. 2 Efficiency 85% for heating, including auxiliary needs.
Table 7. Comparison between NG-DRI and H2-DRI with NG to guarantee 1.5% DRI C content.
Energy100% NGH2 with NG as Fuel (1.5% C in DRI)Comparison
NG process (GJ/tDRI)7.7--
NG fuel (GJ/tDRI)2.52.10.4
H2 process (GJ/tDRI)-6.5-
H2 fuel (GJ/tDRI)---
Total NG (GJ/tDRI)10.22.18.1
Total H2 (kg/tDRI) 1-54.2-
Electricity (kWh/tDRI)1209030
1 0.12 GJ per kg is considered [170].
Table 8. H2 break-even price for H2-DRI with NG as fuel providing DRI 1.5% carbon content.
NG Price (EUR/GJ)CO2 Price (EUR/tCO2)
020406080100
10.200.370.540.710.871.04
20.350.520.690.861.021.19
30.500.670.841.011.171.34
40.650.820.991.161.321.49
50.800.971.141.301.471.64
60.951.121.291.451.621.79
71.101.271.441.601.771.94
81.251.421.591.751.922.09
91.401.571.741.902.072.24
101.551.721.882.052.222.39
111.701.872.032.202.372.54
121.852.022.182.352.522.69
Disclaimer/Publisher’s Note: The statements, opinions and data contained in all publications are solely those of the individual author(s) and contributor(s) and not of MDPI and/or the editor(s). MDPI and/or the editor(s) disclaim responsibility for any injury to people or property resulting from any ideas, methods, instructions or products referred to in the content.

