1. Introduction
Advanced technologies, including digital systems and communication standards, have paved the way for the evolution of power systems into smart grids. These smart grids play a crucial role in modern fault detection, measurement, and control applications [
1]. Ensuring the reliability and safety of these systems is now heavily reliant on the accurate and rapid measurement of electrical parameters such as current, voltage, and frequency.
Smart grids are transforming the management and control of power systems by implementing integrated distribution control systems that rely on smart sensors and electronic devices. This marks a departure from traditional approaches, offering more efficient and advanced ways to monitor and regulate electrical distribution [
2].
Smart grid sensors provide real-time, accurate, and reliable data for measuring, monitoring, and safeguarding the network. In Medium-Voltage (MV) smart substations, these sensors convert high voltage and current into a more manageable range, removing the necessity for voltage dividers or current shunts. This simplifies measurement systems and enhances accuracy. Monitoring voltage and current from these sensors is fundamental for assessing power quality [
3].
Low-power current transformers (LPCTs) are being widely implemented in the MV smart grid to transmit digital current data directly from cables to monitoring, protection, and management systems.
LPCTs vary according to their working principle, which includes but is not limited to RCs, fluxgates, and shunt resistors.
This work places particular emphasis on RC current sensors, one of the most prominent types of LPCTs. RCs have increasingly supplanted traditional current transformers in various applications, including power system current measurement for protective relaying [
4,
5], fault location detection [
6,
7], and capturing fast transients [
8].
The digital substation currently uses an LPCT with a digital output that has a communication interface or is incorporated with the MU. Low-Power Instrument Transformers (LPITs) are used in conjunction with MUs as a measuring tool in upgraded MV network monitoring systems because of their high flexibility and low cost.
The MU implements IEC 61850 standards at the process level. It digitalizes voltage and current data from transformers (LPVTs or LPCTs) into sampled values (SV), timestamps them, and sends them over an Ethernet process bus [
9].
Despite their advantages, RC measurement accuracy can be affected by factors like temperature, conductor position, and external disturbances. Consequently, it is essential to calibrate the RC to match real-world measurement conditions. Calibration identifies errors like ratios and phase errors, improving sensor performance in measurements and protection, reducing risks, and avoiding operational delays and improper actions. Moreover, calibrating RCs with digital output involves assessing MU performance specifications, as the accuracy of electrical parameter measurements is closely tied to the timing precision of SV measurements [
9].
Firstly, the calibration of RCs is typically able to determine the ratio error and phase error of the LPCT during the traditional calibration procedure by comparing the output of the transformer under test with that of the reference transformer after application of the same excitation current to the primaries of the two transformers.
Similarly, RCs with digital outputs can be calibrated with some necessary modifications. The digital output of the RC is mathematically compared with the output of the reference transformer, which must be digitized. The mathematical comparison is based on the conversion of the compared signals into the frequency domain by Fast Fourier Transform (FFT). The ratio and displacement errors of the sensor under calibration are evaluated for the fundamental frequency or other frequencies.
Various calibration methods for RCs are available and can be found in the listed references. For instance, in reference [
10], calibration for RCs is carried out to assess the influence of temperature, humidity, and positioning on power quality accuracy, but these calibration methods are primarily designed for RCs with analogue output.
Calibrating RCs with digital output was introduced in [
11,
12] using 16-bit digital voltmeters instead of higher resolution equipment. This calibration process is relatively straightforward but may not offer sufficient accuracy and can be costly due to the requirement of two sampling voltmeters for digitizing comparative signals.
The widespread use of RCs alongside MUs in substations to create digital interfaces has made it crucial to evaluate the performance of this combination for compatibility and functionality. Surprisingly, the calibration of RCs with digital output using MUs has received limited research attention, even though many studies have focused on calibrating MUs independently.
For example, references [
9,
13,
14] provided a calibration method for MUs by comparing each measurement sample from the MU with those from a reference digitizer. This calibration process necessitates precise device synchronization. Synchronization is accomplished through the use of the Network Time Protocol (NTP) and Pulses Per Second (PPS) protocols, which can provide accuracy in the order of microseconds. Further improvements in timing accuracy can be achieved by using other protocols like the Precision Time Protocol (PTP) [
15], also known as IEEE 1588 [
16].
In light of the preceding information, this paper introduces a calibration approach for measuring the RC + MU. This approach is inspired by the literature that explores calibrating the LPCT + MU [
17,
18,
19].
The calibration presented in [
17] was achieved using a broad dynamic range Data Acquisition (DAQ) system with a 24-bit analogue-to-digital (A/D) converter. However, it required the addition of a signal converter to adapt the Reference Transformer (RT) signal to the DAQ card input range, which may slightly reduce the calibration system’s accuracy due to the introduction of additional devices.
Reference [
19] improved the comparator method by replacing a conventional transformer with a standard current sensor in the reference channel. Yet, to counter accuracy issues related to magnetic saturation, they added an additional clamp-shaped sensor without a magnetic core, increasing design complexity.
The key contribution of this study lies in the assessment of accuracy achieved by utilizing a high-sensitivity and high-precision reference sensor, even at high measured current levels, as opposed to traditional current transformers. Additionally, we delve into the necessary implementation prerequisites, including compliance with the IEEE 1588 protocol for precise time synchronization. The calibration process encompasses both steady-state and abnormal conditions, ensuring a comprehensive assessment of the system performance.
Finally, it should be mentioned that the accuracy of the calibration can be affected by sources of uncertainty related to the equipment used, i.e., the higher the accuracy of the devices included in the calibration system, the better the accuracy class in the calibration system. The uncertainty calculation can be performed using Monte Carlo simulation [
20] or according to the ISO guide referred to as GUM [
21]. The Monte Carlo method is a probabilistic modelling and simulation technique that employs probability distributions of input variables to estimate uncertainty. It excels in handling complex and uncertain systems by directly simulating the measurement process. In contrast, GUM offers a systematic approach to estimate and express uncertainty in measurements, employing a combination of analytical and statistical methods. It entails identifying sources of uncertainty, assessing their impacts, and propagating these uncertainties through mathematical models.
In this paper, we diligently assessed the potential contributions of uncertainty and their implications on the calibration results, adhering to the GUM guidelines instead of resorting to the Monte Carlo simulation [
20].
2. Digital LPCT in the MV Substation
Substation automation systems have significantly advanced in recent years due to the total digitalization of all information collected, communicated, and processed at the substation.
The digital electrical signal acquisition technology based on an electronic transformer is no longer reliable or sufficient to satisfy the transition needs of smart substations of a widespread power system. Combining transformers and MUs is a practical alternative for sampling currents/voltages and sharing them within the smart substation.
The three-phase current of the distribution line in the MV substation is now being measured using LPCTs. The core components of the digital LPCT include an analogue sensor and a signal MU.
The choice of LPCT sensor for MV current measurements is influenced by two key factors: the accuracy class and the price. MV sensors typically have an accuracy class limit of 1%, although there are instances where 0.5% or even 0.2% accuracy is necessary, especially for tariff metering applications. Among the available options, Instrument Transformers (ITs), RCs, and shunt resistors emerge as top choices for use in MV networks due to their balanced performance in terms of accuracy and cost considerations.
The non-linearity of current transformers (CTs) and the constrained operating range imposed by the magnetic saturation pose significant challenges when used in MV applications. Shunt resistors also have the drawback of not offering sufficient and reliable galvanic isolation. RCs are the preferred type of LPCTs due to their beneficial characteristics, including simplicity of measurement and the absence of the necessity to open the MV connection while adding or removing the sensor. RCs are an AC measuring transducer made up of uniformly wounded coils having a nonmagnetic core. The coil is used to measure current by wrapping it around the conductor that holds the current.
The absence of an iron core in the RC eliminates the saturation effect, resulting in a linear relationship between the measured primary current and the secondary voltage. The output voltage is directly proportional to the derivative of the primary current.
Because the RC output voltage is proportional to the turns’ area, RC inaccuracy may arise for several reasons, including:
Non-Uniform Turn Density: The wire used to create the coil is extremely thin, leading to variations in the density of turns.
Incomplete Closure: The coil may not be entirely closed, impacting the detection of the output voltage Us.
Turn Irregularity: Irregularities in the arrangement of turns are especially pronounced near the coil end and are often the primary source of inaccuracy.
Due to all these restrictions, the RC sensitivity is not independent of its relative position and inclination. Moreover, parasitic capacitances, including conductor-to-coil, turn-to-turn, and output cable-to-ground capacitance, all have an impact on the frequency response of the RC. This influence can limit the bandwidth of the RC sensor. Hence, manufacturers should calibrate these sensors before releasing them to the market to reduce the possibility of inaccuracies.
In digital substations, the RC sensor connected to the MV connector measures currents. These analogue current measurements are subsequently gathered, digitized, and transmitted to metering or protection systems through an MU. The MU serves as a physical interface that links process equipment (e.g., transformers and sensors) to bay-level devices (including monitoring and protection systems). According to IEC 61850-2 [
22], MU is meant to capture current and voltage signals from transformers/sensors and convert them into the standard digital output format. The merging units can be equipped with analogue inputs for connection to conventional CT/VT or with analogue inputs plus binary I/O for connection to sensors.
IEC 61869-13 [
23] defines the rated analogue inputs as 1/5 A and 100–200 V for CTs and VTs, respectively. Additionally, the standard defines the rated binary inputs as 22.5 mV, 150 mV, and 225 mV for LPCTs and 3.25 V for LPVTs.
IEC 61869-9 defines sample rates as 4.8 kHz for measuring and protective applications and 14.4 kHz for quality measurement applications.
The MU supports the process bus (IEC 61850-9-2 LE [
24]) by transferring sampled values of measured currents/voltages in the form of data packets over the Local Area Network (LAN). This allows for the installation of metering systems in the control room and the use of the Ethernet network for advanced substation data transmission.
MU contains an inbuilt real-time clock that is used to timestamp the measured data. The real-time clock may be free-running or synced from an external signal such as PPS, but the best is the PTP. Due to the timestamps embedded in each SV, the IED receiver can distinguish and arrange all SV packets arriving from a single MU or even multiple MUs in chronological order before processing them.
It should be noted that the digital output often lags the input signal due to timestamp delay. Additionally, encapsulating the sampled value into Ethernet data may result in a delay known as MU process delay time. Thus, incorrect MU data result in inaccurate shared information with simultaneous IEDs leading to inaccurate electrical power measurement and the critical function failure of the protection system.
The IEC 61850-5 [
25] standard for smart grids outlined the time precision criteria for the time tag of events and time-synchronized measurements in five time performance classes, T1 to T5, ranging from 1 ms to 1 μs as shown in
Table 1.
The variations among IEDs stem from the synchronization protocols used. These protocols synchronize the IED clock with the network and maintain its accuracy to a specific precision.
Network-based synchronization protocols, such as the Network Time Protocol (NTP) and the Simple Network Time Protocol (SNTP), offer insufficient synchronization accuracies of 10−1 ms, making them unsuitable for synchronizing all IED substations.
The most demanding substation applications, such as the IEC 61850-9-2 process bus, can be met by the IEEE 1588 network-based time synchronization protocol that has sub-microsecond accuracy.
The benefit of PTP synchronization is that it eliminates the requirement for additional wires that are typically required with the IRIG-B or PPS and instead uses the Ethernet network to communicate with the synchronization signal [
16]. PTP is able to automatically identify and correct the dynamic network time delays for each data packet that may have extra delay from network components such as switches. Due to the transparent clock introduced by IEEE 1588, the time required to pass through the switch is measured, and the clock receiving the PTP message is informed of this time.
However, synchronization inaccuracy can occur for a few reasons, such as the synchronization signal being corrupted within the MU or not being able to reach the source (the GPS receiver). Thus, the MU digital output may lag the input signal due to a timestamping delay. Additionally, encapsulating the sampled value into Ethernet data may result in a delay known as MU process delay time. When the time of the MU data is incorrect, it can lead to inaccurate shared information with simultaneous IEDs and cause incorrect electrical power measurement. This, in turn, can lead to the critical function failure of the protection system. Hence, it is crucial to perform MU calibration regularly. This calibration helps estimate synchronization parameters and compensates for any possible errors, ensuring accurate results.
3. Digital LPCT Calibration
It is important to understand that the readings of a device for a certain quantity can vary over time due to several factors such as temperature, humidity, power supply voltage, and electromagnetic interference. Also, sudden changes in the input quantity can affect the instrument performance during and after those changes. Therefore, the measured current may not be a perfect sine wave. Thus, it is crucial to have a tracking process for the current measuring chain.
Traceability is defined as a continuous chain of permissible comparisons that bind the measuring device to national or international instrument standards.
In general, comparing the LPCT with a standard current measuring instrument in a laboratory setting is critical to ensure the accuracy of the current measurement. The objective of routine LPCT accuracy calibration is to validate the reliability of its performance in terms of accuracy and bandwidth after a period of operation. The calculation of the ratio difference and phase difference is used to assess accuracy calibration.
The LPCT performance can vary under the influence of different typical factors. Calibration becomes more challenging when the LPCT is subject to the simultaneous influence of multiple factors [
10].
3.1. Calibration Method
The aim of this study is to enhance our understanding of the accuracy and performance of RC when used in conjunction with an MU. To achieve this, the work proposes a simple calibration method for RCs with a digital output that can be used in an academic or industrial environment. An appropriate calibration infrastructure has been established to assess the accuracy of the digital current at the nominal current as well as at values above and below the nominal current. It is noteworthy that, in the pursuit of precise operating conditions, we made efforts to maintain consistent ambient temperature and humidity levels. Furthermore, to minimize the potential impact of electromagnetic interference on the RC performance, we increased the distance between the RC and the reference sensor and implemented shielding measures around nearby external conductors.
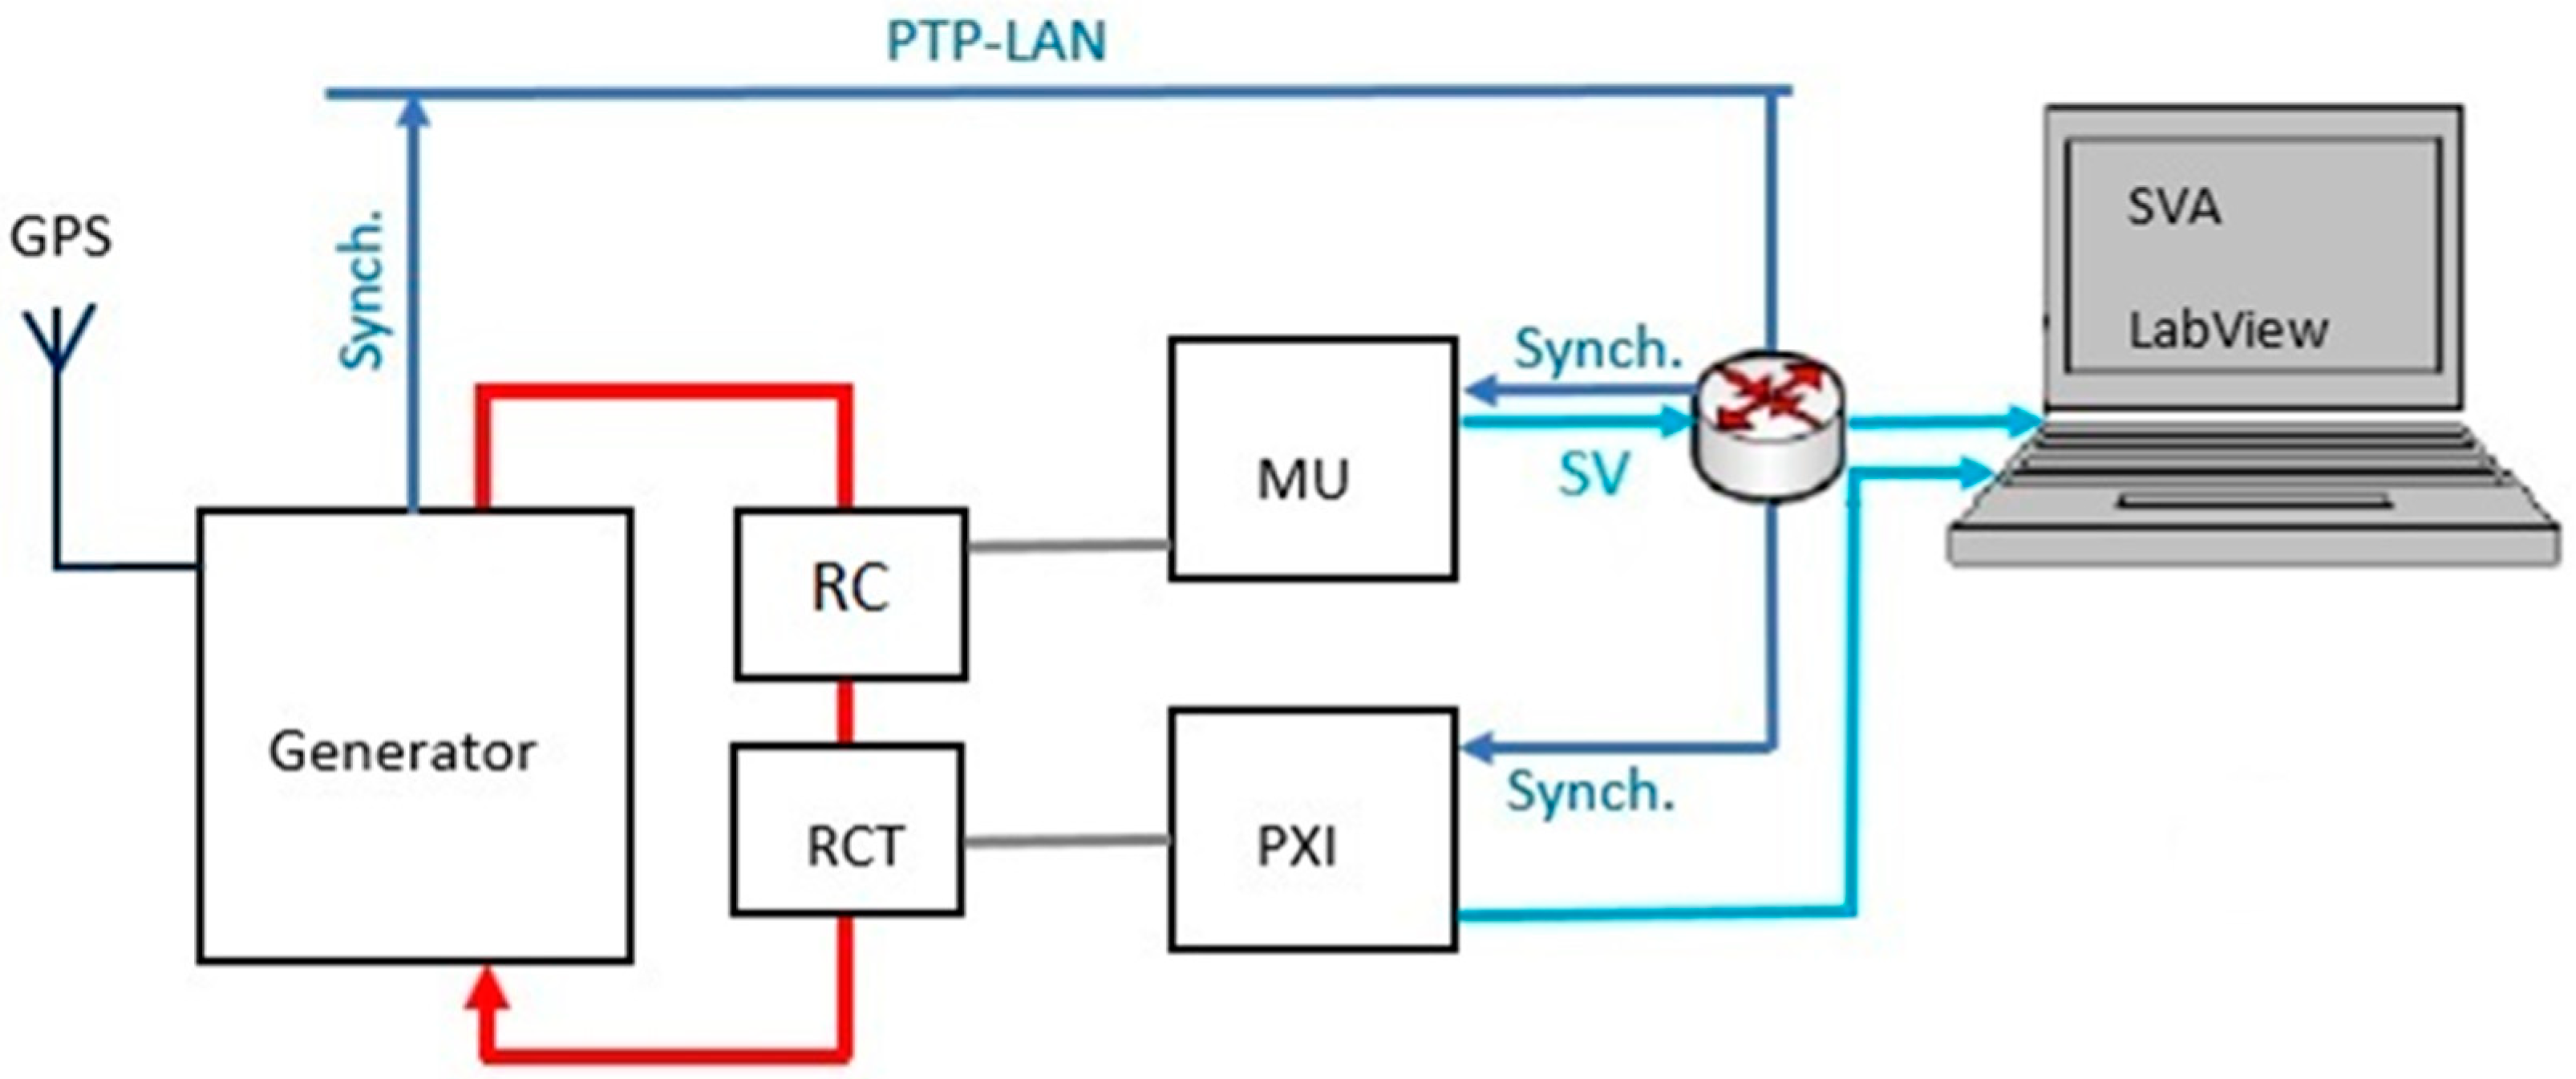
The calibration structure diagram is shown in
Figure 1, and it comprises the following:
Current generator (Omicron CMC 356): It provides a sinusoidal analogue current signal, which represents the high current to be measured.
Calibration channel: It consists of an RC and an MU. The commercial RC is an 80/150 mV (at 50 Hz) transducer, used for MV measurement purposes with accuracy class 0.5. The MU generates SVs after receiving the analogue current measured by the RC sensor.
Standard channel: It consists of a Reference Current Transducer (RCT) and a highly accurate reference digitizer 24-bit resolution ADC. The reference sensor is a commercial fluxgate transducer that has the following features: Nominal input current 600 A, transformation ratio 1500:1. The digitizer consists of an NI PXI-4472 digitizing module and an NI PXI-6682 timing board. The NI PXI-4472 features a 24-bit architecture, ±10 V input, and a sampling rate of 102.4 kS/s.
The calibration platform: This is a set of computer programs that capture and analyze digital output from channels, as well as an error calculation algorithm based on the differential method.
GPS synchronization receiver: It generates the time synchronization signal for accurate synchronization between sampling equipment by tuning its clock oscillator via PPS or PTP protocols.
PTP network: This is a LAN configured with PTP and is used as a synchronization source as well as a sharing network to transmit the data of the MU and PXI to the calibration platform for error calculation.
RC calibration is based on high current loop generation employing a coaxial bus bar with both an RC and RCT to reduce uncertainties caused by conductor position. The RC output is connected to an MU that creates current SVs based on the IEC 61850-9-2 LE standard at a rate of 80 samples/second. The MU sends current SVs to the PTP-LAN network with timestamps at the relevant sampling time. Similarly, the RCT output is digitized and acquired through the NI PXI-4472 Data Acquisition Board (DAB). The NI PXI-4472 ADC clock oscillator is also driven by PTP, allowing for improved signal digitization and enhancing comparison validity.
On the calibration platform, there is a set of computer software that captures current samples of MU and DAB samples.
The Sampled Value Analyzer (SVA 0.93) software was created and developed at the Brno University of Technology for the high-accuracy capture of SV packets, decoding and recording them to a file, and providing real-time waveforms of measured current. The recording file contains the SV ID, MAC destination, MAC source, and sample timestamps. SVA can also show the status of data loss.
The Lab View graphical program can acquire data, record data, and display the waveform of the RCT current. LabView may additionally capture the MU signal in synchronized mode. The recording file contains sample timestamps of the RCT digitized signal.
The MATLAB program is used to create the essential analysis tool required to execute the LPCT error calculation algorithm.
3.2. Calibration Algorithm
The algorithm to estimate the composite error of an LPCT with a digital output is based on the variations between each measurement sample of the synchronized MU and RC. The composite error of the measuring chain can be expressed according to IEC61869-9 [
26] as:
where
iX(n) is the actual instantaneous value of the MU at the sampling time;
iR(n) is the actual instantaneous value of the RC at the sampling time;
N is the nominal sample rate (samples per second) divided by the fundamental frequency (Hz).
Moreover, the amplitude error is simply calculated using the ratio of the difference between the root mean square (RMS) of the current signal measured by the MU and RC to the RMS of the current measured by the RC during each period. However, the determination of the phase error is slightly more complex. Thus, the Fast Fourier Transform (FFT) should be performed on MU and RC samples.
IEC61869-9 defined the ratio/phase error of the measuring chain using FFT on the samples as:
where
is the ratio error and the phase error of the measuring chain;
k is the number of harmonics being measured (k = 1 for the fundamental).
The FFT algorithm starts by subdividing the original set of measurement data, which consists of data gathered synchronously from the MU and RC at a sampling rate of 4 kHz, into n subwindows with 97.5% overlap containing 80 samples (each period contains 80 samples, so that each subsequent period has an overlap of 78 samples from the previous period).
The amplitude/phase of the fundamental harmonic of each signal is obtained by performing FFT analysis at each subwindow. The amplitude/phase differences for each period are determined using the differentiation method between the two values that are given by the FFT at the signal frequency component (50 Hz) of both the MU and RC.
After calculating the differences for each period in the measurement windows, the differences are averaged over
n windows, which gives the final values of the amplitude/phase errors.
where
I1rms,X(n) and
I1rms,R(n) are the RMSs of the first harmonic of the current signal of the MU and RC, respectively, at the
nth sub-window;
φ1X(n) and φ1R(n) are the phases of the first harmonic of the current signal of the MU and RC, respectively, at the nth sub-window;
N is the total number of subwindows.
Similarly, the algorithm is also capable of estimating type-A measurement uncertainties, because the mean and standard deviations of the amplitude and phase errors can also be computed [
14].
3.3. Target Uncertainty for LPCT Calibration
The error represents the difference between the measured value and the true or reference value. Uncertainty expresses the reliability of the measured value. Uncertainty is often described as a range or interval with a corresponding confidence level or probability. It indicates how certain it is that the real value falls within that specified range. The uncertainty value consists of several elements that are estimated using various statistical distributions of the measurement data. These elements include systematic and random influences on the measurements.
According to [
27], the level of uncertainty necessary for the calibration of LPCT is identified by the accuracy class of the calibrated transducer itself.
IEC 61869-6 defined that each accuracy class of the LPCT has limits that should not be exceeded by the ratio/phase error, without mentioning any target uncertainty of the error measurements [
28].
Linearity, temperature and temporal stability, standard calibration, and other factors that have a significant impact on LPCT error measurements mean that the probability distribution of the uncertainty that impacts the calculated ratio/phase error can be considered normal [
29].
The uncertainty sources originate from every device used for LPCT calibration, and the effects of these sources propagate throughout the measurement chain, causing inaccuracies in the ratio/phase error assessment. The following sources of uncertainty are the key factors that limit the accuracy of the measurement in our calibration setup.
Uncertainty induced by the RCT ratio and phase error: The RCT should have an accuracy class that is appropriately lower than that of the RC to be calibrated. The contribution of RCT is the amplitude error of ±0.05% and the phase error of 0.35 mrad.
The uncertainty caused by the reference analogue-to-digital converter of PXI gain and phase error. The contribution of PXI-4472 is the amplitude error ±0.025% and the phase error 0.4 mrad.
The uncertainty caused by the digital value capture programs. The contribution of SVA is the amplitude error of 4.7 × 10⁻⁶ and the phase error of 0.1 mrad.
A type-B evaluation can be used to estimate each of the above-mentioned elements.
3.4. Uncertainty Calculation
The uncertainty analysis in this work is calculated by linear error propagation according to the following equations.
with
uc(y) being the standard uncertainty,
ci are the sensitivity coefficients, and
u(xi) are the standard uncertainties of the input quantities
Xi.
Therefore, the standard measurement uncertainties of the LPCT calibration uc for measurements at nominal current and 50 Hz are calculated by:
with
u(RCT),
u(PXI), and
u(SVA) being the individual standard uncertainties of uncertainty sources.
The expanded uncertainty to the desired confidence level can be calculated as
with
k being the coverage factor that can be
k = 2 for the coverage probability of 95.45% or
k = 3 for the coverage probability of 99.73%.
4. Results
The linearity measurement of the LPCT made up of RC + MU was performed under normal and abnormal operating conditions.
The described procedure was used to calculate the errors of the measuring chain at the primary currents of 16 A, 40 A, 80 A, and 96 A with a frequency of 50 Hz.
During each test, where a single current value is applied to both sensors simultaneously, digital samples of the measured current generated by both channels are recorded for a period of no less than 6 s. Each measurement consists of 4000 samples for a 200 ms window with at least 300 repetitions. Then, the MATLAB environment was used to calculate the errors between Fourier-transformed current signals.
The errors between the samples of the two current signals are calculated according to Equations (3) and (4).
Following the application of the FFT algorithm and subsequent partitioning of the measurement data into subwindows, a minimum of 11,960 values were obtained for each measured current. Subsequently, 11,960 values were identified for both phase error and angle error.
Due to the significant volume of values representing differences between the two current signals, it became imperative to utilize statistical analysis for the calculation of mean error and standard deviation.
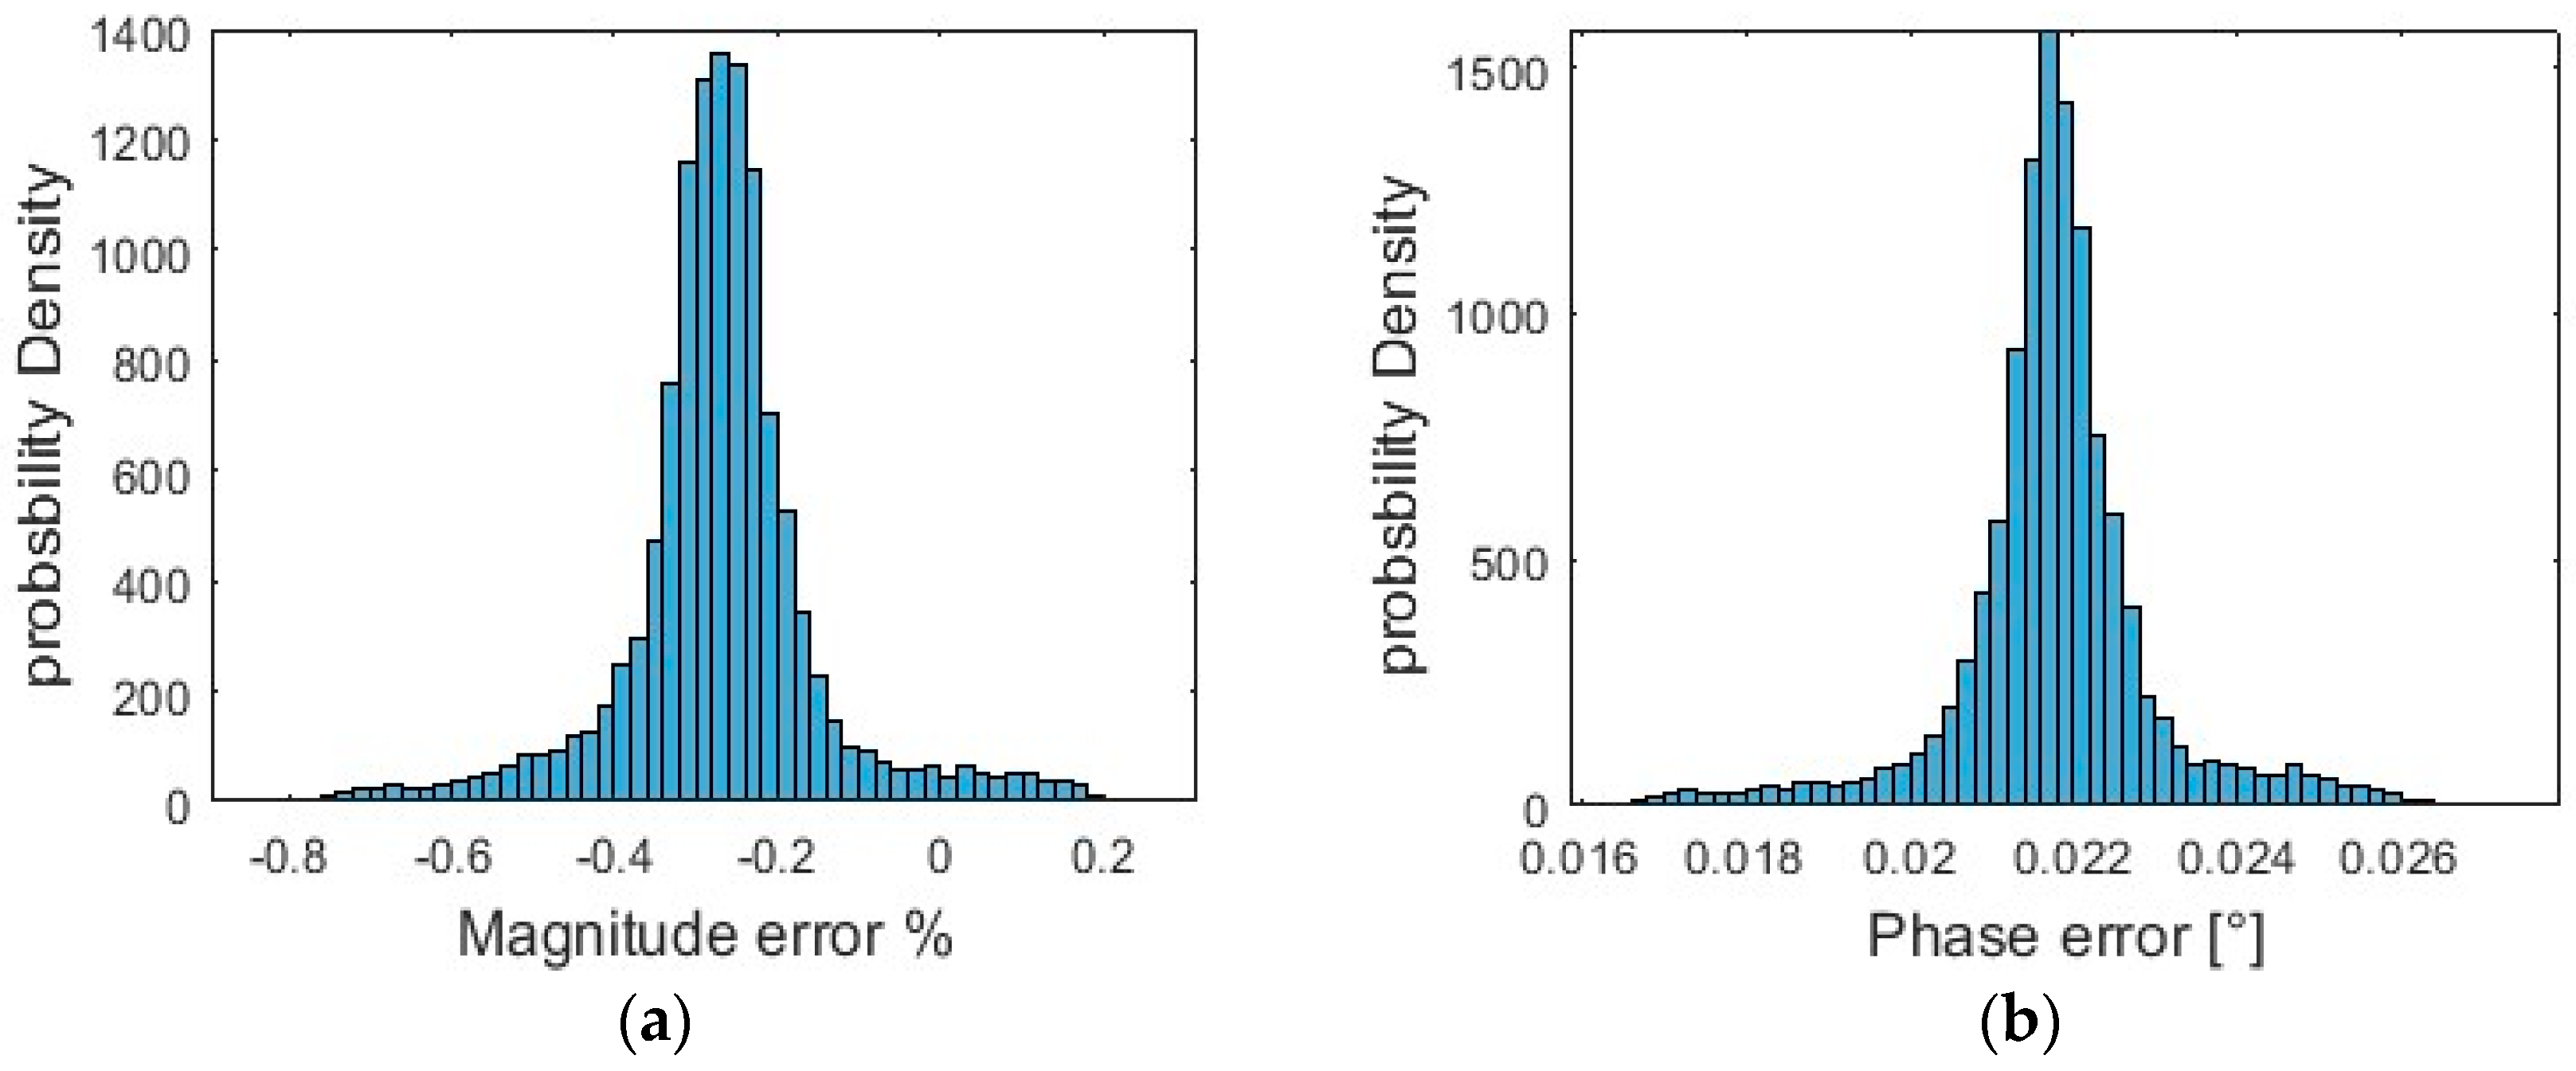
The initial results were derived from tests conducted under steady-state conditions, where the measured current was maintained at the nominal level (80 A) and the frequency at the nominal rate (50 Hz). Subsequently, the estimated Probability Density Function (PDF) for the ratio error ε% can be observed in
Figure 2a, and the estimated PDF for the phase error δ is shown in
Figure 2b. The errors of this measuring chain are a ratio error of −0.26%, phase error of 0.021 rad, and composite error of 2.2%.
In accordance with the Central Limit Theorem, it can be inferred from these data that the PDFs tend to follow a normal distribution, assuming that the measurement process is linear.
It is essential to highlight that the distribution of the phase error appears to be normal, which is in contrast to the assumption of a uniform distribution often made when employing the Monte Carlo method [
29].
To provide a more comprehensive view of the test results, the experiment was duplicated under abnormal operating conditions. This involved using current values that exceeded the nominal current by 120% and lower currents, specifically 5% and 50% below the nominal current. Subsequently, the errors for each measurement were calculated, and the summarized results can be found in
Table 2.
Table 2 indicates that at currents different from the nominal current, the error is relatively greater compared to when the current is at the nominal value.
It is worth noting that the uncertainty mentioned in
Table 2 indicates that the total uncertainty is caused by the measuring devices and the measurement chain (RC + MU).
For uncertainty calculation, the errors that could contribute to uncertainty, obtained from the manufacturer’s brochures for each device, were considered.
The uncertainty in the measurement process was calculated according to Equation (6). The extended standard uncertainty of measurement caused by measurement equipment is calculated as:
where
εRCT,
εPXI, and
εSVA are the maximum errors of the RCT, PXI, and SVA, respectively.
Additionally, 3 is a factor given by the probability of the statistical normal distribution of the error considered.
The results of the calculation of the uncertainty of the measurement equipment were a value of 0.134% for the error of the ratio error and a value of 0.18 mrad for the phase error (for k = 2).
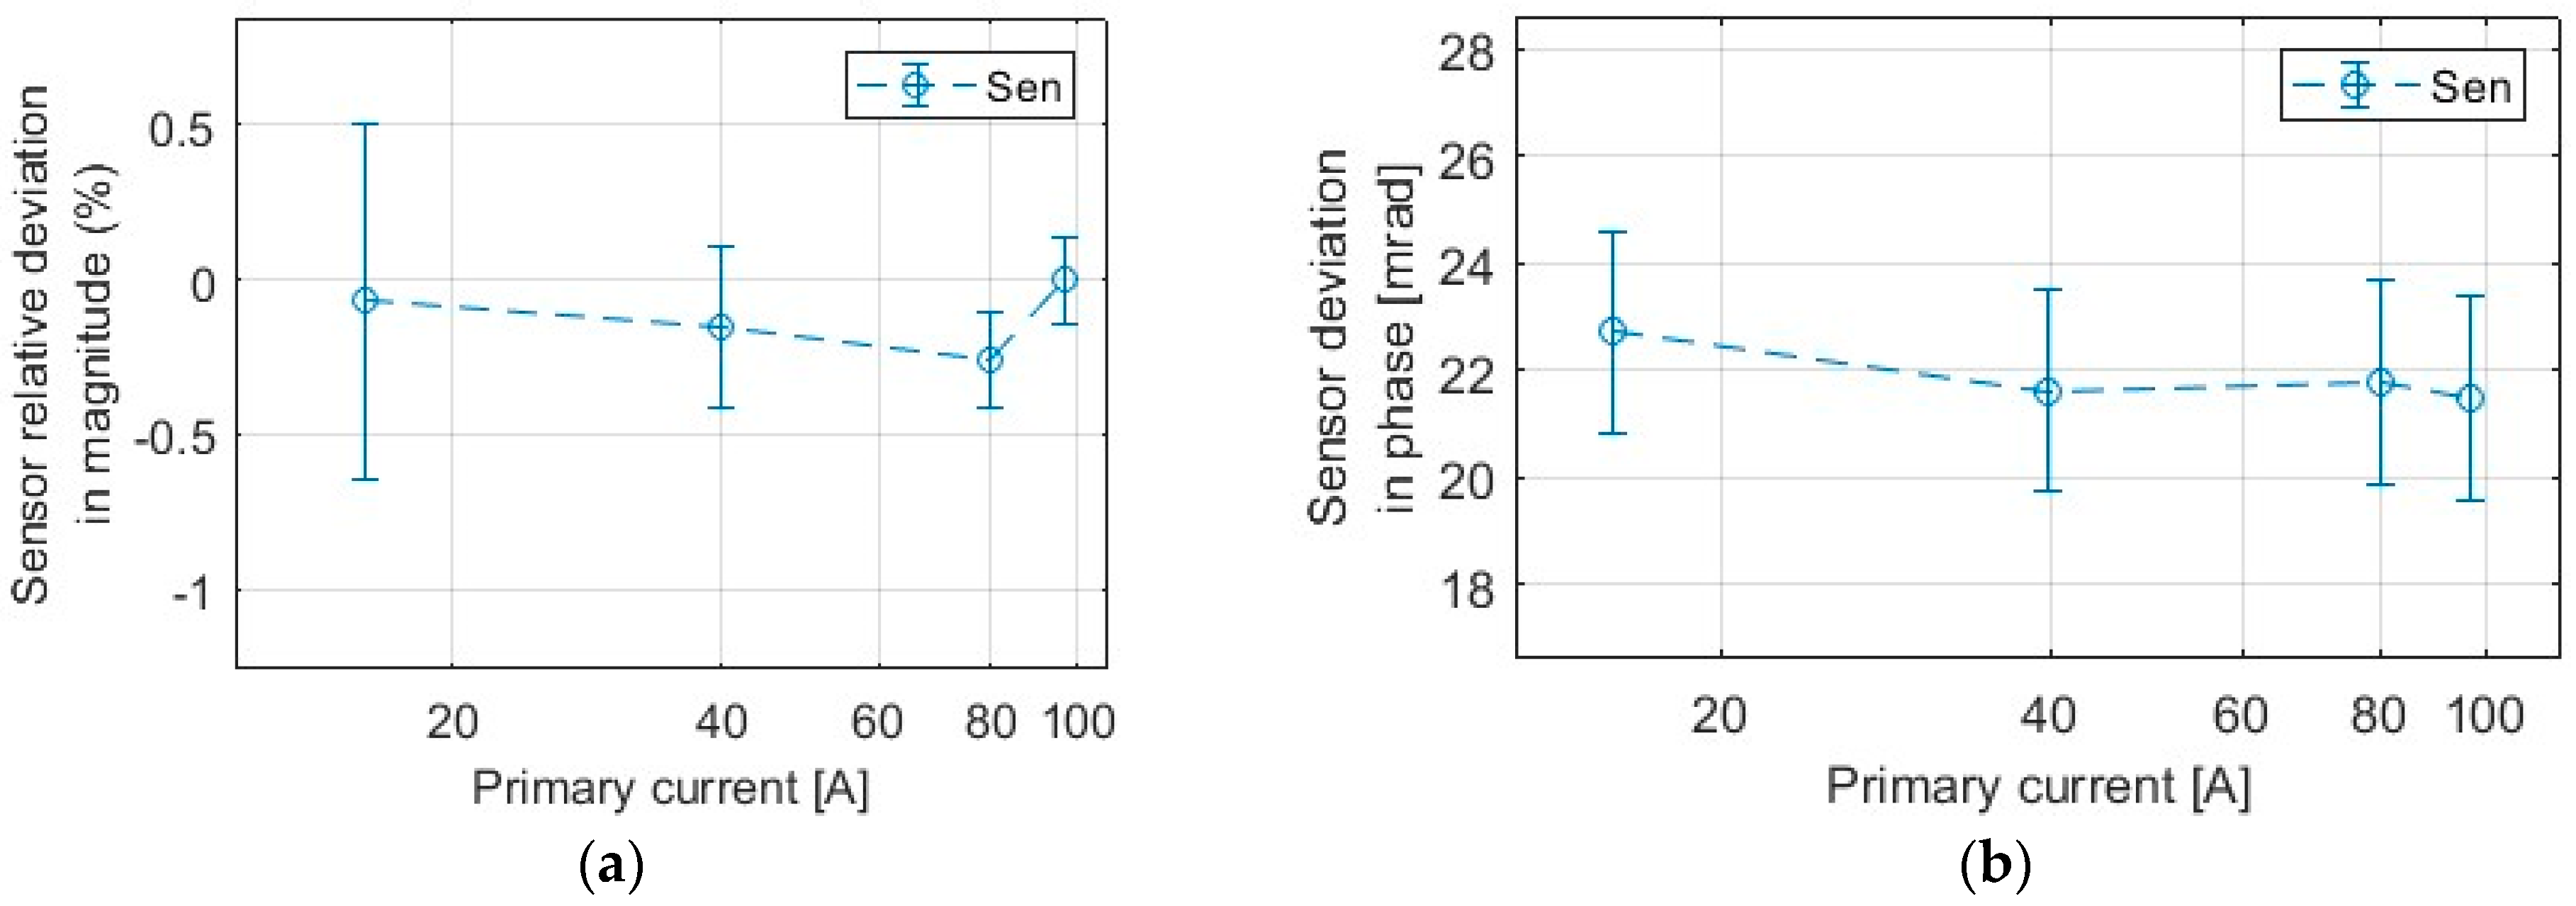
The uncertainty resulting from the measurement chain (RC + MU) that was under calibration is shown in
Figure 3. The graph illustrates that for each current value, there is an associated error value along with confidence intervals, which have been derived using uncertainty calculations.
Figure 3 shows that for currents less than the nominal current, the uncertainty value was higher than at the nominal current, while it was lower at currents greater than the notional current.
Based on the assumption that the uncertainty that affects measurement errors should be less than 0.2 of the limitations given by the accuracy class [
29], and based on the results obtained, the suggested settings can be adopted and can be used to calibrate RCs with an accuracy class of 0.5.
The knowledge of the sources of uncertainty that contribute the most to the above-mentioned calibration uncertainty levels is beneficial in improving the accuracy of the calibration system in subsequent experiments. The RCT contributed the most to the uncertainty in the amplitude error, while the DAB had the greatest effect on the uncertainty in the phase error measurement. Thus, reference devices with higher accuracy classes can be used to decrease uncertainty.
5. Conclusions
LPCTs offer significant advantages in measuring current for smart grid measurement systems. When combined with integrated modules, the electric current can be converted into digital values, which can then be transmitted over a local Ethernet network to the control and monitoring centre. This method reduces current measurement time and costs significantly.
As the use of RC and MU in the creation of smart grids has become increasingly important in recent years, it has been necessary to calibrate these two devices, which are used together in the current digital measurement system.
In this paper, an algorithm to calibrate an RC with a digital output to verify the accuracy of its current measurement was proposed. The calibration algorithm was based on the FFT of both the RC current and the reference current generated by a high-resolution current sensor and a high-resolution 24-bit reference digital converter. To achieve synchronization between the values of the samples of the two currents, the PTP was used, which had the highest accuracy compared to other synchronization protocols.
The calibration results of a current measurement chain for a 32 kV substation were presented during steady-state and different working conditions. The test results are in line with the applicable standards. This calibration method will be used in further research to evaluate the frequency response with or without the transient state.
Furthermore, the sources of uncertainties were identified to increase the stability and future development of the measurement chain through their impact on the calibration accuracy.


