Abstract
This study evaluates the heat dissipation and Nusselt number for an S-shaped double-bend pipe, for which an experimental evaluation is lacking. In terms of the velocity field, the mean velocity and turbulent kinetic energy were measured through particle image velocimetry. Heat transfer characteristics were evaluated in validated conjugate heat transfer simulations, and a k-ω SST turbulence model was used for flow simulation inside the pipe. Heat transfer enhancement was observed at the first bend, as observed in previous studies on single-bend and U-shaped bends, whereas no heat transfer enhancement was observed at the second bend. This result was due to higher turbulent heat flux at the first bend because of higher eddy diffusion on the outside of the bend, whereas eddy diffusion was lower on the outside of the second bend owing to the history of the first bend. The heat transfer characteristics of the S-shaped double-bend pipe elucidated in this study provide valuable insight for devising strategies to reduce heat loss in automotive exhaust pipes with multiple bends. Furthermore, the conjugate heat transfer simulation model used in this study provides a benchmark for heat transfer calculations for multi-bend pipes.
1. Introduction
The heat transfer and structure of fluid flowing through pipes are affected by bends in the pipes in a variety of engineering applications, such as reciprocating engines, the cooling of electronics, and certain heat exchangers. In particular, complex flows of fluids through multiple bends are generated in the intake manifolds of automotive intake and exhaust systems. The flow and heat transfer characteristics of the intake and exhaust manifolds directly affect the efficiency of downstream catalysts. Therefore, increasingly stringent emission regulations are requiring a higher efficiency of exhaust catalysts, and the management of heat losses in exhaust systems is critical to the control and optimization of aftertreatment systems [1]. The study of heat transfer in flows through pipes with bends is thus important for optimizing the design of automotive exhaust systems.
Swirling or secondary flows are often adopted to enhance piping flow heat transfer because such flows are usually accompanied by a change in fluid structure, which promotes mixing of the main flow and breaks the thermal boundary layer. In addition, bent pipes are widely used in various industrial applications to promote heat transfer [2]. When fluid flows through a curved pipe, a centrifugal force is generated. This force generates a swirling or secondary flow and thus deviations in the main flow and impingement on the wall surface, thereby promoting heat transfer. Many researchers have studied the fluid flow and heat transfer characteristics of curved piping. First, in terms of investigating hydrodynamic properties, Dean [3] theoretically analyzed laminar flow in a bent pipe having a circular cross section, and identified Dean vortices (i.e., two symmetric counter-rotating vortices) as a secondary vertical structure. Brücker [4] adopted particle image velocimetry (PIV) in studying the switching of symmetry planes in the Dean vortex and the swirl switching effect, and observed the quasi-periodic time-dependent behavior of secondary flow downstream of the bend on at least two time scales. In terms of conducting numerical simulations, Rütten et al. [5] performed large eddy simulations to investigate turbulent flow in a pipe having a 90° bend, evaluating features such as unsteady flow separation, unstable shear layers, and Dean vortex oscillations, and compared their simulation results with PIV measurements. Other studies on unsteady secondary flow under turbulent conditions in a pipe having a 90° bend were conducted by Sudo et al. [6], Sakakibara and Machida [7], and Wang et al. [8]. In addition, Tanaka et al. [9], using the results of large eddy simulation, showed that the Reynolds stress ω model (RSM–ω), which can be used to calculate the velocity distribution directly, was better at reproducing changes in the flow field due to bending than the k–ε renormalization group model, which is based on a wall function. In terms of other geometries, flow dynamics in back-to-back bends arranged in U- and non-planar [10,11,12,13] and S-shaped [14,15,16,17,18,19] configurations have been studied. In the example of an S-shaped pipe, which is closely related to the double-bend pipe considered in the present study, Oki et al. [14] evaluated flow characteristics by conducting stereo-PIV and showed that Dean and Lyne vortices [20] formed at the first and second backbends, respectively. Mazhar [17] and Ng [18] evaluated the effects of the bending angle and other factors by conducting PIV and hot-wire anemometer measurements. Han et al. [19] evaluated the effect of the bend spacing of double-bend pipes, including S-shaped pipes, in computational fluid dynamics (CFD) simulation and found that the direction of the secondary flow varied for short and long bend spacings.
Several studies have investigated the heat transfer characteristics of a pipe having a single curve and simple geometry. Wavell et al. [21] showed that heat transfer was greater on the outside of a bend and that this trend was more pronounced with greater curvature. They proposed an equation for predicting the heat transfer coefficient that considers curvature. Sparrow et al. [22] experimentally determined the local heat transfer characteristics of the turbulent region of flow in a pipe having a circular cross section and different bending angles (30°, 60°, and 90°). They found that the heat transfer was mostly greater on the outside of the bend than on the inside of the bend, and that the difference decreased with an increasing Reynolds number. Guo et al. [23] measured the cross-sectional temperature profile of a pipe with a 90° bend, finding that the heat flux was higher on the outside of the bend as the hot core of the fluid was biased outward by the bend. Other studies on bend geometries have mainly investigated coil-type and U-shaped pipes. For coil-type pipes, theoretical studies [24], experimental evaluations [25,26,27], and numerical simulations [28,29] have been conducted and summarized in the literature [2]. It has been confirmed that the heat transfer coefficient is greater on the outside of the bend even for coil-type pipes, and the heat transfer mechanism was explained by Liberto [29] as the high-speed and low-temperature (in the case of wall-to-fluid heat transfer) fluid being pushed to the outside. Extensive experimental evaluations [30,31] and numerical simulations [32,33,34,35] have been conducted for U-shaped pipes. It has been confirmed that heat transfer is greater on the outside of the bend of these pipes as well. Large eddy simulations are often conducted for helical coils and U-shaped pipes, but there have also been studies adopting the Reynolds-averaged Navier–Stokes equation. Di Piazza and Ciofalo [28] showed through comparison with the results of direct numerical simulation that the k–ω SST (shear stress transport) and RSM–ω, which do not adopt wall functions, can be used to predict the friction coefficient and Nusselt number distributions. In other studies on S-shaped pipes, Suga [36,37] evaluated mass transport, but there has been a lack of research on the heat transfer properties of such pipes.
As described above, various studies have investigated the heat transfer characteristics of bent pipes, but few studies [23] have experimentally evaluated heat transfer characteristics by measuring the in-plane temperature distribution. The heat transfer characteristics of pipes with single bends and U-shaped bends and coil-type piping have been actively studied for applications such as heat exchangers, but there has been a lack of research on the heat transfer characteristics of turbulent flow in S-shaped double bends. As the direction of the first and second bends are opposite in the S-shaped pipe, the effect of the bends on heat transfer should be different from the effects of the bends of the U-shaped pipe and helical coil. Therefore, the objectives of this study were set as follows:
- To experimentally clarify the effect of bending on the heat transfer characteristics of high-speed turbulent flow in a double-bend pipe, which is often observed in engine exhaust systems where previous studies are insufficient.
- To elucidate the heat transfer mechanism at the bend through numerical simulation.
As an approach to achieve these objectives, experimental evaluation of heat transfer characteristics was performed by measuring in-plane temperature distribution. Flow field measurements and conjugate heat transfer (CHT) simulations were conducted to elucidate the heat transfer mechanism.
The remainder of the paper is organized as follows. Section 2 describes the experimental setup, data processing methods, and numerical methods. Section 3 presents the results of the experimental evaluation of the temperature distribution and Nusselt number. The evaluation of the flow structure and heat transfer mechanism through CHT simulation is also discussed. Section 4 summarizes the findings of the study.
2. Methods
2.1. Experimental Apparatus
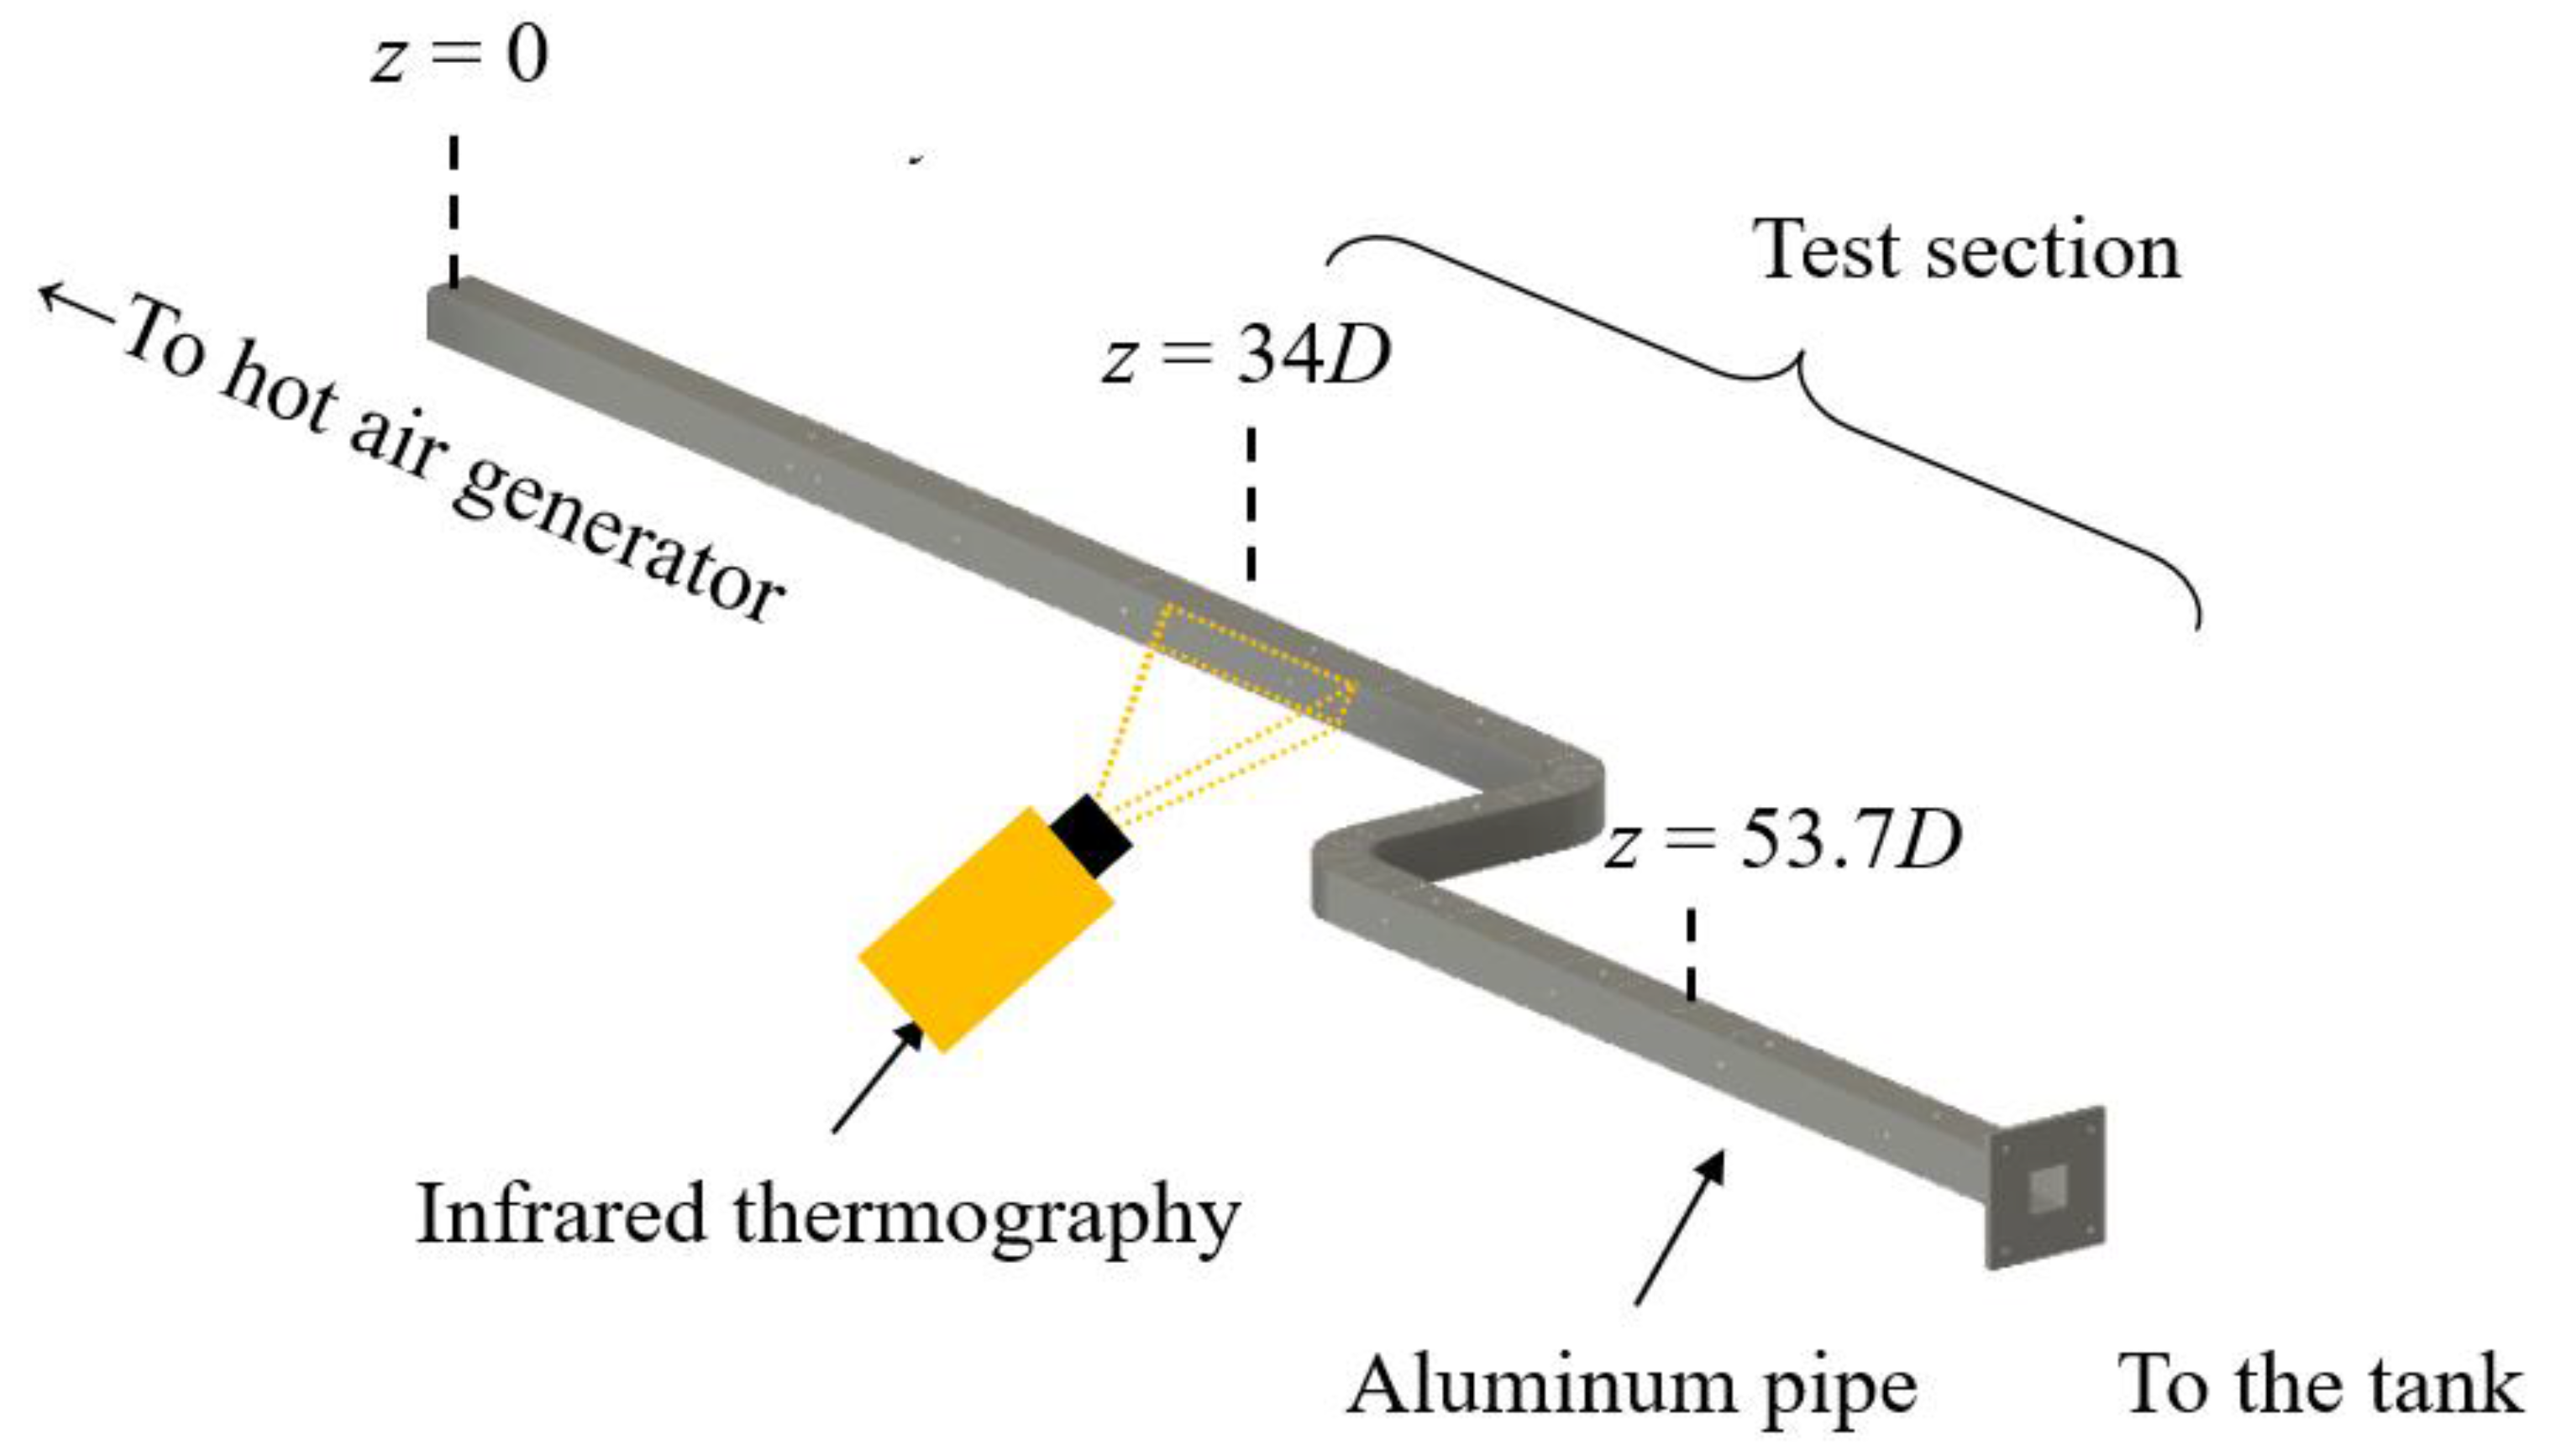
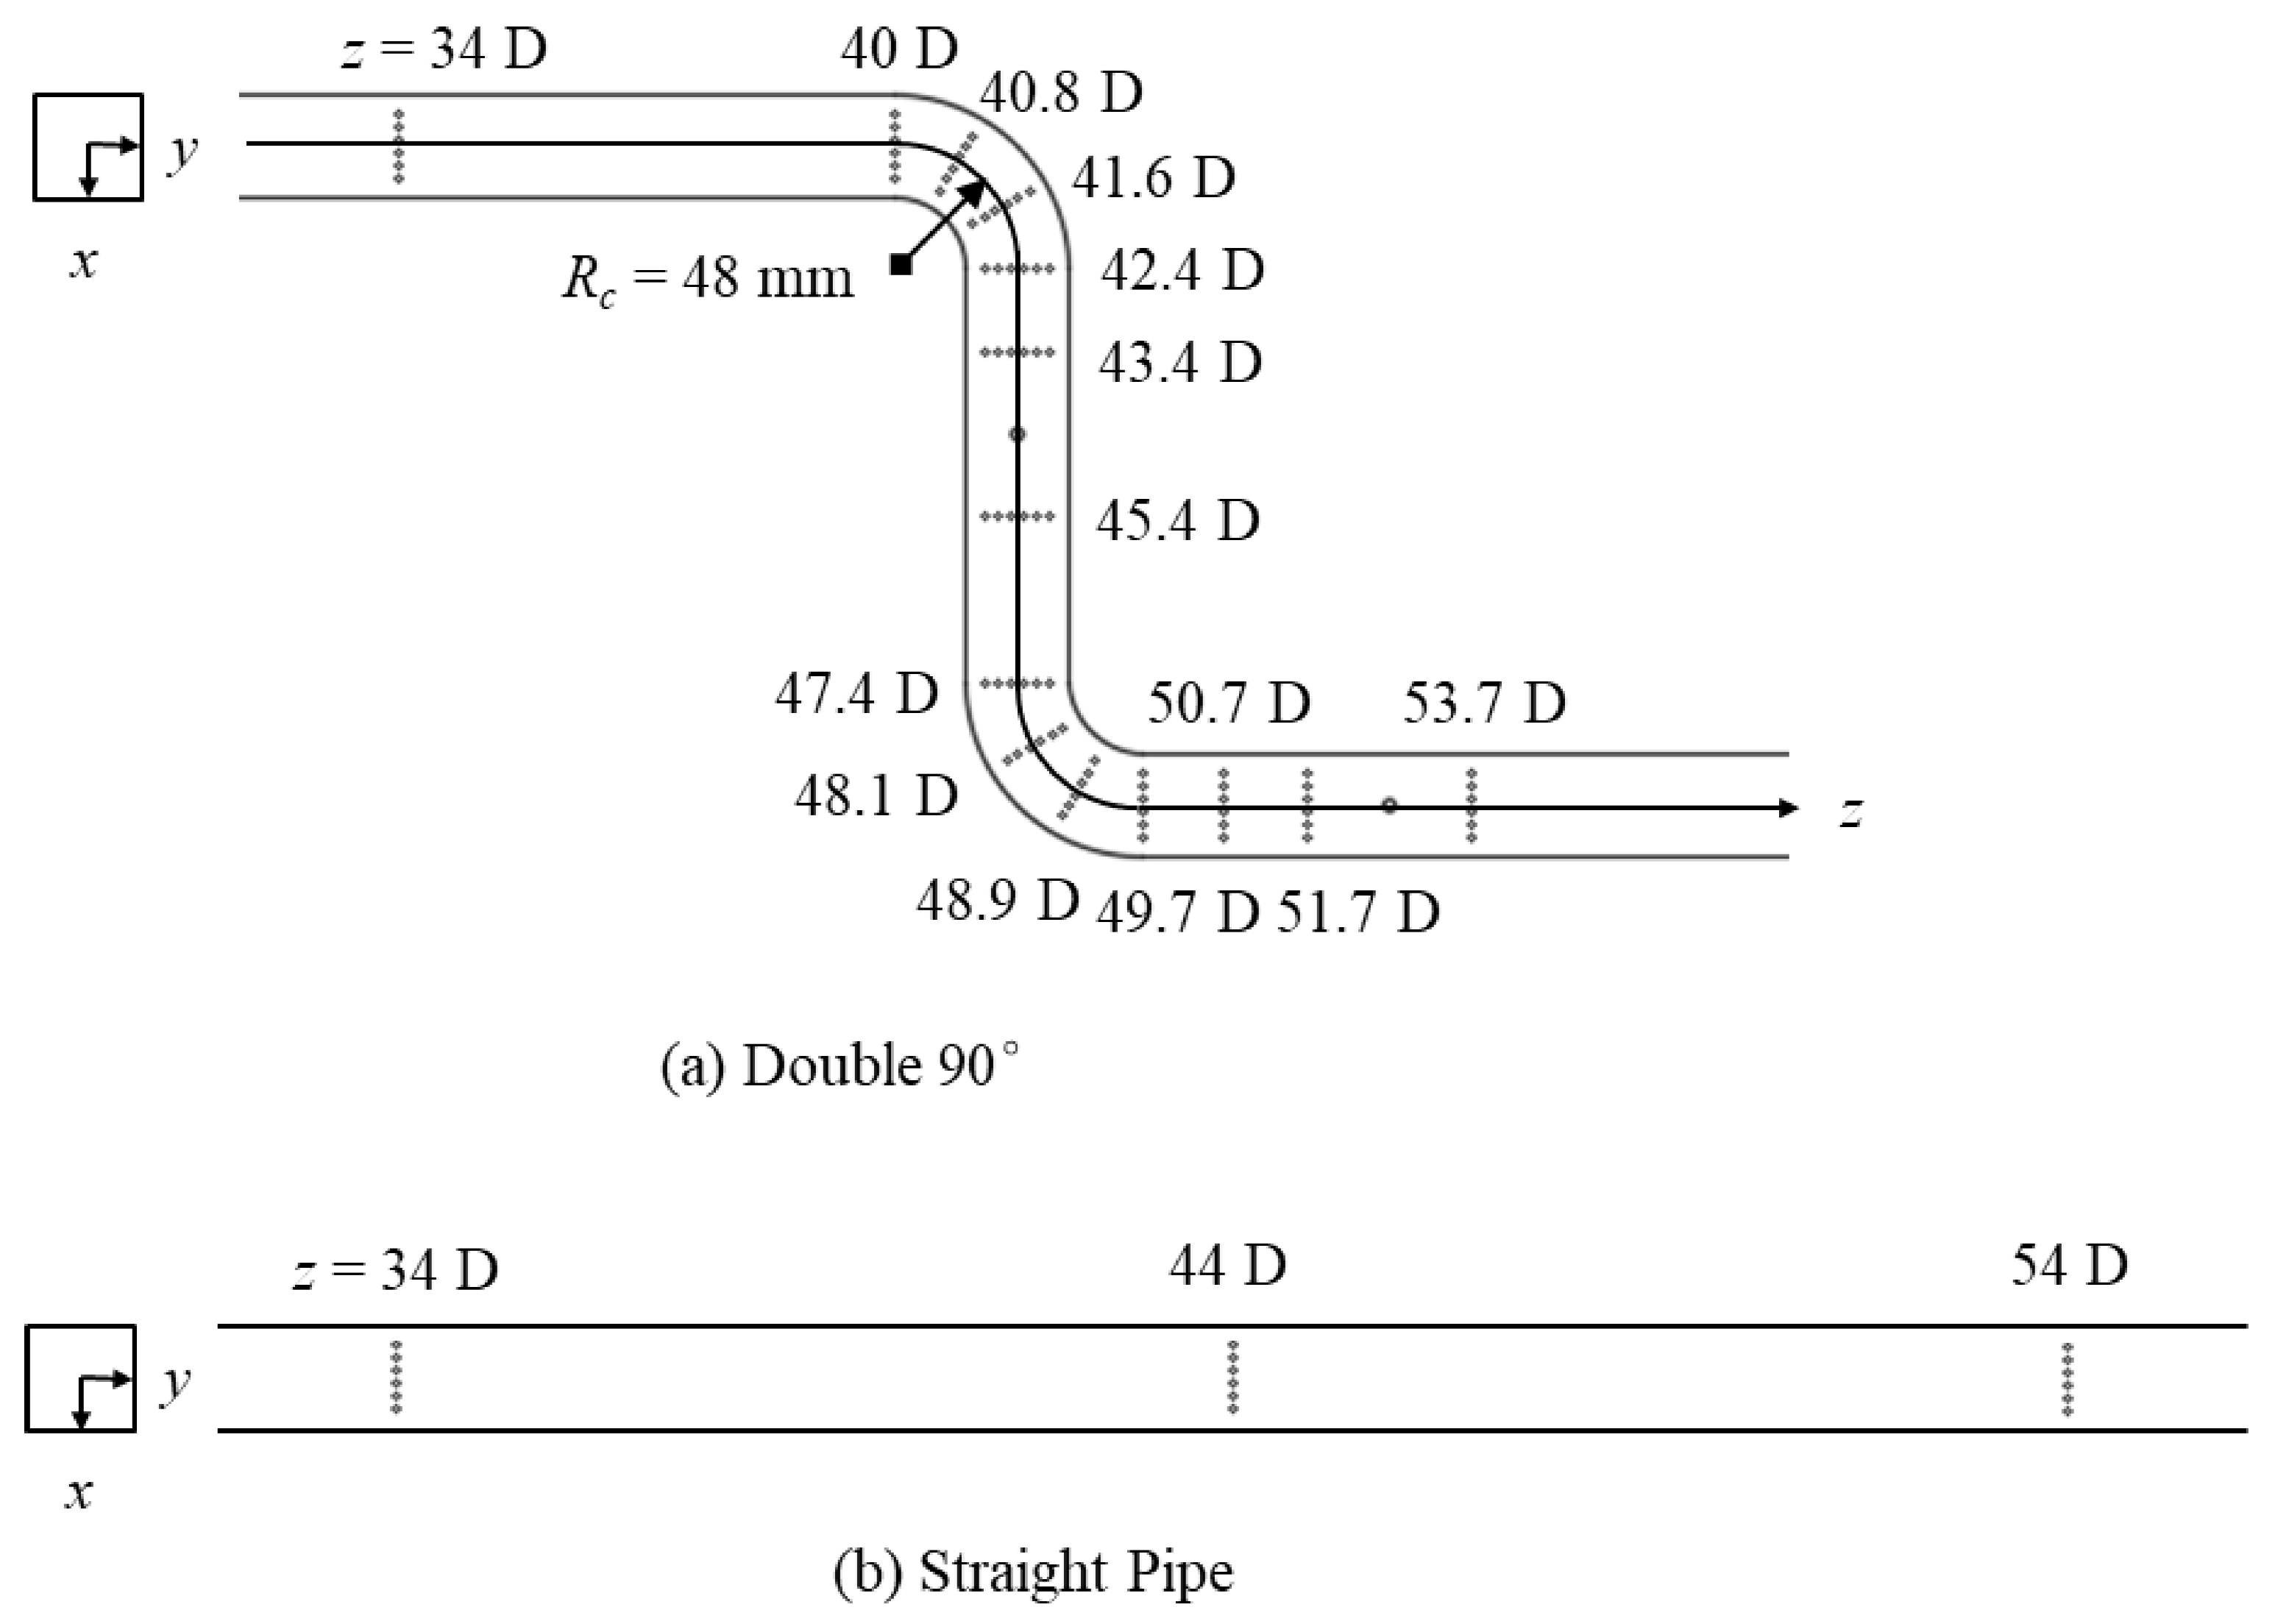
Figure 1 shows the experimental apparatus designed to investigate the effect of turbulence in straight pipes and pipes having double-90° bends on heat transfer characteristics. Air, the working fluid, was heated using a hot air generator (HAP3100; Hakko, Tokyo, Japan) and discharged through the test section to a tank at the outlet. The outer wall temperature was measured through infrared thermography (890, Testo K.K., Kanagawa, Japan), as shown in Figure 1. Measurement cross sections for temperature and velocity were set at positions beyond z = 34 D, as shown in Figure 2, to investigate the heat transfer characteristics of the developed flow. As the temperature distribution was expected to change in the flow direction of a double-bend pipe, more measurement cross sections were used than for a straight pipe, as shown in Figure 2. The coordinate system is shown in Figure 2, where x, y, and z indicate the horizontal direction of the cross section, the vertical direction of the cross section, and the flow direction, respectively. The pipe was made of aluminum and had a thermal conductivity λal of 236 [W/m K].
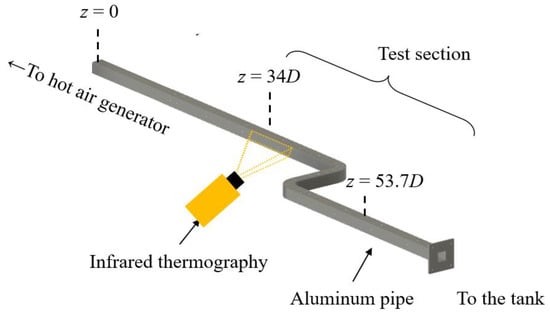
Figure 1.
Experimental apparatus.
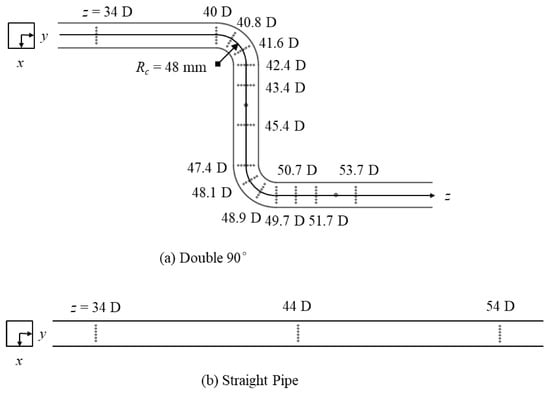
Figure 2.
Cross-sectional schematic of measurement points of the fluid temperature in (a) a double-bend pipe and (b) a straight pipe.
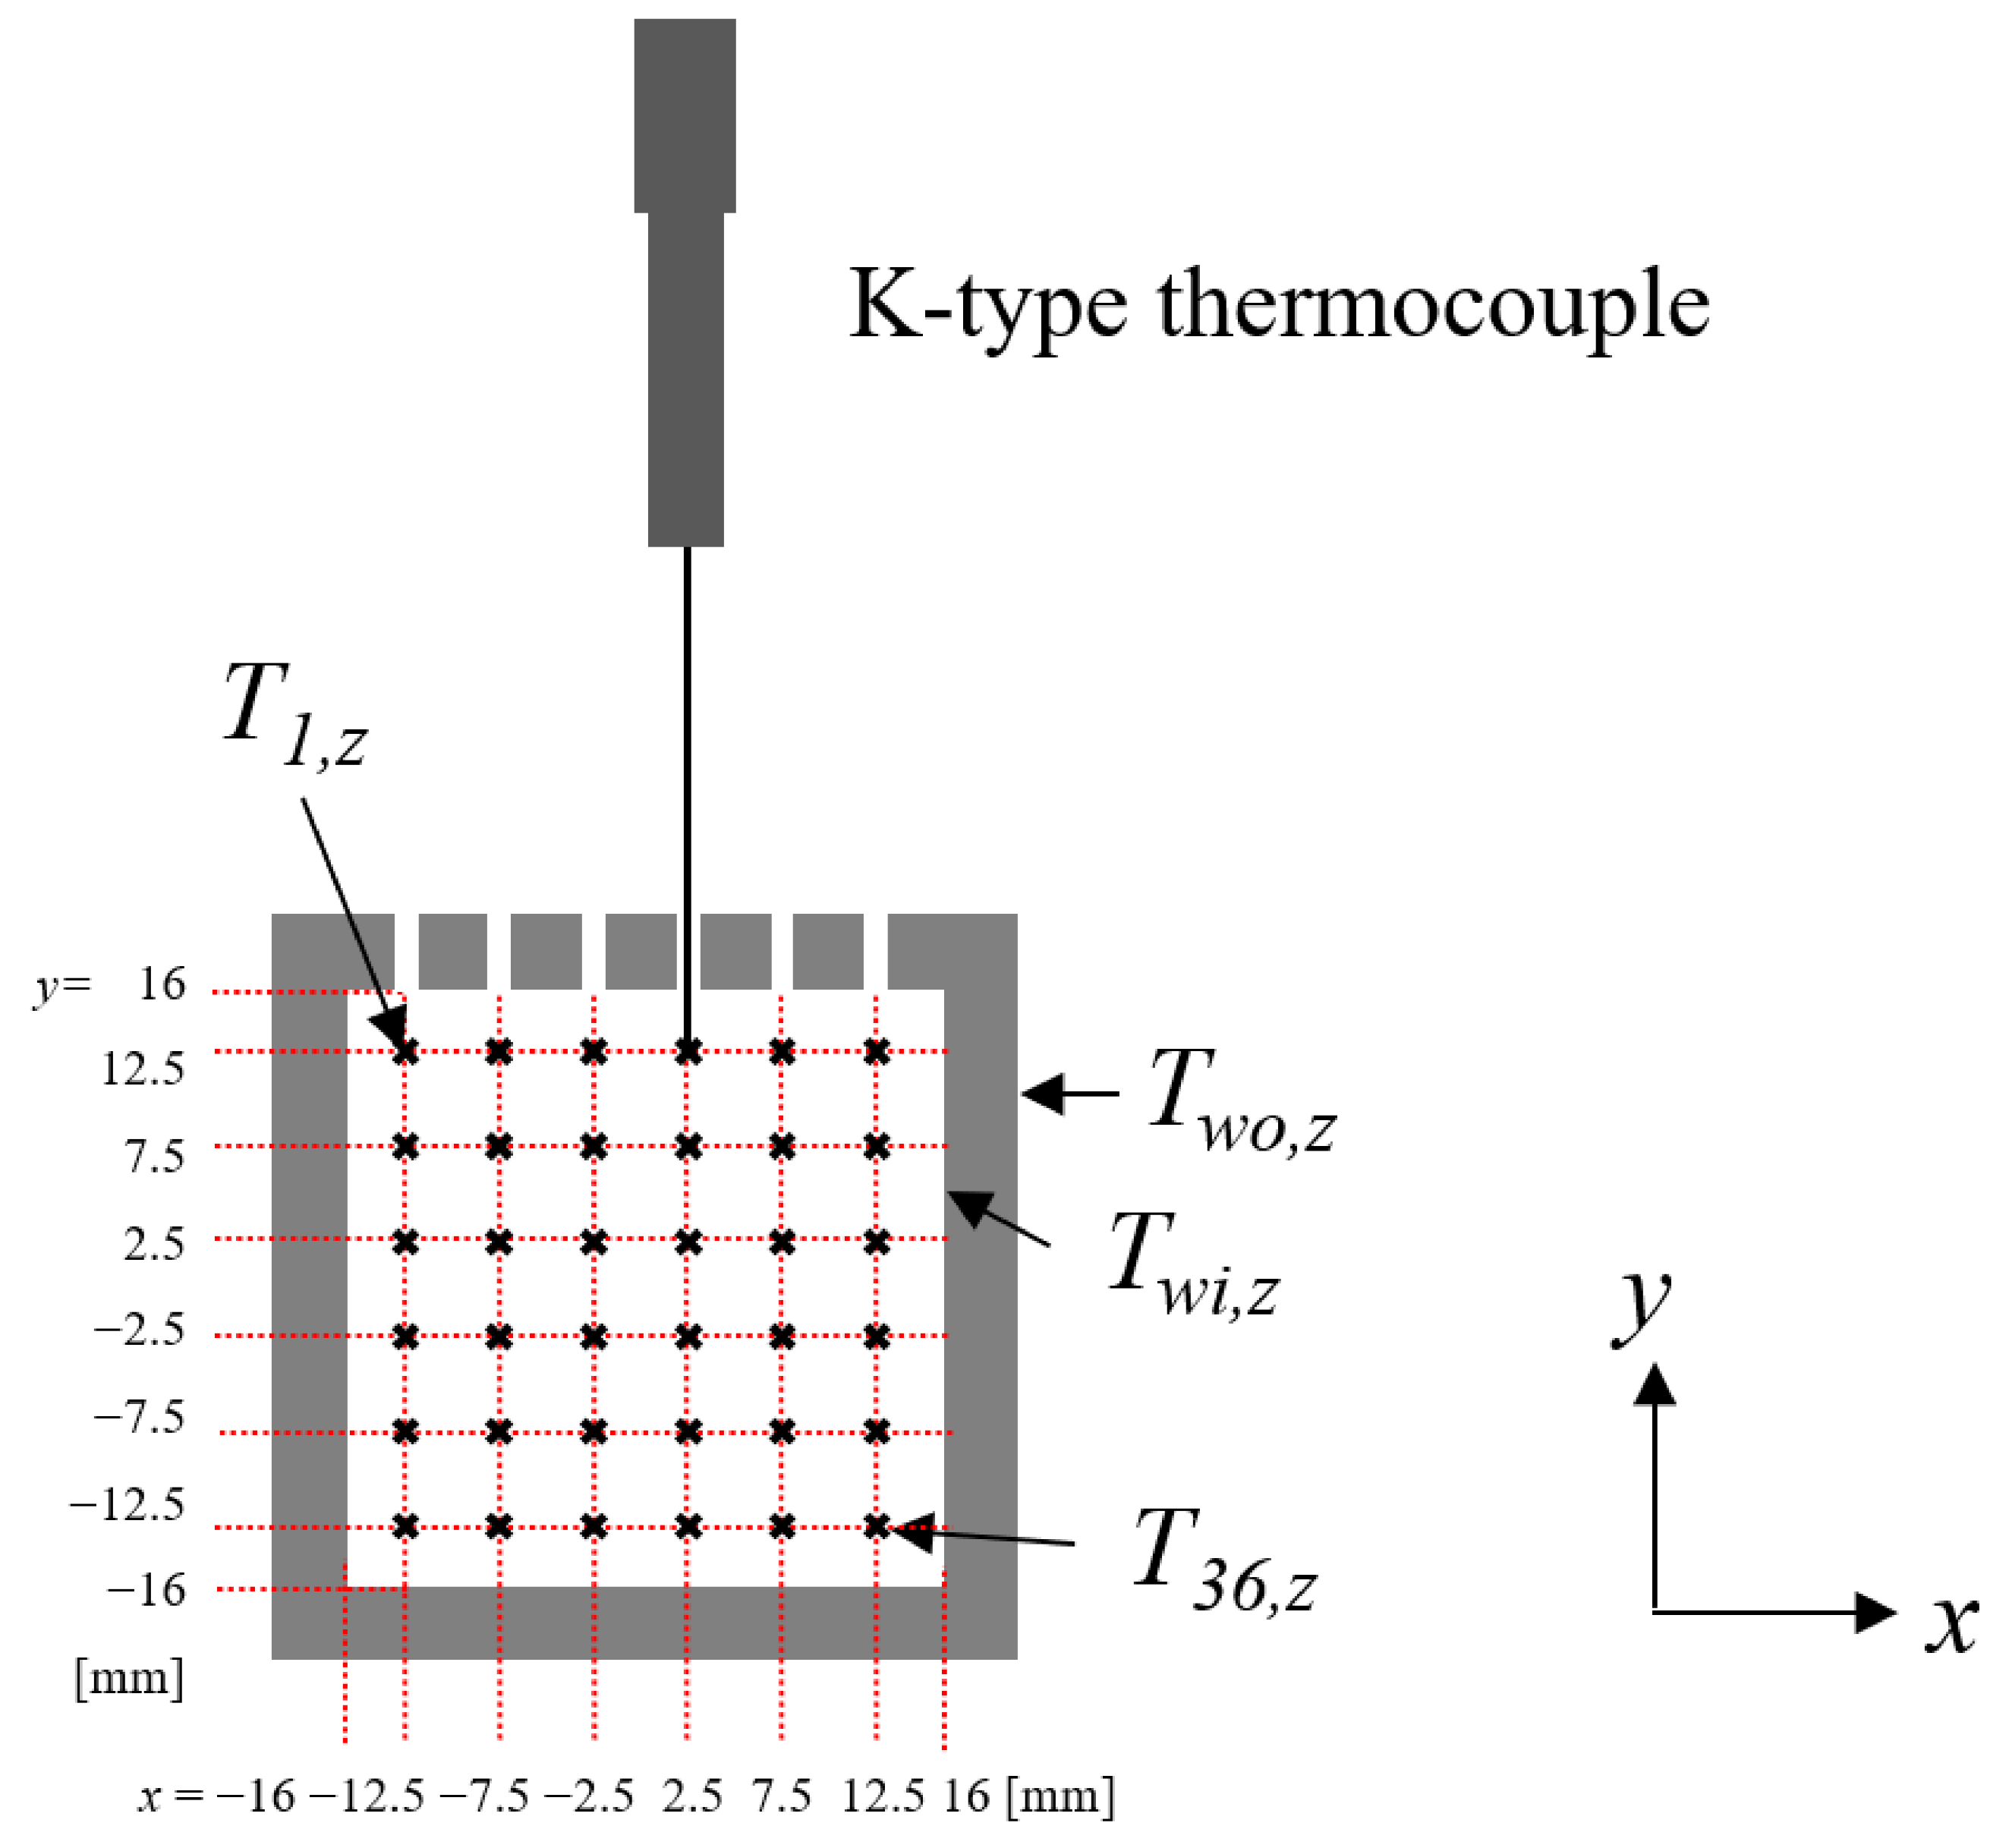
Time-averaged temperatures were measured at each section by inserting a K-type thermocouple (T34; Okazaki, Kobe, Japan) through a hole in the upper wall of the pipe, as shown in Figure 3. As shown in Figure 3, fluid temperatures were measured at 36 points per section. The ambient fluid temperature was set at room temperature, Ta = 298 K. The internal fluid conditions were set so that the velocity at the center of the pipe at the entrance of the inspection area (z = 34 D) was 47 m/s, the fluid temperature was approximately 399 K, and the pressure was 118 kPa. Three dimensionless numbers, namely the Prandtl number, Reynolds number, and Dean number, represent the flow conditions:
where ρ is the density, μ is the viscosity, Cp is the specific heat at constant pressure, and Rc is the radius of curvature. These values are given in Table 1. The resulting Prandtl number was 0.72. The Reynolds number was 60,000, a condition for turbulent flow. The radius of curvature is shown in Figure 2, and the corresponding Dean number was 38,000. These conditions correspond to actual engine exhaust flow. The measurement uncertainty of fluid temperature Ti,z was defined as the standard deviation of the time-varying measurement of steady flow, which was ±0.28 K. The measurement uncertainty of wall surface temperature Two,z was defined as the specification value of the measuring instrument, which was ±2 K.
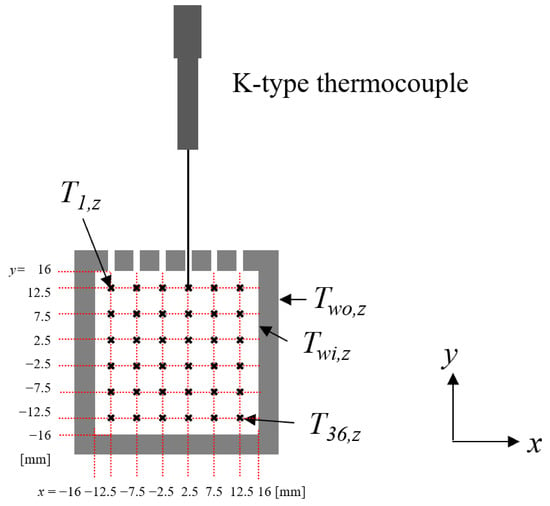
Figure 3.
Measurement method of the time-averaged temperature.

Table 1.
Physical properties of internal fluid at z = 34 D (Tfb,z = 399 K).
2.2. Data Reduction
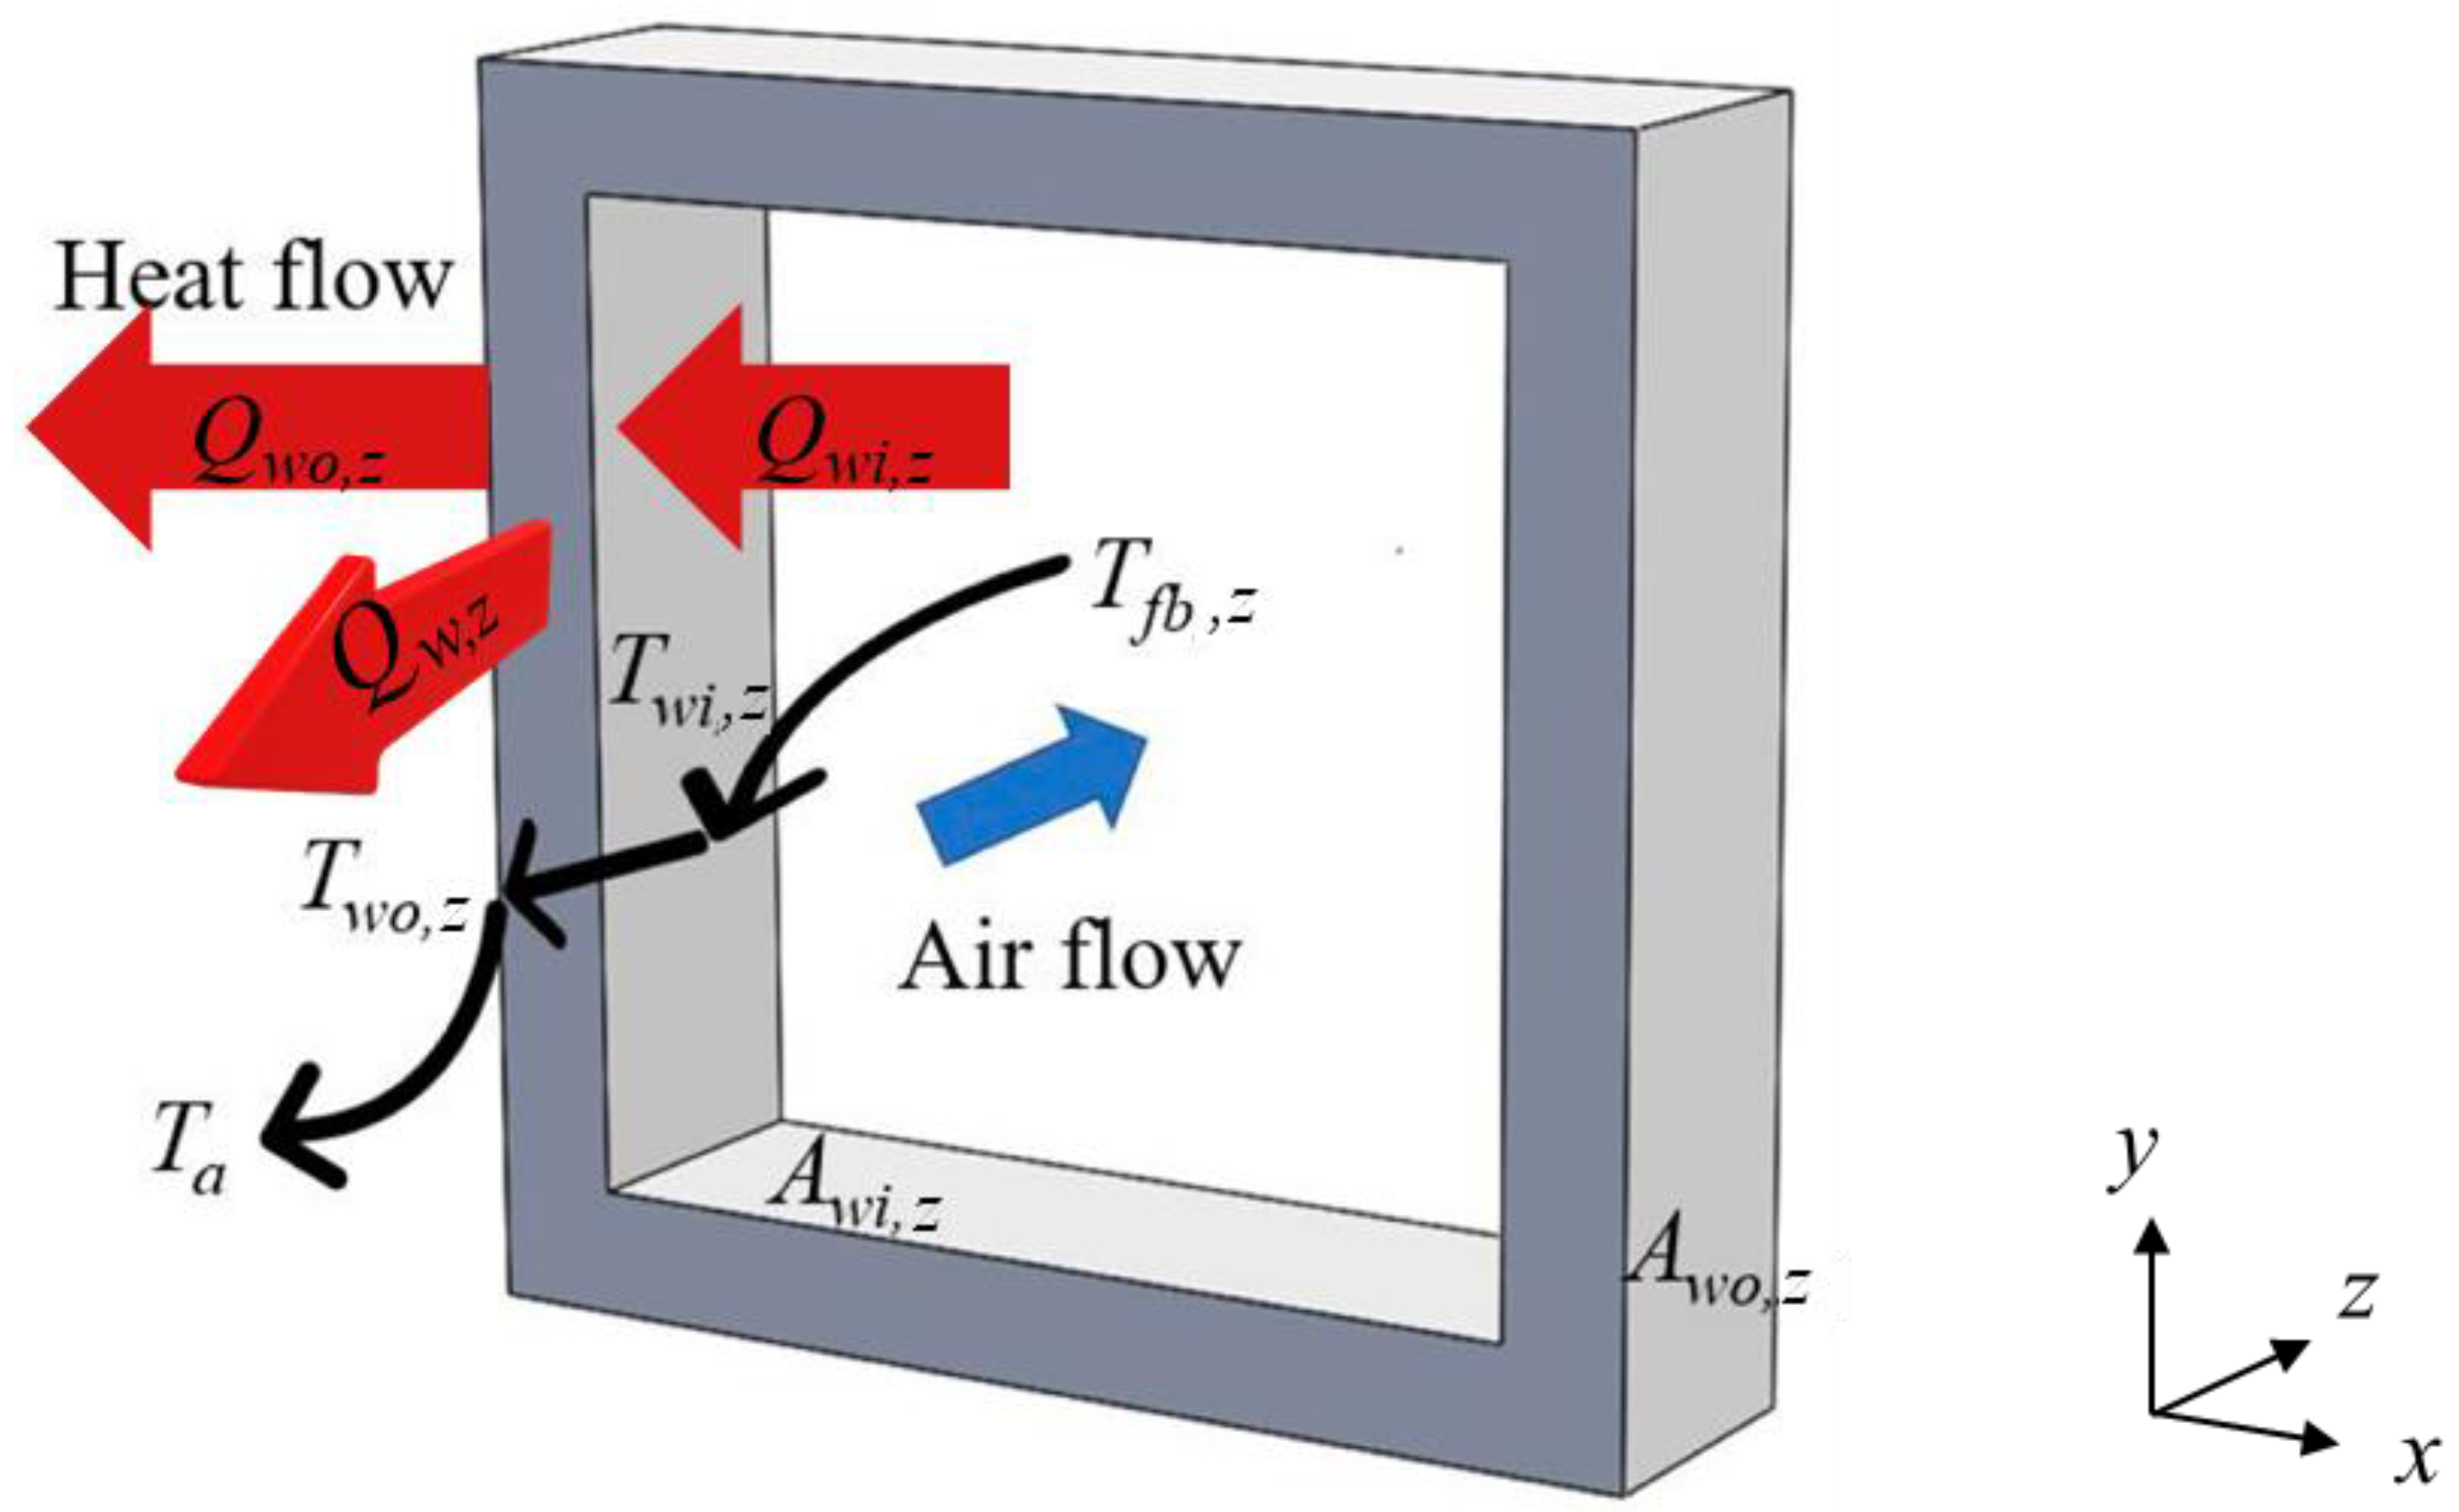
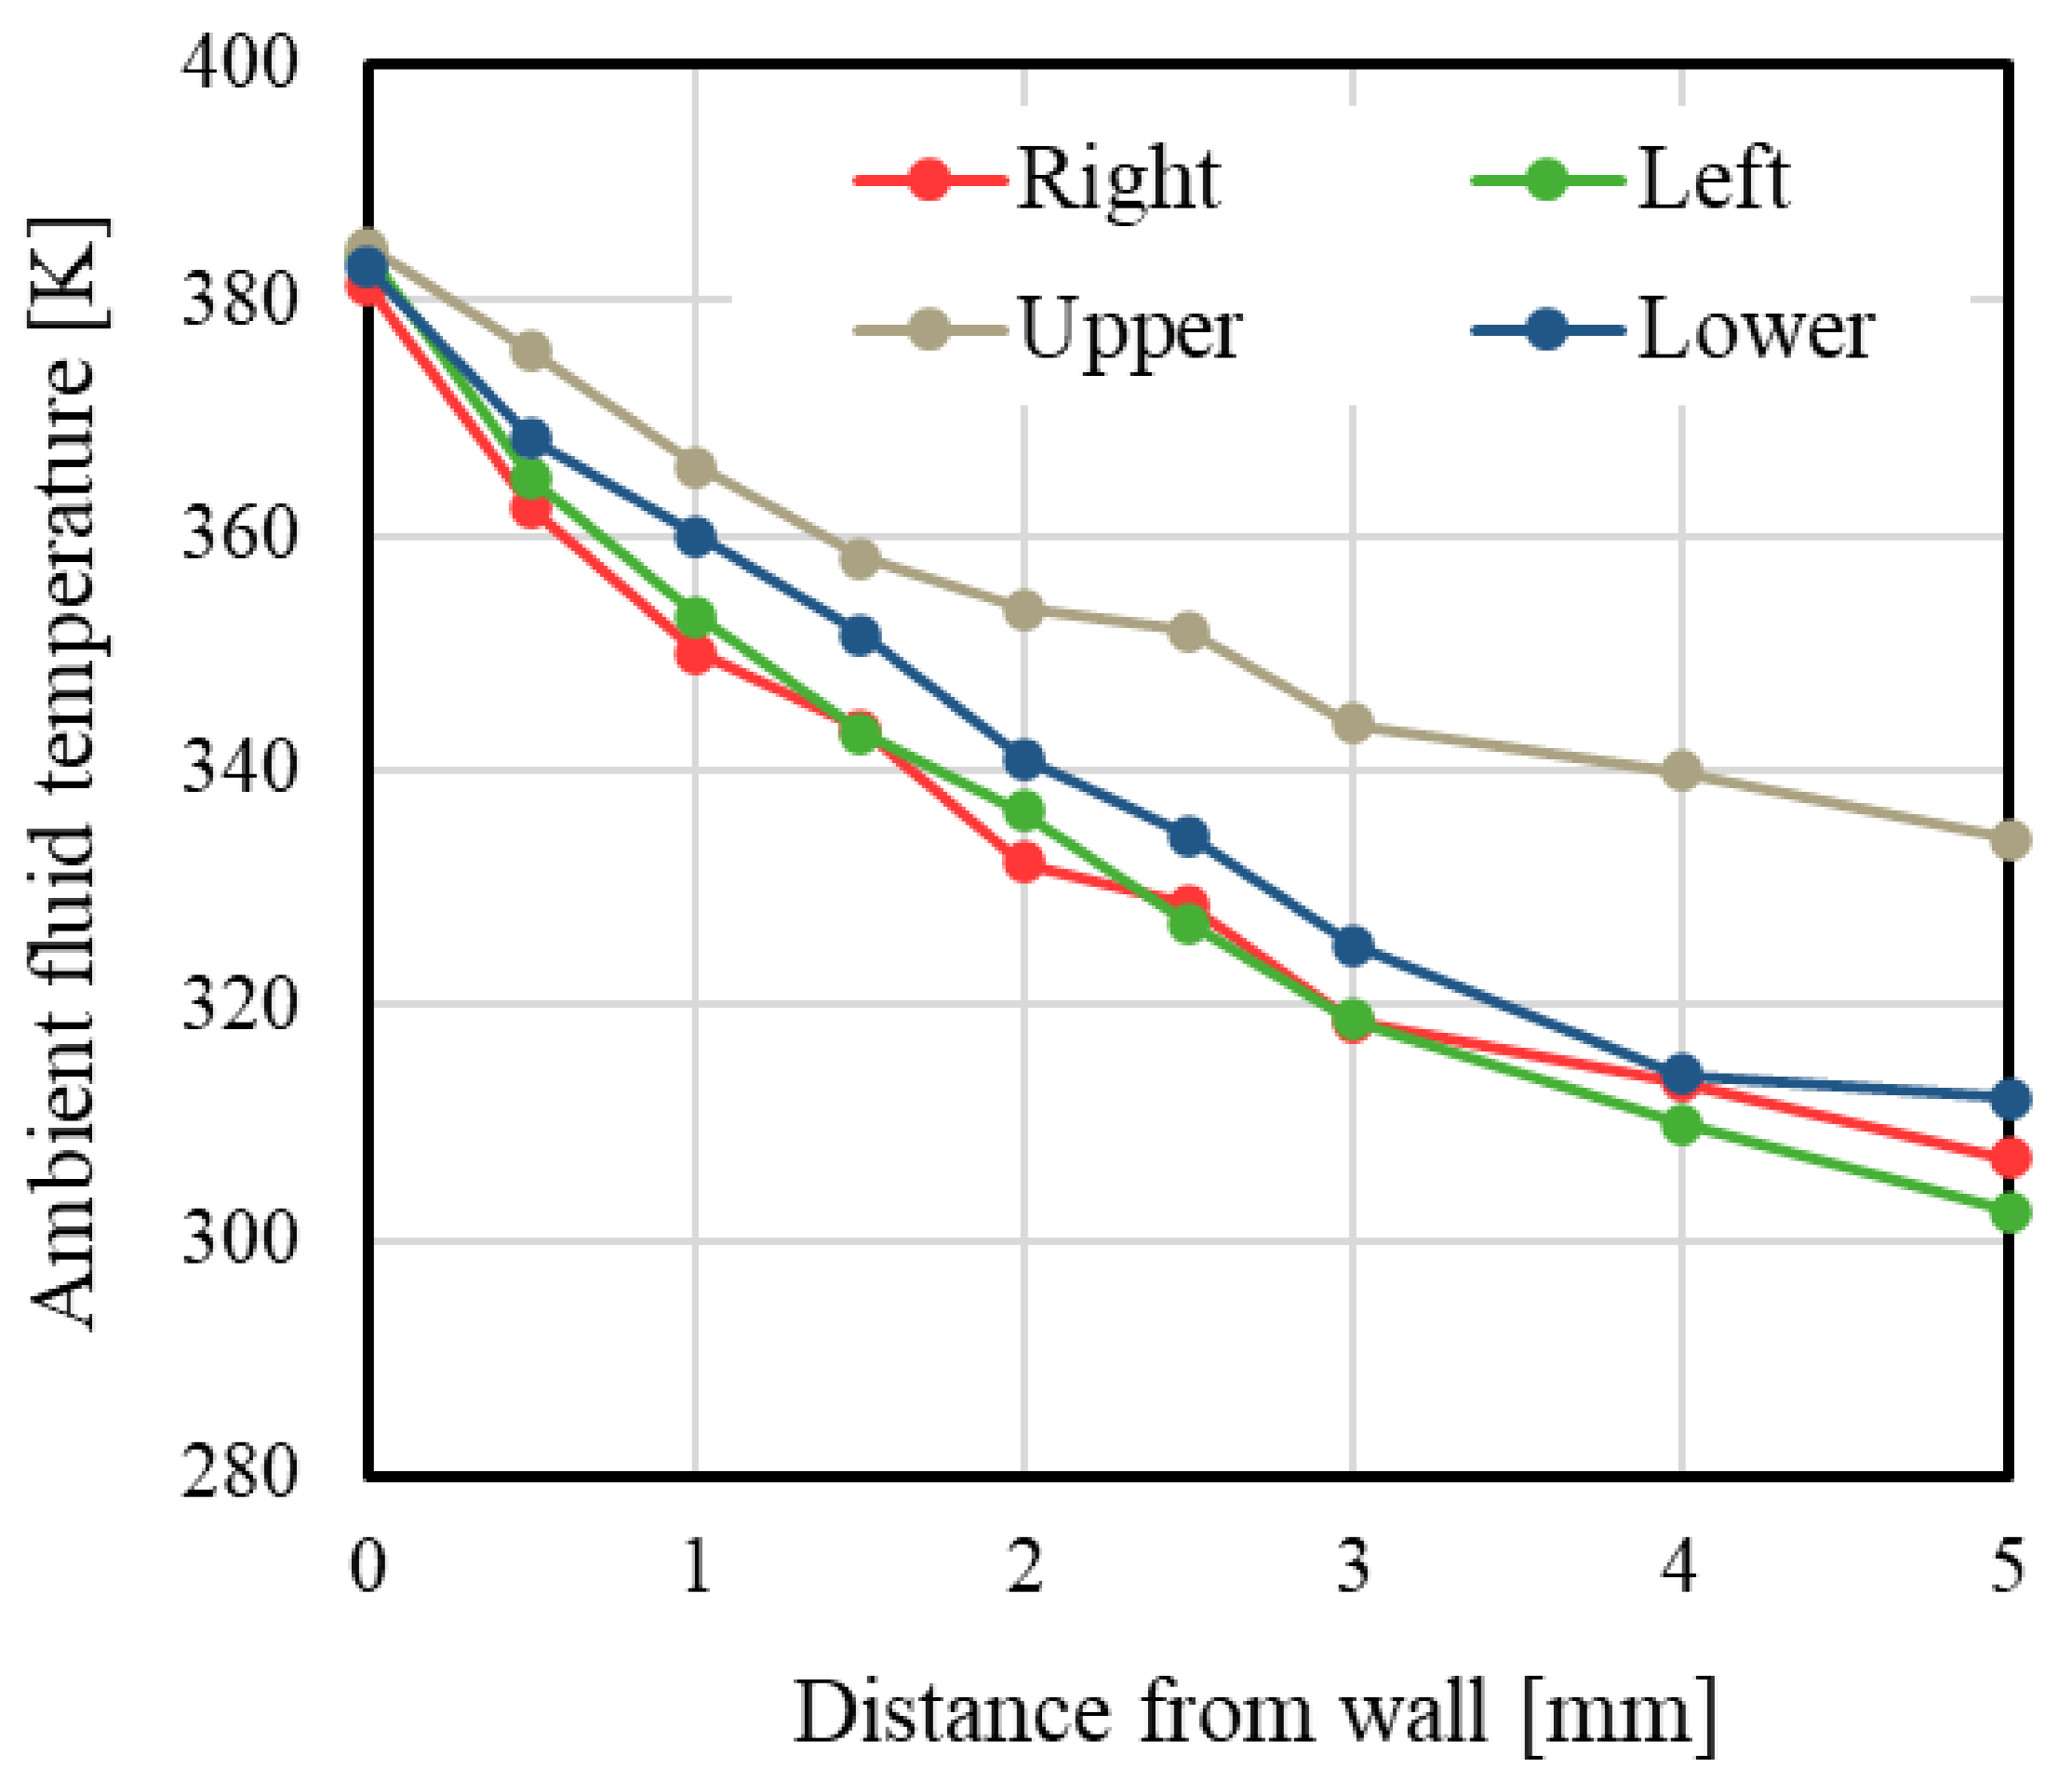
Figure 4 is a schematic of heat transfer in a pipe. Heat transfer from hot air in the pipe to the ambient fluid through the pipe wall comprises forced convection in the pipe, heat conduction on the pipe wall, and natural convection outside the pipe. As the time scale of heat conduction in an aluminum pipe is longer than that of the fluid heat transfer, there is almost no temperature fluctuation of the outer pipe wall. It is thus considered that stable natural convection heat transfer occurs. Figure 5 presents the external temperature measurements for a straight pipe (z = 34 D). The external heat transfer coefficient ho is calculated for the left, right, top, and bottom walls from the temperature gradient of the nearest neighbor of the outer wall in Figure 5; the coefficient is 14.8 (left), 15.2 (right), 6.8 (top), and 11.4 (bottom). It is noted that the heat transfer coefficients are asymmetric between the top and bottom, but the exterior wall temperatures are nearly the same at the top and bottom. This is due to the high thermal conductivity of the aluminum material used for the pipe. The axial characteristics of the external temperature hardly change except for a very small area inside the bend, and the numerical simulations were thus performed assuming that the external heat transfer coefficient was constant at the abovementioned values.
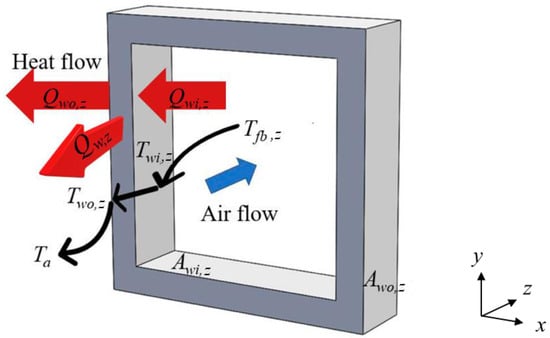
Figure 4.
Model of heat transfer.
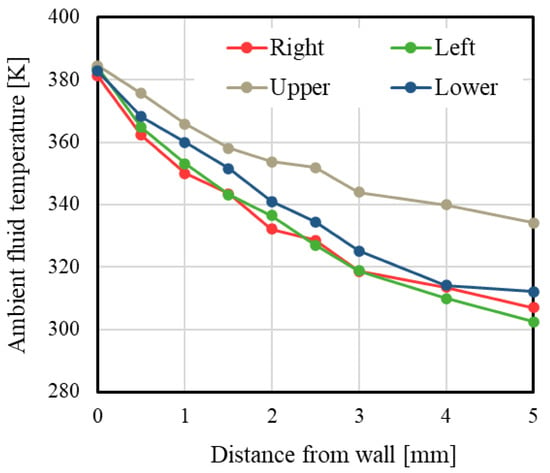
Figure 5.
Temperature distribution of the ambient fluid.
The local heat dissipation from the fluid inside the pipe to the aluminum inner wall at position z is calculated from the change in the heat quantity of the internal fluid as
Here, m is the mass flow rate and Acr is the cross-sectional area of the flow path. Tfb,z is the cross-sectional average fluid temperature, obtained by taking the ensemble average:
In this measurement, the temperature and velocity are calculated as time-averaged values for 1 s. From the heat dissipation calculated using Equation (4), the local heat flux is calculated as
where Awi,z is the heat transfer area of the inner wall. Using this local heat flux, the local Nusselt number is calculated as
Here, Twi,z is the aluminum inner wall temperature. The difference between the aluminum inner wall temperature and the outer wall temperature was less than 0.1 K in this study because aluminum transfers heat well and the pipe was thin. Therefore, as Twi,z ≈ Two,z, the inner wall temperature was determined from the results of the outer wall temperature measurement using infrared thermography. As the exterior wall temperature differs between the inside and outside of the bend, the average temperature of the exterior wall is determined as the representative temperature according to
The above is the evaluation method adopted in the experiment. As Equation (5) gives the cross-sectional average temperature, it does not strictly express the heat quantity of the fluid when there is a nonuniform velocity distribution or density distribution. The CHT simulation thus adopted the mass flow-weighted average temperature for evaluation:
where S is the cross-sectional area of the flow path. The axial flow velocity wz, internal fluid density ρz, and internal fluid temperature Tf,z are functions of x and y. The heat dissipation and local heat flux can be accurately estimated by taking flow-weighted averages as
The heat quantity and heat flux moving axially through the pipe were obtained from Fourier’s law as
where λs is the thermal conductivity of aluminum, Tw,z is the cross-sectional average temperature of the aluminum wall, and Aw is the aluminum cross-sectional area.
2.3. Flow Field Measurement
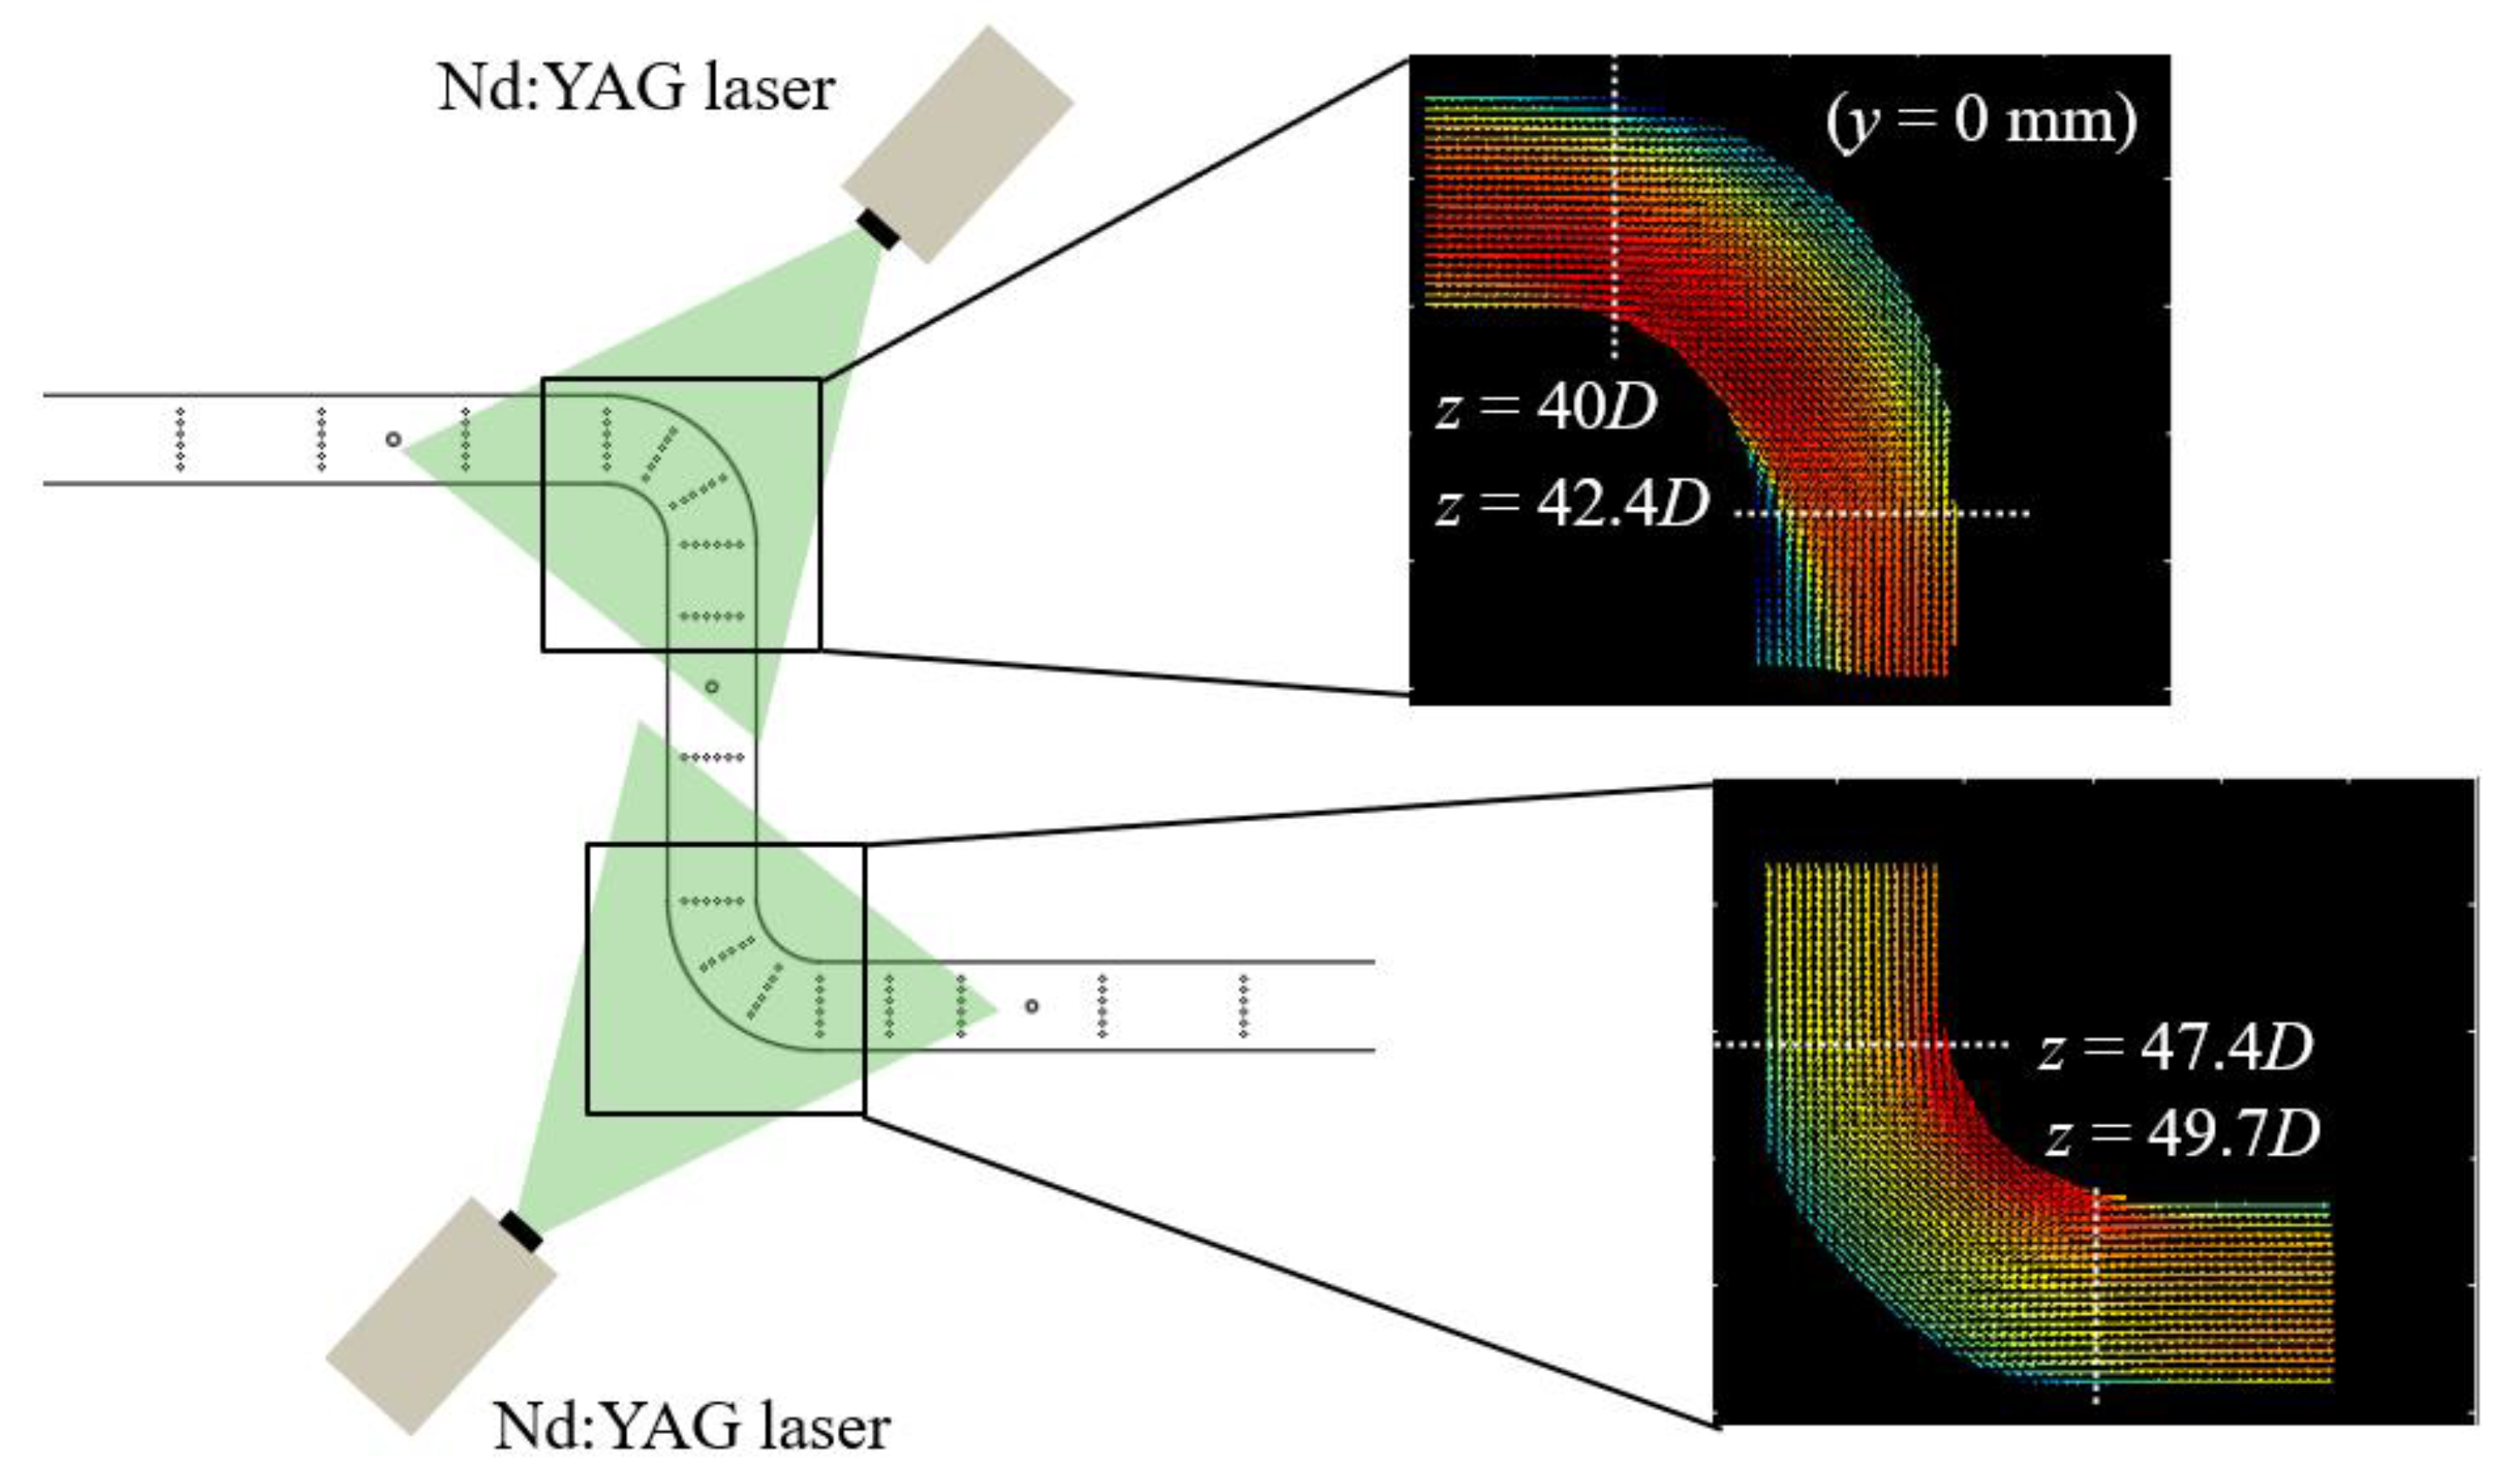
Figure 6 shows the optical system used in the PIV measurement to visualize the flow field on the x–z plane. The x–y coordinate origin is the center of the pipe. The right side of Figure 6 shows an example of the flow field measurement on the x–z plane. As the visualization channel used for PIV has limited heat resistance, the experiment was conducted by lowering the temperature at the inspection area inlet to 353 K and adjusting the flow velocity to set the Reynolds number to 60,000. To ensure fluid traceability, oil mist with a small particle size (average particle size of 2–3 μm) was used as tracer particles. An Nd:YAG laser (Continuum, Mesa PIV) was used as the light source, and particle images were acquired at 10,000 fps. Particle image pairs were created from these particle images. The flow velocity was thus recorded at 5000 Hz. The x and z components of the flow velocity were calculated through direct cross-correlation. The PIV conditions are given in Table 2. The inspection window was 27 pixels by 27 pixels (70% overlap). Sub-pixel processing was performed using a Gaussian distribution. Since the flow velocity for a 1-pixel shift in the correlation window is v = rPIV/Δt = 10 m/s, the uncertainty in the velocity measurement was ±5 m/s.
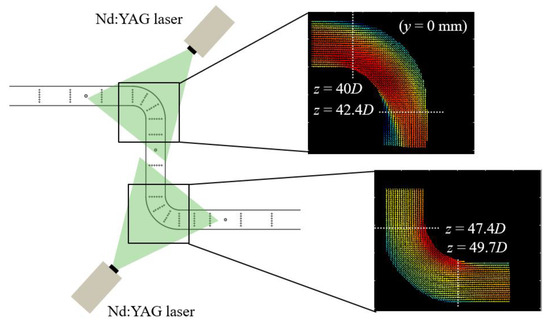
Figure 6.
Experimental apparatus for PIV.

Table 2.
PIV conditions.
In PIV, the Reynolds decomposition was used to evaluate turbulence statistics:
where is the time-averaged term and is the turbulent term. The time-averaged term was obtained by taking the ensemble average over a period of 0.5 s. Using the turbulent term, the turbulent kinetic energy was calculated as
The PIV system used in this study was validated by the literature [38].
2.4. Numerical Simulations
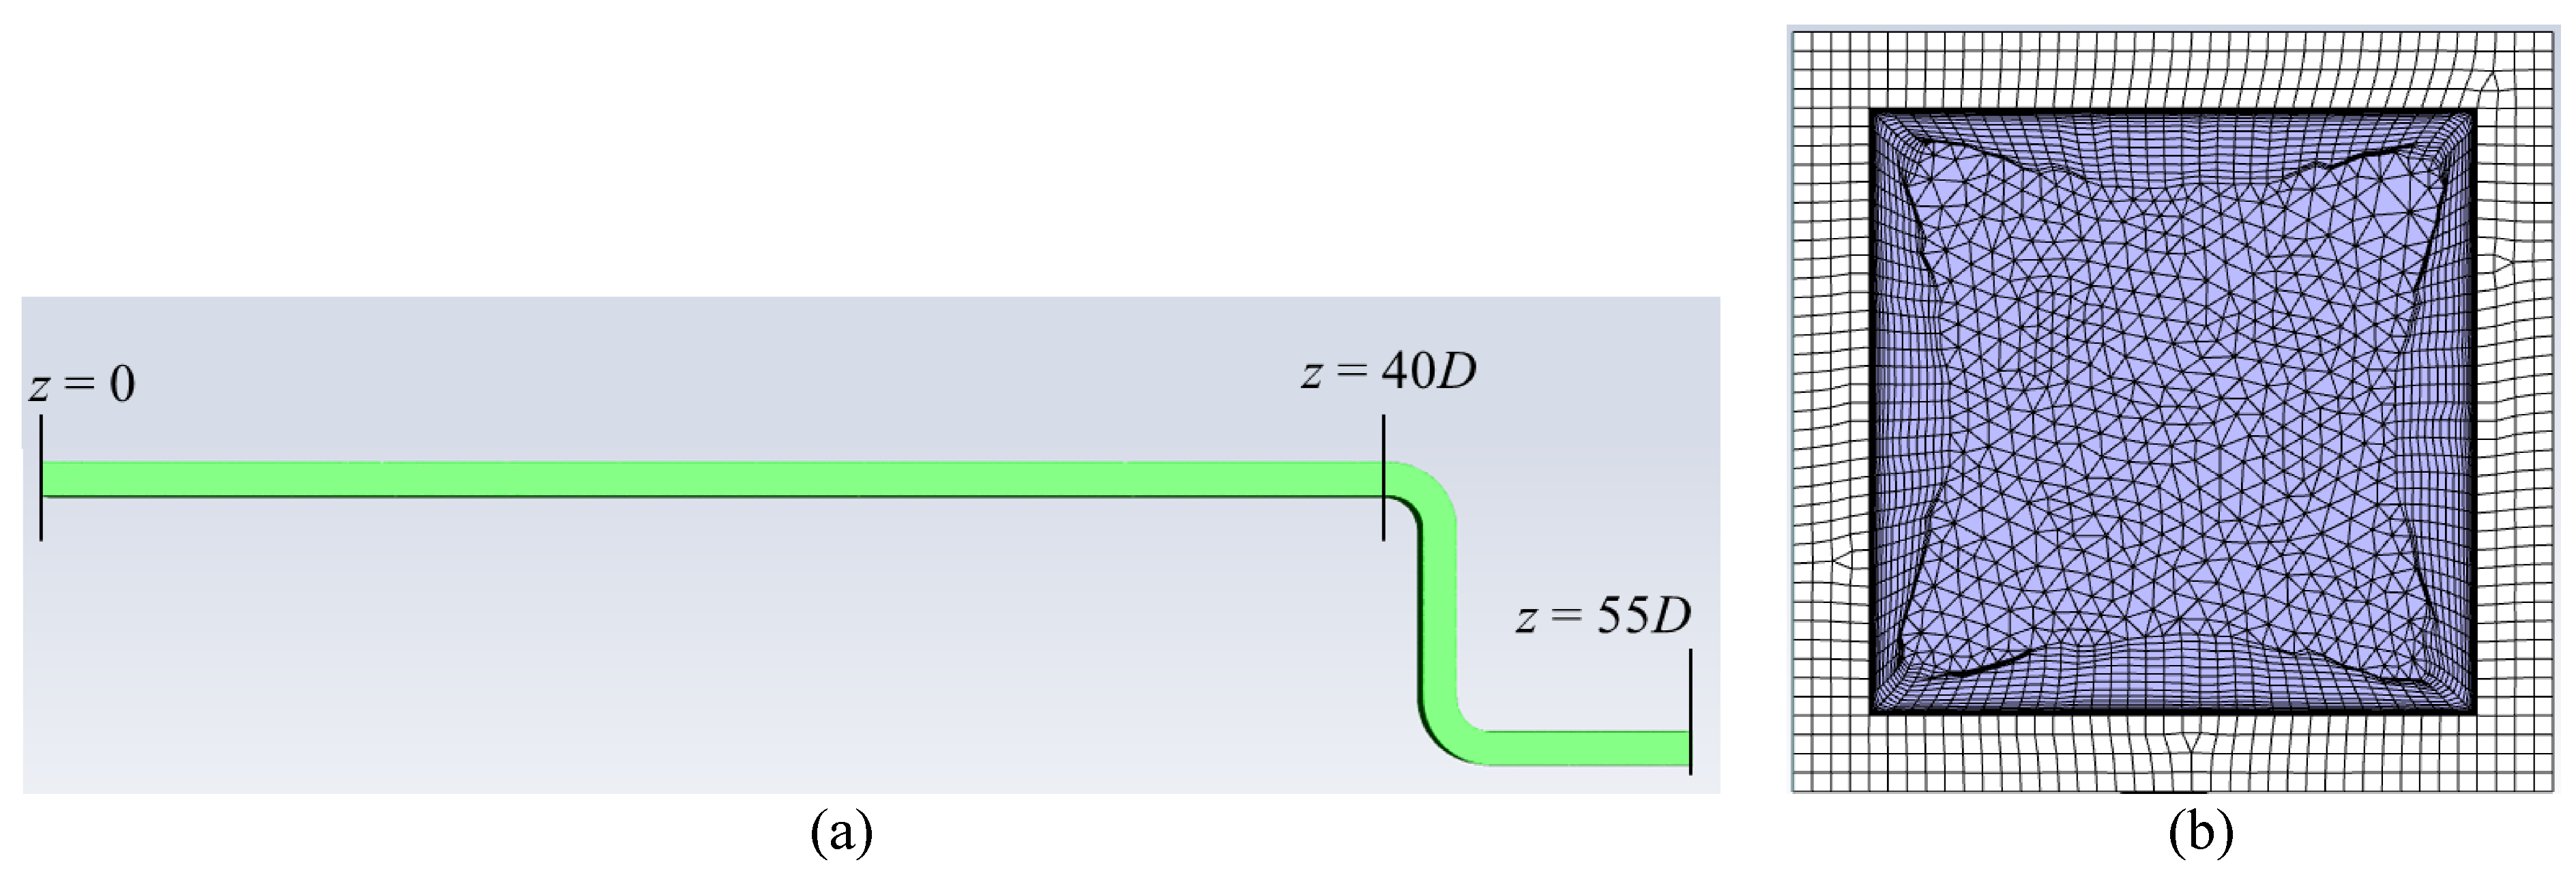
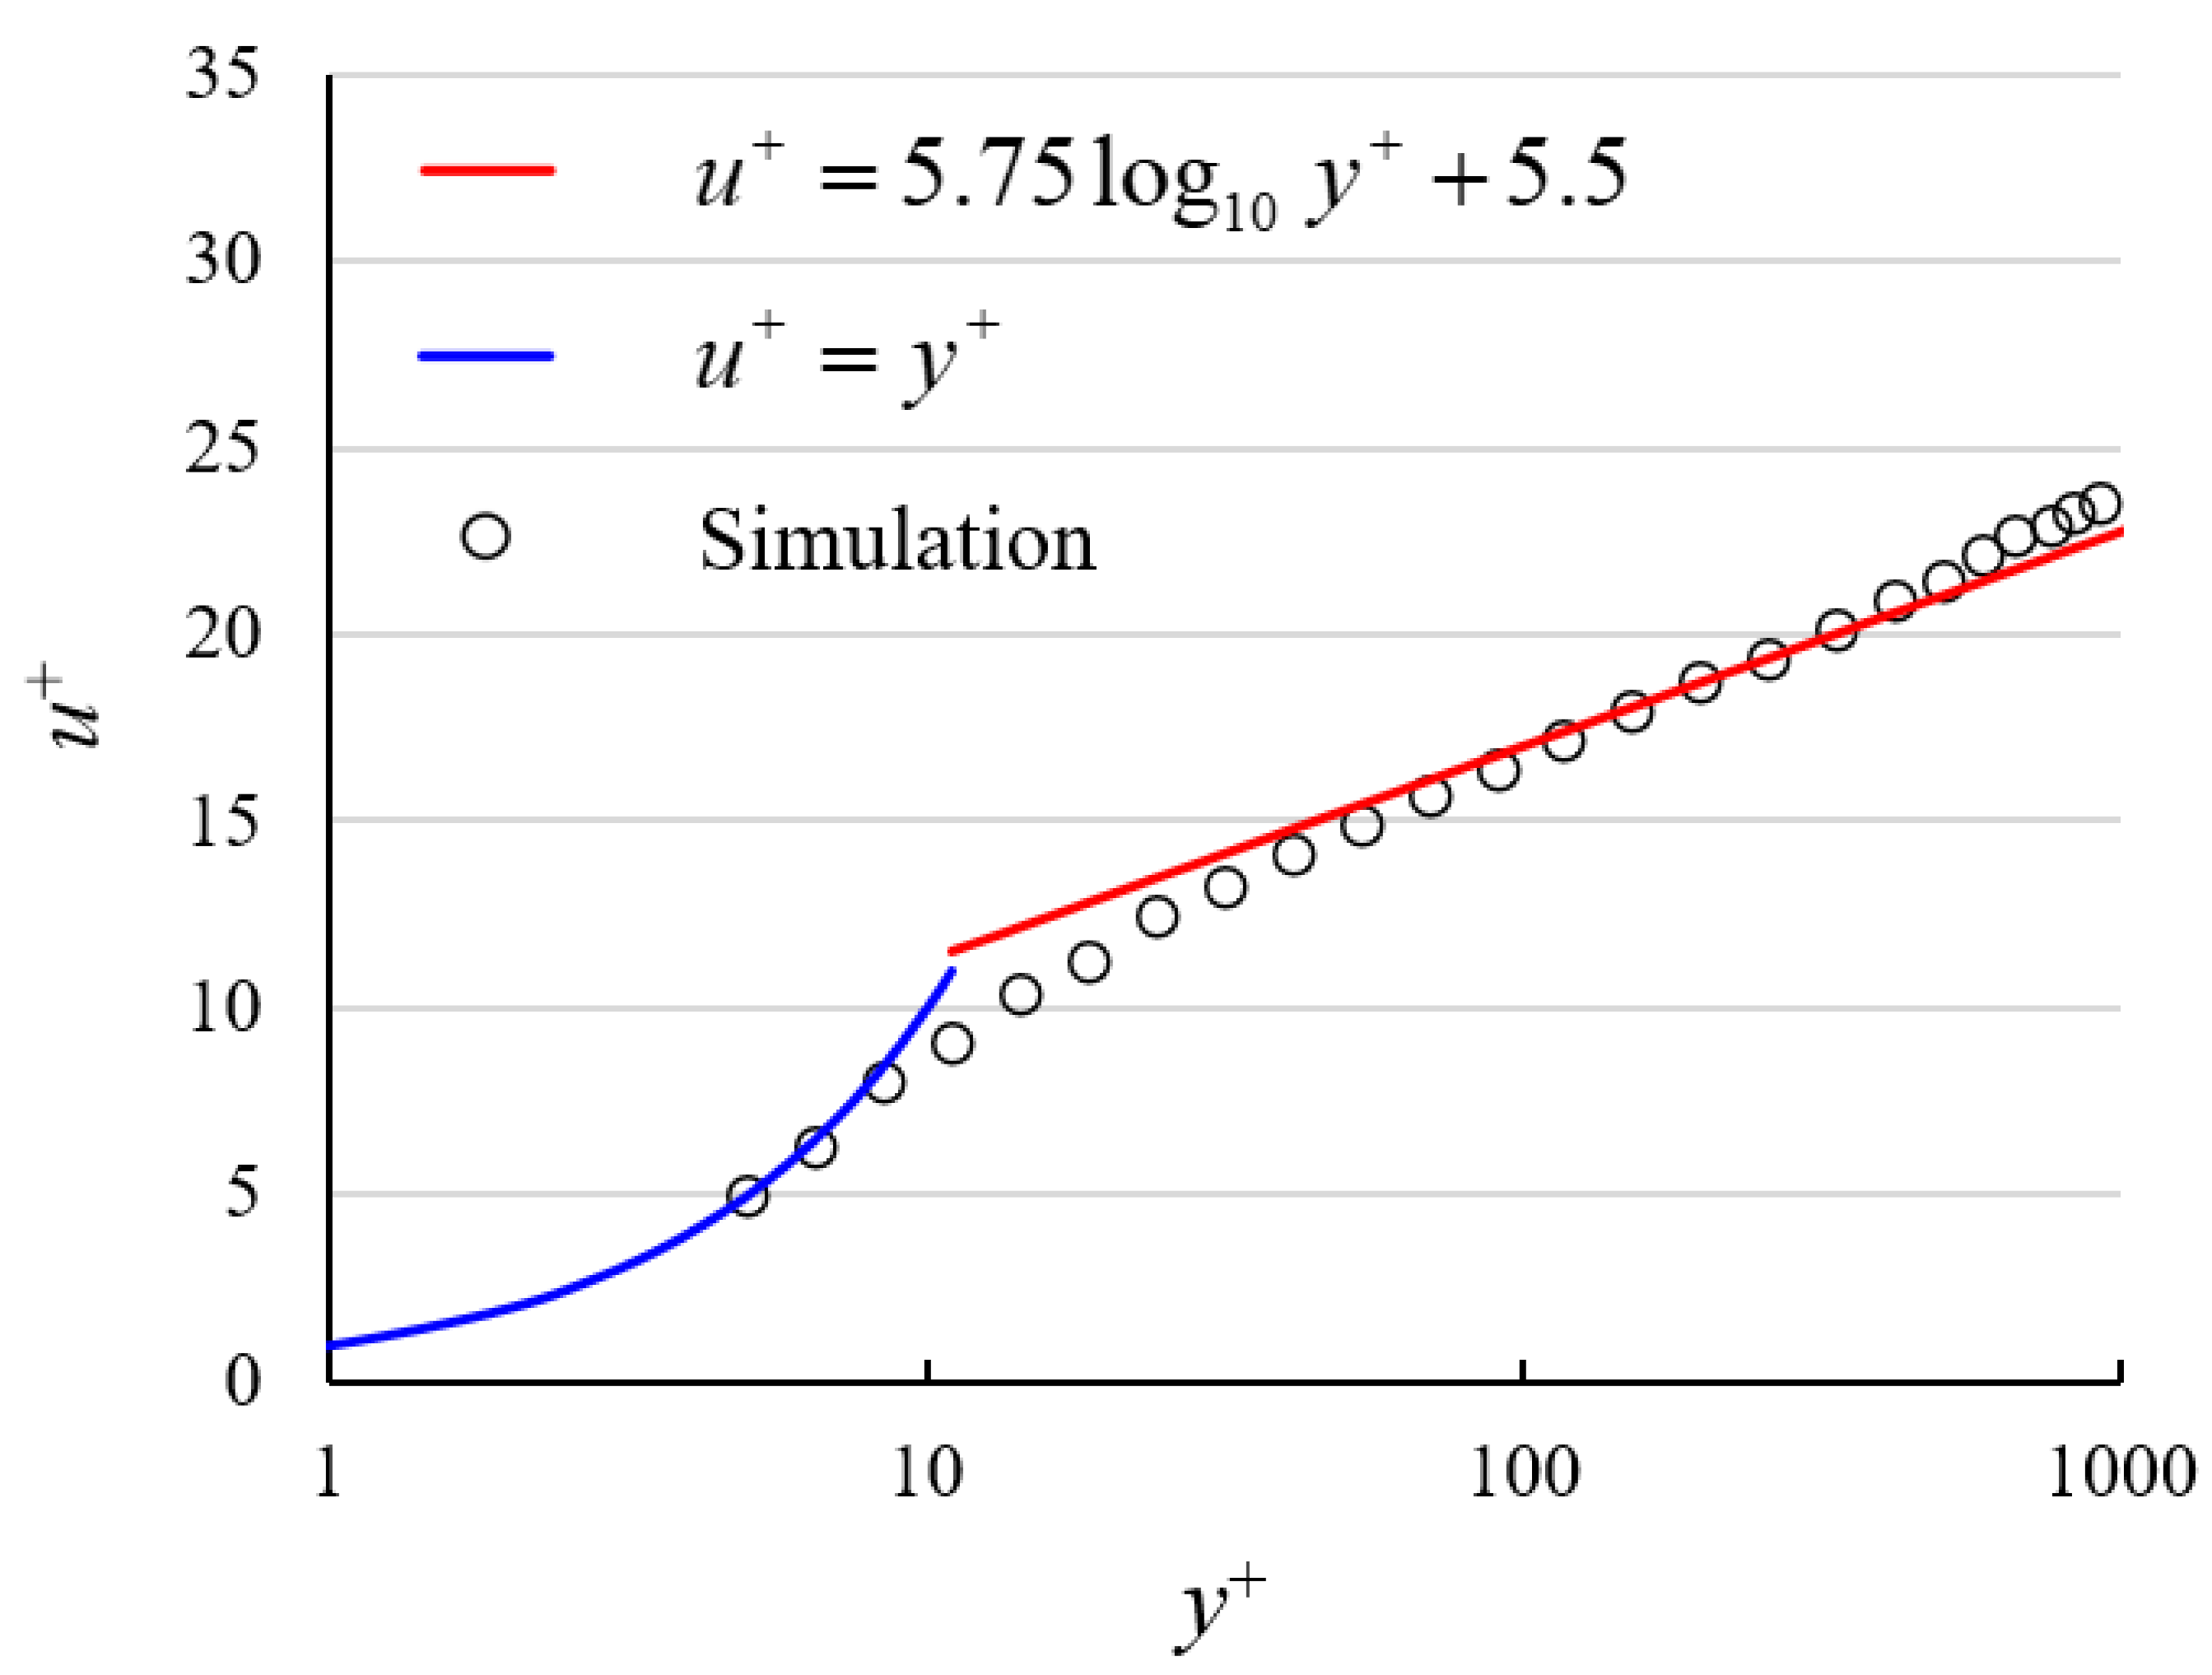
The computational domain of the CHT simulation comprised the fluid domain inside the pipe and the solid domain of the pipe body. For the fluid domain, the mass, momentum, and energy conservation equations for a compressible fluid were solved in the form of Reynolds-averaged Navier–Stokes equations. The change in state of the gas was reflected by the ideal gas equation of state. The SIMPLE method was used to solve the coupled pressure and velocity equations, whereas CHT simulation was conducted to solve the coupled fluid and solid energy equations. Ansys Fluent (2019 R2, ANSYS, Canonsburg, PA, USA) was used as the computational software. The computational domain is shown in Figure 7a and covers the area from the inlet (z = 0) to z = 55 D behind the second bend. The mesh, having a basic resolution of 1 mm, is shown in Figure 7b. The mesh on the fluid side was set to be finer near the wall, with a resolution of 0.06 mm and a growth rate of 1.3 near the wall. The number of elements in the mesh was 9,818,841 and consisted of Tetra, Hex, and Wedge. The number of elements in the solid part (aluminum pipe) was 1,013,760 and the number of elements in the fluid part was 8,805,081. The quality of the mesh was checked and no element had a skewness greater than 0.98. To evaluate the mesh and the model, the velocity distribution in the straight pipe section (z = 38 D) before the bend was validated by calculating y+ and u+. Here, y+ and u+ are the dimensionless distance from the wall and the dimensionless velocity, respectively. Figure 8 shows the results of the validation. It can be seen that the results of the present calculation and the theoretical values are almost identical in the boundary layer and the logarithmic domain. In order to simulate the velocity distribution near the boundary layer, the first layer thickness of the mesh is generally set to y+ ≈ 1 with a margin. However, as shown in Figure 8, the present simulation with the k-ω SST model was able to properly simulate the velocity distribution near the boundary layer of the straight pipe section even at y+ ≈ 4. Also, as shown in the mesh-grid independence study in Section 4, the thermohydraulic characteristics of the double-90° bend pipe did not change even at y+ ≈ 1. Therefore, a first layer thickness of the mesh was set at y+ ≈ 4 to reduce the computational and post-processing costs. The discretization of the spatial direction was set as shown in Table 3. Boundary conditions for the internal fluid were set at fixed values of 40 m/s and 402 K for the mean velocity and temperature at the inlet, respectively, on the basis of measurements. As the outlet condition, the pressure was set at a fixed value of 110 kPa on the basis of experimental values. The wall surface had a non-slip condition for velocity and a temperature coupled with the solid domain simulation. In the solid domain simulation, the inner wall temperature was coupled to the fluid side as described above, and the heat transfer coefficient and ambient fluid temperature (To = 298 K) were set for the outer wall. The heat transfer coefficients for the exterior walls were fixed at the top, bottom, left, and right to the values given in Section 2.2; i.e., ho = 14.8 (left), 15.2 (right), 6.8 (top), and 11.4 (bottom) W/(m2 K).
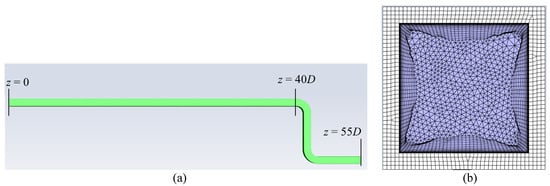
Figure 7.
CHT simulation overview: (a) simulation domain and (b) simulation mesh.
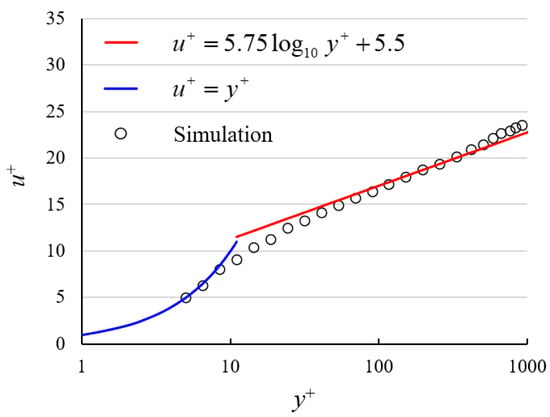
Figure 8.
Velocity distribution of CHT simulation in a straight pipe section (z = 38 D).

Table 3.
Discretization in spatial direction.
The k–ω SST model [39] was used as the turbulence model in this simulation. In previous studies of bend flow, the simulation results were in good agreement with measurements with the LES [9,29], RSM-ω [9,28], and k-ω SST [28] models, which solve directly without wall function. We chose the k-ω SST model, which has the lowest computational cost among these models. The k-ω SST model is expected to be suitable for simulating flows with separation, such as a bend pipe, because it uses the k-ω model, which has excellent separation prediction, to simulate the interior of the boundary layer. However, since the k-ω SST model is an isotropic turbulence model, its ability to represent a complex flow field with two bends, as in this study, has to be validated. Therefore, in Section 3, we perform a detailed validation by comparing the measured results of the flow field in this study with the measured and simulated results of the flow field and temperature distribution in previous studies. In the k-ω SST model, the Reynolds stresses are thus expressed by
The above equation is written in Einstein’s contracted notation, where μt is the eddy viscosity coefficient. In the case of turbulent flows, this eddy viscosity coefficient is much greater than the viscosity coefficient and is therefore important to the evaluation of turbulence. The turbulent heat flux in the energy equation is expressed by
where Prt is the turbulent Prandtl number, which in this study was set at 0.85. The eddy viscosity coefficient inside the boundary layer is defined by
where νt is the eddy diffusivity; k is the turbulent kinetic energy, which is the intensity of turbulent motion; and ω is the turbulence eddy frequency, which is the reciprocal of the turbulence lifetime.
3. Results and Discussion
3.1. Circumferential Temperature Fields in Cross-Sections and the Axial Temperature Distribution
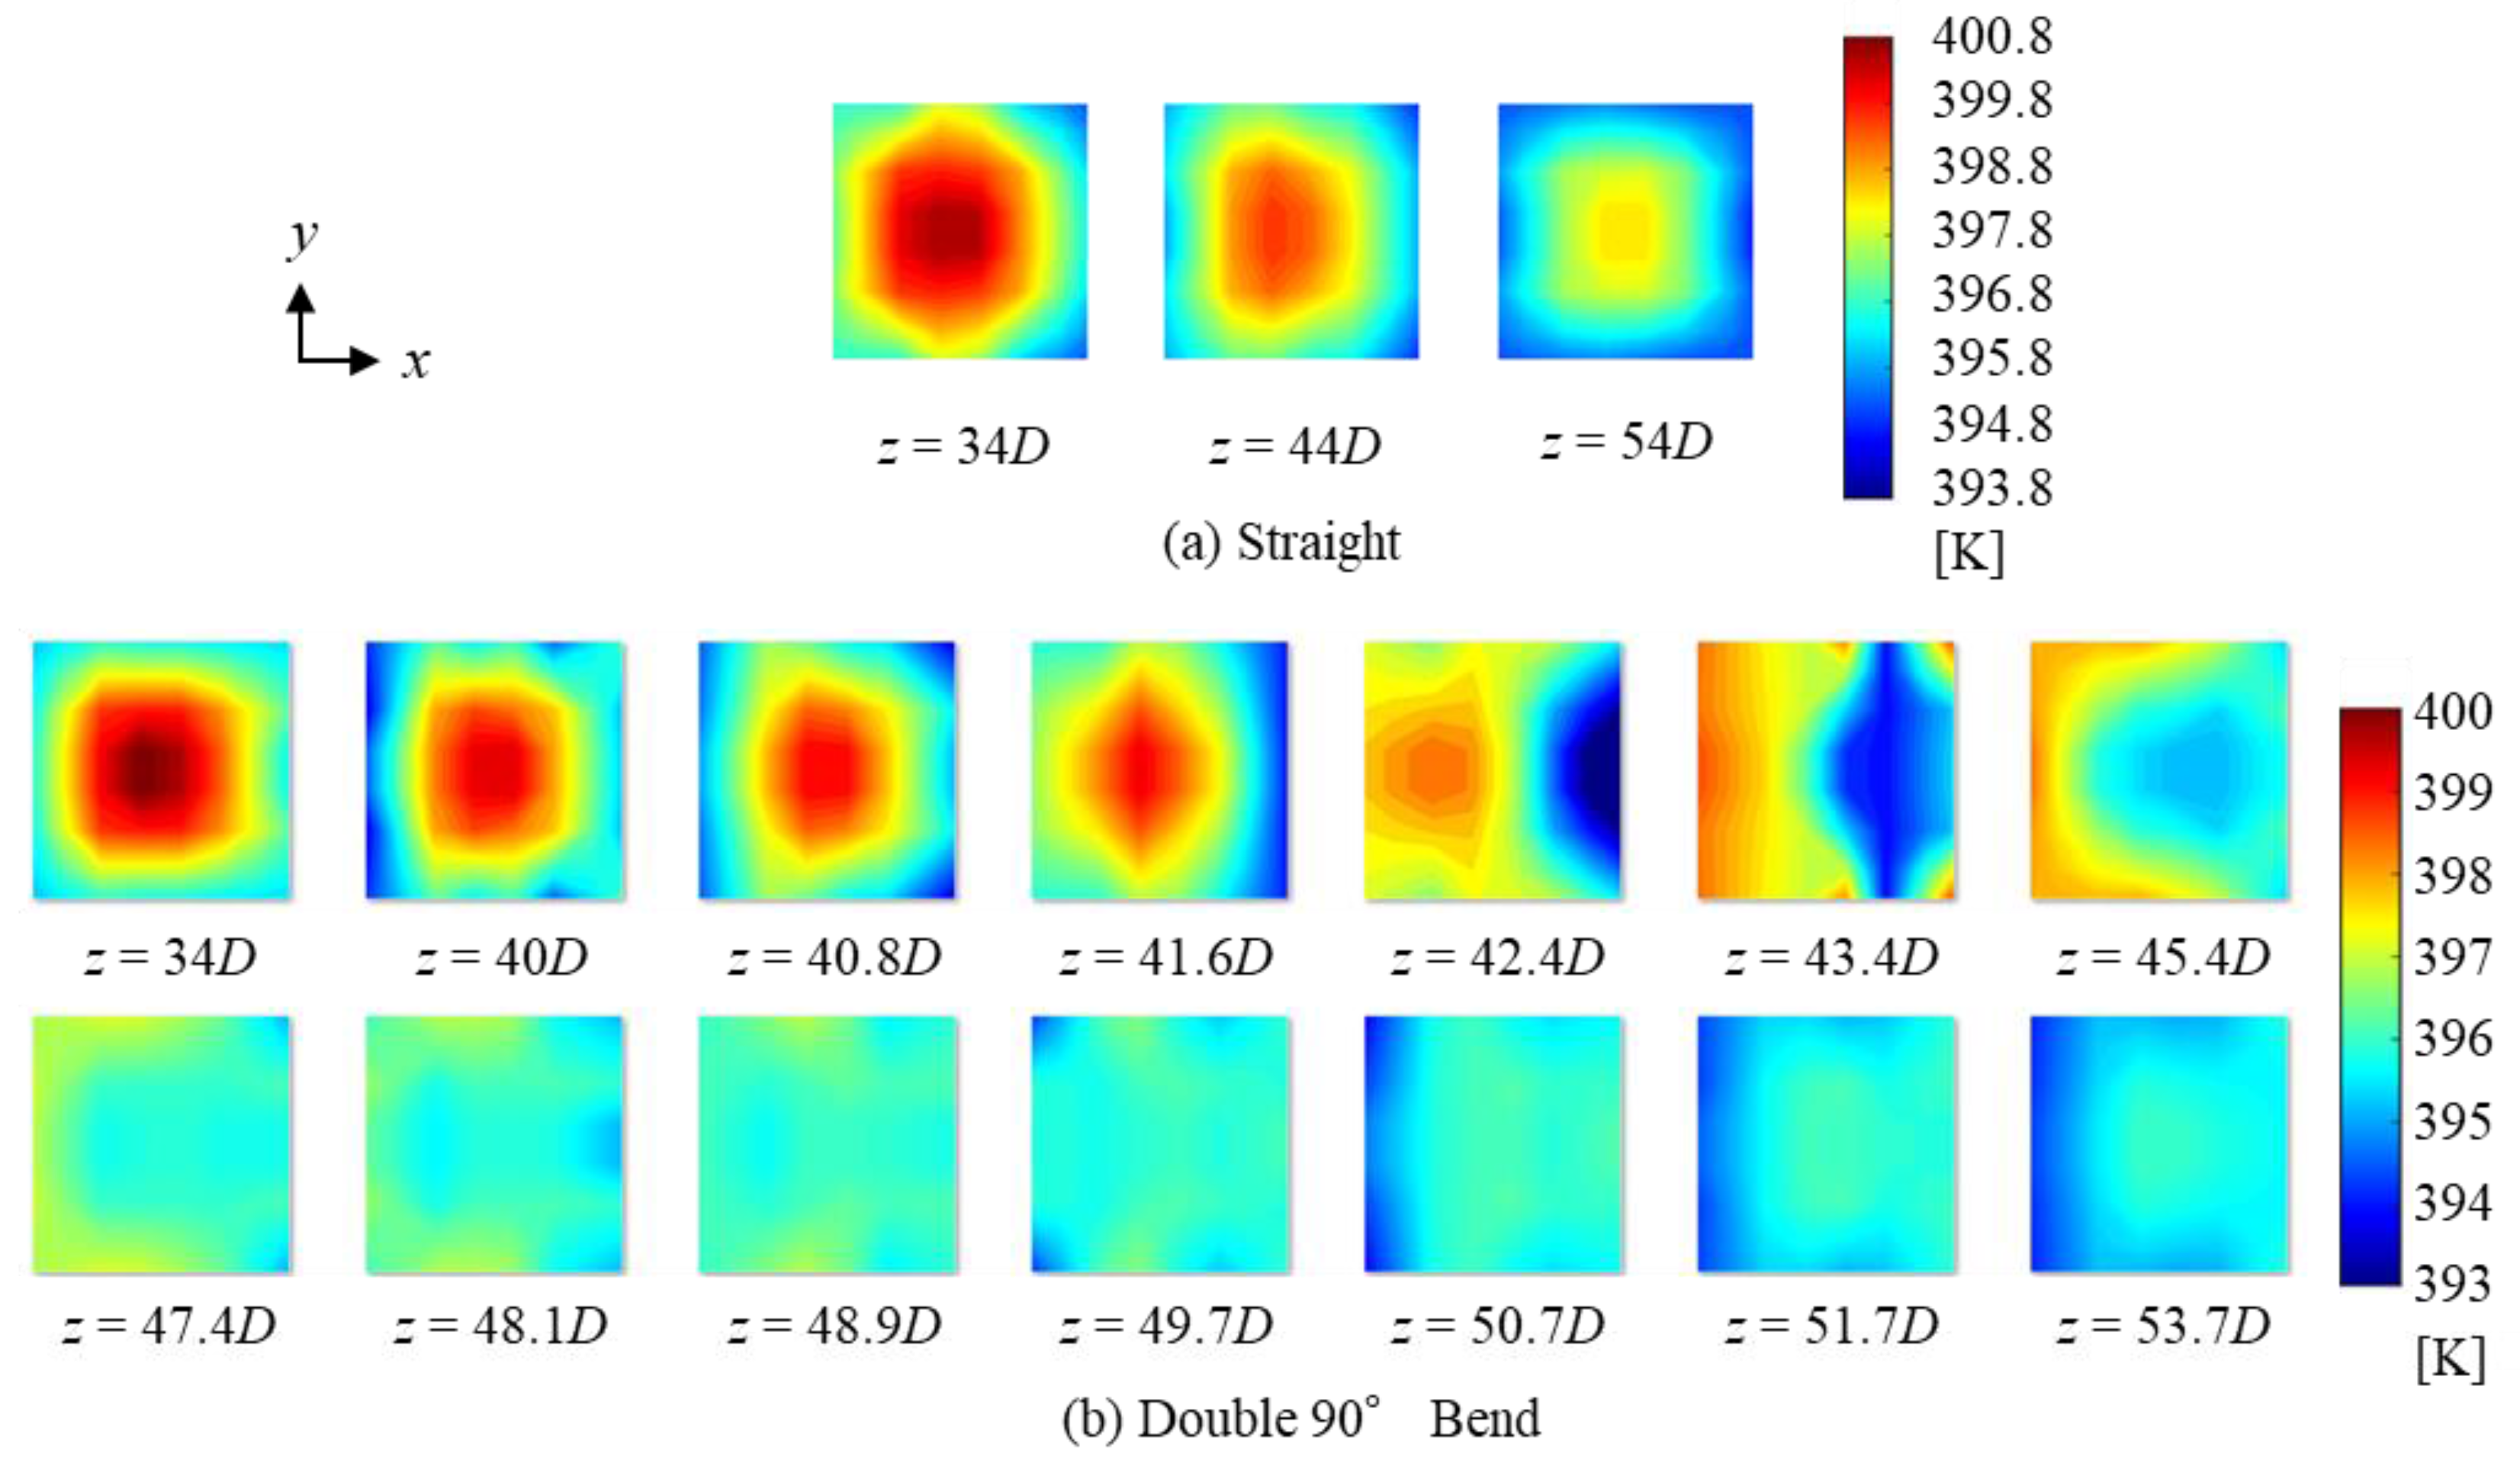
Figure 9 shows the cross-sectional temperature distribution measured using the thermocouples. Figure 9a shows that for the straight pipe, the high-temperature core is located at the center of the pipe and the average value decreases as one moves downstream. Figure 9b shows that for the double-bend pipe, the high-temperature core, which is at the center of the first bend entrance (z = 40 D), shifts to the outside (−x side) at the first bend exit (z = 42.4 D). This shift may be due to compressive heating of the fluid on the outside of the bend by centrifugal forces, as suggested by Guo et al. for their single-bend pipe [23]. The distribution after the entrance to the second bend (z = 47.4 D ~ 53.7 D) shows that the hot core, which was biased toward the −x side, gradually shifts toward the +x side. This shift is thought to be due to compressive heating by centrifugal forces as for the first bend. However, the temperature gradient is not as large as that for the first bend. This is because, as shown by the temperature distribution at the entrance of the first bend (z = 47.4 D), there is a history of bias of the hot part toward the −x side due to compressive heating of the first bend at the entrance to the second bend. Therefore, if there are double-bends in opposite directions, the distribution is not the same as that of the first bend because of the history. Although this result may be affected by the distance between the first and second bends, an effect of the history of the first bend remains for at least a length of approximately 5 D. Therefore, when evaluating heat transfer according to the temperature distribution in pipes with two or more bends, it is difficult to make estimations from the results of a single-bend pipe, and experiments or numerical simulations based on the actual geometry are required.
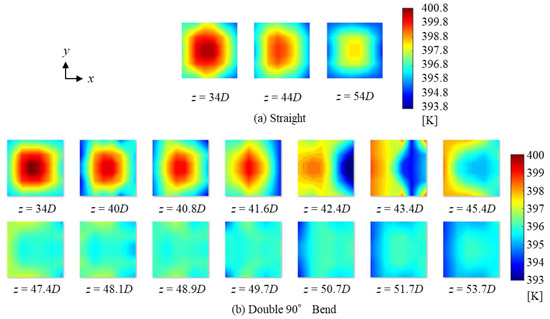
Figure 9.
Cross-sections of the circumferential temperature field.
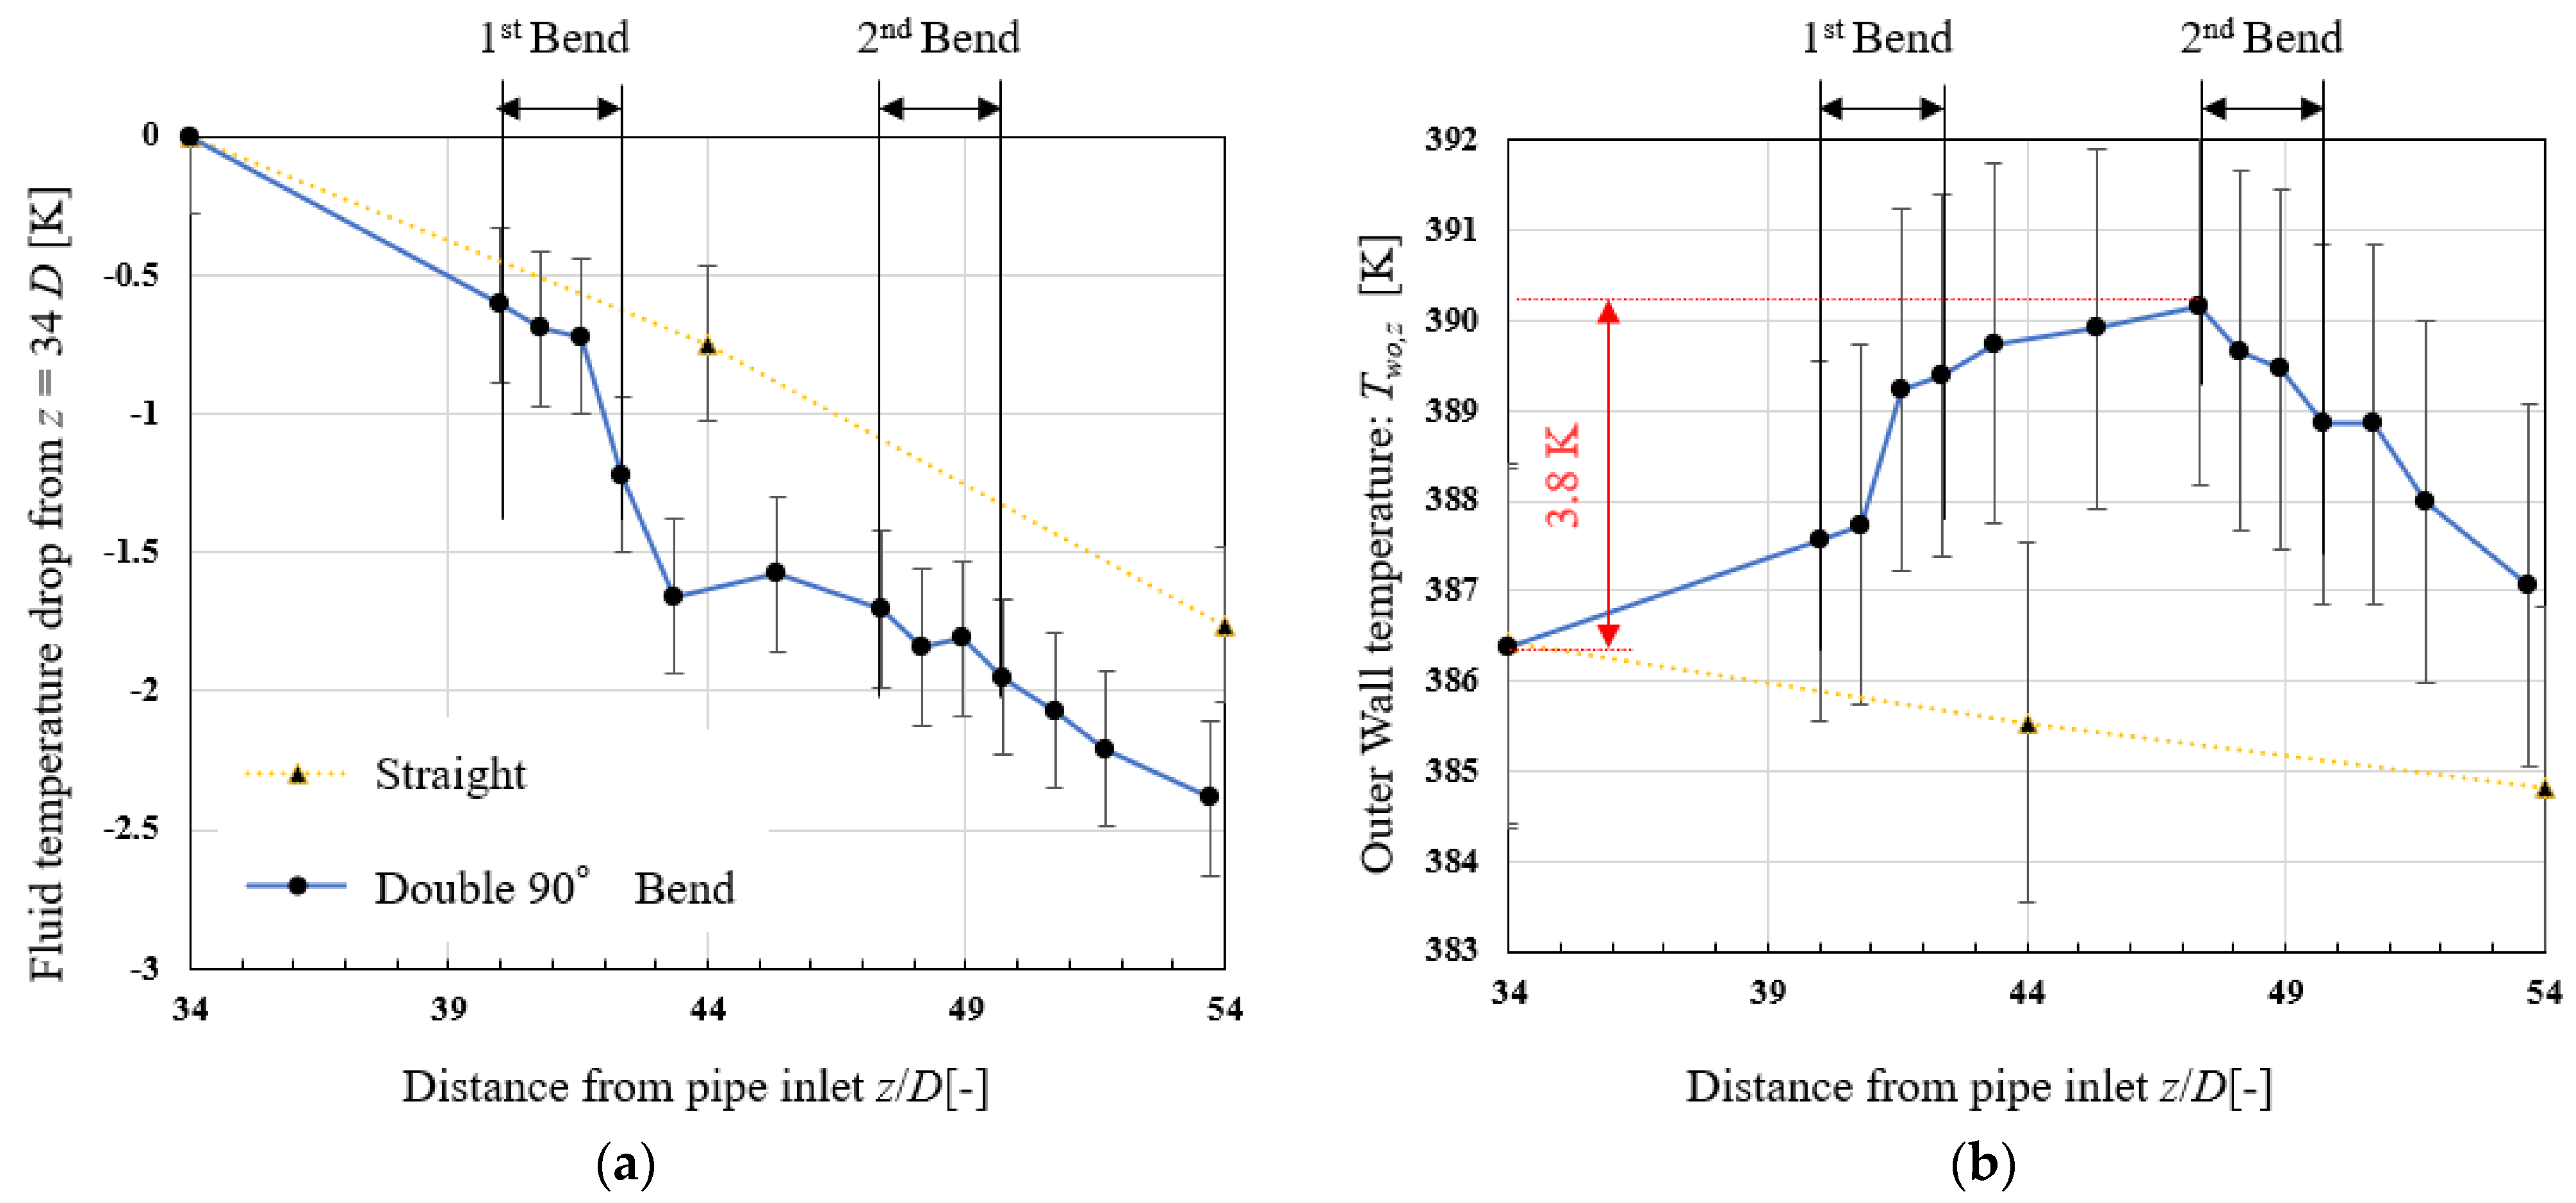
Figure 10a compares the mean fluid temperature Tfb,z obtained by integrating the cross-sectional temperature distribution between the straight pipe and double-bend pipe. The experimental apparatus provided an average fluid temperature at the inlet of the inspection area of 398.0 K for the straight pipe and 398.8 K for the double-bend pipe, and the difference from the inlet temperature (Tfb,34D − Tfb,z) can thus be easily compared between the two types of pipe. In the case of the straight pipe, the temperature gradient does not change in the axial direction; i.e., the temperature decreases linearly. In the case of the double-bend pipe, the temperature gradient varies with the curvature, and in particular, the fluid temperature decreases rapidly at the first bend. Considering the heat quantity of the fluid, it can be said that heat transfer is enhanced at the first bend. The temperature gradient decreases after the first bend, and there is no sudden drop in temperature at the second bend as observed at the first bend. Figure 10b shows the measurements of the outer wall temperature made through thermography. In the case of the straight pipe, the wall temperature gradient is almost constant in the axial direction, indicating a linear decrease with a gradient similar to that of the fluid temperature. This result is due to the flow structure hardly changing in the axial direction of a straight pipe, such that the amount of heat dissipated from the fluid to the pipe does not change and the difference between the fluid temperature and wall temperature is maintained. Figure 10b shows that in the double-bend pipe, the wall temperature gradient is not linear, and the temperature increases up to the entrance of the second bend and decreases thereafter. The effect of the complex wall temperature distribution in the double-bend pipe on the heat transfer characteristics was evaluated using the heat transfer model shown in Figure 4. First, there is a large difference between the outer wall temperature and the ambient fluid temperature of 88.4 K at z = 34 D. Therefore, as shown in Figure 10b, even if the wall temperature changes by a maximum of 3.8 K, the amount of heat quantity escaping to the ambient fluid hardly changes. Therefore, Qwo,z in Figure 4 is almost constant. However, the difference between the internal fluid temperature and the external wall temperature is as small as 11.7 K at z = 34 D, and the amount of heat quantity escaping to the ambient fluid is thus affected by the change in wall temperature. Qwi,z is thus expected to have an axial characteristic. In addition, Equations (12) and (13) show that Qwz,z has axial properties due to the bending of the pipe. However, it is difficult to evaluate the local heat flux and heat dissipation for a nonuniform velocity distribution. The local heat dissipation was thus evaluated in CHT simulation, and for experimental evaluation, the heat dissipation and Nusselt number over the entire inspection area were calculated using Equations (4)–(7).
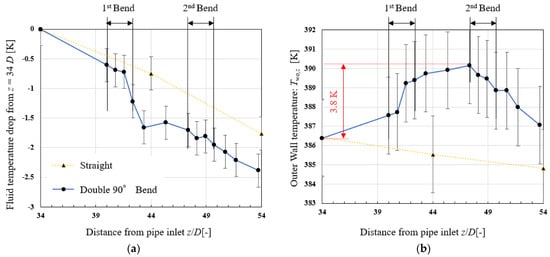
Figure 10.
Axial temperature distribution: (a) fluid temperature drop from z = 34 D and (b) outer wall temperature.
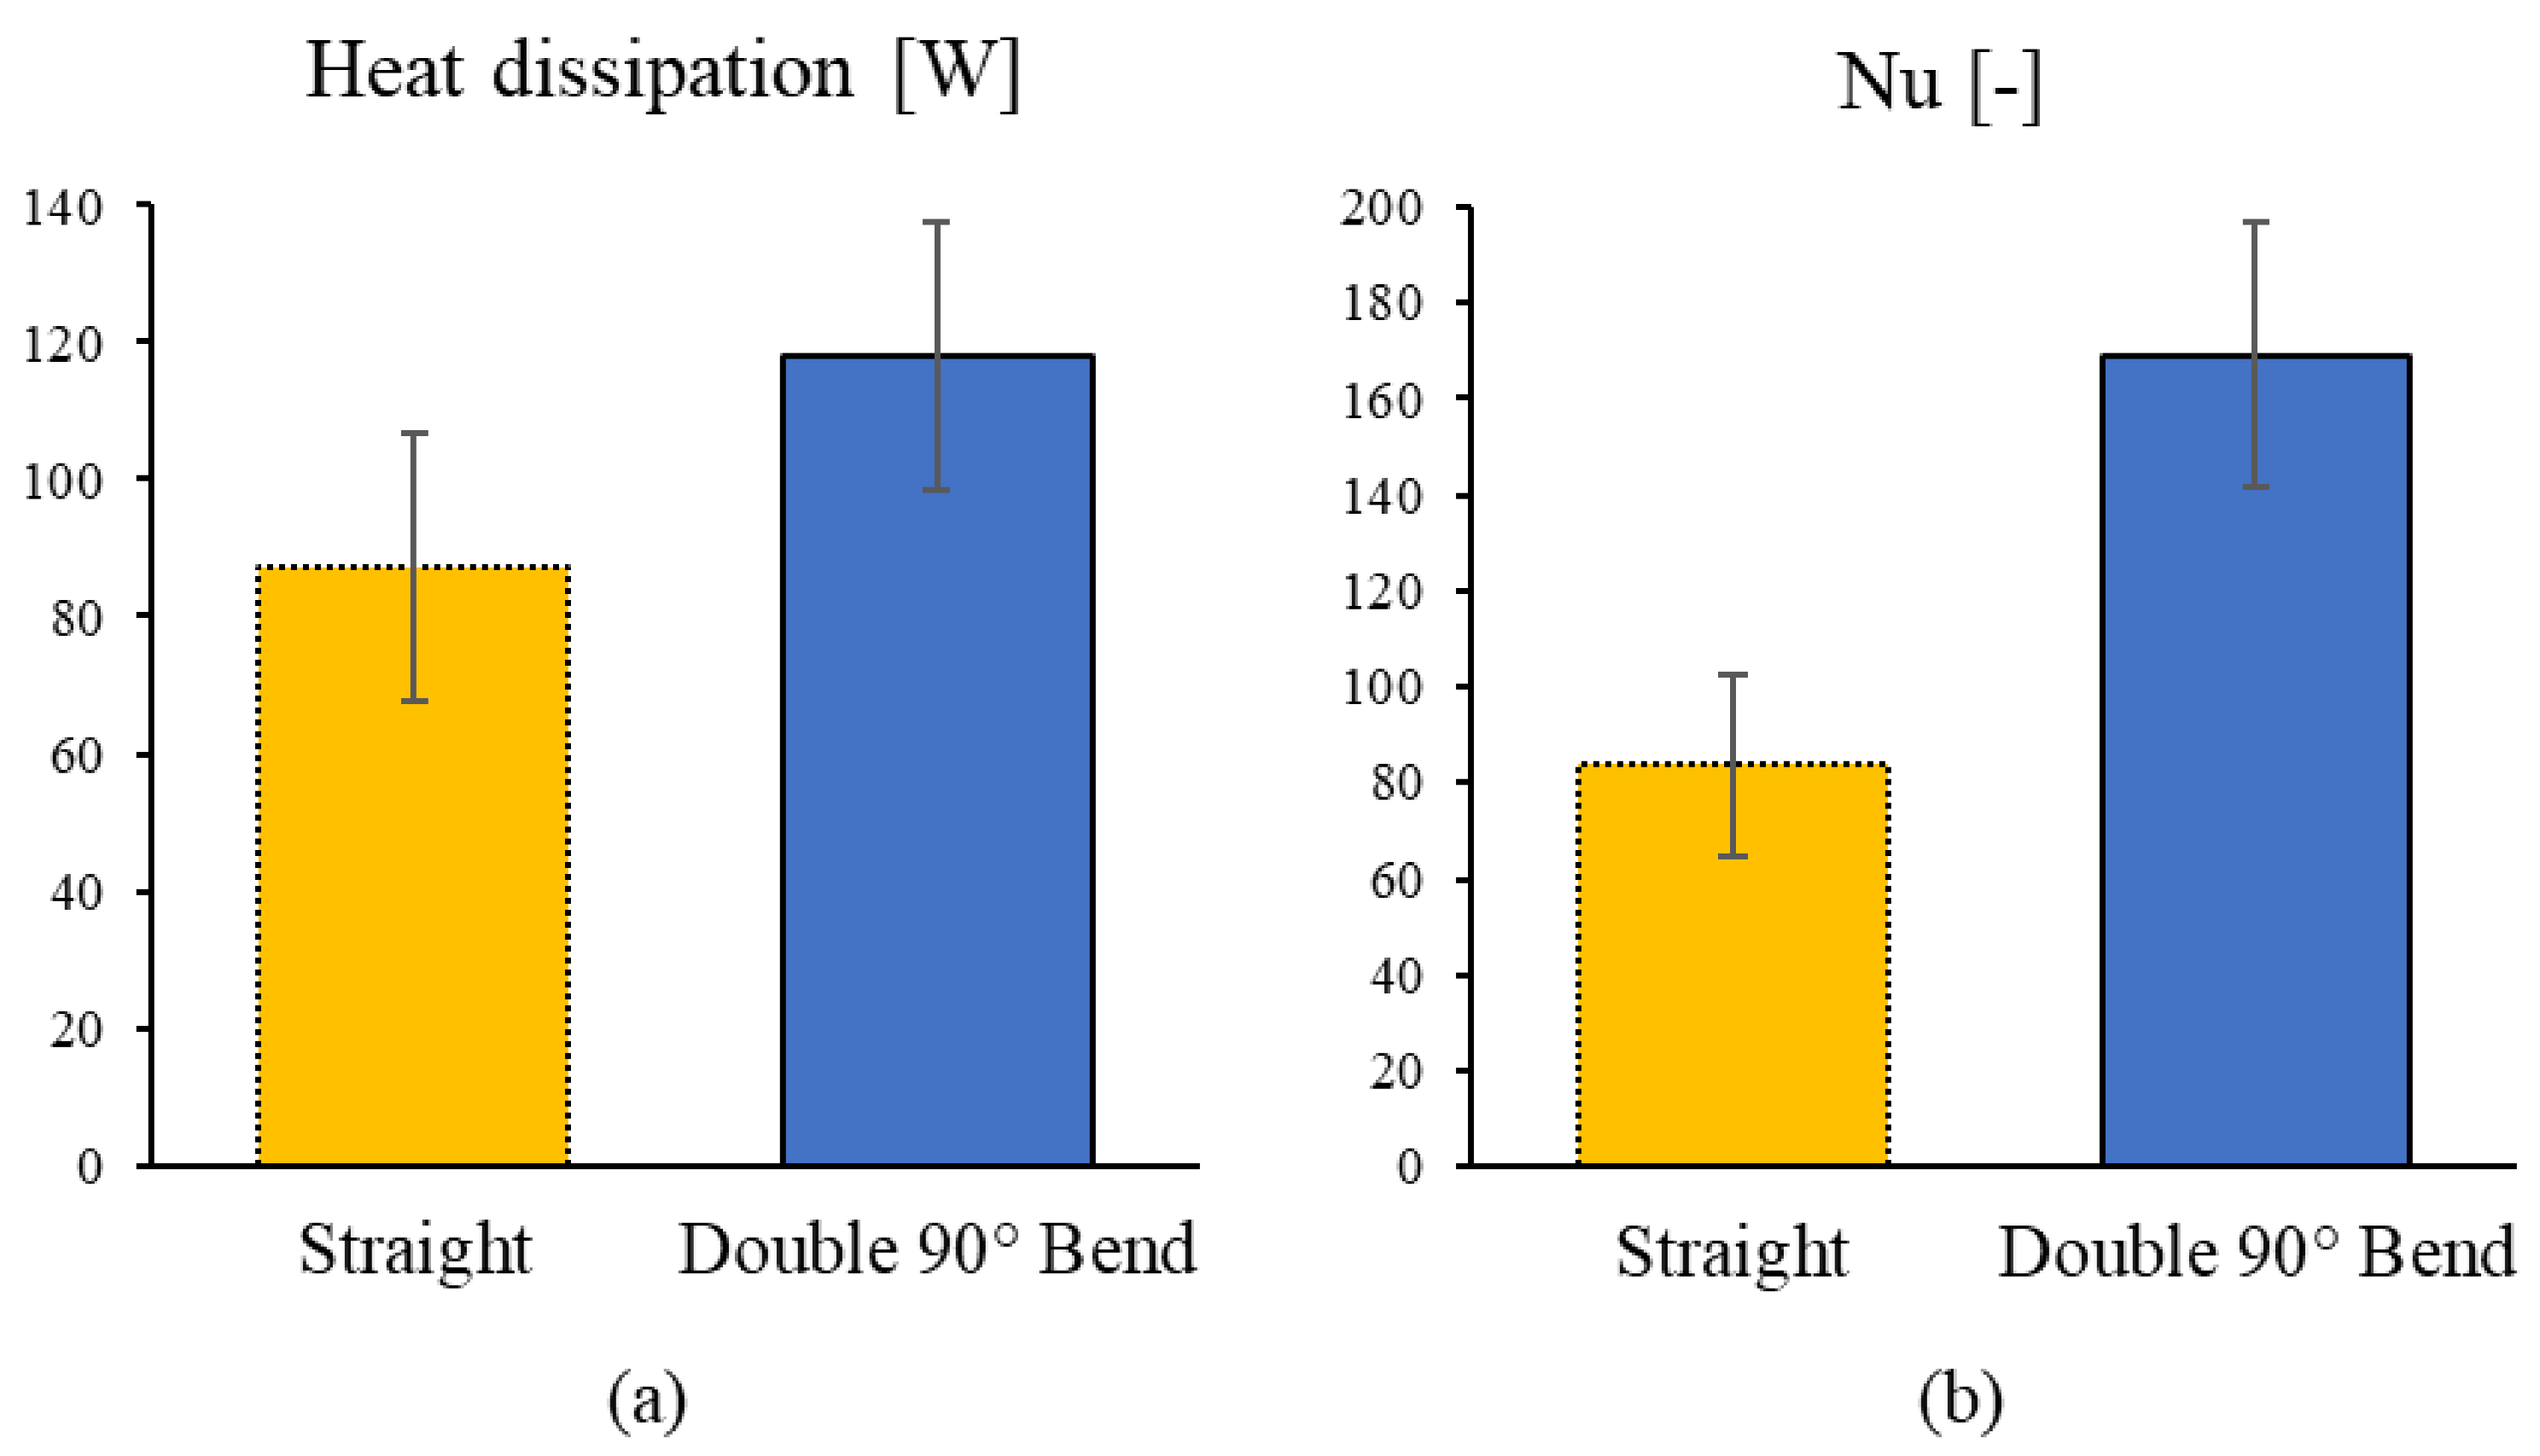
Figure 11a shows the heat dissipation to the inner wall of pipe from internal fluid over the entire inspection area with z − Δz = 34 D and z + Δz = 54 D using Equations (4)–(6). As mentioned above, the effect of the nonuniform velocity distribution cannot be corrected, but it is assumed that the effect of the distribution is negligible because the velocity distribution is nearly flat at the entrance (z = 34 D) and exit (z = 54 D) of the inspection area owing to turbulence. The heat dissipation of the bent pipe is approximately 1.4 times that of the straight pipe, indicating that heat dissipation is enhanced by the bend. Figure 11b shows the Nusselt number calculated in the same way. For verification, the Nusselt number of the straight pipe is compared with that given by Gnilinski’s equation, NuG:
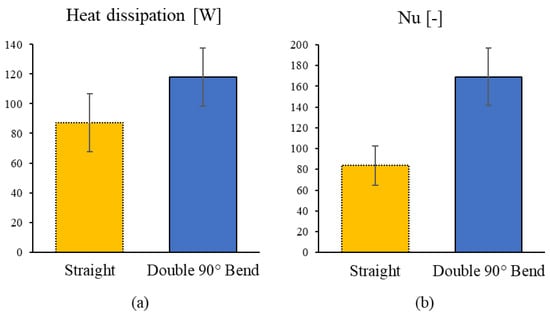
Figure 11.
Heat dissipation from the internal fluid to the inner wall of the pipe (a) and Nusselt number (b) over the entire inspection area.
Gnilinski’s equation gives NuG = 110, which is slightly larger than the experimental Nusselt number of 84. This difference may be due to the representative flow velocity of the Reynolds number being set at the center of the pipe due to the convenience of the measurement device, resulting in a value larger than the actual cross-sectional average flow velocity. Figure 11b shows that the Nusselt number of the double-bend pipe is approximately twice that of the straight pipe, indicating that the bend promotes heat transfer appreciably. As the heat dissipation of a double-bend pipe is 1.4 times that of a straight pipe, the effect of the double bend is expressed more strongly in the Nusselt number than in the heat dissipation. This result is due to the wall temperature of the double-bend pipe being higher than that of the straight pipe, as shown in Figure 10b, and the temperature difference between the wall and fluid thus being smaller for the double-bend pipe, in addition to the greater heat release shown in Figure 11a. The evaluation of the heat transfer performance using the Nusselt number reveals that the change in flow structure due to the bend increases the heat transfer performance by approximately a factor of 2 relative to that of the straight pipe. The mechanism of heat transfer enhancement by the double bend cannot be clarified only by measuring temperature because the heat transfer correlates with the flow field. In addition, as mentioned above, heat transfer within the wall surface must also be evaluated, making experimental evaluation difficult. Numerical CHT simulations were thus performed to evaluate the heat transfer characteristics and the correlation between the flow and temperature fields.
3.2. CHT Simulation
3.2.1. Validation and Grid-Independence Study
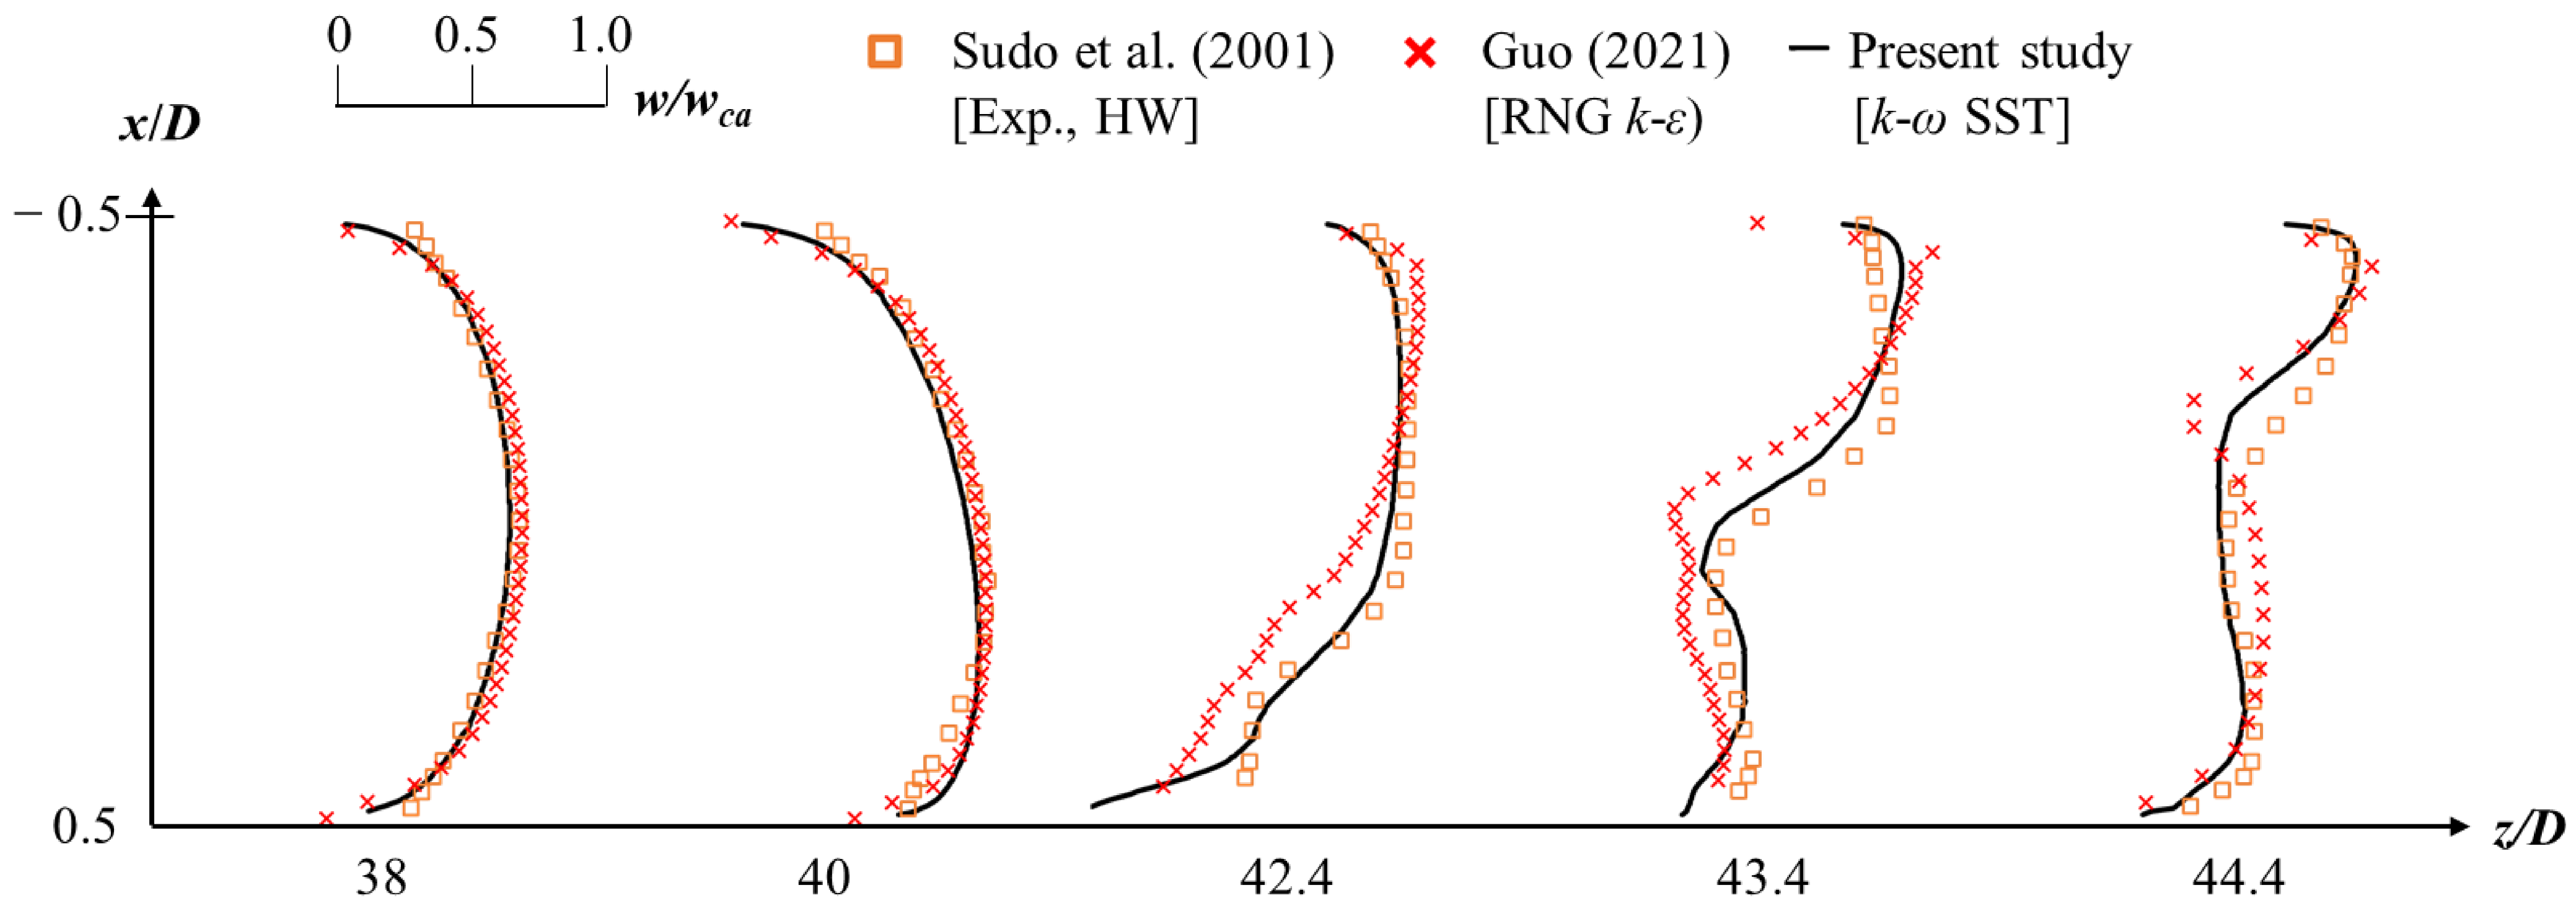
As a validation of the CFD simulation, we evaluated whether the simulation could reproduce the flow velocity distribution. Figure 12 shows the results of the comparison with previous studies. The simulations by Guo et al. were performed under the same flow conditions as the present study (Re = 40,000, De = 38,000) for a single bend of the same curvature. Although the experiments by Sudo et al [40]. were performed under slightly different flow conditions (Re = 40,000, De = 20,000) with a single bend of different curvature, the data are valuable because they were measured with a hot-wire anemometer under similar geometry and flow conditions. A comparison of the Sudo et al. measurements shows that the simulations before and after the bend are in good agreement with the measured velocity distribution. In addition, the present simulation (k-ω SST) is closer to the Sudo et al. measurements than the results of the RNG k-ε model of Guo et al. This is probably because the k-ω SST model, which directly simulates the distribution near the wall, can adequately simulate the velocity distribution at bends that cannot be expressed by the wall function.
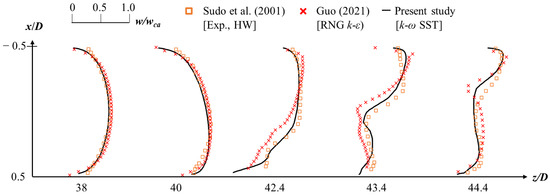
Figure 12.
Comparison of axial velocity distributions in past study and present study [23,40].
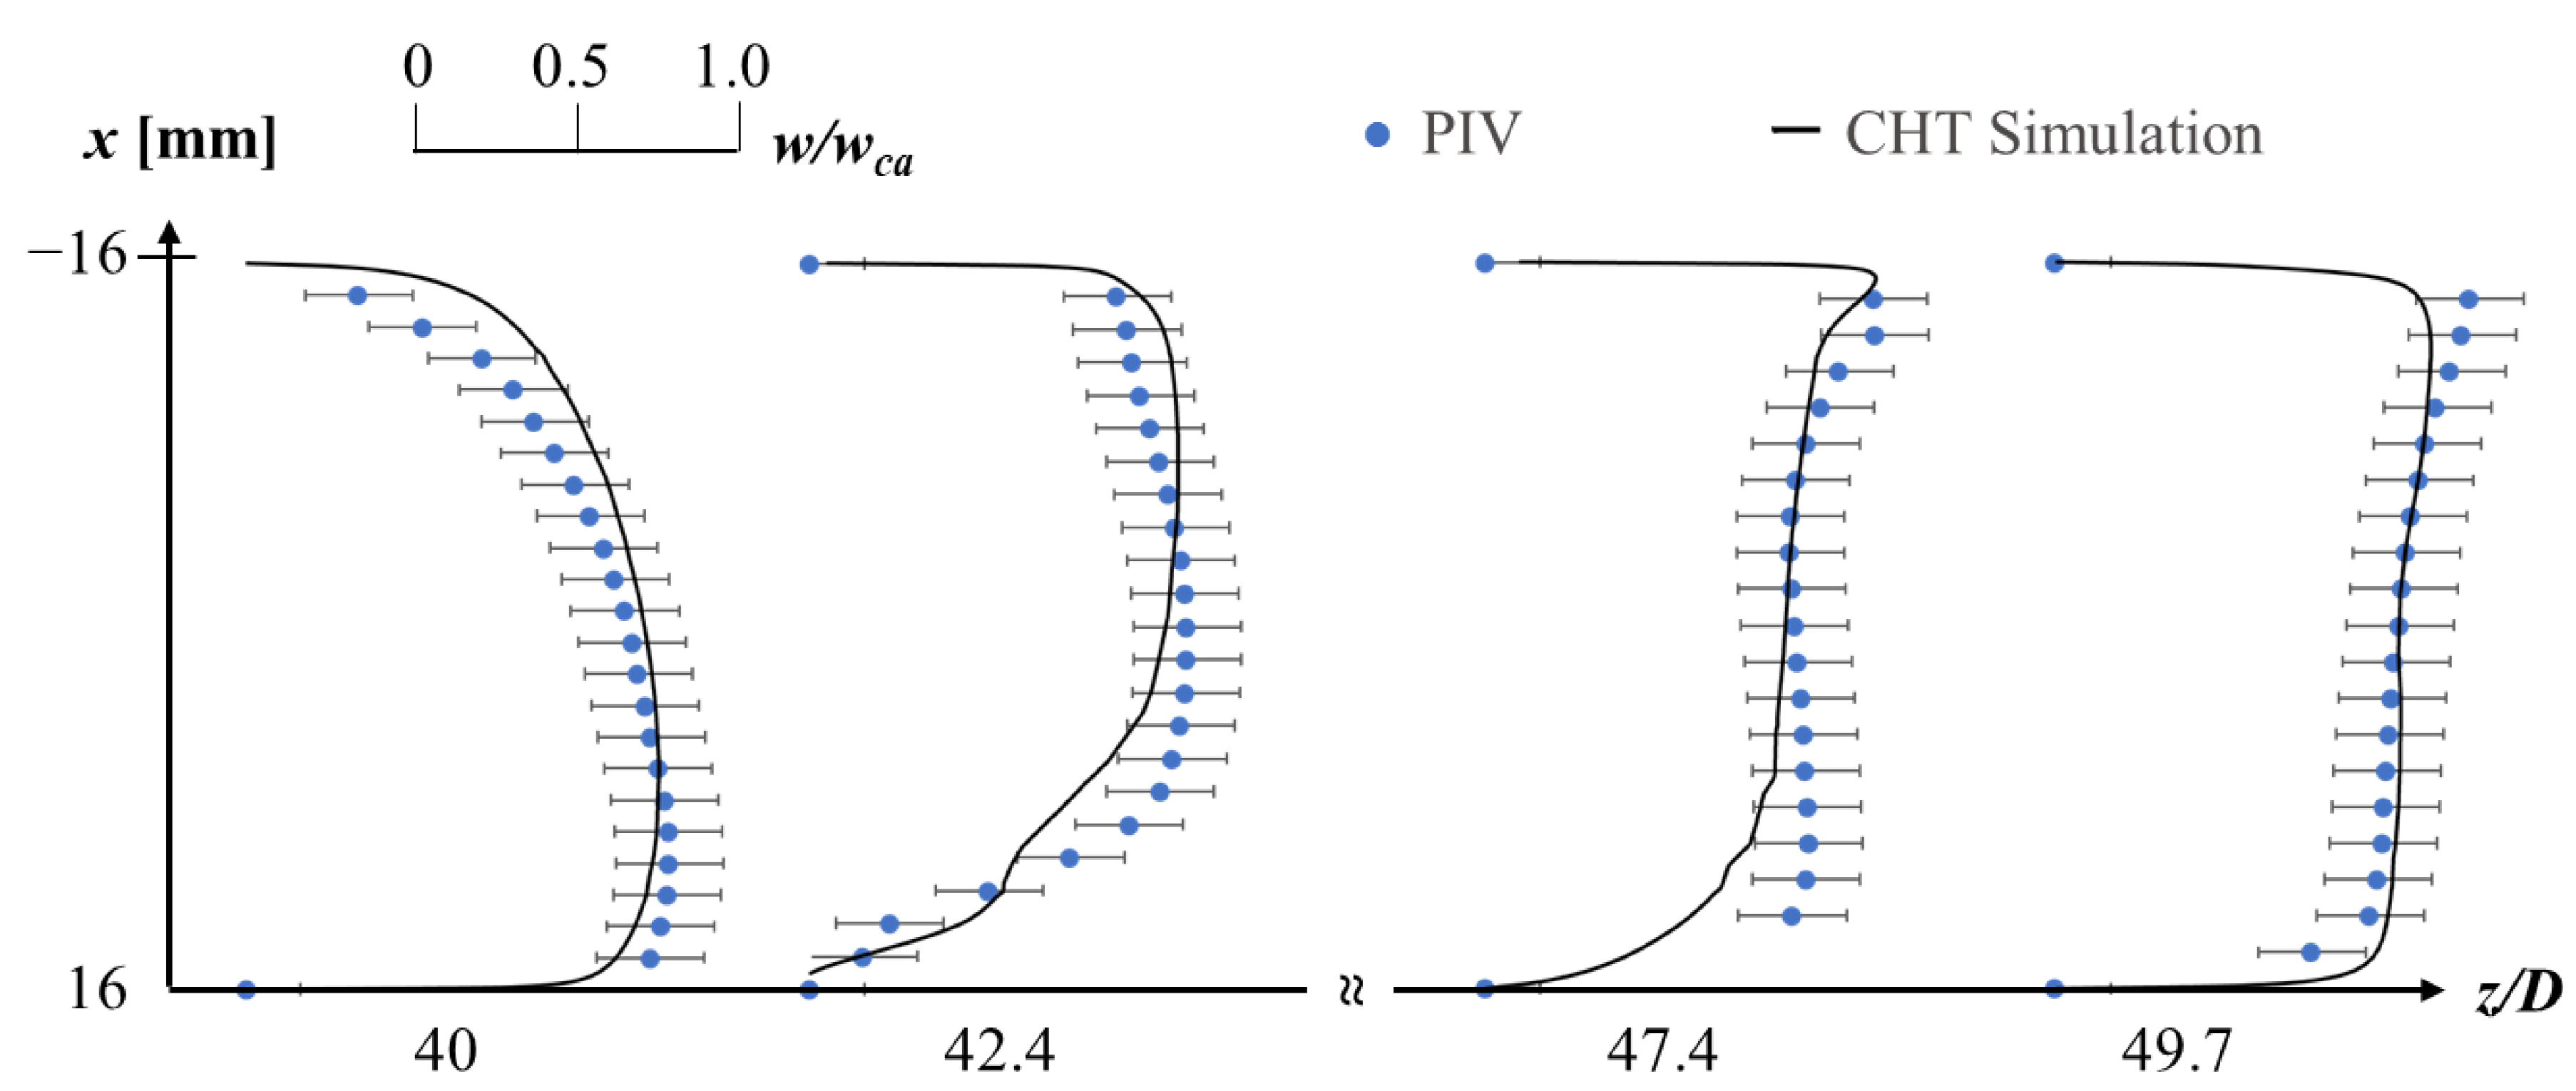
Next, the velocity distribution in the double-bend Kan was validated by the results of the PIV measurements performed in this study. Figure 13 compares the flow velocity distributions at the entrance and exit of the first bend (z = 40 D, 42.4 D) and the entrance and exit of the second bend (z = 47.4 D, 49.7 D). Error bars indicate uncertainties in PIV measurement. The velocity distributions are normalized by the cross-sectional mean velocity wca. The CFD simulation reproduces the flow behavior at the inside of a higher flow velocity at the inlet and lower flow velocity at the outlet inside on the first bend. In addition, at the second bend, the increase in the flow velocity at the inside of the inlet and the flattening of the distribution at the outlet are reproduced. The slight quantitative disagreement is attributed to uncertainties in the PIV measurement and simulation model.
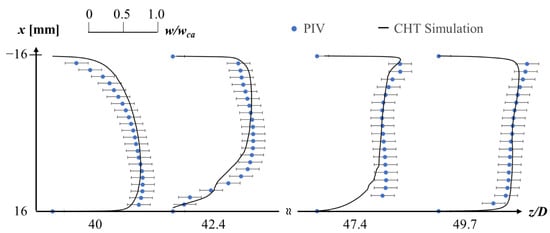
Figure 13.
Comparison of axial velocity distributions in PIV and CHT simulations.
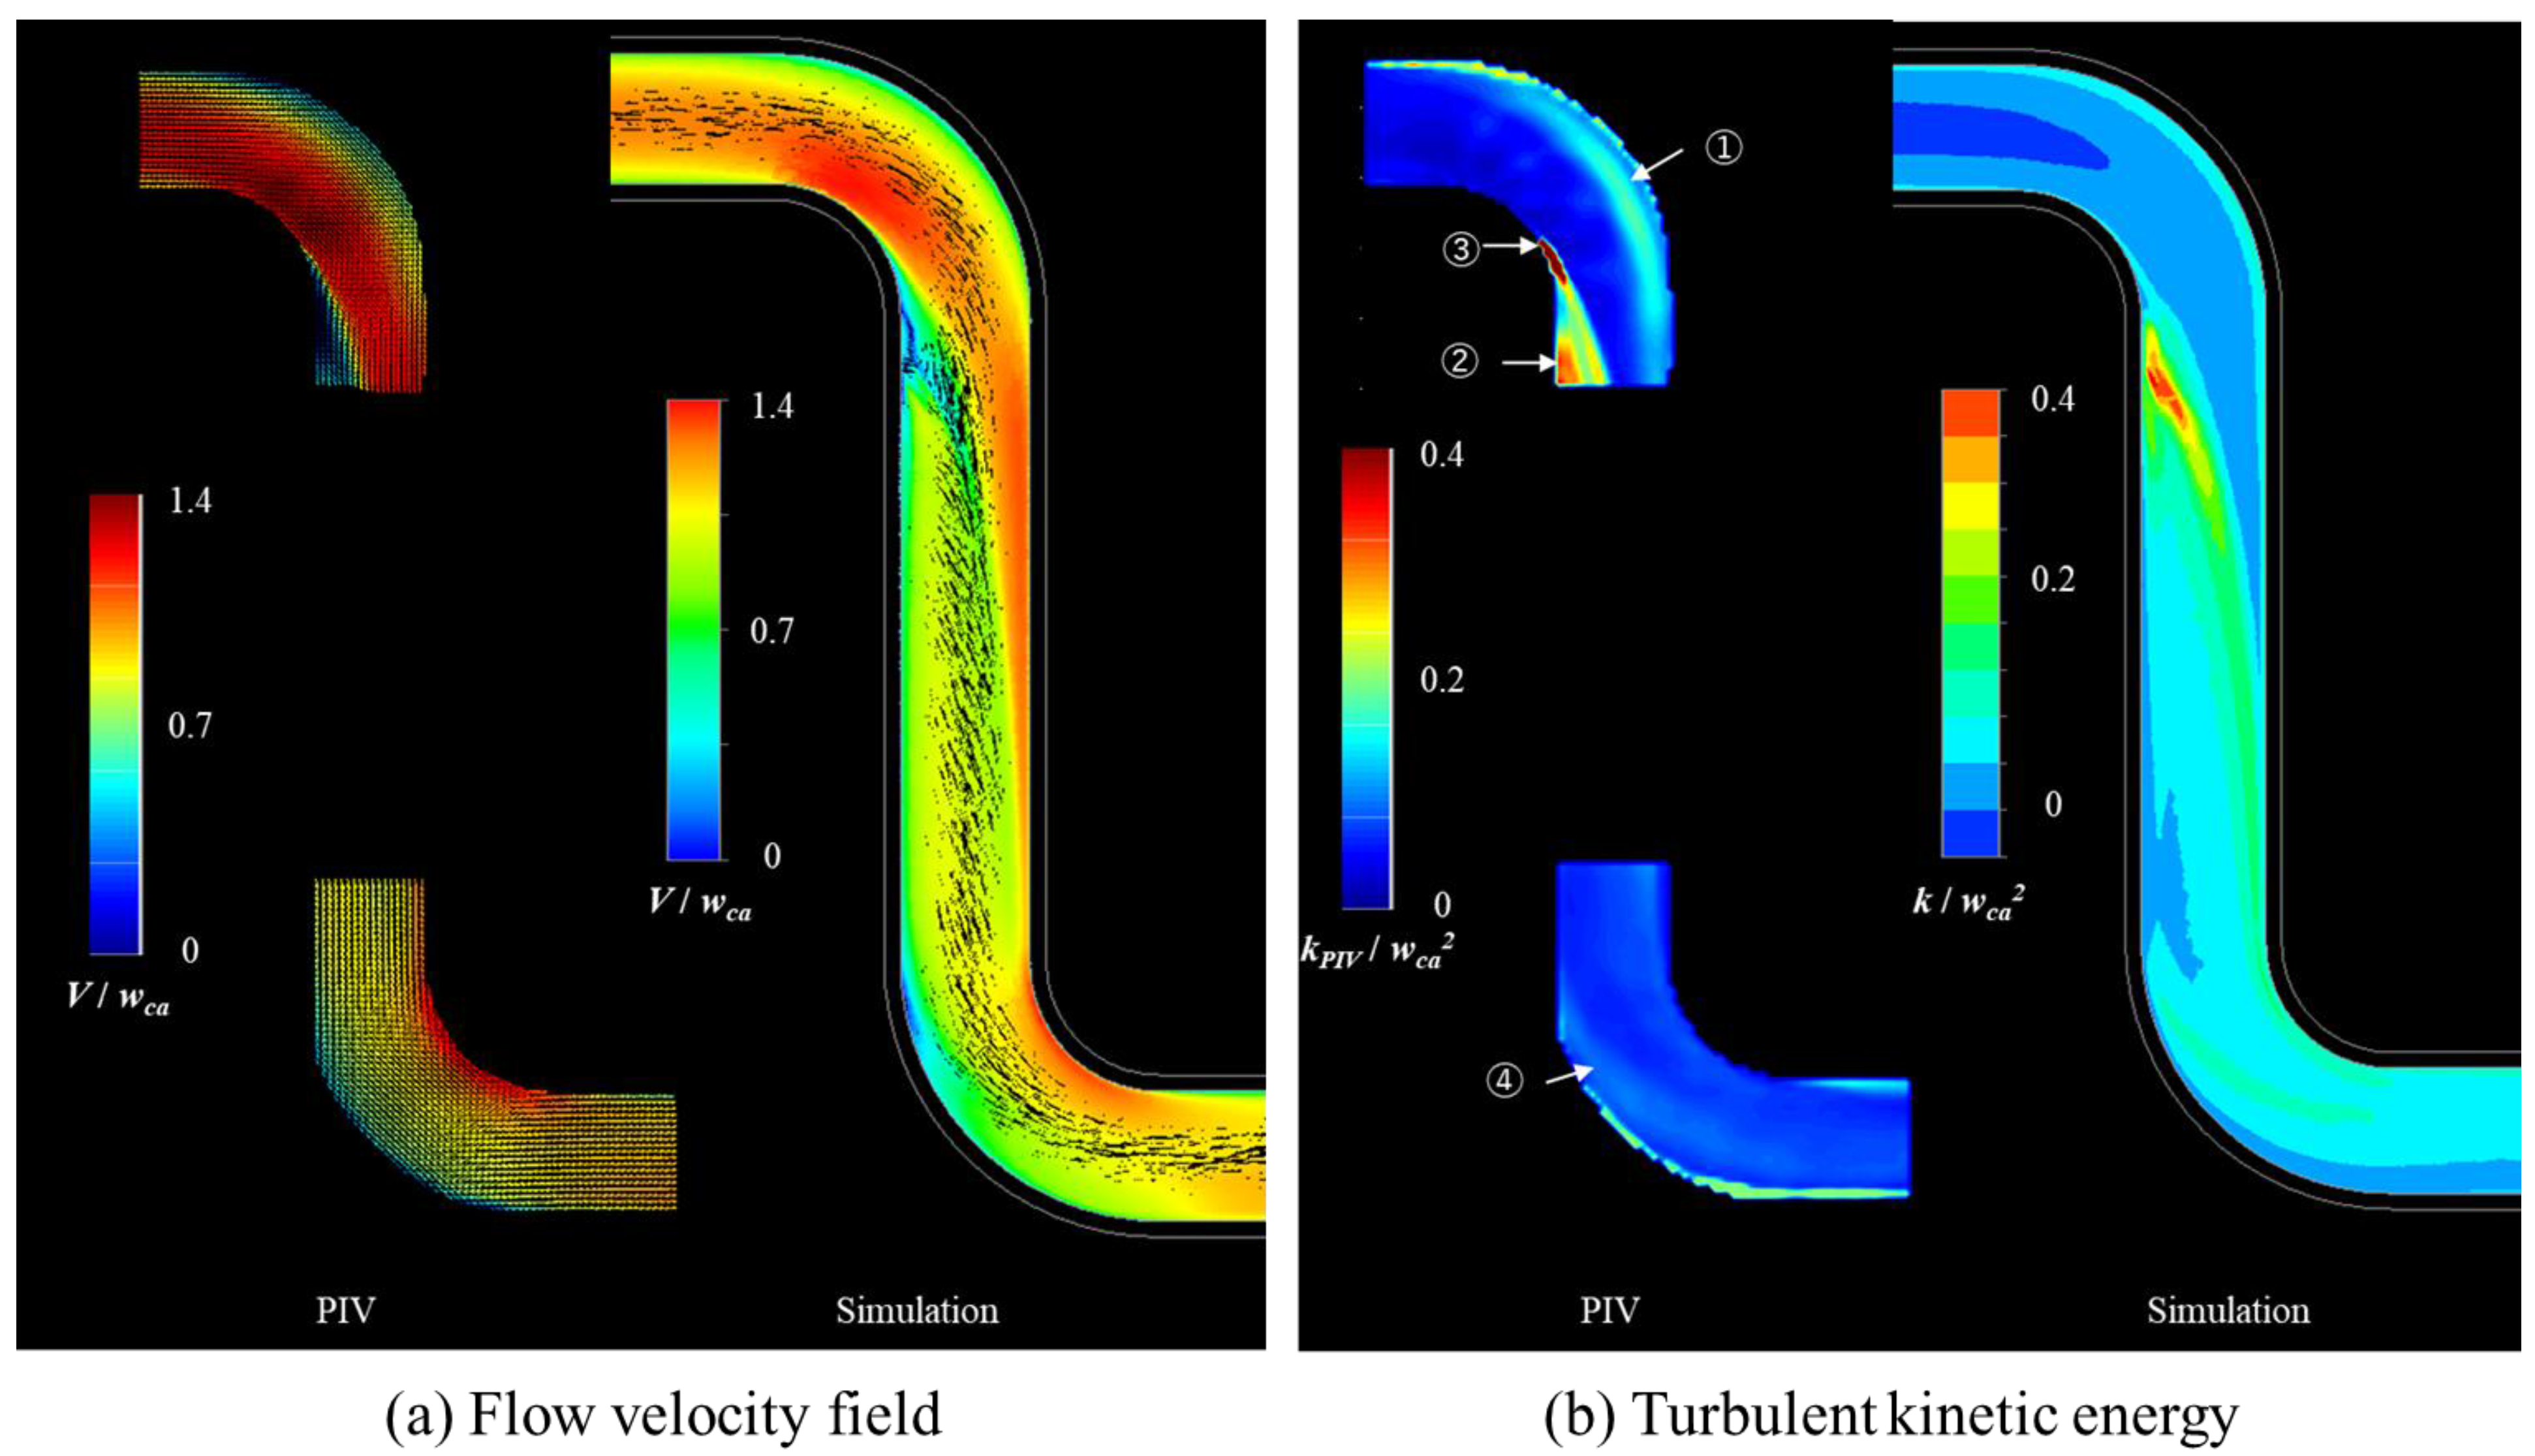
Figure 14a presents vectors of the average velocity and colored contour of its magnitude normalized with inlet bulk speed for validation of the flow field at the bend. The overall flow direction of CHT simulation is in good agreement with PIV, and the simulation thus qualitatively reproduces the characteristics of the global flow field. In addition, the rapid increases in flow velocity at the first and second bends and the decrease in flow velocity on the outsides of the first and second bends are well reproduced. It is thus considered that the direction of the flow field and the magnitude of the velocity are approximately reproduced in the numerical simulations. Next, the turbulent kinetic energies were calculated and compared, as shown in Figure 14b. It is seen that the increase in the turbulent kinetic energy on the outside of the first bend (①) and on the inside of the bend after the bend exit (②) are well reproduced. The increase in the turbulent kinetic energy in the inner region before the bend exit (③) is not reproduced in the steady-state Reynolds-averaged Navier–Stokes equation simulation because of the irregular flow separation observed in this region by PIV. At the second bend, the increase in turbulent kinetic energy on the outside of the bend (④) is reproduced. Overall, the turbulent kinetic energy in the simulation is slightly higher than the PIV value. This is because only the two-dimensional turbulent kinetic energy kPIV given by Equation (15) was calculated experimentally. It is thus confirmed that the turbulent kinetic energy can be reproduced by CFD simulation, except for the unsteady behavior of the flow separation on the inside of the bend (③).
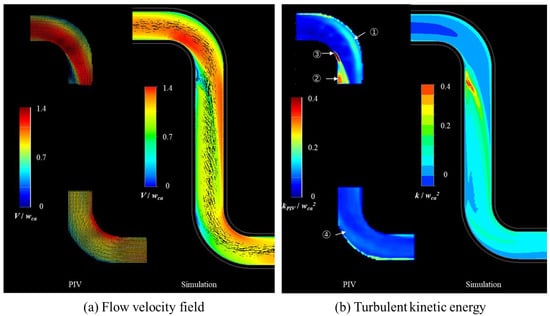
Figure 14.
Comparison of PIV and CHT simulations.
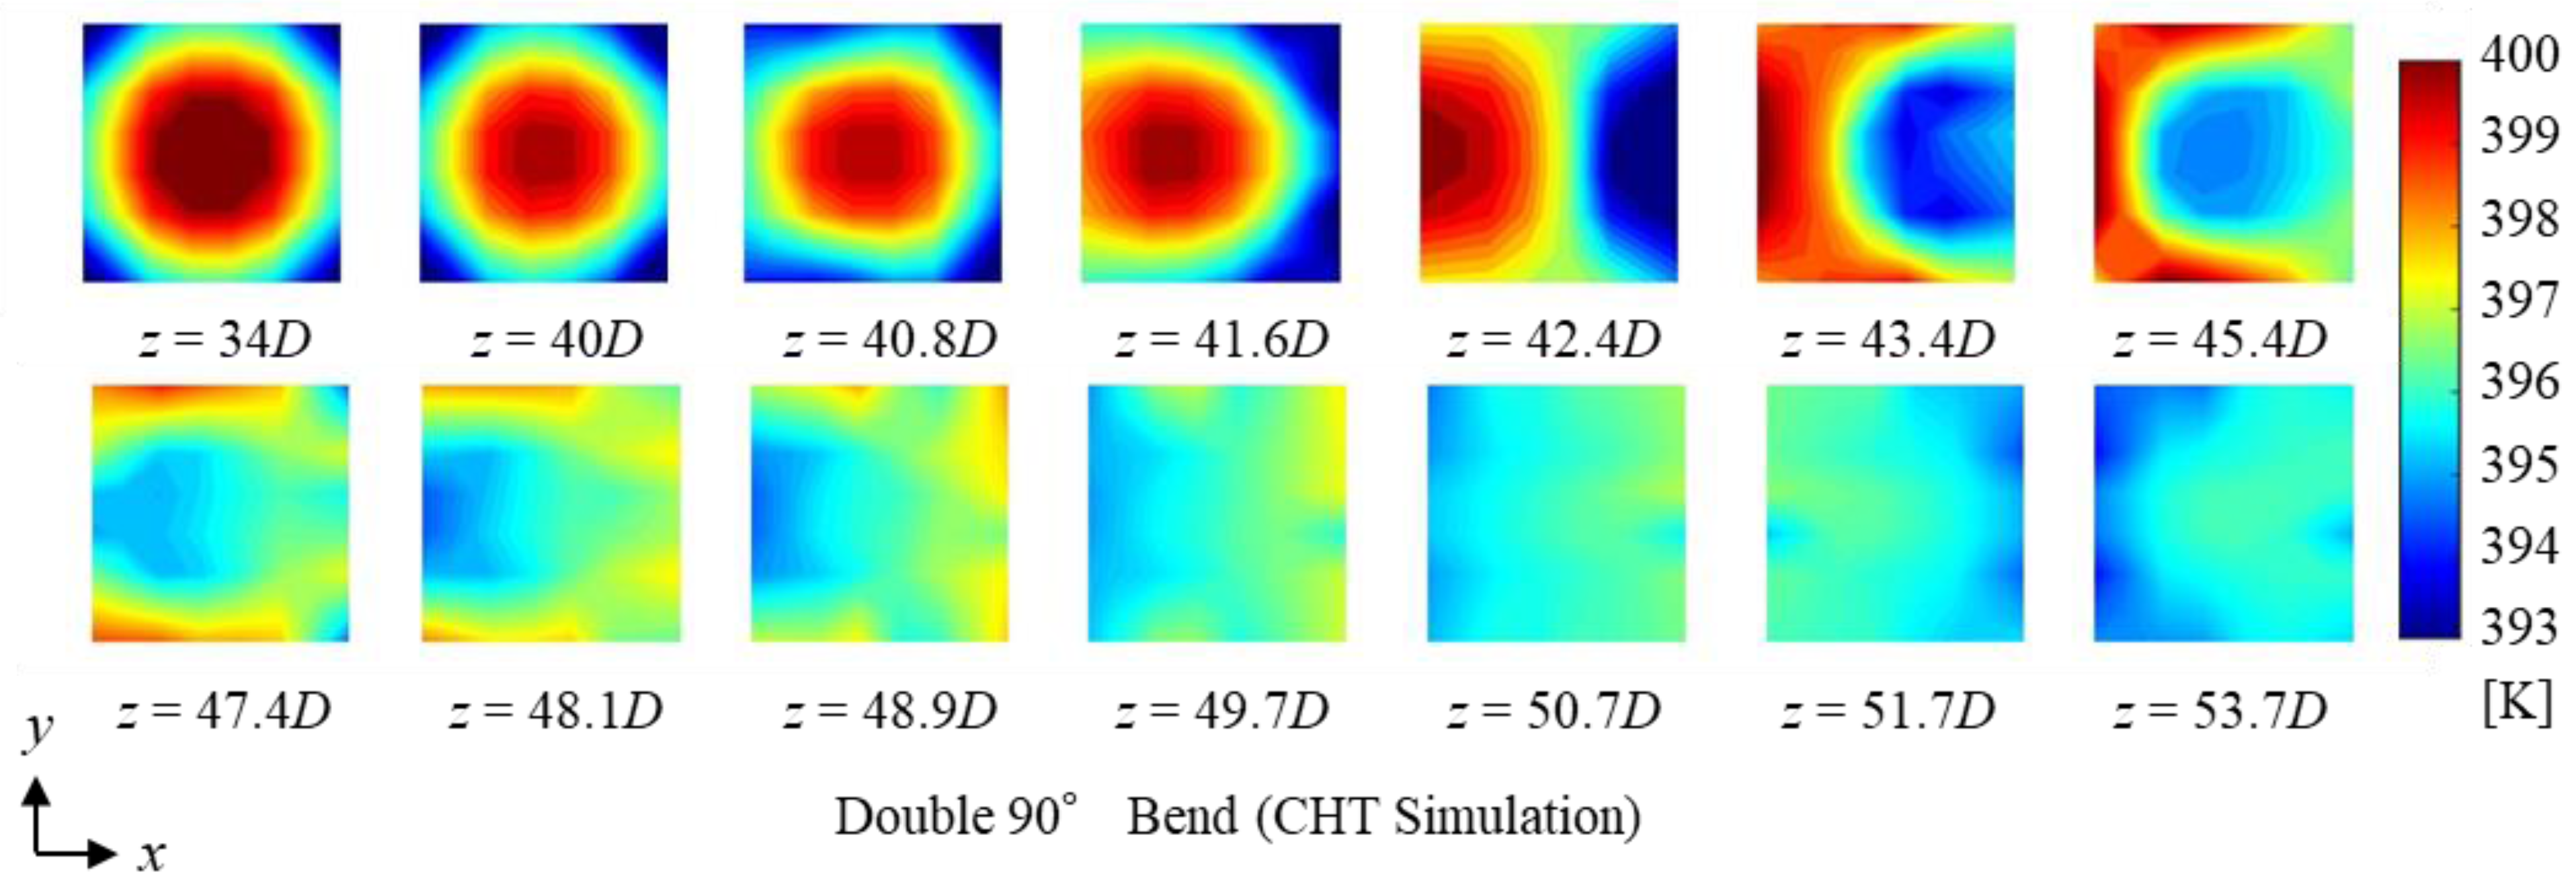
Figure 15 is a plot of the cross-sectional temperature distribution derived from 36 = 6 × 6 data points. A comparison with the experimental data in Figure 9b reveals that the results are roughly in agreement with the experimental results, including that the high-temperature core is closer to the outside of the bend in the regions behind the first and second bends (z = 43.4 D, 53.7 D) and the high-temperature part is divided into upper and lower sections in the region behind the first bend.
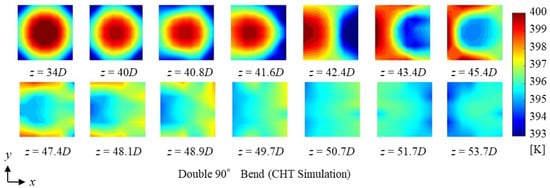
Figure 15.
Cross-sections of the circumferential temperature field in CHT simulation.
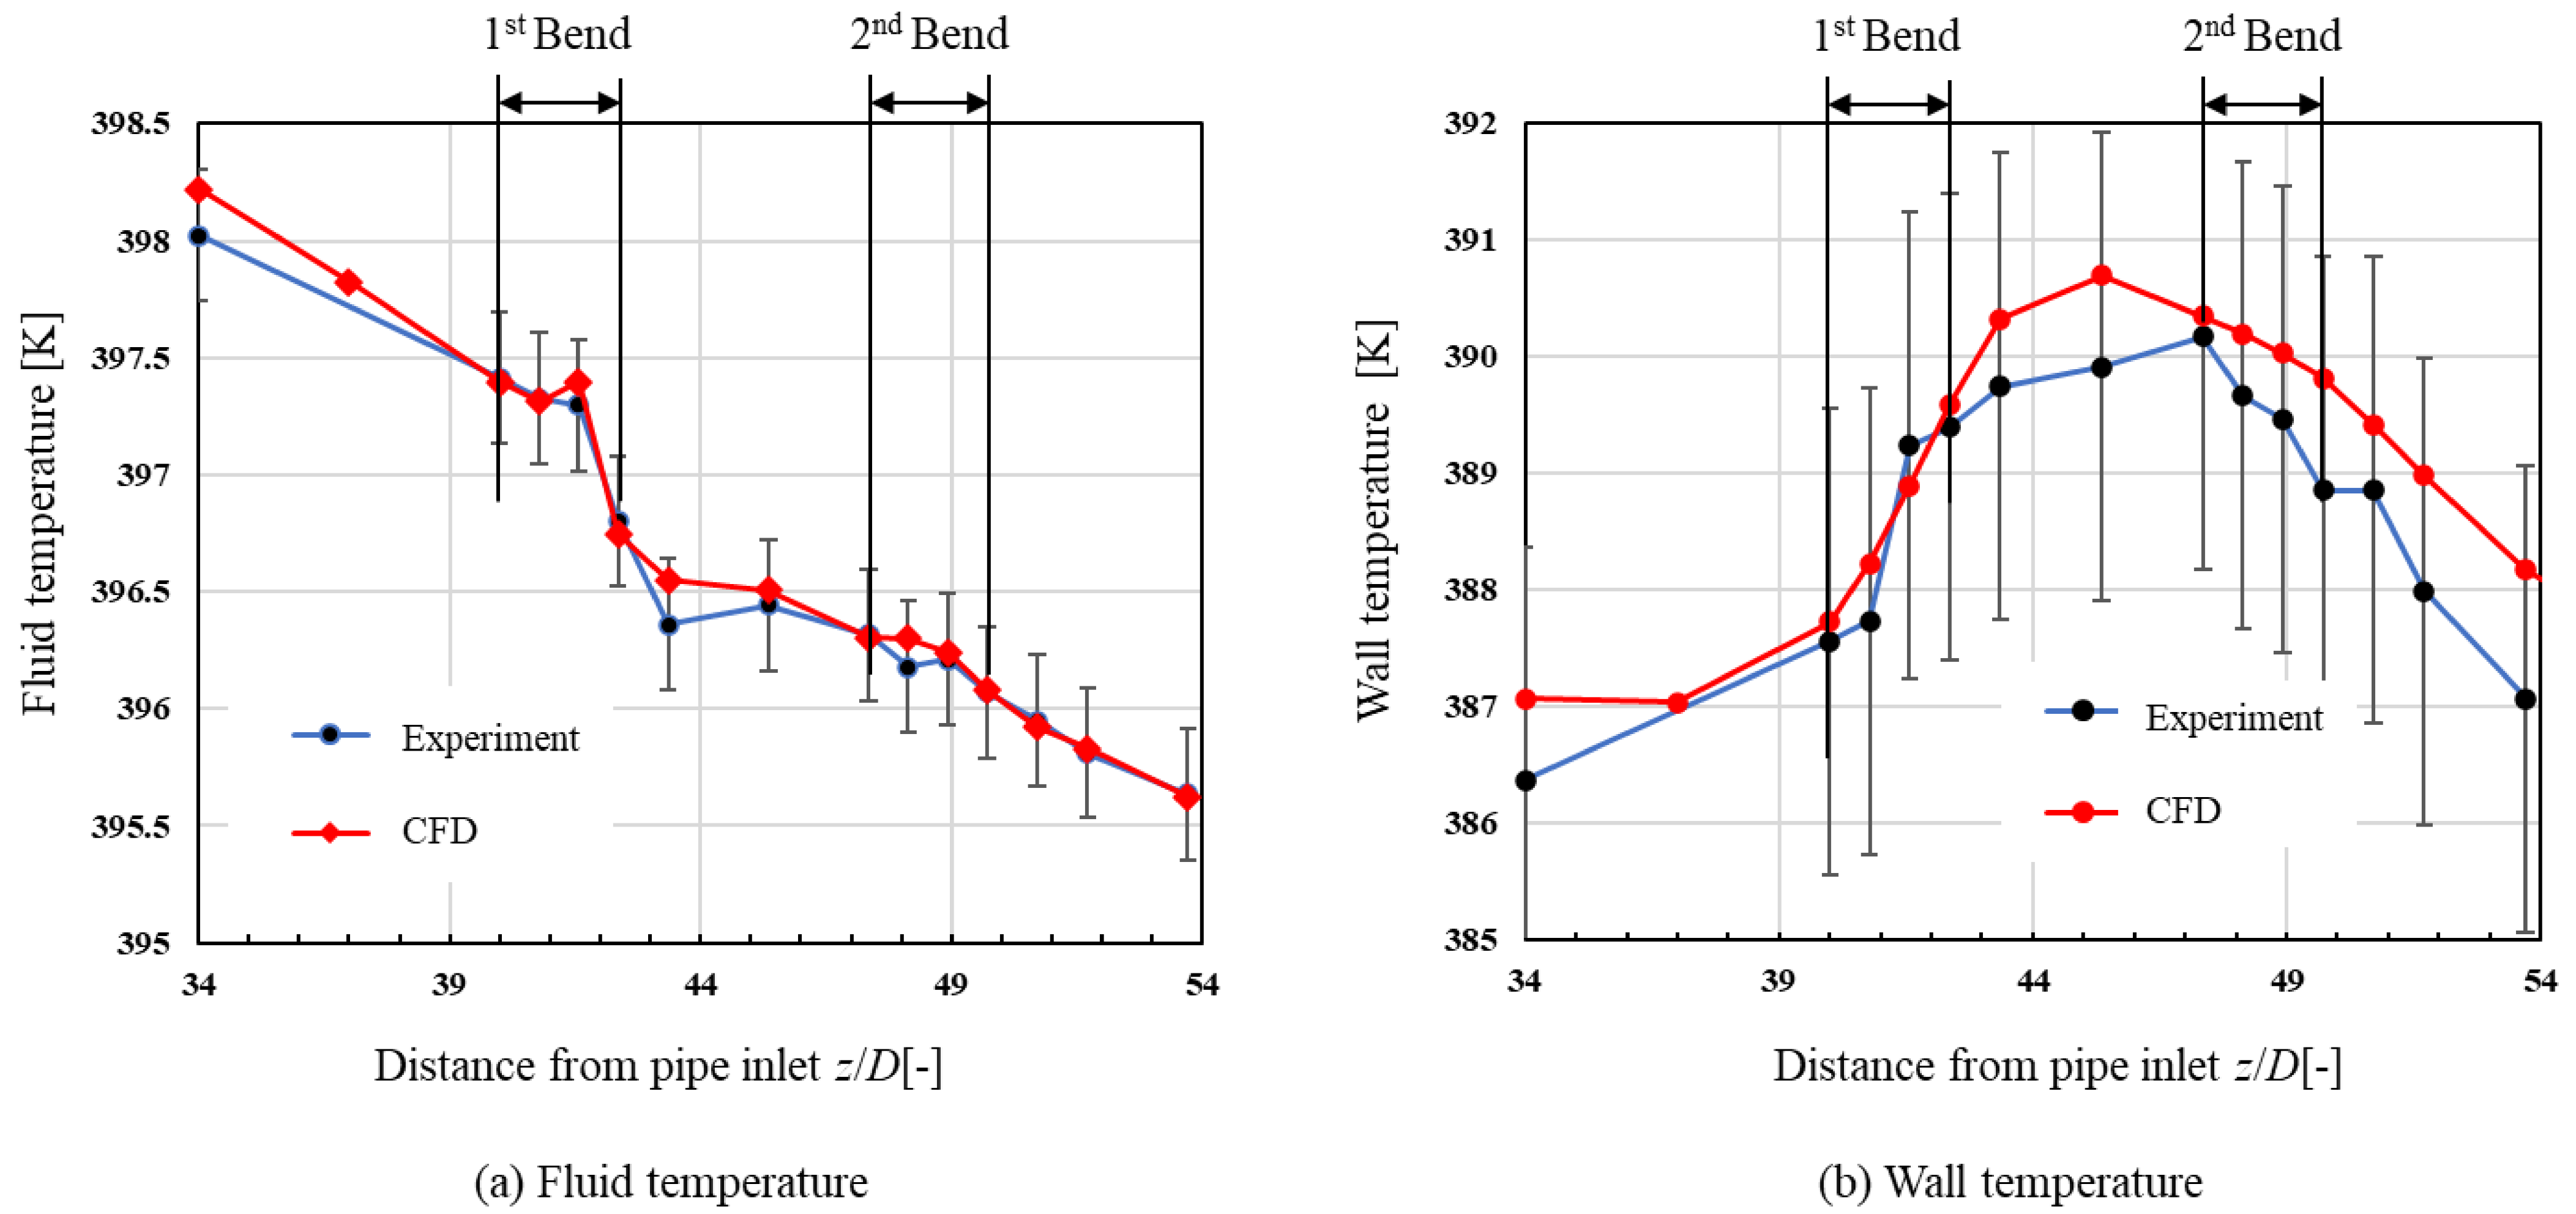
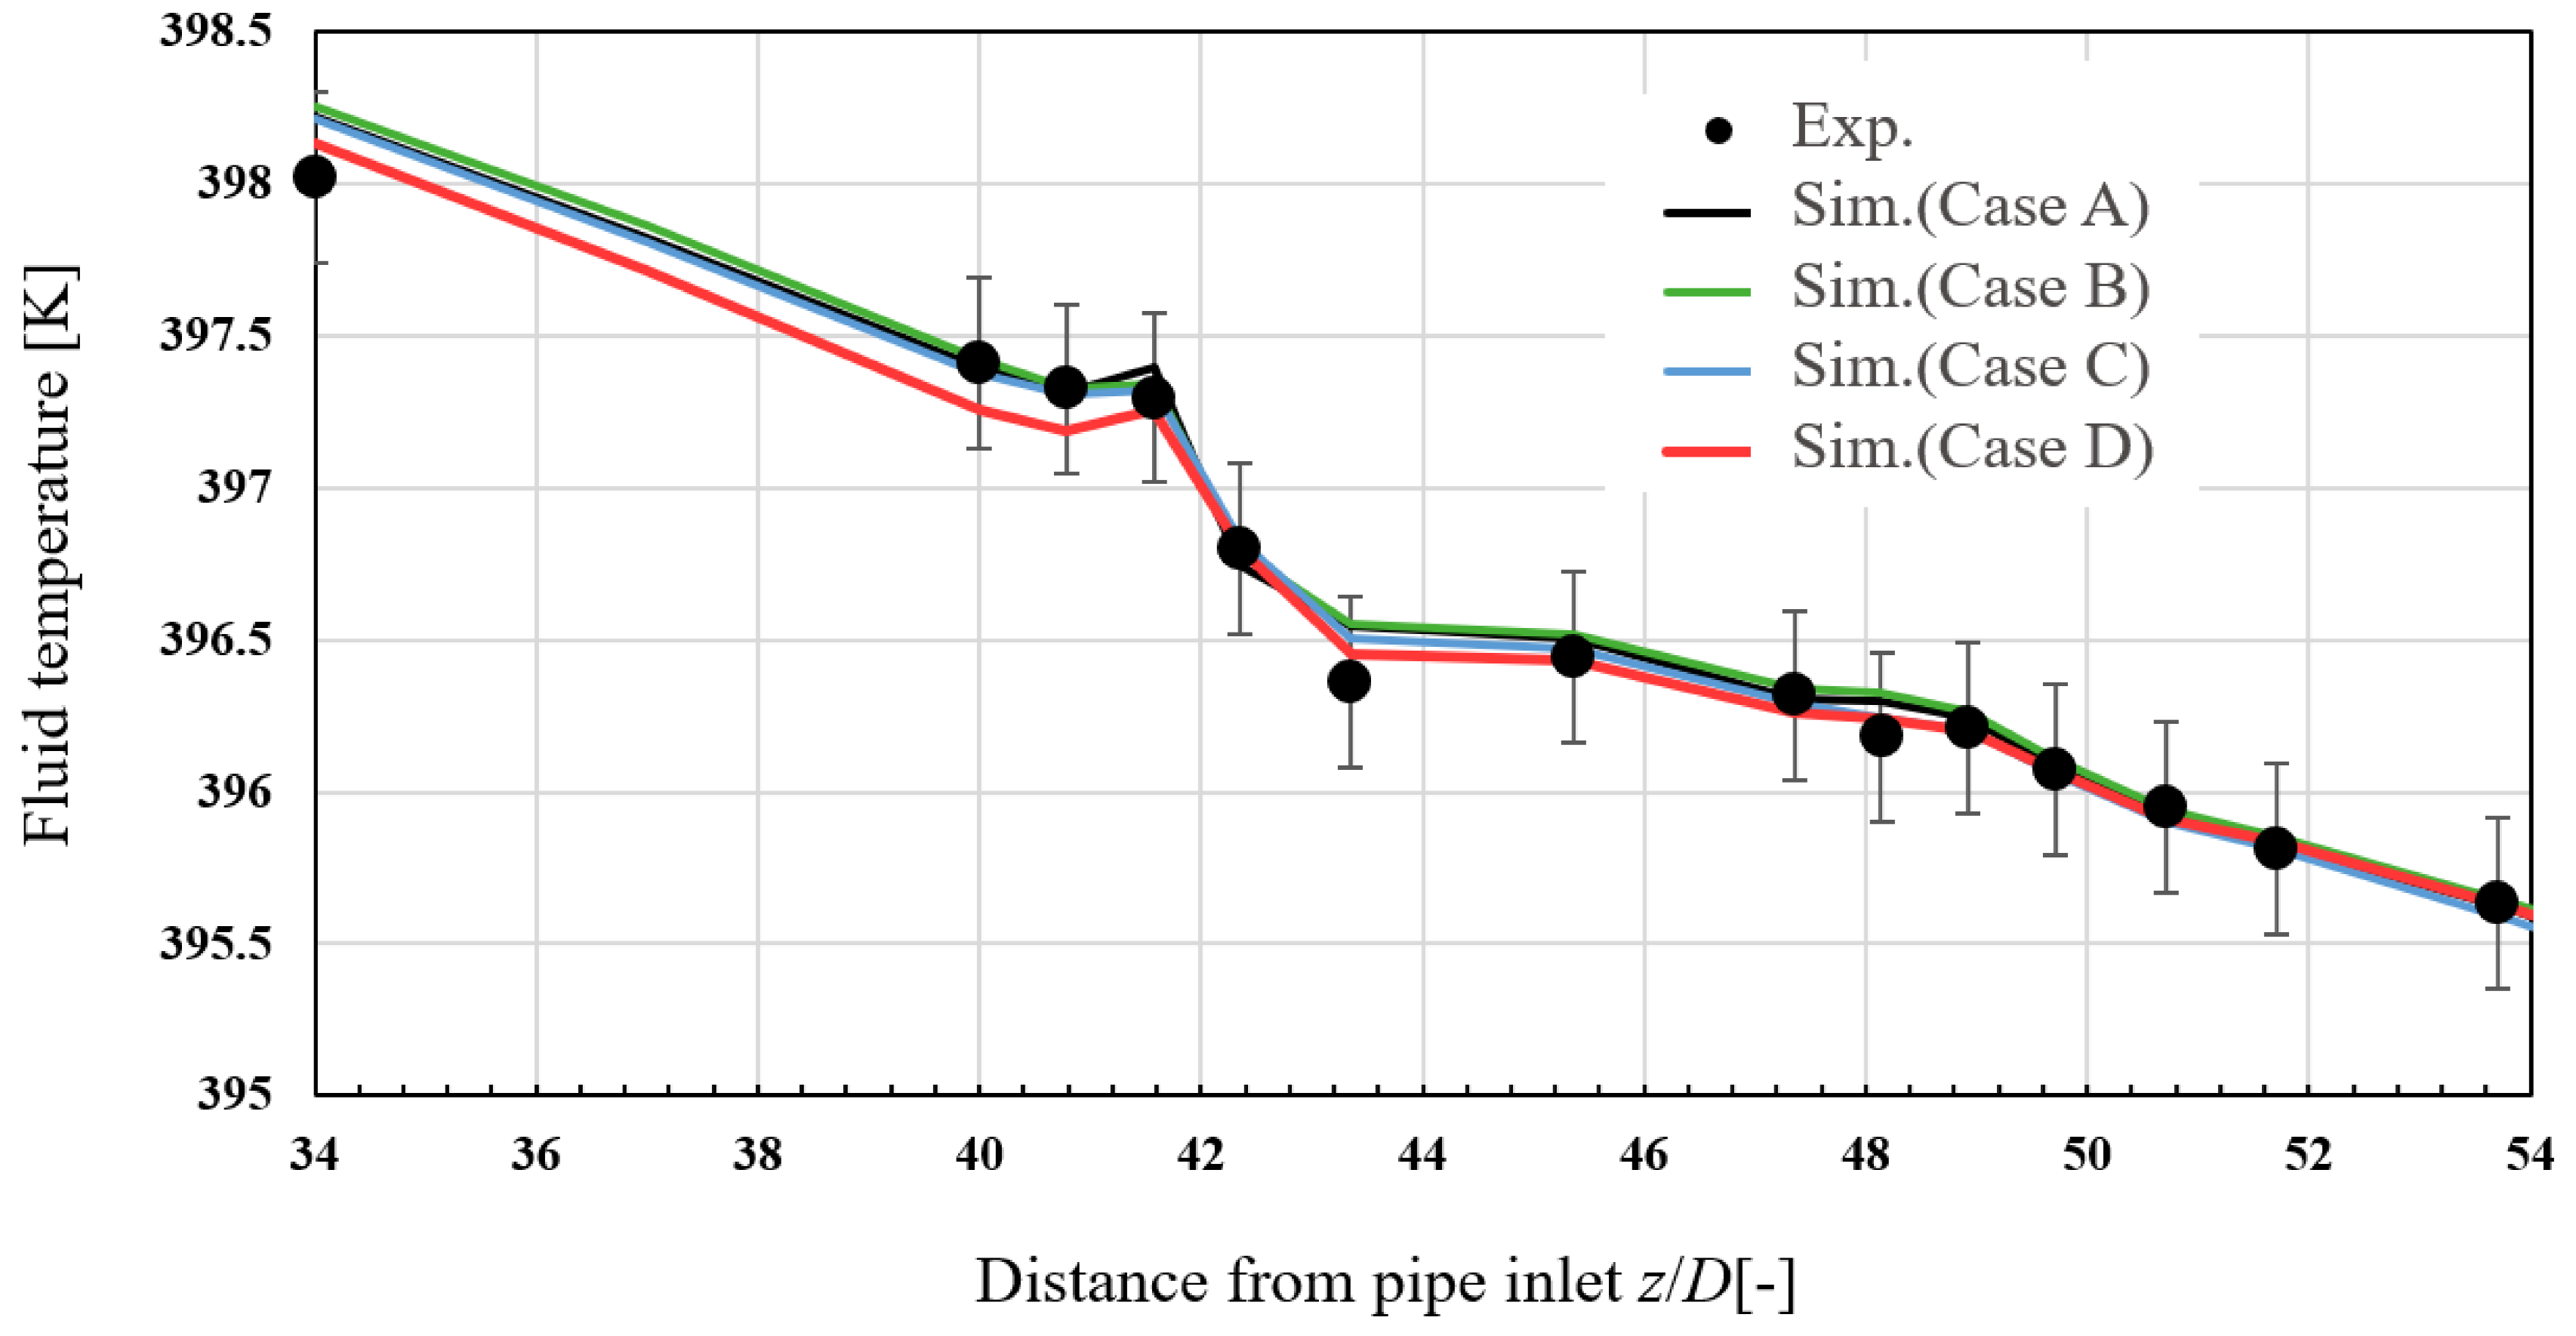
Figure 16a shows the results of verifying the axial temperature distribution using Equation (5). The simulation reproduces the qualitative characteristics of the experimental temperature distribution, such as the sudden drop in temperature at the first bend. In addition, as the simulation results fall within the range of the experimental error bars, we consider that the temperature is reproduced quantitatively to some extent. Figure 16b compares the results of the wall temperature. In the simulation, the wall temperature is a cross-sectional average value. The tendency for the wall temperature to increase rapidly after the first bend and the tendency for the wall temperature to decrease after the second bend are well reproduced qualitatively. The simulation results for the wall temperature fall within the range of the experimental error bars, indicating that the wall temperature can be reproduced to some extent quantitatively. A previous study [23] using a rough mesh and the k–ε model did not quantitatively reproduce the axial temperature distribution shown in Figure 16a. In the present study, by selecting an appropriate model and controlling the mesh size, we were able to quantitatively reproduce the heat transfer phenomena. CHT simulation was thus adopted to evaluate the local heat transfer characteristics and the mechanism of heat dissipation enhancement by bends in pipes.
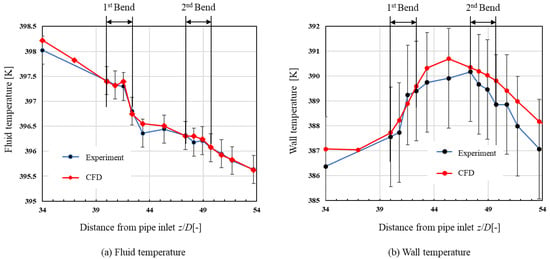
Figure 16.
Comparison of experimental results and CHT simulations.
A mesh-grid independence study was performed under the conditions shown in Table 4. Since a layered mesh was used in this simulation, the parameter was the mesh thickness of the first layer in addition to the size of the base mesh. The results of the simulation under each condition are shown in Figure 17. First, comparing cases A, B, and D, there was a slight difference in axial temperature between case A and case D, but almost no difference between case A and case B. Therefore, a base mesh size of 1 mm was set. Next, if we compare the results of Case A and Case C by varying the thickness of the first layer of the mesh, we can see that there is almost no difference. Also, as shown in Figure 8, the simulations in Case A were able to simulate the velocity distribution in the logarithmic region and the boundary layer. Therefore, the thickness of the first layer was determined to have converged to 0.06 mm, and Case A was set as the mesh in this study.

Table 4.
Mesh grid settings in mesh-grid independence study.
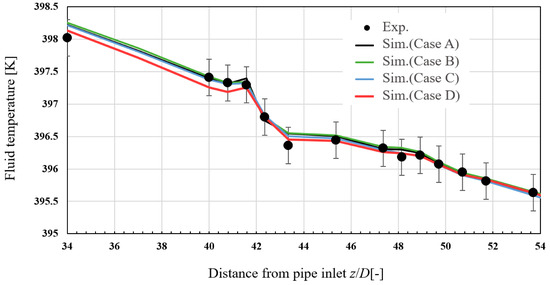
Figure 17.
The results of mesh-grid independence study for axial temperature distribution.
3.2.2. Evaluation of Heat Transfer Characteristics
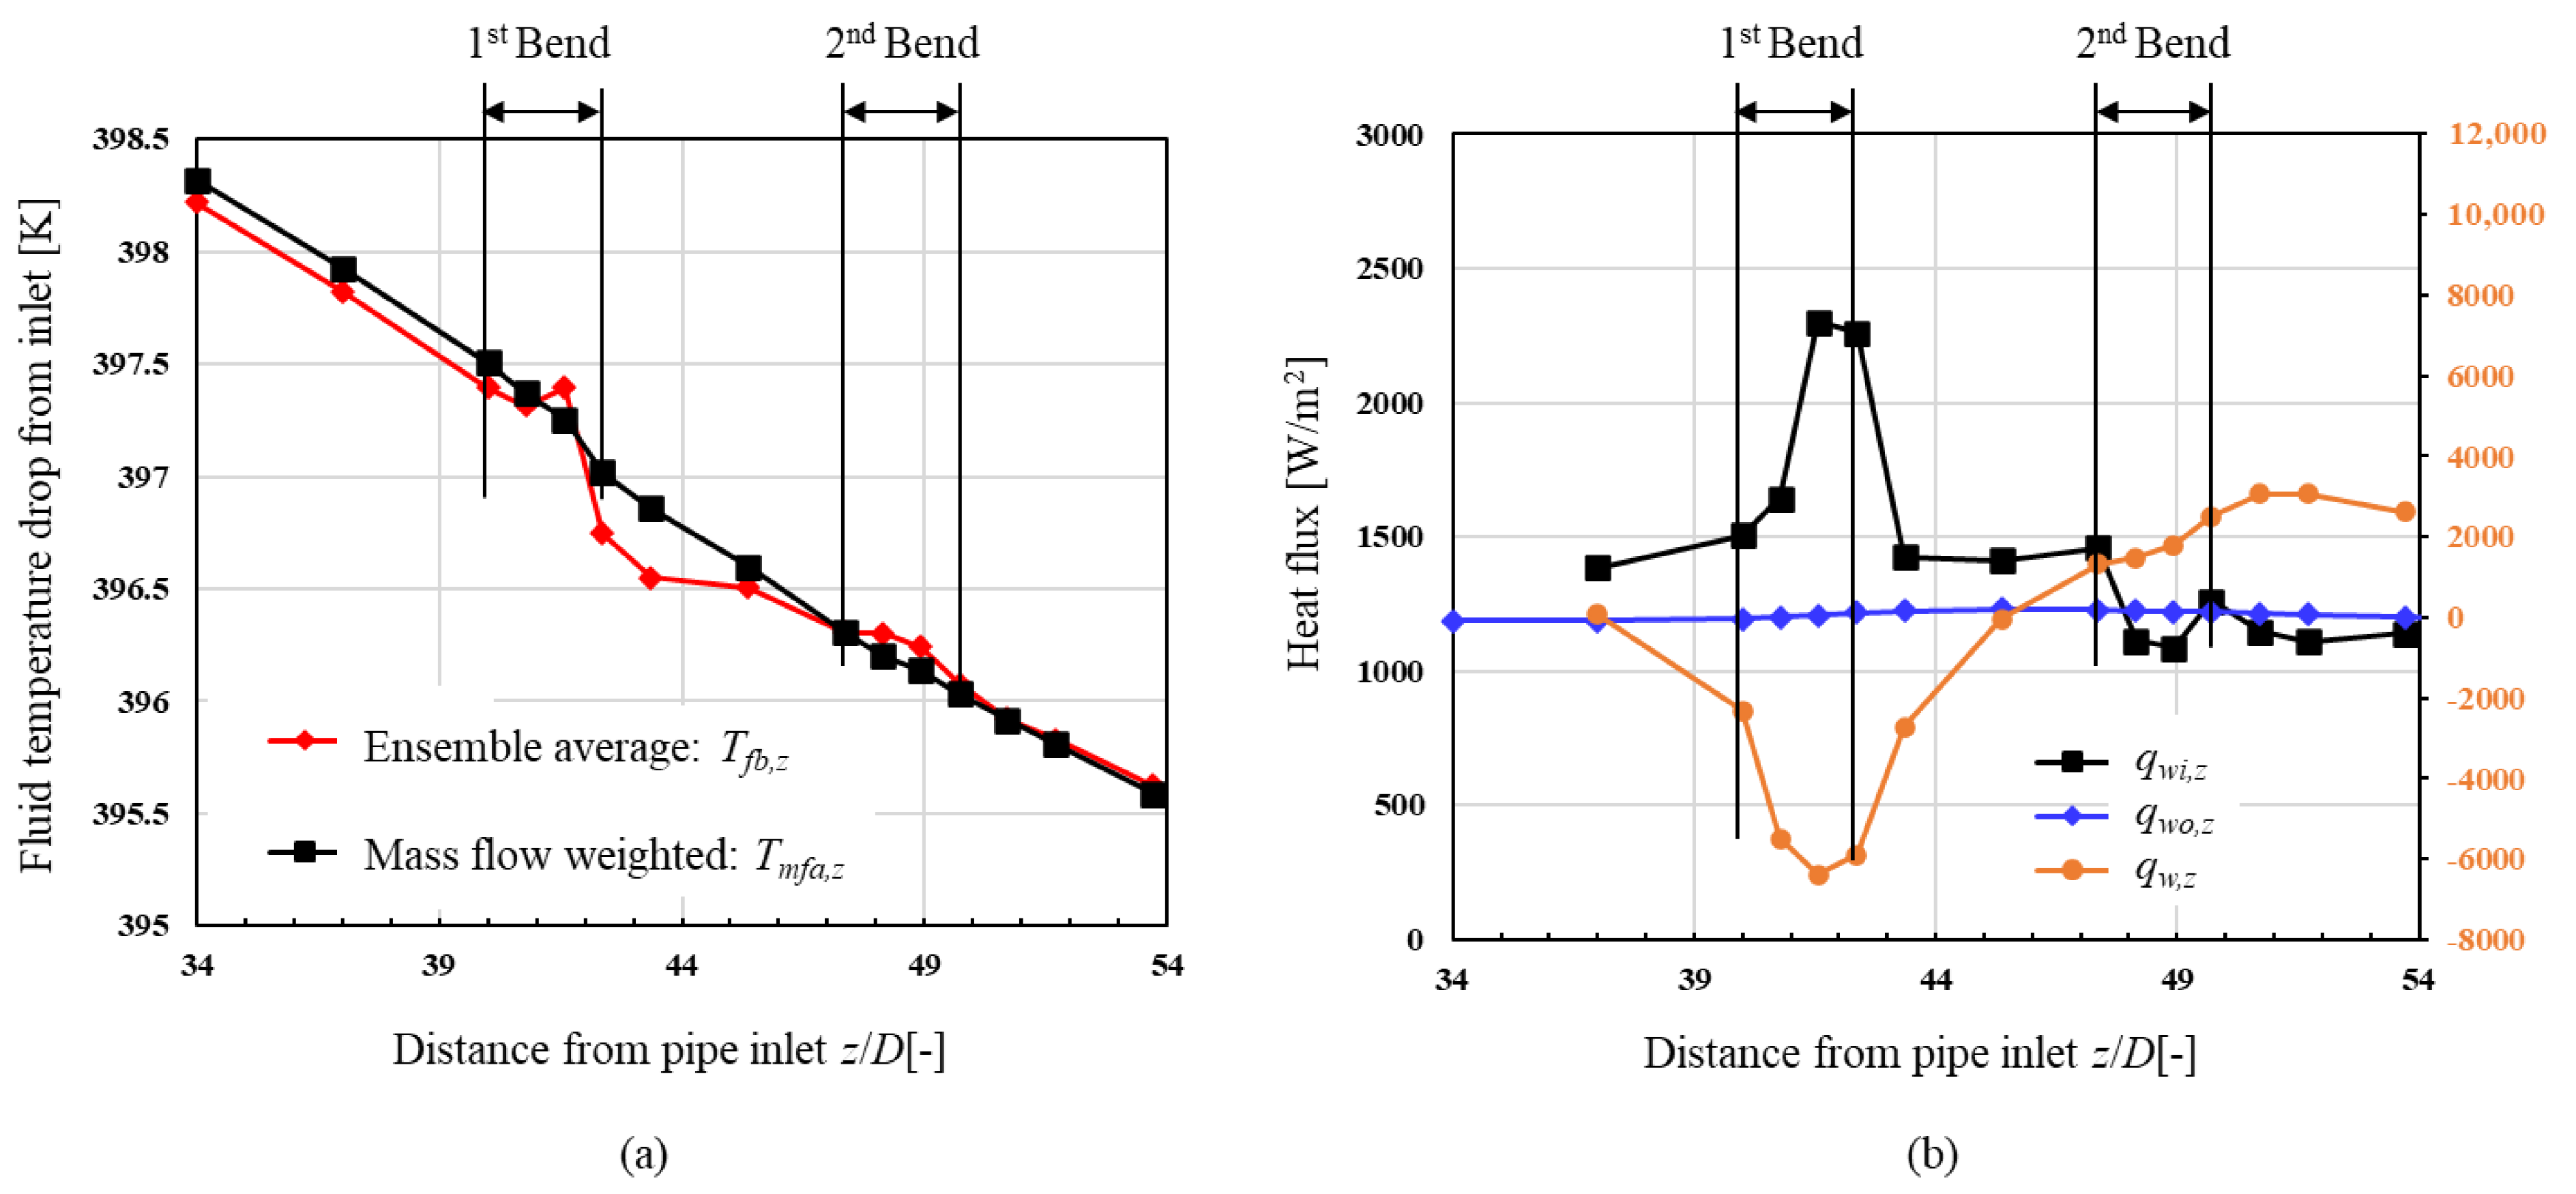
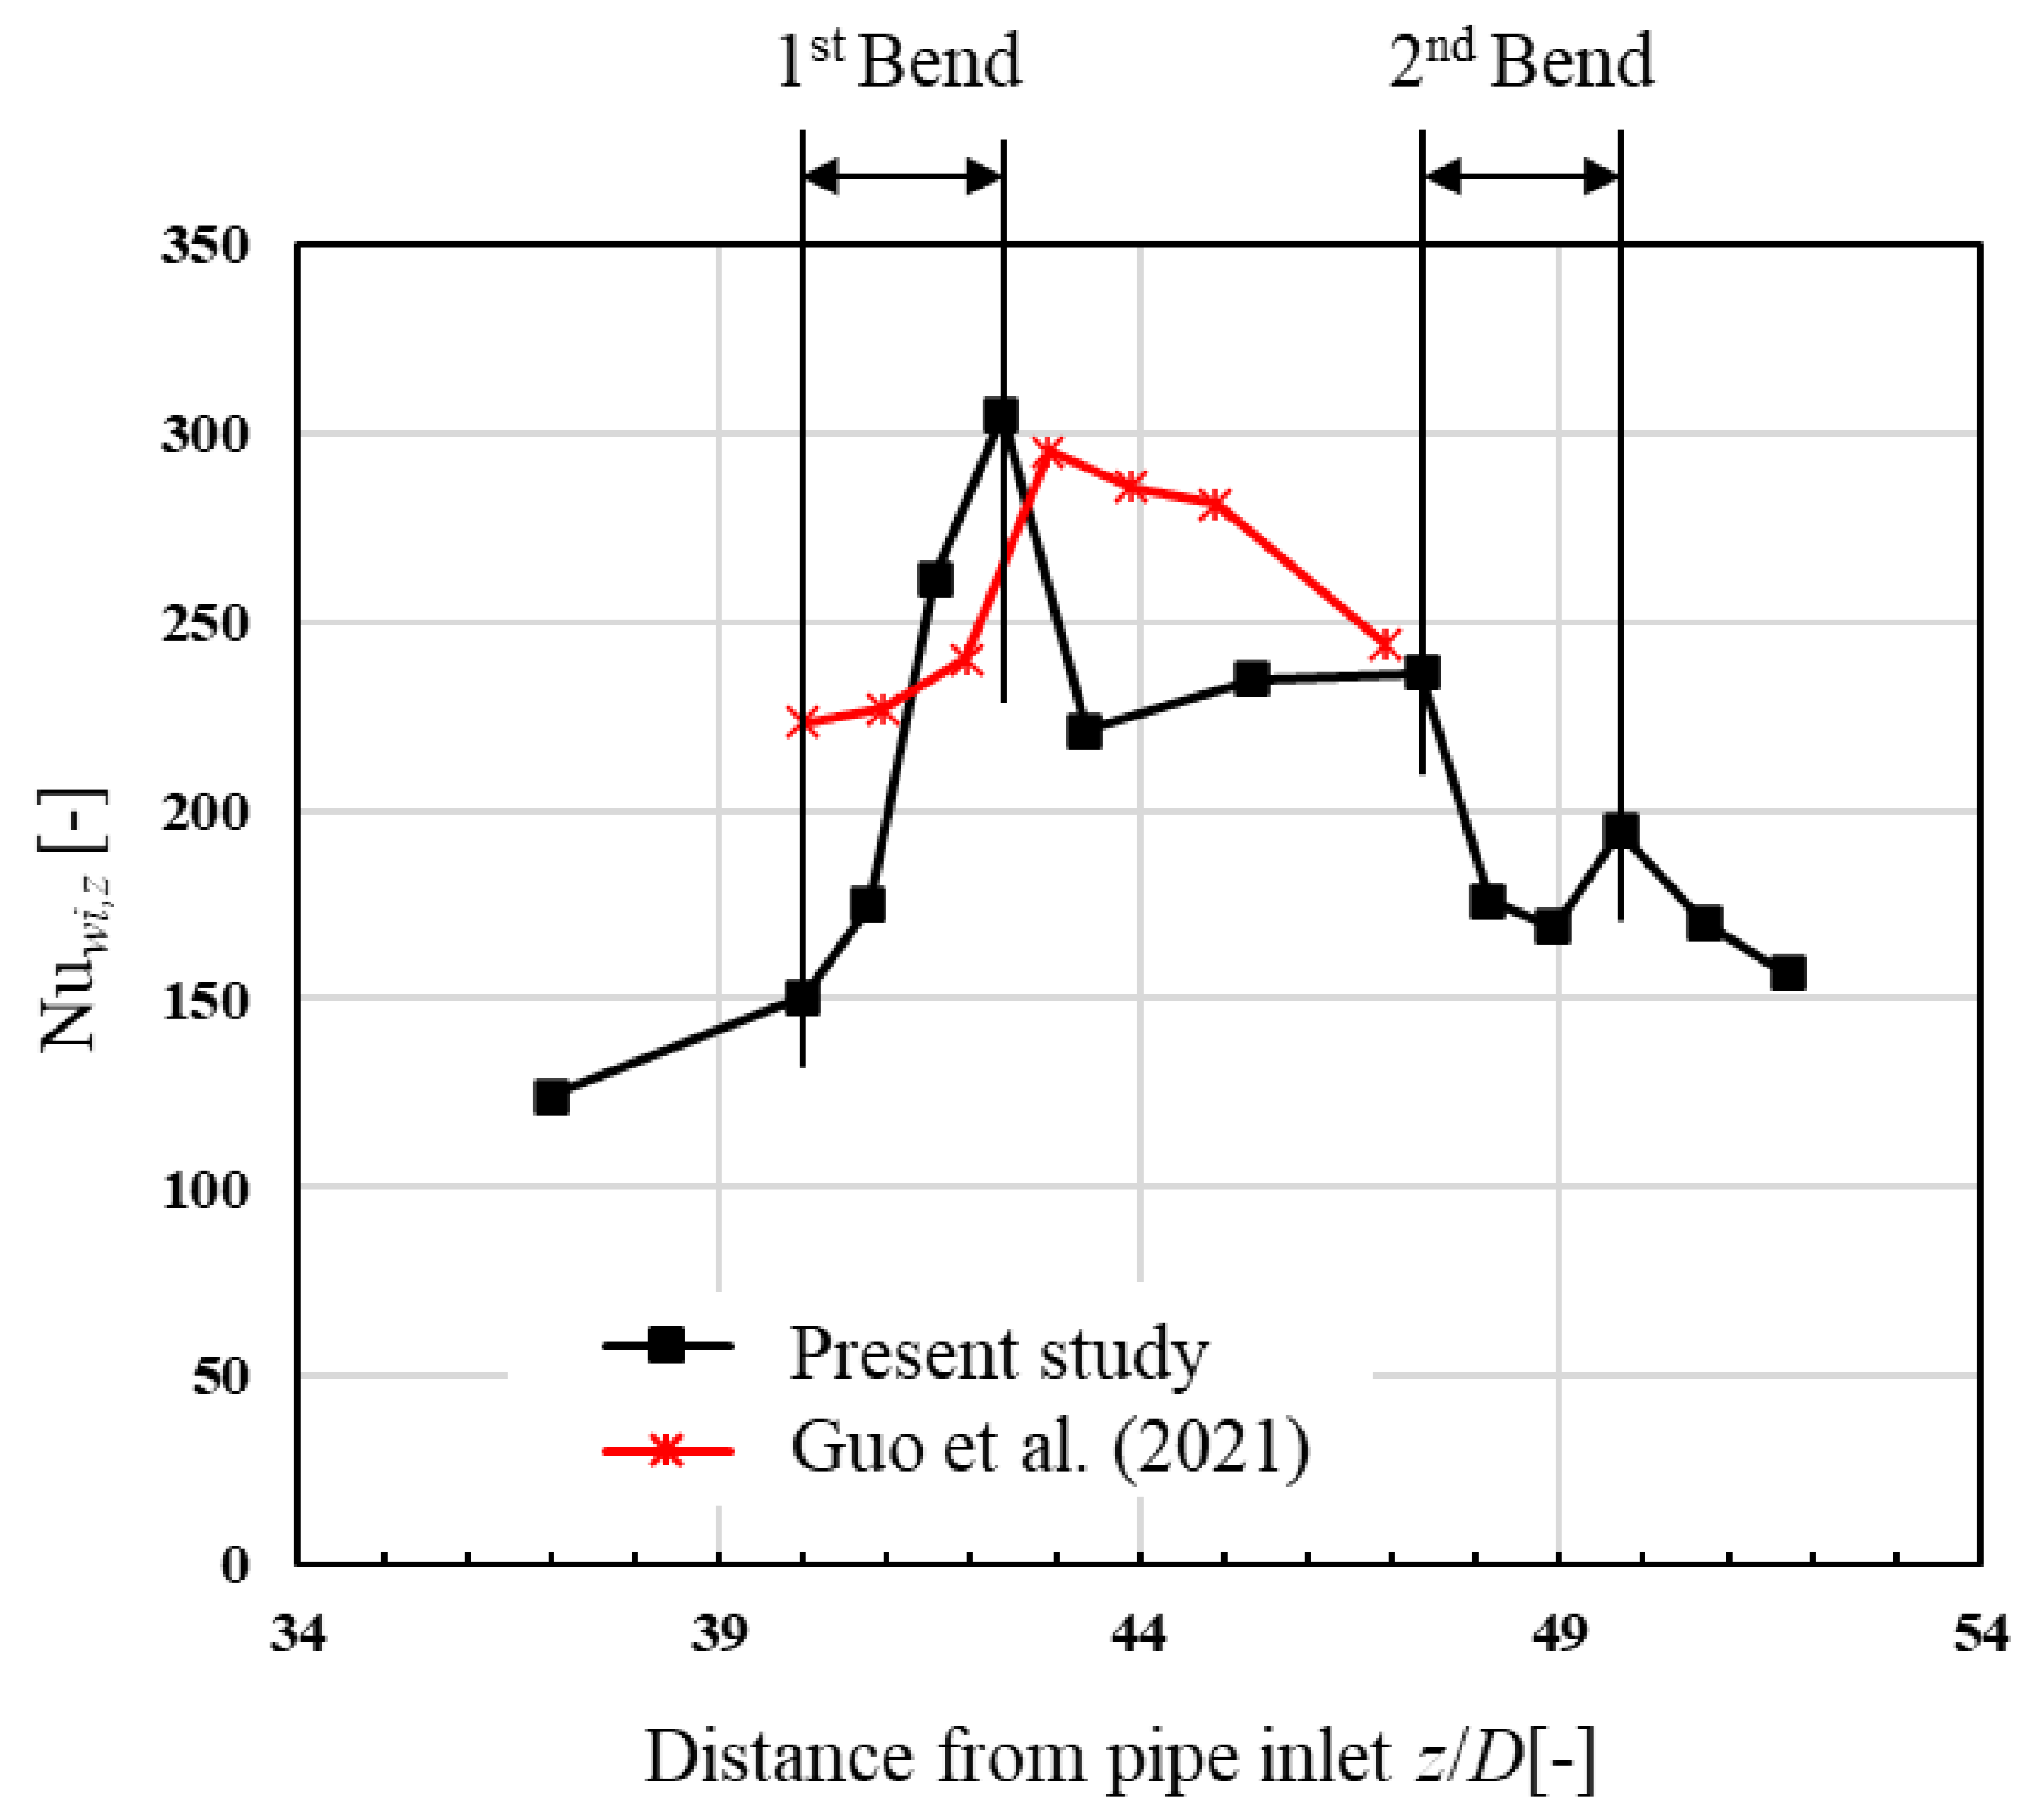
As the velocity, temperature, and density of the entire region of investigation can be evaluated numerically, the flow-weighted average temperature expressed in Equation (9) was obtained instead of the arithmetic mean of 36 points to obtain the fluid temperature. Figure 18a shows the flow-weighted average axial temperature distribution. The arithmetic mean temperature, in contrast with the flow-weighted mean temperature, underestimates the temperature at the outlet of the first bend (z = 42.4 D). This is because both the axial velocity and fluid temperature are high on the outside of the first bend outlet, and ensemble averaging underestimates the energy of the outer fluid. Therefore, to correctly evaluate the heat quantity of the fluid, it is necessary to calculate the gradient of the flow-weighted average temperature obtained using Equations (10) and (11). The heat flux qmfa_wo,z calculated using Equation (11) is shown in Figure 18b. The overall characteristics are that heat dissipation is enhanced at the first bend but not at the second bend. In addition, the heat flux in the heat dissipation from the external wall to the ambient fluid qwo,z and the axial heat flux inside the pipe qw,z are shown side by side. As mentioned earlier, the axial variation in the wall temperature is small, less than 4 K, such that the dissipation of heat to the ambient fluid qwo,z is nearly constant. Therefore, as shown in qwi,z and qw,z in Figure 18b, heat dissipation is enhanced at the first bend, and much of the heat transferred from the internal fluid to the pipe is expected to move axially through the pipe interior. The axial distribution of the local Nusselt number calculated by Equation (7) is shown in Figure 19. Similar to the heat flux, the local Nusselt number also increases from the middle to the end of the first bend, indicating that heat transfer enhancement occurs. From the middle of the second bend, the local Nu number decreases significantly, indicating that the heat transfer enhancement is not significant. Figure 19 also shows the experimental results of Guo et al. [23], who evaluated the heat transfer characteristics of a single-bend pipe under the same flow conditions. In the experiment of Guo et al., the local Nusselt number also increased in the middle of the first bend, a trend that is consistent with the simulation in the present study. There is a slight difference in the position and distribution of the peaks, but this is probably because the evaluation by Guo et al. is an experimental evaluation, and the amount of heat dissipated to the outside is set based on the heat transfer from the outer wall (ho = 14 W/m2 K, which is larger than in this study because it is a flanged pipe), and the axial heat flux inside the pipe qw,z is ignored.
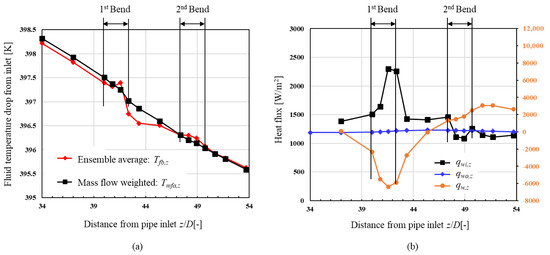
Figure 18.
Axial characteristics of heat transfer in CHT simulation: (a) fluid temperature and (b) local heat flux.
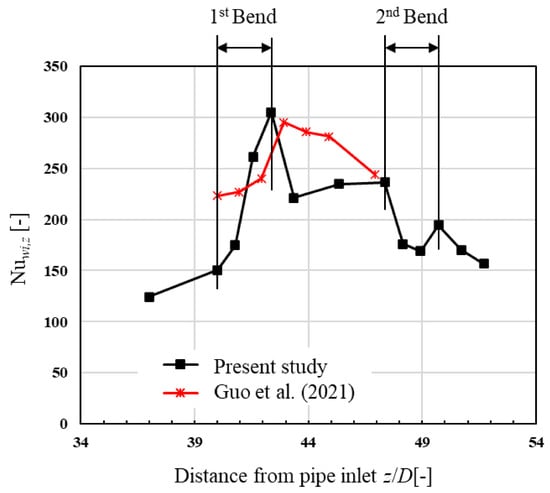
Figure 19.
Axial distribution of local Nusselt number [23].
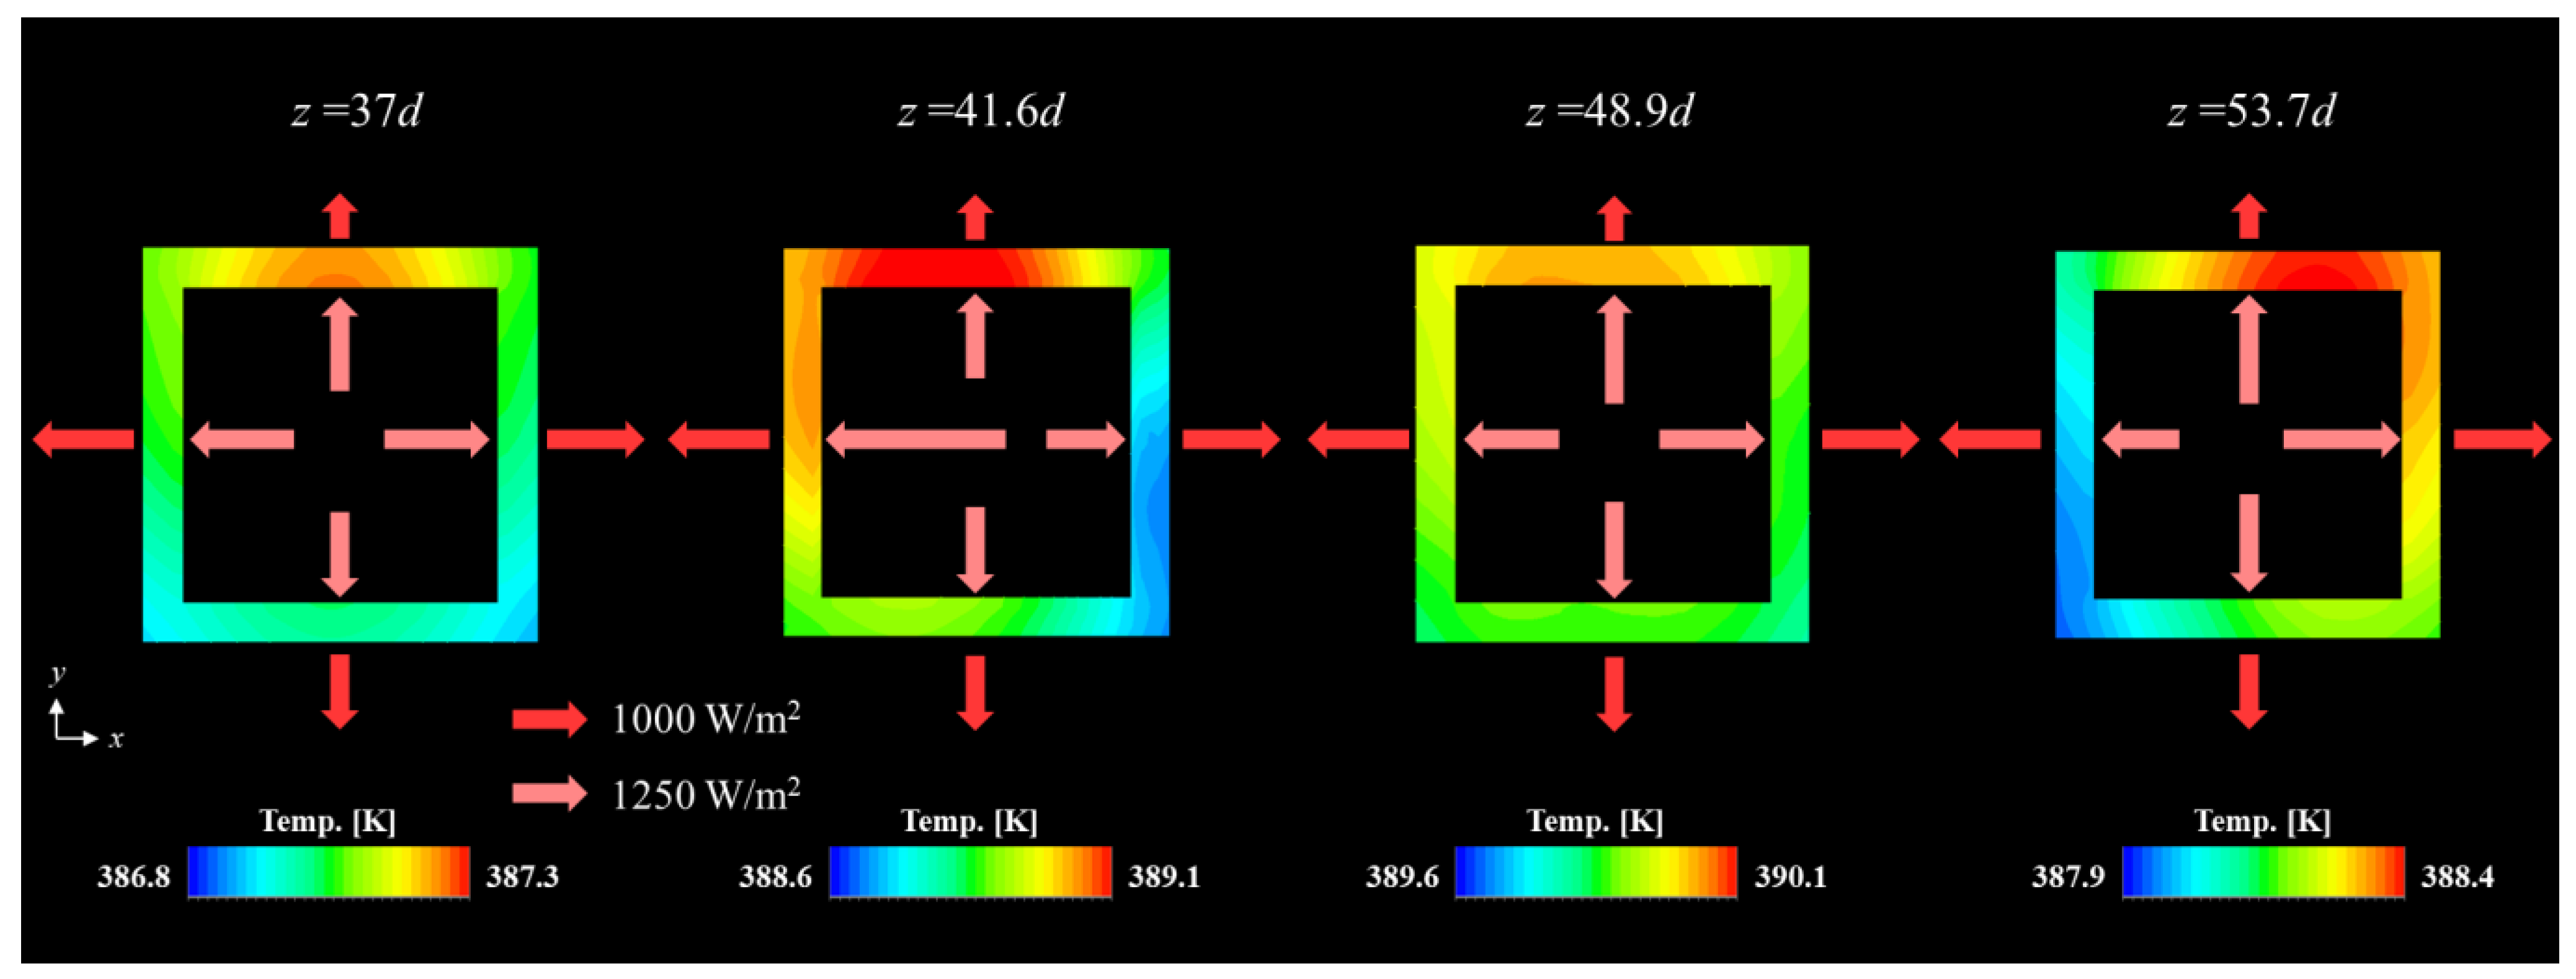
In order to investigate the energy flow in more detail, the wall heat flux inside and outside the pipe and the wall temperature distribution in the cross section were evaluated. The results are shown in Figure 20. Here, the length of the vector indicates the magnitude of the average wall heat flux in each direction. Since the surface areas of the inner and outer walls differ by a factor of Do/D (1.25), the standard length of the heat flux on the interior wall is displayed as 1.25 times the heat flux on the outer wall. This provides an intuitive understanding of the amount of heat transferred. The figure shows values at the straight section (z = 37 D), the middle of the first bend (z = 41.6 D), the middle of the second bend (z = 48.9 D), and the straight section behind the second bend (z = 53.7 D). The results for the straight pipe section before the bend (z = 37 D) show that the outer wall heat flux is smaller at the top, while the inner wall heat flux is similar at the top, bottom, left, and right. This is due to natural convection heat transfer on the outside of the pipe due to buoyancy, which slows down the upper flow and lowers the heat transfer coefficient ho, as shown in Figure 5. On the other hand, the inner side of pipe is subject to forced convection heat transfer, and since there is almost no flow bias in the straight pipe section, the heat transfer coefficients are estimated to be the same at the top, bottom, left, and right sides. This gap between the inner and outer wall heat fluxes causes the temperature distribution within the wall surface as shown in Figure 20. Since the temperature at the top of the pipe is higher than at the bottom, heat moves from the top to the bottom of the pipe. Next, the results for the first bend (z = 41.6 D) show that the inner wall heat flux is large on the outside of the bend. This is due to the deflected flow caused by the bend. This increase in the heat flux at the outer wall of the bend causes an increase in the mean heat flux qwi,z as shown in Figure 18b. Although the total heat received by the inner wall was greater than the total heat released by the outside of the wall, this difference moved in the axial direction as shown by the intra-wall heat flux qw,z in Figure 18b. The wall temperature distribution shows that the upper high temperature region is slightly biased towards the outer bend due to the effect of the larger inner wall heat flux at the outer bend. The heat transfer enhancement at the outer bend was also confirmed in the numerical simulation of the coil pipe by Liberto et al. [29]. In the center of the second bend (z = 48.9 D) and in the straight section after the second bend (z = 53.7 D), there is no significant distortion of the inner wall heat flux as observed in the center of the first bend. However, in the straight section after the second bend, the inner wall heat flux is slightly larger on the outer bend, and the high wall temperature is also slightly biased to the outside. This is probably due to the effect of the deflected flow in the second bend. The local heat transfer characteristics and axial energy flow are thus clarified. However, the cause of the heat dissipation enhancement on the outside of the first bend is unknown. It is also not known why heat dissipation enhancement does not occur at the second bend. We thus evaluated the mechanism of heat transfer enhancement by the bending of the pipe through evaluation of the temperature gradient of the internal fluid and the flow structure.
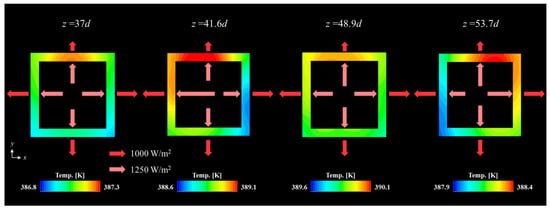
Figure 20.
Wall heat flux inside and outside the pipe and wall temperature distribution inside the pipe.
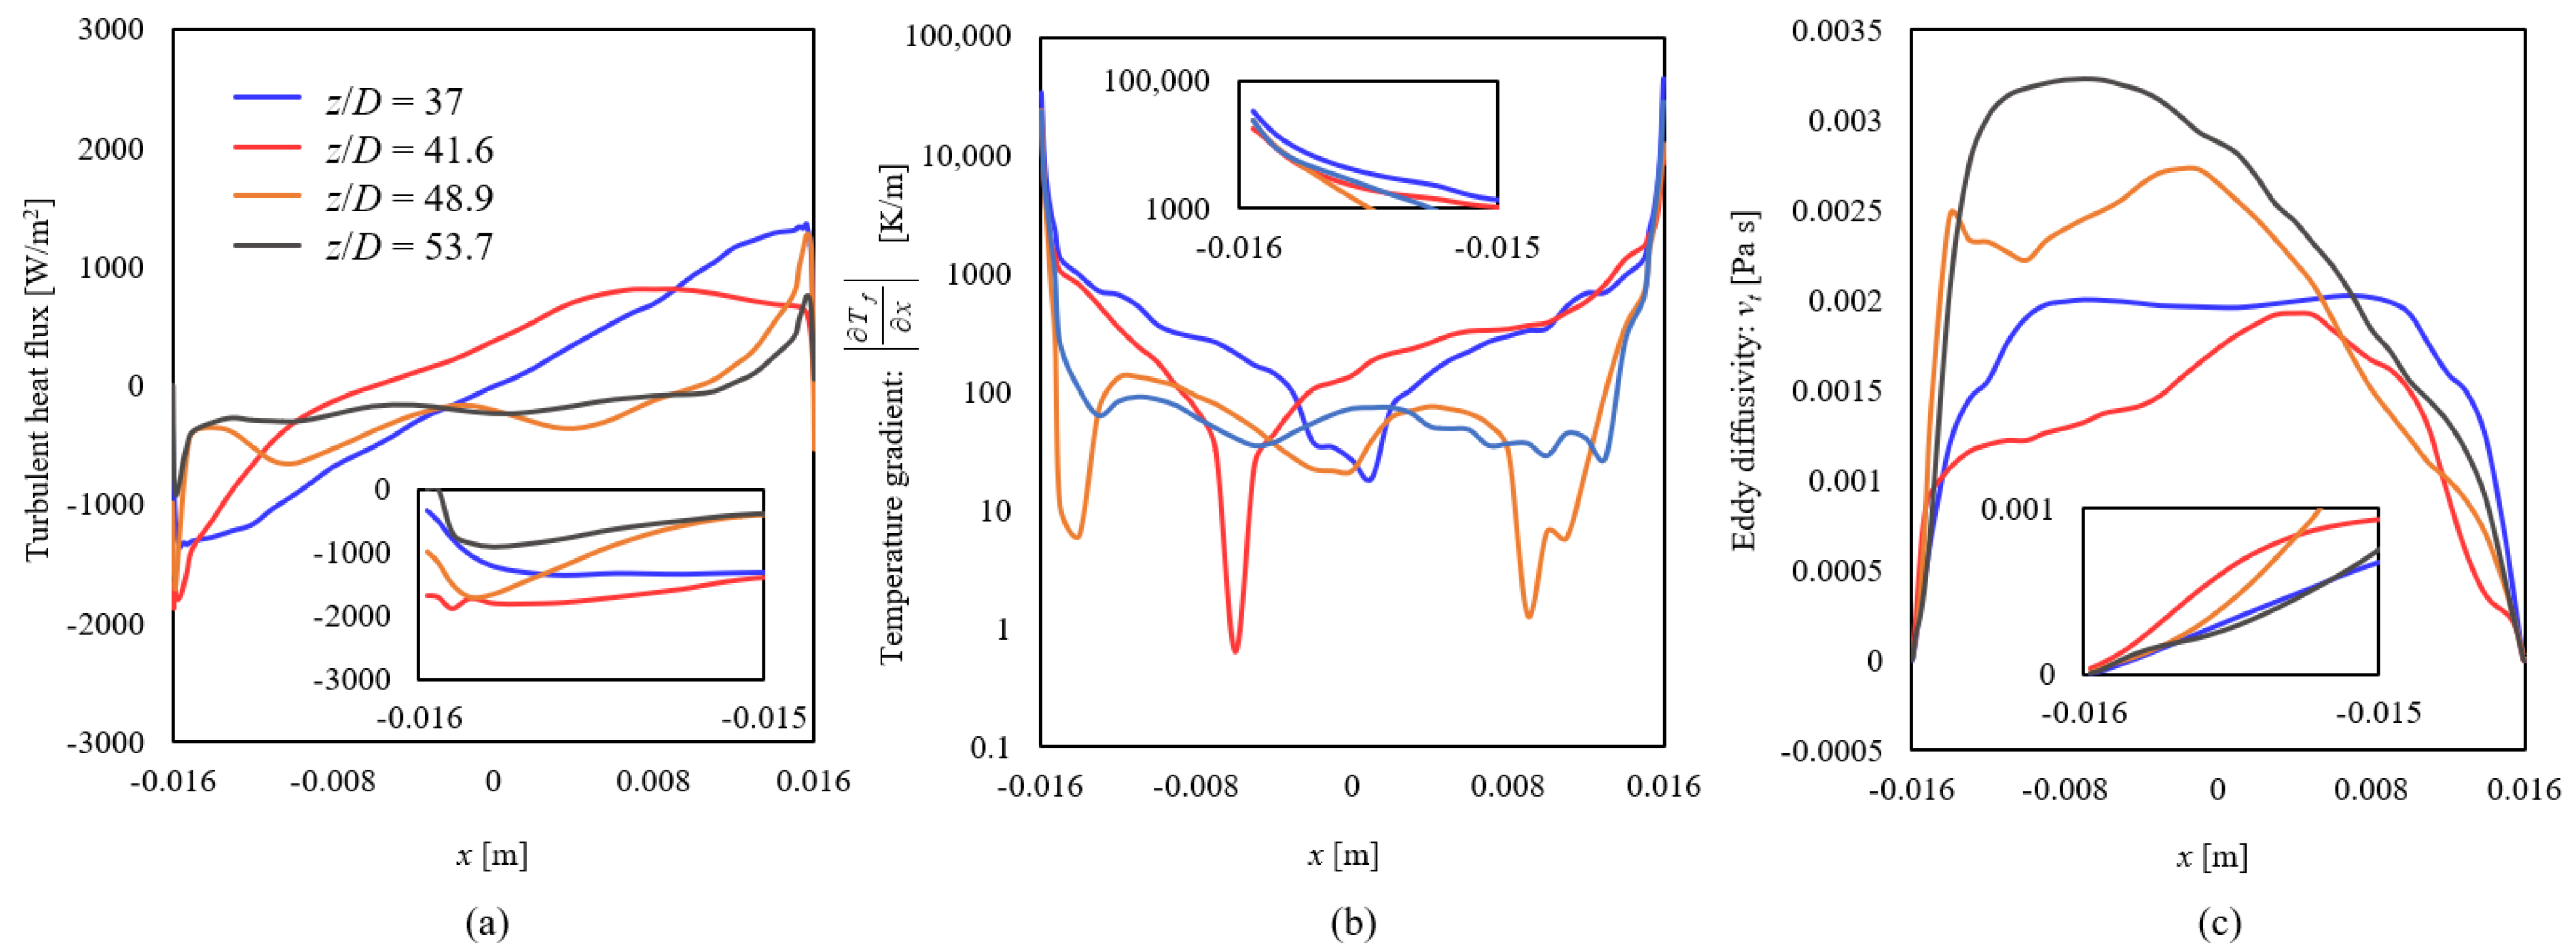
The x-directional distribution of turbulent heat flux was evaluated in the straight pipe section (z = 37 D), at the middle of the first bend (z = 41.6 D), at the middle of the second bend (z = 48.9 D), and in the straight pipe section behind the second bend (z = 53.7 D). Figure 21a shows the results. The distribution of turbulent heat flux is symmetrical in the straight pipe section, but in the middle of the first bend, the turbulent heat flux is higher on the outside (−x side) than on the inside (+x side) of the bend. The peak value of this turbulent heat flux is approximately 1.5 times that of the turbulent heat flux in the straight pipe section. This higher turbulent heat flux on the outside the bend, combined with the fact that the pipe surface area on the outside of the bend is larger than that on the inside, leads to higher heat flux qwi,z at the bend, as shown in Figure 18b. Looking at the results for the second bend (z = 48.9 D), the turbulent heat flux on the inside of the bend (−x side) is greater than that in the straight pipe section. However, the turbulent heat flux on the outside of the bend is the same as that in the straight section. Therefore, considering the heat transfer area, the heat dissipation does not change greatly and the average heat flux qwi,z does not increase, as shown in Figure 18b. The turbulent heat flux in the straight section after the second bend is lower than that in the straight section before the first bend, but this is thought to be due to the remaining effect of the flow deflected by the bend and no turbulent boundary layer developing. According to Equation (17), the magnitude of the turbulent heat flux is determined by the temperature gradient and the magnitude of the eddy diffusivity. Therefore, the temperature gradient was evaluated as shown in Figure 21b. The temperature gradient near the wall on the outside of the first bend is not as large as that in the straight pipe section. The eddy diffusivity was then evaluated as shown in Figure 21c. The eddy diffusivity is larger near the wall surface on the outside of the first bend (z = 41.6 D). It is thus concluded that the turbulent heat flux increased owing to the enhancement of the outer eddy diffusion by the drift generated by the bend. For a coiled pipe with a large curvature, the heat transfer enhancement mechanism was explained by Liberto [29] as the high-speed and low-temperature (in the case of wall-to-fluid heat transfer) fluid being pushed to the outside. The flow conditions are different from the present results in this bend pipe, and the heat transfer mechanism seems to be different due to the effect of the smaller curvature. At the second bend, the outer eddy diffusivity does not increase as much, which is thought to result in less turbulent heat flux. Furthermore, we investigated the relation between k and ω in Equation (18) to clarify why the outer eddy diffusivity increases at the first bend. The results show that the characteristic frequency ω is smaller on the outside of the bend, which increases the outer eddy diffusivity.
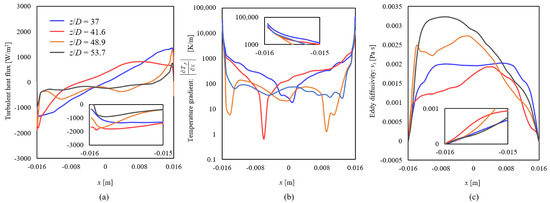
Figure 21.
Evaluation of the x-directional distribution of the internal fluid at y = 0 in CHT simulation: (a) turbulent heat flux, (b) temperature gradient, and (c) eddy diffusivity.
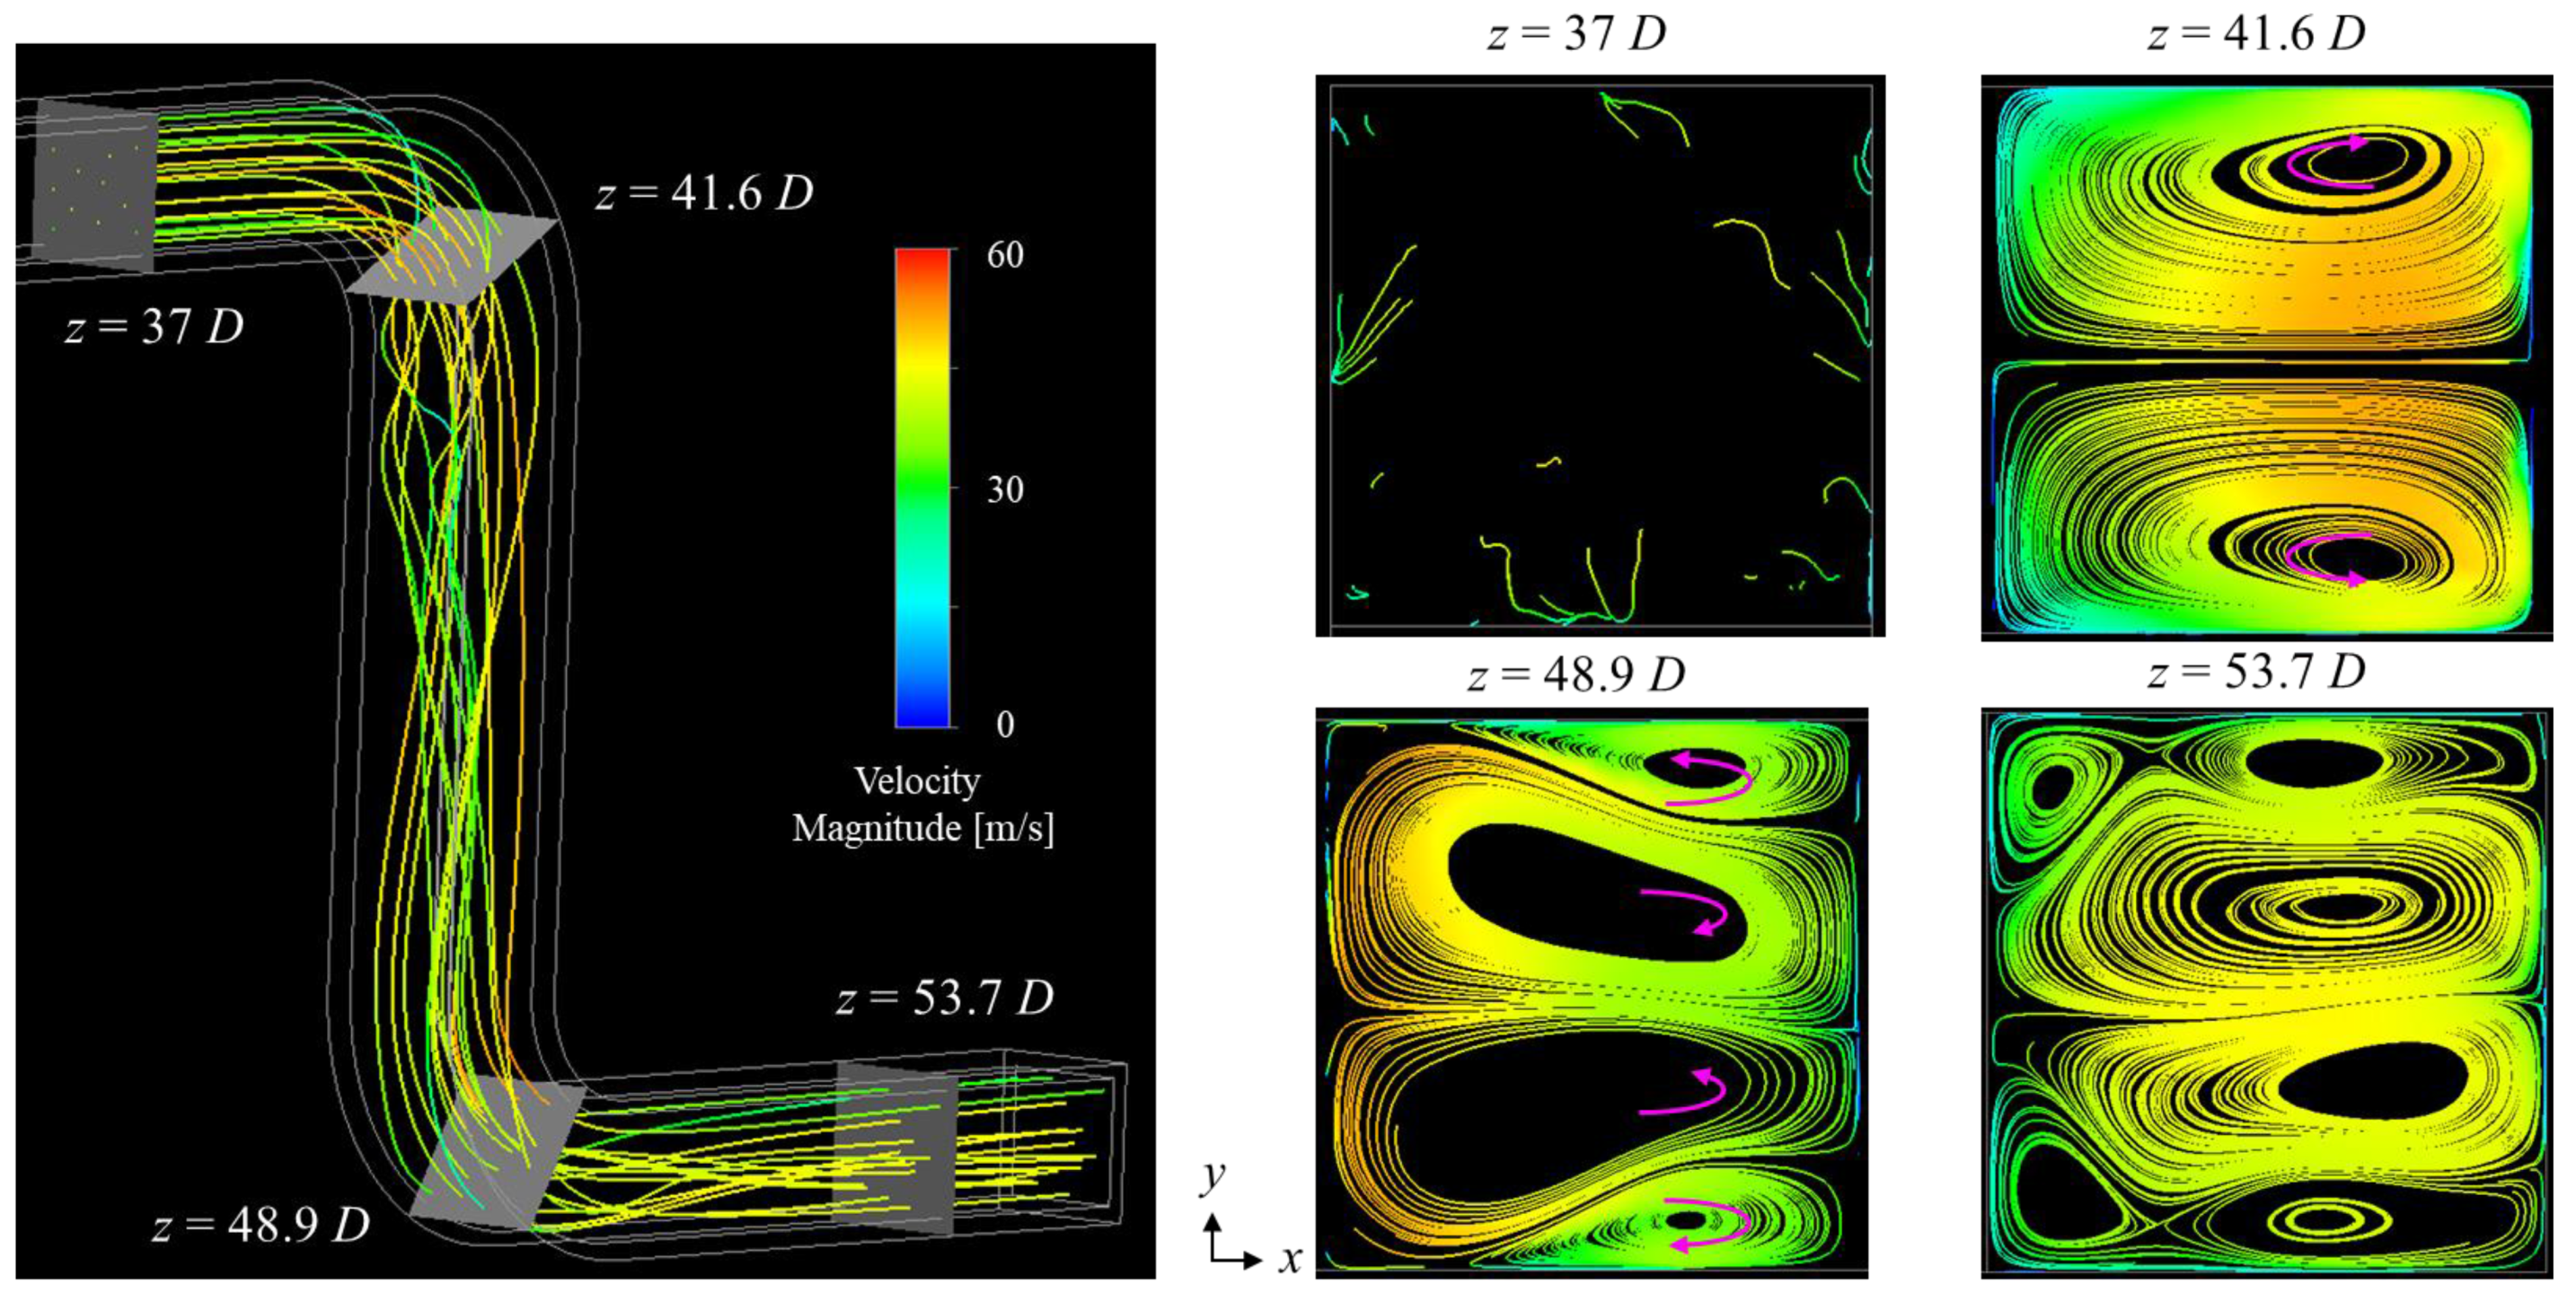
Finally, we evaluated the change in flow structure along the axial direction from a plot of streamlines as shown in Figure 22. Upstream of the first bend, the streamlines follow the axial direction, but from the first bend, they move in a complex manner in the direction of the channel cross section. The streamlines on the x–y plane at the right side of Figure 22 show that a secondary flow (Dean vortices) forms at the middle of the first bend, and two pairs of vortices (Lyne vortices) form at the second bend. The generation of these secondary flows is consistent with the results of stereo-PIV measurements made by Oki et al. [41]. The cause of the Lyne vortices is thought to be the non-uniform velocity distribution at the entrance of the second bend due to the first bend as shown by Oki et al. [41]. Figure 21c shows that the eddy diffusivity increases at the location where the Dean vortices are generated (z = 41.6 D). The heat transfer mechanism is discussed on the basis of this increase in the eddy diffusivity and the fact that large vortices generally have longer turbulence lifetimes than small vortices. First, the centrifugal force forms large Dean vortices, which generate turbulence with a long lifetime (small characteristic frequency: ω). This is suggested to increase the eddy diffusivity and turbulent heat flux as shown in Figure 21a,c, resulting in enhanced heat transfer. Heat dissipation may have been smaller in the second bend because of the shorter turbulence lifetime due to the generation of Lyne vortices with smaller scales. At the second bend, the eddy diffusivity and turbulent heat flux are higher, as shown in Figure 21a,b, owing to the presence of a large inner vortex, but the heat dissipation does not increase greatly because the heat transfer area is small.
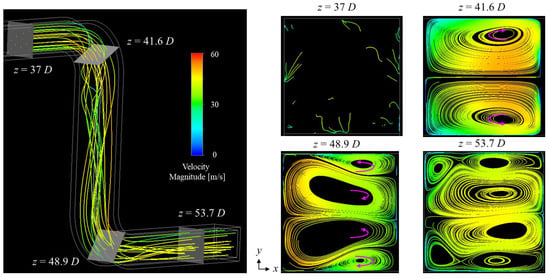
Figure 22.
Visualization of axial and in-plane streamlines in CHT simulation.
4. Conclusions
In this study, the heat transfer characteristics of an S-shaped double-bend pipe commonly used in automobile engine piping were investigated by conducting experiments under conditions equivalent to those of actual equipment (Reynolds number of 60,000). The heat dissipation and Nusselt number were evaluated by measuring the cross-sectional temperature with thermocouples and the wall surface temperature with infrared thermography. Local heat transfer characteristics and the correlation between the flow structure and heat transfer enhancement were evaluated in CHT simulations validated by cross-sectional temperature profile measurements and flow field PIV. The conclusions of the study are as follows.
- Measurement of the cross-sectional temperature distribution of the internal fluid revealed that the high-temperature core is always at the center from upstream to downstream in the straight pipe, whereas in the double-bend pipe, the high-temperature core shifts outward at both the first and second bends. This shift appears to be due to the compressive effect of the centrifugal force.
- Evaluation of the characteristics of heat transfer from the internal fluid to the pipe wall showed that the double-bend pipe has 1.4 times the heat dissipation and twice the Nusselt number compared with a straight pipe.
- The evaluation of heat transfer characteristics in CHT simulation revealed that the first bend enhances heat dissipation to the pipe wall but the second bend does not. The large amount of heat dissipated to the pipe wall at the first bend is transferred upstream and downstream through the inside of the pipe by thermal conduction. The tendency for heat transfer enhancement to occur at the first bend is consistent with previous results by Guo [23] and Liberto et al. [29].
- The reason for enhanced heat dissipation at the first bend is enhanced eddy diffusion and increased turbulent heat flux due to the deflected flow. It is suggested that the enhanced eddy diffusion is caused by Dean vortices at the first bend.
- The reason for the lack of heat dissipation enhancement at the second bend is that eddy diffusion is not enhanced on the outside of the bend and the turbulent heat flux does not increase. It is suggested that this is a result of Lyne vortices, which are smaller than Dean vortices, forming on the outside of the second bend, resulting in less enhancement of eddy diffusion.
The study provided heat transfer characteristics of flows with double-bends in different directions, for which data have been lacking. The constructed model of CHT simulation can guide the evaluation of the heat transfer characteristics of automobile engine pipes with multiple bends. In addition, the results of the cross-sectional temperature distribution and flow field PIV are expected to be used in the validation of various simulation methods.
Author Contributions
Conceptualization, Y.O. and H.H.; methodology, Y.K., K.F. and Y.O.; software, Y.K.; validation, Y.K., G.G. and K.F.; formal analysis, Y.K.; investigation, M.K. (Mikimasa Kawaguchi), M.K. (Masanobu Koutoku), M.K. (Masaya Kamigaki) and H.Y.; writing—original draft preparation, Y.K.; writing—review and editing, Y.O.; supervision, Y.O. All authors have read and agreed to the published version of the manuscript.
Funding
This research received no external funding.
Data Availability Statement
The data presented in this study are available on request from the corresponding author.
Conflicts of Interest
The authors declare no conflict of interest.
Nomenclature
| A | surface area [m2] | Greek symbols | |
| Cp | constant pressure specific [J/kg K] | λ | heat conductivity [W/m K] |
| D | pipe inner diameter [mm] | ρ | density [kg/m3] |
| Do | pipe outer diameter [mm] | μ | viscosity [Pa s] |
| De | Dean number | μt | eddy viscosity coefficient [Pa s] |
| f | friction coefficient | ν | dynamic viscosity [m2/s] |
| fs | frame speed [fps] | νt | eddy diffusivity [m2/s] |
| h | heat transfer coefficient [W/m2/K] | ω | turbulence eddy frequency [1/s] |
| k | turbulent kinetic energy [m2/s2] | τ | wall shear stress [Pa] |
| mass flow rate [kg/s] | |||
| Nu | Nusselt number | Subscripts | |
| Pr | Prandtl number | a | ambient |
| Prt | turbulent Prandtl number | al | aluminum |
| q | heat flux [W/m2] | b | bulk |
| Q | heat flow rate [W] | c | center |
| r | resolution [mm/pixel] | cr | cross sectional |
| Rc | radius of curvature [mm] | f | fluid |
| Re | Reynolds number | mfa | mass flow rate averaged |
| T | Temperature [K] | o | outer |
| u | velocity in horizontal coordinate [m/s] | PIV | particle image velocimetry |
| u+ | dimensionless velocity | w | wall |
| v | velocity in vertical coordinate [m/s] | wi | inner wall |
| w | velocity in streamwise coordinate [m/s] | wo | outer wall |
| x | horizontal coordinate | ||
| y | vertical coordinate | Superscripts | |
| y+ | dimensionless distance from wall () | ¯ | time averaged value |
| z | streamwise coordinate | ‘ | turbulent term |
References
- Host, R.; Moilanen, P.; Fried, M.; Bogi, B. Exhaust System Thermal Management: A Process to Optimize Exhaust Enthalpy for Cold Start Emissions Reduction; SAE Technical Paper; SAE International: Warrendale, PA, USA, 2017. [Google Scholar]
- Naphon, P.; Wongwises, S. A review of flow and heat transfer characteristics in curved tubes. Renew. Sustain. Energy Rev. 2006, 10, 463–490. [Google Scholar] [CrossRef]
- Dean, W.R.; Hurst, J.M. Note on the motion of fluid in a curved pipe. Mathematika 1959, 6, 77–85. [Google Scholar] [CrossRef]
- Brücker, C. A time-recording DPIV-study of the swirl switching effect in a 90° bend flow. In Proceedings of the 8th International Symposium on Flow Visualization, Sorento, Italy, 1–4 September 1998; pp. 171.1–171.6. [Google Scholar]
- Rütten, F.; Schröder, W.; Meinke, M. Large-eddy simulation of low frequency oscillations of Dean vortices in turbulent pipe bend flows. Phys. Fluids 2005, 17, 035107. [Google Scholar] [CrossRef]
- Sudo, K.; Sumida, M.; Hibara, H. Experimental investigation on turbulent flow in a circular-sectioned 90-degree bend. Exp. Fluids 1998, 25, 42–49. [Google Scholar] [CrossRef]
- Sakakibara, J.; Machida, N. Measurement of turbulent flow upstream and downstream of a circular pipe bend. Phys. Fluids 2012, 24, 041702. [Google Scholar] [CrossRef]
- Wang, Y.; Dong, Q.; Wang, P. Numerical investigation on fluid flow in a 90-degree curved pipe with large curvature ratio. Math. Probl. Eng. 2015, 2015, 548262. [Google Scholar] [CrossRef]
- Tanaka, M.-A.; Ohshima, H.; Monji, H. Numerical investigation of flow structure in pipe elbow with large eddy simulation approach. In Proceedings of the ASME 2009 Pressure Vessels and Piping Conference, Prague, Czech Republic, 26–30 July 2009; pp. 449–458. [Google Scholar]
- Doorly, D.; Sherwin, S.J. Geometry and Flow, Cardiovascular Mathematics: Modeling and Simulation of the Circulatory System; Springer: Berlin/Heidelberg, Germany, 2009. [Google Scholar]
- Rudolf, P.; Desova, M. Flow characteristics of curved ducts, Appl. Comput. Mech. 2007, 1, 255–264. [Google Scholar]
- Yuki, K.; Hasegawa, S.; Sato, T.; Hashizume, H.; Aizawa, K.; Yamano, H. Matched refractive-index PIV visualization of complex flow structure in a three-dimensionally connected dual elbow. Nucl. Eng. 2011, 241, 4544–4550. [Google Scholar] [CrossRef]
- Azzola, J.; Humphrey, J.A.C.; Iacovides, H.; Launder, B.E. Developing turbulent flow in a U bend of circular cross section: Measurement and computation. J. Fluids Eng. 1986, 108, 214–221. [Google Scholar] [CrossRef]
- Oki, J.; Kuga, Y.; Yamamoto, R.; Nakamura, K.; Yokohata, H.; Nishida, K.; Ogata, Y. Unsteady secondary motion of pulsatile turbulent flow through a double 90-bend duct. Flow Turbul. Combust. 2020, 104, 817–833. [Google Scholar] [CrossRef]
- Taylor, A.M.; Whitelaw, J.H.; Yianneskis, M. Developing Flow in S-Shaped Ducts 2: Circular Cross-Section Duct; NASA Contractor Report 3759; NASA: Washington, DC, USA, 1984. [Google Scholar]
- Niazmand, H.; Jaghargh, E.R. Bend sweep angle and Reynolds number effects on the hemodynamics of S-shaped arteries. Ann. Biomed. Eng. 2010, 38, 2817–2828. [Google Scholar] [CrossRef]
- Mazhar, H.; Ewing, D.; Cotton, J.S.; Ching, C.Y. Measurement of flow field characteristics in single and dual S-shape 90° bends using matched refractive index PIV. Exp. Therm. Fluid Sci. 2016, 79, 65–73. [Google Scholar] [CrossRef]
- Ng, Y.T.; Luo, S.C.; Lim, T.T.; Ho, Q.W. On the relation between centrifugal force and radial pressure gradient in flows inside curved and S-shaped ducts. Phys. Fluids 2008, 20, 055109. [Google Scholar] [CrossRef]
- Han, F.; Liu, Y.; Lan, Q.; Li, W.; Wang, Z. CFD investigation on secondary flow characteristics in double-curved subsea pipelines with different spatial structures. J. Mar. Sci. Eng. 2022, 10, 1264. [Google Scholar] [CrossRef]
- Lyne, W.H. Unsteady viscous flow in a curved pipe. J. Fluid Mech 1970, 45, 13–31. [Google Scholar] [CrossRef]
- Wavell, S.P. The Influence of 90° and 180° Pipe Bends on Heat Transfer from an Internally Flowing Gas Stream. Ph.D. Thesis, University of Surrey, Guildford, UK, 1968. ISBN 978-0-355-80098-2. [Google Scholar]
- Sparrow, E.M.; Chrysler, G.M. Turbulent flow and heat transfer in bends of circular cross sections. i-heat transfer experiments. J. Heat Transf. 1986, 108, 40–47. [Google Scholar] [CrossRef]
- Guo, G.; Kamigaki, M.; Zhang, Q.; Inoue, Y.; Nishida, K.; Hongou, H.; Koutoku, M.; Yamamoto, R.; Yokohata, H.; Sumi, S.; et al. Experimental study and conjugate heat transfer simulation of turbulent flow in a 90° curved square pipe. Energies 2021, 14, 94. [Google Scholar] [CrossRef]
- Mori, Y.; Nakayama, W. Study on forced convective heat transfer in curved pipes: 3rd report, theoretical analysis under the condition of uniform wall. Int. J. Heat Mass Transf. 1966, 10, 681–695. [Google Scholar] [CrossRef]
- Pratt, N.H. The heat transfer in a reaction tank cooled by means of a coil. Trans. Inst. Chem. Eng. 1947, 25, 163–180. [Google Scholar]
- Seban, R.A.; McLaughlin, E.F. Heat transfer in tube coils with laminar and turbulent flow. Int. J. Heat Mass Transfer 1963, 6, 387–395. [Google Scholar] [CrossRef]
- Rogers, G.F.C.; Mayhew, Y.R. Heat transfer and pressure loss in helically coiled tubes with turbulent flow. Int. J. Heat Mass Transfer 1964, 7, 1207–1216. [Google Scholar] [CrossRef]
- Di Piazza, I.; Ciofalo, M. Numerical prediction of turbulent flow and heat transfer in helically coiled pipes. Int. J. Therm. Sci. 2010, 49, 653–663. [Google Scholar] [CrossRef]
- Di Liberto, M.; Ciofalo, M. A study of turbulent heat transfer in curved pipes by numerical simulation. Int. J. Heat Mass Transf. 2013, 59, 112–125. [Google Scholar] [CrossRef]
- Rowe, M. Measurements and computations of flow in pipe bends. J. Fluid Mech. 1970, 43, 771–783. [Google Scholar] [CrossRef]
- Hrnjak, P.; Hong, S.H. Effect of return bend and entrance on heat transfer in thermally developing laminar flow in round pipes of some heat transfer fluids with high Prandtl numbers. ASME J. Heat Transf. 2010, 132, 061701. [Google Scholar] [CrossRef]
- Cvetkovski, C.G.; Reitsma, S.; Bolisetti, T.; Ting, D.S. Heat transfer in a U-bend pipe: Dean number versus Reynolds number. Sustain. Energy Technol. Assess. 2015, 11, 148–158. [Google Scholar] [CrossRef]
- Egidi, N.; Giacomini, J.; Maponi, P. Mathematical model to analyze the flow and heat transfer problem in U-shaped geothermal exchangers. Appl. Math. Model. 2018, 61, 83–106. [Google Scholar] [CrossRef]
- Arvanitis, K.D.; Bouris, D.; Papanicolaou, E. Laminar flow and heat transfer in U-bends: The effect of secondary flows in ducts with partial and full curvature. Int. J. Therm. Sci. 2018, 130, 70–93. [Google Scholar] [CrossRef]
- Nayak, B.B.; Chatterjee, D.; Mullick, A.N. Numerical prediction of flow and heat transfer characteristics of water-fly ash slurry in a 180 return pipe bend. Int. J. Therm. Sci. 2017, 113, 100–115. [Google Scholar] [CrossRef]
- Mazhar, H.; Ewing, D.; Cotton, J.S.; Ching, C.Y. Mass transfer in dual pipe bends arranged in an S-configuration. Int. J. Heat Mass Transf. 2014, 71, 747–757. [Google Scholar] [CrossRef]
- Wang, D.; Ewing, D.; Le, T.; Ching, C.Y. Measurement of local mass transfer and the resulting roughness in a large diameter S-bend at high Reynolds number. J. Heat Transf. 2016, 138, 062001. [Google Scholar] [CrossRef]
- Kato, Y.; Guo, G.; Kamigaki, Y.; Fujimoto, K.; Kawaguchi, M.; Nishida, K.; Koutoku, M.; Hongou, H.; Yanagida, H.; Ogata, Y. An examination of heat transfer dynamics in pulsating air flow within pipes: Implications for automotive exhaust engines. Int. J. Heat Technol. 2023, 41, 815–826. [Google Scholar] [CrossRef]
- Menter, F.R. Two-equation eddy-viscosity turbulence models for engineering applications. AIAA J. 1994, 32, 1598–1605. [Google Scholar] [CrossRef]
- Sudo, K.; Sumida, M.; Hibara, H. Experimental investigation on turbulent flow in a square-sectioned 90-degree bend. Exp. in Fluids 2001, 30, 246–252. [Google Scholar] [CrossRef]
- Oki, J.; Ikeguchi, M.; Ogata, Y.; Nishida, K.; Yamamoto, R.; Nakamura, K.; Yanagida, H.; Yokohata, H. Experimental and numerical investigation of a pulsatile flow field in an S-shaped exhaust pipe of an automotive engine. J. Fluid Sci. Technol. 2017, 12, JFST0014. [Google Scholar] [CrossRef][Green Version]
Disclaimer/Publisher’s Note: The statements, opinions and data contained in all publications are solely those of the individual author(s) and contributor(s) and not of MDPI and/or the editor(s). MDPI and/or the editor(s) disclaim responsibility for any injury to people or property resulting from any ideas, methods, instructions or products referred to in the content. |
© 2023 by the authors. Licensee MDPI, Basel, Switzerland. This article is an open access article distributed under the terms and conditions of the Creative Commons Attribution (CC BY) license (https://creativecommons.org/licenses/by/4.0/).

