Article

Enhancing the Performance and Efficiency of Two-Level Voltage Source Inverters: A Modified Model Predictive Control Approach for Common-Mode Voltage Suppression

1
Laboratory of Energy Systems Modeling (LMSE), Department of Electrical Engineering, University of Biskra, BP 145, Biskra 07000, Algeria
2
LGEERE Laboratory, University of El Oued, El Oued 39000, Algeria
3
Electrical Engineering Department, Faculty of Technology, University of El Oued, El Oued 39000, Algeria
4
Institut de Recherche Dupuy de Lôme (UMR CNRS 6027 IRDL), University of Brest, 29238 Brest, France
5
Logistics Engineering College, Shanghai Maritime University, Shanghai 201306, China
*
Author to whom correspondence should be addressed.
Energies 2023, 16(21), 7305; https://doi.org/10.3390/en16217305
Submission received: 31 August 2023 / Revised: 21 October 2023 / Accepted: 26 October 2023 / Published: 27 October 2023
(This article belongs to the Section F3: Power Electronics)

Abstract

:
In this paper, a new modified model predictive control is proposed to improve the performance of the model predictive control for two-level voltage source inverters by alleviating computational burden and the disadvantages associated with the conventional model predictive control strategy. The objective of the proposed method is to reduce the number of candidate voltage vectors in each sector, thereby improving the overall performance of the control system, as well as achieving common-mode voltage reduction for two-level voltage source inverters. Two strategies are introduced to achieve this objective. Firstly, an algorithm is developed based on statistical computational processes to pre-define the candidate voltage vectors. This strategy involves ranking and considering the most frequently used voltage vectors. Consequently, by reducing the computational burden, the search space for the optimal voltage vectors is reduced. Furthermore, based on statistical results, a strategy is proposed to divide the sectors into three sectors instead of the six sectors in the conventional method. This approach effectively reduces the number of candidate voltage vectors. The modified model predictive control strategy aims to improve the efficiency of the control system by reducing the computational burden, and suppressing the common-mode voltage. The simulation and experiments are carried out to verify the effectiveness of the proposed strategy under various operational conditions. The results demonstrate that the modified model predictive control approach significantly reduces the computational burden and complexity of the control system while effectively suppressing the common-mode voltage; this contributes to improving the performance of two-level voltage source inverters and enhancing their applicability for connecting the renewable energies to the grid.

1. Introduction

The voltage source inverter (VSI) is an essential component in the operation of many renewable energy sources, such as wind energy, photovoltaic energy, and others. There is a lot of research on the efficiency of the VSI [1,2]. To connect photovoltaic energy sources to the grid, a common method is to use a VSI [3]. Achieving a smooth connection and synchronization between a VSI and the grid heavily relies on the control technique employed [4]. The control technique plays a crucial role in regulating the VSI’s output voltage and frequency to match the grid’s voltage and frequency, ensuring a seamless and stable connection [5,6]. There are several control techniques used to regulate the output voltage and current of the VSI. Hysteresis current control (HCC) is a simple and widely used control technique that uses a hysteresis band to regulate the current flowing through the inverter. The inverter switches on when the current falls below the lower limit of the hysteresis band and switches off when the current rises above the upper limit [7,8,9]. Pulse width modulation (PWM) is another popular control technique used in VSIs. It involves comparing a reference signal with a triangular carrier wave to generate a series of pulses that control the switching of the inverter. The width of the pulses is varied to control the output voltage and frequency. Space vector modulation (SVM) is a more advanced control technique that combines PWM and vector analysis to regulate the output voltage of the inverter where voltage vectors with different periods are applied to control the switching of the inverter to generate the desired output current. MPC is a modern control technique that utilizes a mathematical model of the system to predict its future behavior and optimize the control inputs accordingly [10,11]. It is a highly sophisticated control technique that requires significant computational power; however, it can provide superior performance compared to other control techniques in certain applications [12,13,14]. In three-phase inverter control, model predictive control (MPC) is a powerful technique used to regulate the output voltage and frequency of the inverter to a desired setpoint while ensuring safe and efficient operation. The MPC algorithm utilizes a mathematical model of the inverter system to predict the future behavior of the output voltage and current. Based on these predictions, it computes optimal control inputs that minimize a given cost function over a finite time horizon [15,16]. The cost function used in MPC typically incorporates penalties for deviations from the set point and includes constraints on the inverter operation, such as maximum current and voltage limits. By considering these factors, MPC ensures that the inverter operates within safe bounds while achieving the desired regulation. The algorithm continuously updates the control inputs based on the latest measurements and predictions, thus creating a closed-loop control system. The MPC offers several advantages over conventional control strategies. Furthermore, the MPC is capable of handling non-linearities, constraints, and uncertainties that exist within the inverter system. This flexibility allows for accurate and reliable regulation of the output voltage and frequency. Moreover, MPC enables the implementation of advanced control features, such as harmonic mitigation and reactive power compensation. These capabilities enhance the overall performance and efficiency of the inverter system [17,18]. Recently, several improvements have been made to the classical MPC method in order to reduce the complexity of this strategy and decrease the common-mode voltage (CMV), the value of which is significant when applying the classical MPC strategy, and it has shown good performance. A modified method was proposed in [19] based only on non-zero voltage vectors. Despite the success of this technique, the CMV still appears under the effect of dead time [20]. Furthermore, reducing the candidate voltage vectors (VVs) results in an increased total harmonic distortion (THD). An alternative strategy presented in reference [21] is based on intentional partial switching, where the switching to and from non-adjacent, non-inverting voltage vectors (VVs) is deliberately excluded; this strategy has been proven effective. However, the CMV still remains high. Furthermore, implementing this strategy is complex. Authors in reference [22] suggested an advanced approach compared to its predecessor, as it involves pre-determining the sectors to be applied using a pre-developed algorithm. While this strategy effectively reduces the CMV and THD, it is known for its complex procedures and the need for extensive mathematical calculations for its proper implementation. One way to reduce the CMV is through the use of modulation techniques or auxiliary circuit schemes. In modulation techniques, only voltage vectors that produce low CMV are utilized [23,24]. In this paper, a modified MPC for the 2L-VSI is proposed to alleviate computational burden and to reduce the CMV. First, an algorithm is developed to perform statistical operations for classifying the non-zero voltage vectors based on their application rate in each sector. Then, based on the statistical results, the two least frequently applied voltage vectors (VVs) in each sector are pre-excluded. Based on the new modified MPC strategy, which includes a pre-selection of VVs to reduce the burden of the cost function computation, a second method was derived. This method is based on the first method that was modified and offers further improvements. This paper is organized as follows:
  • A comprehensive introduction to the MPC strategy, an explanation of CMV, a discussion of the associated risks, and a presentation of the most prominent modified MPC strategies designed to enhance performance and suppress CMV.
  • A new pre-selection strategy for voltage vectors (VVs) is designed based on statistical analyses. This strategy fully utilizes the six non-zero VVs of the 2L-VSI to completely restrict common-mode voltage CMV within ±udc/6. Additionally, it reduces the computational burden of the cost function and minimizes total harmonic distortions (THDs) and current ripples.
  • Simulation and experimental results are presented to verify the effectiveness of the proposed strategy. Furthermore, to ensure the efficiency of the proposed method, the inverter’s performance was tested under various operating conditions, and the results are provided.

2. System under Study

Model predictive control is a widely used strategy for controlling the VSIs to connect the power generated by PV systems to the grid. The MPC is a control technique that utilizes a dynamic model of the system to predict its future behavior and optimizes a control action over a finite time horizon; it is also effective in mitigating the leakage current caused by high CMV [12].
In the context of PV systems, the VSI is responsible for converting the DC power generated by the PV panels into AC power that is compatible with the grid. The control objective is to regulate the output voltage and current of the VSI to meet the grid requirements, such as maintaining the voltage and frequency within the desired range and achieving power quality standards. Figure 1 shows the structure and VVs of a 2L-VSI under study where v is the voltage (VV) output of the 2L-VSI, e is the electromotive force (EMF) of the grid, i is the output current, L is the grid inductance, and R is the grid resistance.
Figure 1 shows the 2L-VSI connected to an RLE load. Each leg of the inverter contains two switches that work in reverse as shown in Table 1. The 2L-VSI has eight switches states, and each switching state will produce a specific voltage, as illustrated in Table 2.
In order to control the current, the execution steps of conventional MPC strategy are summarized as follows. First, the mathematical model of the 2L-VSI is depicted as
{ V an = R i a + Ldi a dt + e a V bn = R i b + Ldi b dt + e b V cn = R i c + Ldi c dt + e c
When we applied the Clarke transform, the 2L-VSI model in the axes αβ becomes
{ V α = R i a + Ldi α dt + e α V β = R i β + Ldi β dt + e β
The discrete model of Equation (2) is utilized to forecast the current vector for the upcoming control period, as depicted in Equation (3) and as follows:
{ i α P ( k + 1 ) = ( 1 R L   T s ) i α ( k ) + Ts L ( V α ( k ) e α ( k ) ) i β P ( k + 1 ) = ( 1 R L   T s ) i β ( k ) + Ts L ( V β ( k ) e β ( k ) )
where Ts stands for the control period.
In this step, the future current at (k + 1)th instant is predicted using V(k) to compensate for the effects of the one-step delay [25]. Second, several candidate VVs are then pre-selected based on VVs’ pre-selection strategies and then they are used to predict the current i (k + 2) at the (k + 2)th instant, as shown in Equation (4).
{ i α P ( k + 2 ) = ( 1 R L   Ts ) i α ( k + 1 ) + Ts L ( V α ( k + 1 ) e α ( k + 1 ) ) i β P ( k + 2 ) = ( 1 R L   Ts ) i β ( k + 1 ) + Ts L ( V β ( k + 1 ) e β ( k + 1 ) )
where u (k + 1) is the pre-selected candidate VVs; it is mostly assumed that e(k + 1) = e (k).
Third, to reduce the error between the measured currents and the reference values (to evaluate the control effects of all the candidate VVs) after predicting the expected current at (k + 2) depending on Equations (3) and (4), the cost function is used to reduce the error between the measured current and the reference values. The cost function is expressed in the orthogonal coordinates of the error measure between the reference and expected currents, as follows:
g = | i α * ( k + 2 ) i α P ( k + 2 ) | + | i β * ( k + 2 ) i β P ( k + 2 ) |
where i* (k + 2) is the reference current vector.
Several researchers have studied and developed this strategy to reduce the number of candidate VVs, decrease switching frequency, and reduce the voltage of uno.
The six VVs strategy involves excluding the zero vectors (u0, u7) and relying solely on the non-zero vectors (u1, u2, u3, u4, u5, u6) as a way to reduce the uno vectors [26,27,28,29]. While this method effectively reduces the cost function, it leads to higher uno vectors due to the dead time effect. Additionally, the reduction in the number of candidate VVs can increase the THD.

2.1. Common-Mode Voltage

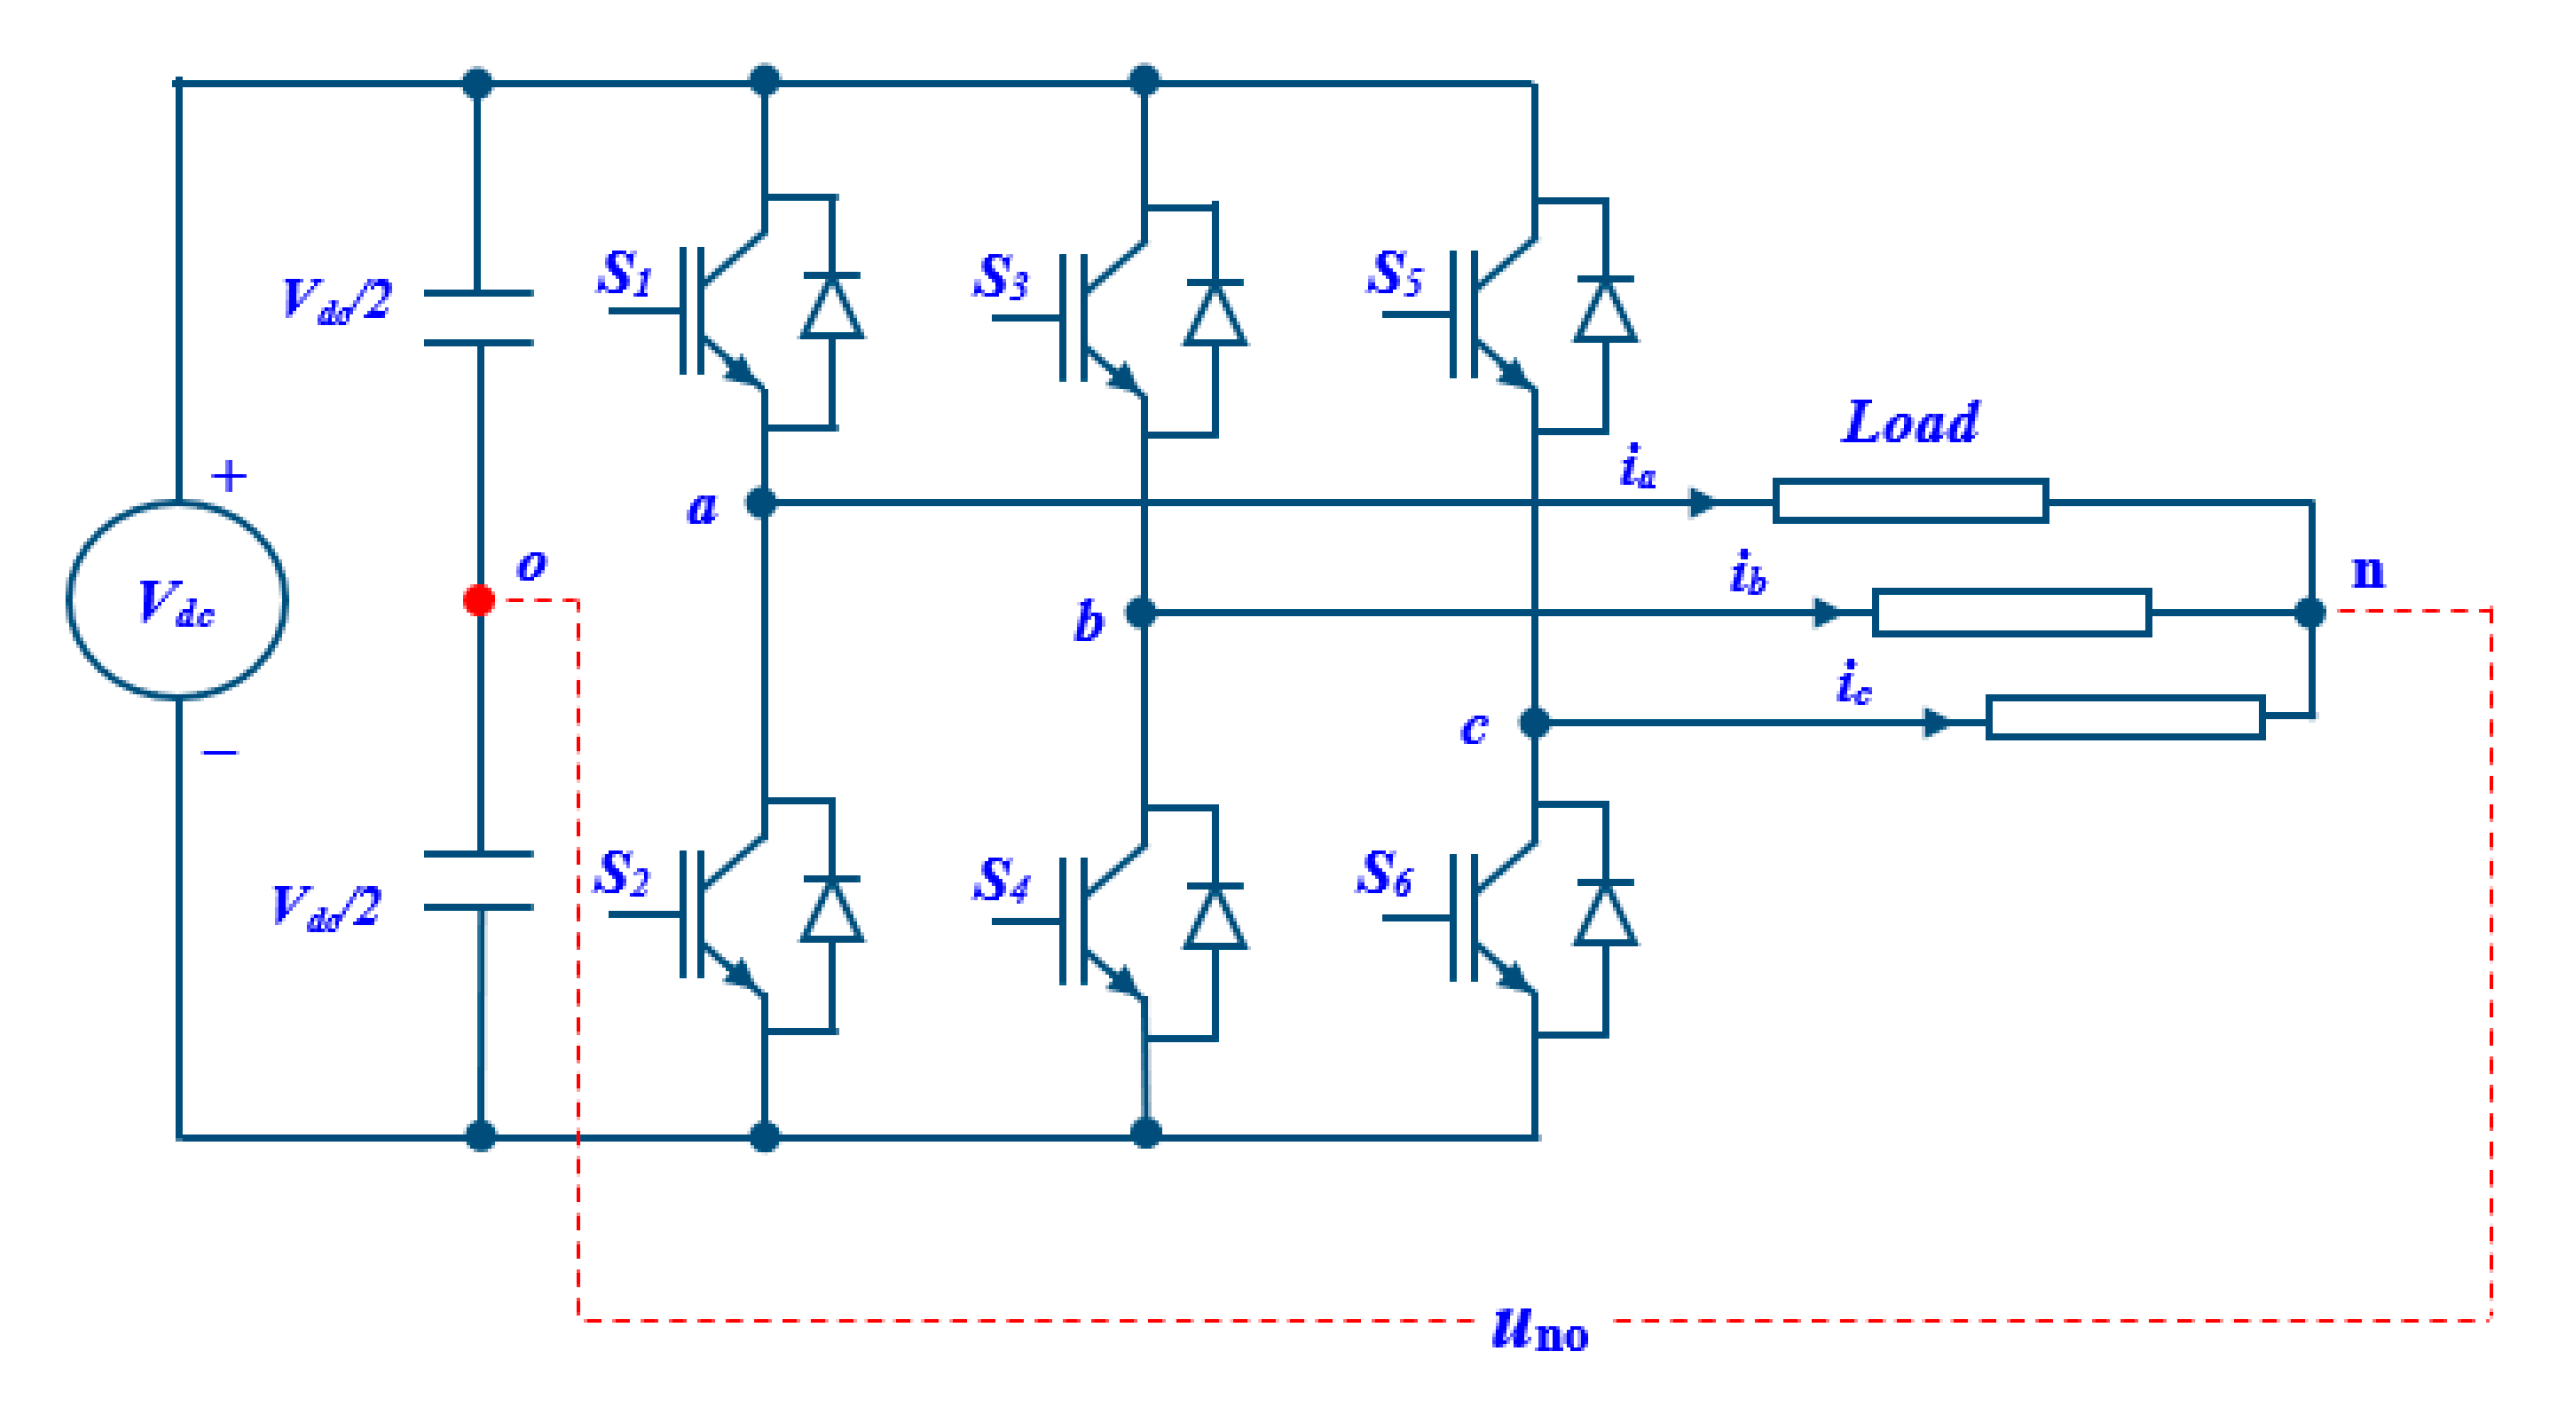
The common-mode voltage is the potential difference (uno) between the neutral point (n) of the load and the midpoint (o) of the DC bus, as shown in Figure 2. this potential difference varies with the state of the switches indicated in Table 3, [30,31] and it is expressed as follows:
U ao = { V dc 2     ,     Sa = 1 V dc 2 ,     Sa = 0 U ao = Ka   V dc 2
U bo = { V dc 2     ,     Sb = 1 V dc 2 ,     Sb = 0 U bo = Kb   V dc 2
U co = { V dc 2     ,     Sc = 1 V dc 2 ,     Sc = 0 U co = Kc   V dc 2
According to the definition of the equations Uao, Ubo, and Uco, we obtain Ka, Kb and Kc which represent the situation of 1 or −1, depending on Si. The load is considered balanced, resulting in the following equations:
U an + U bn + U cn = 0  
{ U ao + U on = U an U bo + U on = U bn U co + U on = U cn
According to the sum of Equation (10), we have
( U ao + U bo + U co ) + 3   U on = U an + U bn + U cn
Combining Equations (9) with (11), the common-mode voltage can be defined as
  U on = 1 3   ( U ao + U bo + U co )
The highest value of the CMV is obtained when the zero voltage vectors (Z-VVs) u0(000) and u7(111) are applied, resulting in a value of |uno| = Vdc/2. Conversely, the lowest CMV value is observed when the remaining non-zero voltage vectors (NZ-VVs) u1(100), u2 (110), u3 (010), u4 (011), u5 (001), and u6 (101) are applied, yielding a value of |uno| = Vdc/6.
The CMV poses several risks to electrical systems, and one notable issue is the presence of leakage current through stray capacitors. This phenomenon can lead to gradual damage to the system components over time. The leakage current, which flows along unintended paths, can cause degradation and deterioration of sensitive components, ultimately compromising the overall performance and reliability of the system.
If left unaddressed, the cumulative effects of leakage current can lead to malfunctions, reduced lifespan, and cause potential failures of the electrical system. Therefore, it is crucial to mitigate CMV-related risks and implement appropriate measures to minimize leakage current, such as employing effective shielding techniques, optimizing grounding systems, and employing suitable filtering mechanisms [32,33].
By proactively addressing CMV-related risks and taking preventive measures, it is possible to ensure the longevity, efficiency, and safe operation of electrical systems [14].

2.2. Modified Model Predictive Control (MPC) to Reduce the CMV

Pre-excluding Z-VVs (u0, u7) can help reduce the CMV because, when Z-VVs are excluded, it avoids turning on or off the three high-side switches at the same time, which means they do not contribute to any difference in voltage between the two inputs of the system. Therefore, excluding them can help reduce the CMV. Relying only on non-zero voltage vectors (NZ-VVs) (u1, u2, u3, u4, u5, u6) can help reduce CMV because, when these NZ-VVs are applied, it avoids the simultaneous turn-on or turn-off of the high-side switches. This, in turn, helps to reduce the CMV. Overall, pre-excluding zero vectors and relying only on NZ-VVs can help reduce the CMV; however, it is important to note that this may not always be the most effective or appropriate method depending on the specific system and application. Other methods, such as using differential amplifiers or implementing shielding and grounding techniques, may also be necessary to effectively reduce the CMV [25,29]. The method proposed in [21] for mitigating the CMV problem involves excluding certain non-adjacent and non-opposing VVs during the switching process. While this approach has proven effective, the CMV issue still arises due to the dead time effect, which is the time between turning off one switch and turning on another. Advanced methods have been proposed that involve pre-selecting VVs to be applied during switching using proposed algorithms. This approach significantly reduces both CMV and THD; however, it is more complex than previous methods. The pre-selection of VVs using an algorithm is a technically complex process that requires careful consideration of several factors, including the switching frequency and the load type. Despite its complexity, this approach has the potential to yield better results than previous methods, making it a viable option for advanced electronic power systems [34].

3. Proposed Strategy

Figure 3 shows the overall control diagram of the proposed strategy and the switching states for a 2L-VSI connected to the grid. The modified MPC method aims to reduce the candidate VVs to only four VVs in each sector, based on statistical calculations. To simplify, this method has been named the four VVs method (4-VVs).
The following steps outline how the 4-VVs method works:
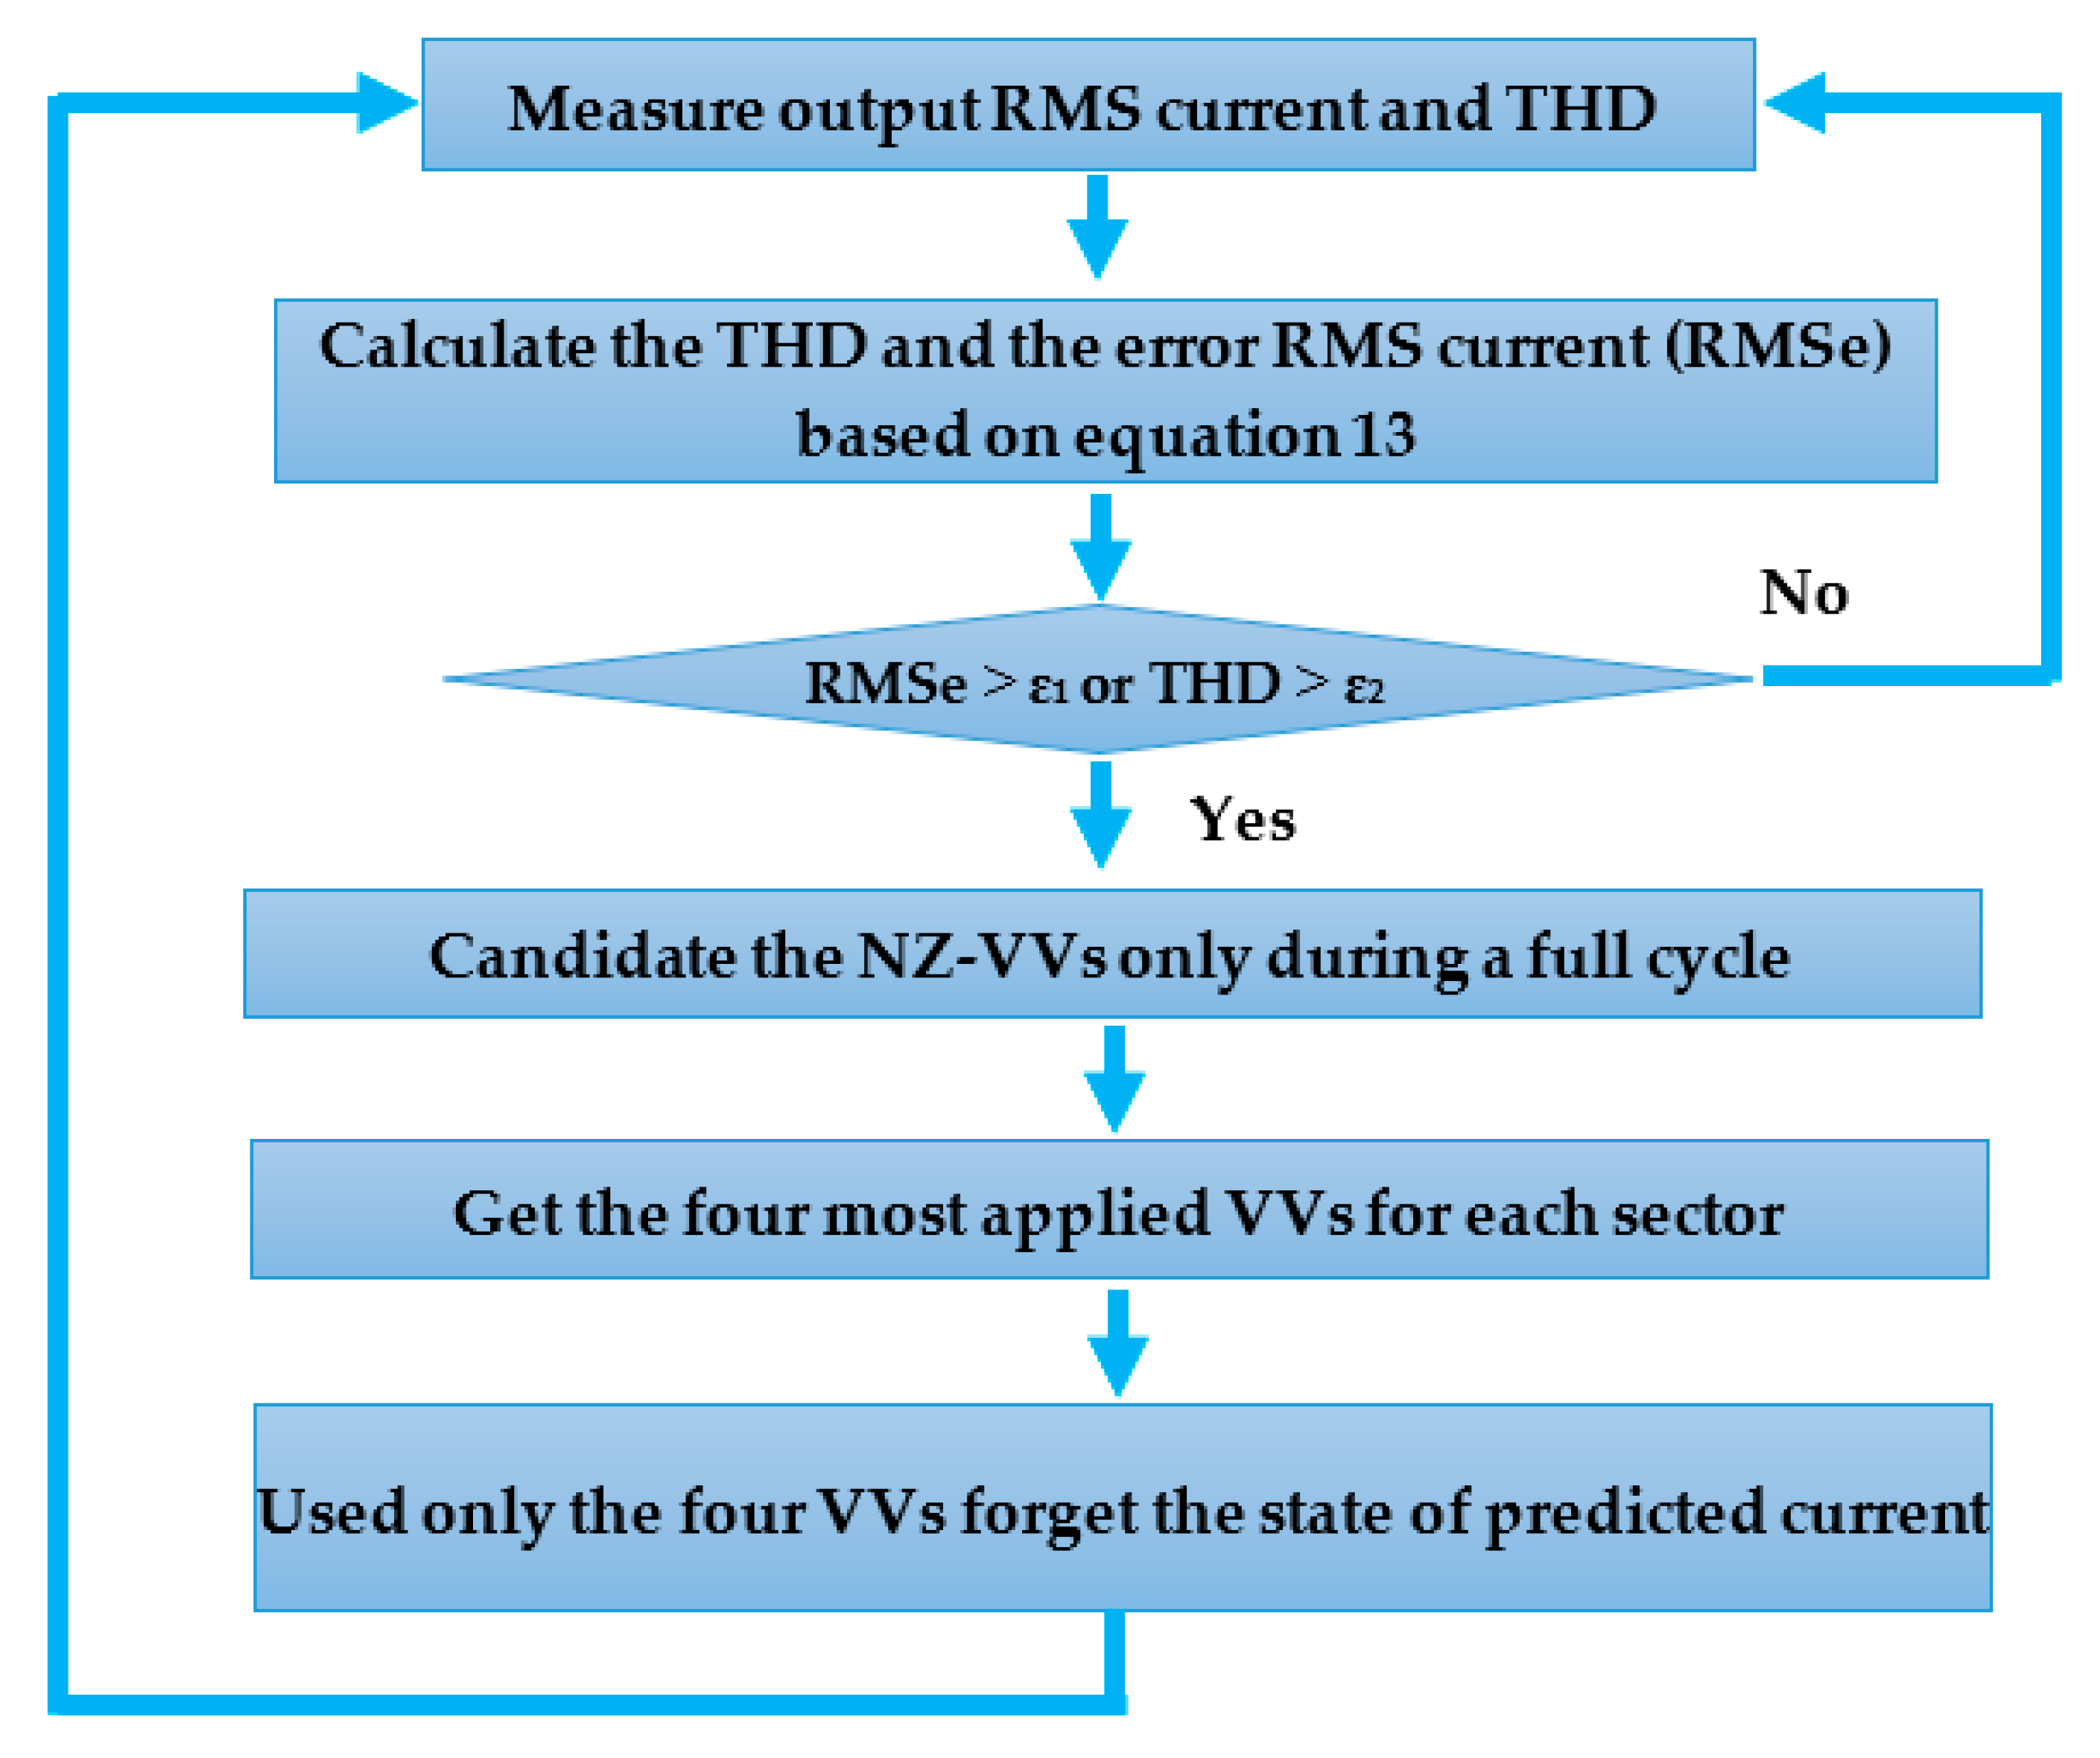
First, the Z-VVs are excluded. Second, the NZ-VVs are applied over a full cycle. This step ensures that all sectors are covered. Third, the most widely applied VVs are ranked in each sector. This helps identify commonly used VVs. Fourth, only the four VVs are candidates in each sector based on the ratings obtained in the previous step. Fifth, the optimal VVs are applied at each step. Sixth, only the four VVs are used (as long as the error is small). Previously canceled VVs continue to be discarded as long as the error remains small, ensuring accurate results. Finally, if the error is high, the previously canceled VVs are restored, and all VVs become candidates, preventing the method from failing. The flow diagram is shown in Figure 4.

3.1. Statistics Results

  • In the first sector (S1), the VVs u1, u2, u3, and u6 are the most applied, as shown in Figure 5a.
  • In the second sector (S2), the VVs u2, u3, u4, and u5 are the most applied, as shown in Figure 5b.
  • In the third sector (S3), the VVs u1, u3, u4, and u5 are the most applied, as shown in Figure 5c.
  • In the fourth sector (S4), the VVs u3, u4, u5, and u6 are the most applied, as shown in Figure 5d.
  • In the fifth sector (S5), the VVs u2, u3, u5, and u6 are the most applied, as shown in Figure 5e.
  • In the sixth sector (S6), the VVs u1, u2, u3, and u6 are the most applied, as shown in Figure 5f.

3.2. Four VVs Symmetrical Strategy (4-VVsS)

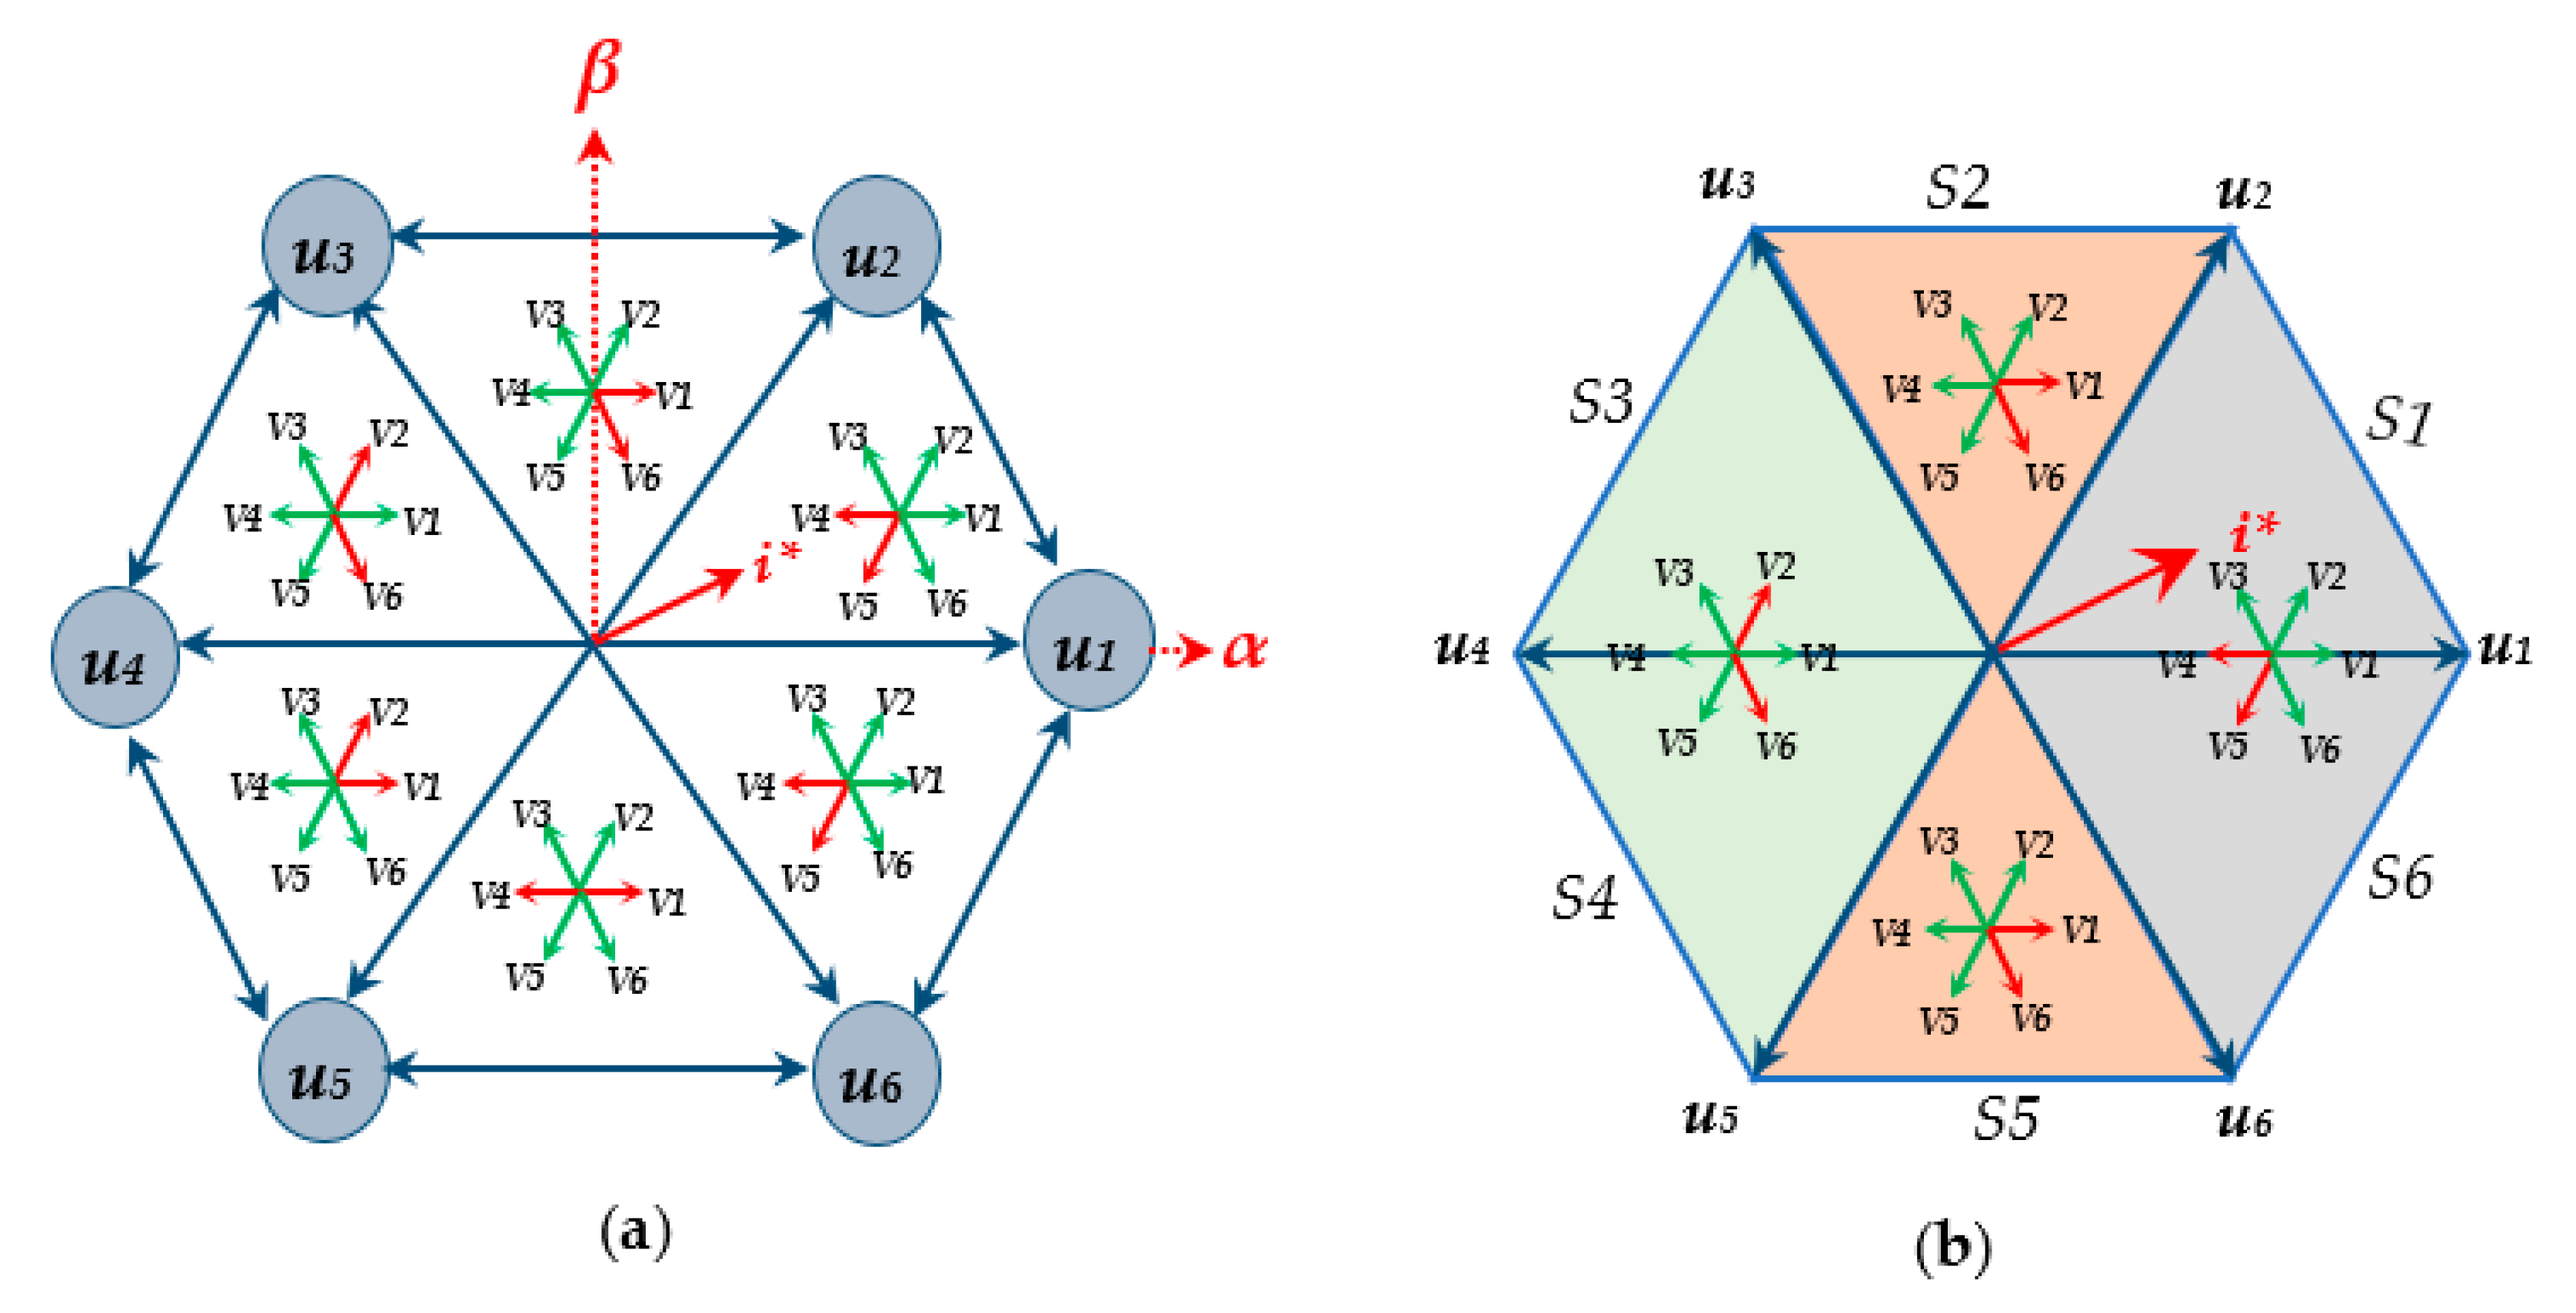
According to the 4-VVs method, the four VVs u1, u2, u3, and u6 are candidates in both sector S1 and sector S6, as shown in Figure 6a. For the second and fifth sectors, there is a significant overlap between the candidate VVs in both sectors. The VVs u2, u3, and u5 are candidates in both sectors. The difference is that u6 is a candidate in the S5 and not a candidate in the S2, while u4 is a candidate in the S2 and not a candidate in the S5. From Figure 5, it is evident that u6 and u4 are candidates with a similar proportion in the S5. Therefore, the u4 is replaced by u6 in the S5. As a result, the candidate VVs in both sectors (S2 and S5) are u2, u3, u4, and u5. And, for the sector S3 and S4, there is a significant overlap between the candidate VVs in both sectors. The VVs u3, u4, and u5 are candidates in both sectors. The difference is that u1 is a candidate in the S3 and not a candidate in the S4, while the u6 is a candidate in the S4 and not a candidate in the S3. Therefore, the u6 is replaced by u1 in the S4. As a result, the candidate VVs in both sectors are u1, u3, u4, and u5.
Table 4 illustrates the transition from the 4-VVs method to the four VVs symmetrical strategy (4-VVsS), where the symbol ‘X’ is used to indicate the selected VVs, and Figure 6b shows the space vectors for the 4VVsS strategy.
The pre-exclusion of four VVs reduces the computational burden significantly. To clarify this, the cost function depends on the reference current (i*) in order to compare it with eight VVs in the classical MPC method, meaning it needs to perform eight calculations at each step to conclude which ideal VVs to apply. As the reference current (i*) is compared only with the four VVs in the two proposed methods (4-VVs, 4-VVs-S), meaning that the proposed methods need to perform only four calculations in each step, the computational burden is thus reduced by half. This gives the possibility of reducing the step time (Ts) to improve the overall performance of the system.

4. Simulation Results

In this section, to demonstrate the effectiveness of the proposed 4-VVs and 4-VVsS methods, simulations of the 8-VVs conventional strategy and the proposed two strategies, 4-VVs and 4-VVsS, were carried out. Simulations were established in MATLAB/Simulink in order to verify the effect of the proposed MPC method for the reduction in the CMV. The simulation time was set to 0.2 s, the amplitude of the output reference current was lowered from 2 to 1 A, and the reference frequency remained constant at f = 50 Hz.
The results presented in Figure 7 demonstrate the CMV values achieved when various strategies, including the 8-VVs, as well as the methods proposed in this paper, are implemented. Figure 7a shows a simulation of the CMV when using the conventional MPC method. Due to the existence of zero vectors, the inverter output common-mode voltage can be achieved at Vdc/2. The latter not only causes additional power losses, but also threatens the safe and stable operation of the grid. Figure 7b,c shows the results of the CMV when the proposed strategies 4-VVs and 4-VVsS, respectively, are implemented. The CMV is reduced to the lowest possible value of Vdc/6. This result indicates that the proposed strategy effectively mitigates the effect of the CMV, leading to an improved performance compared to the conventional method.
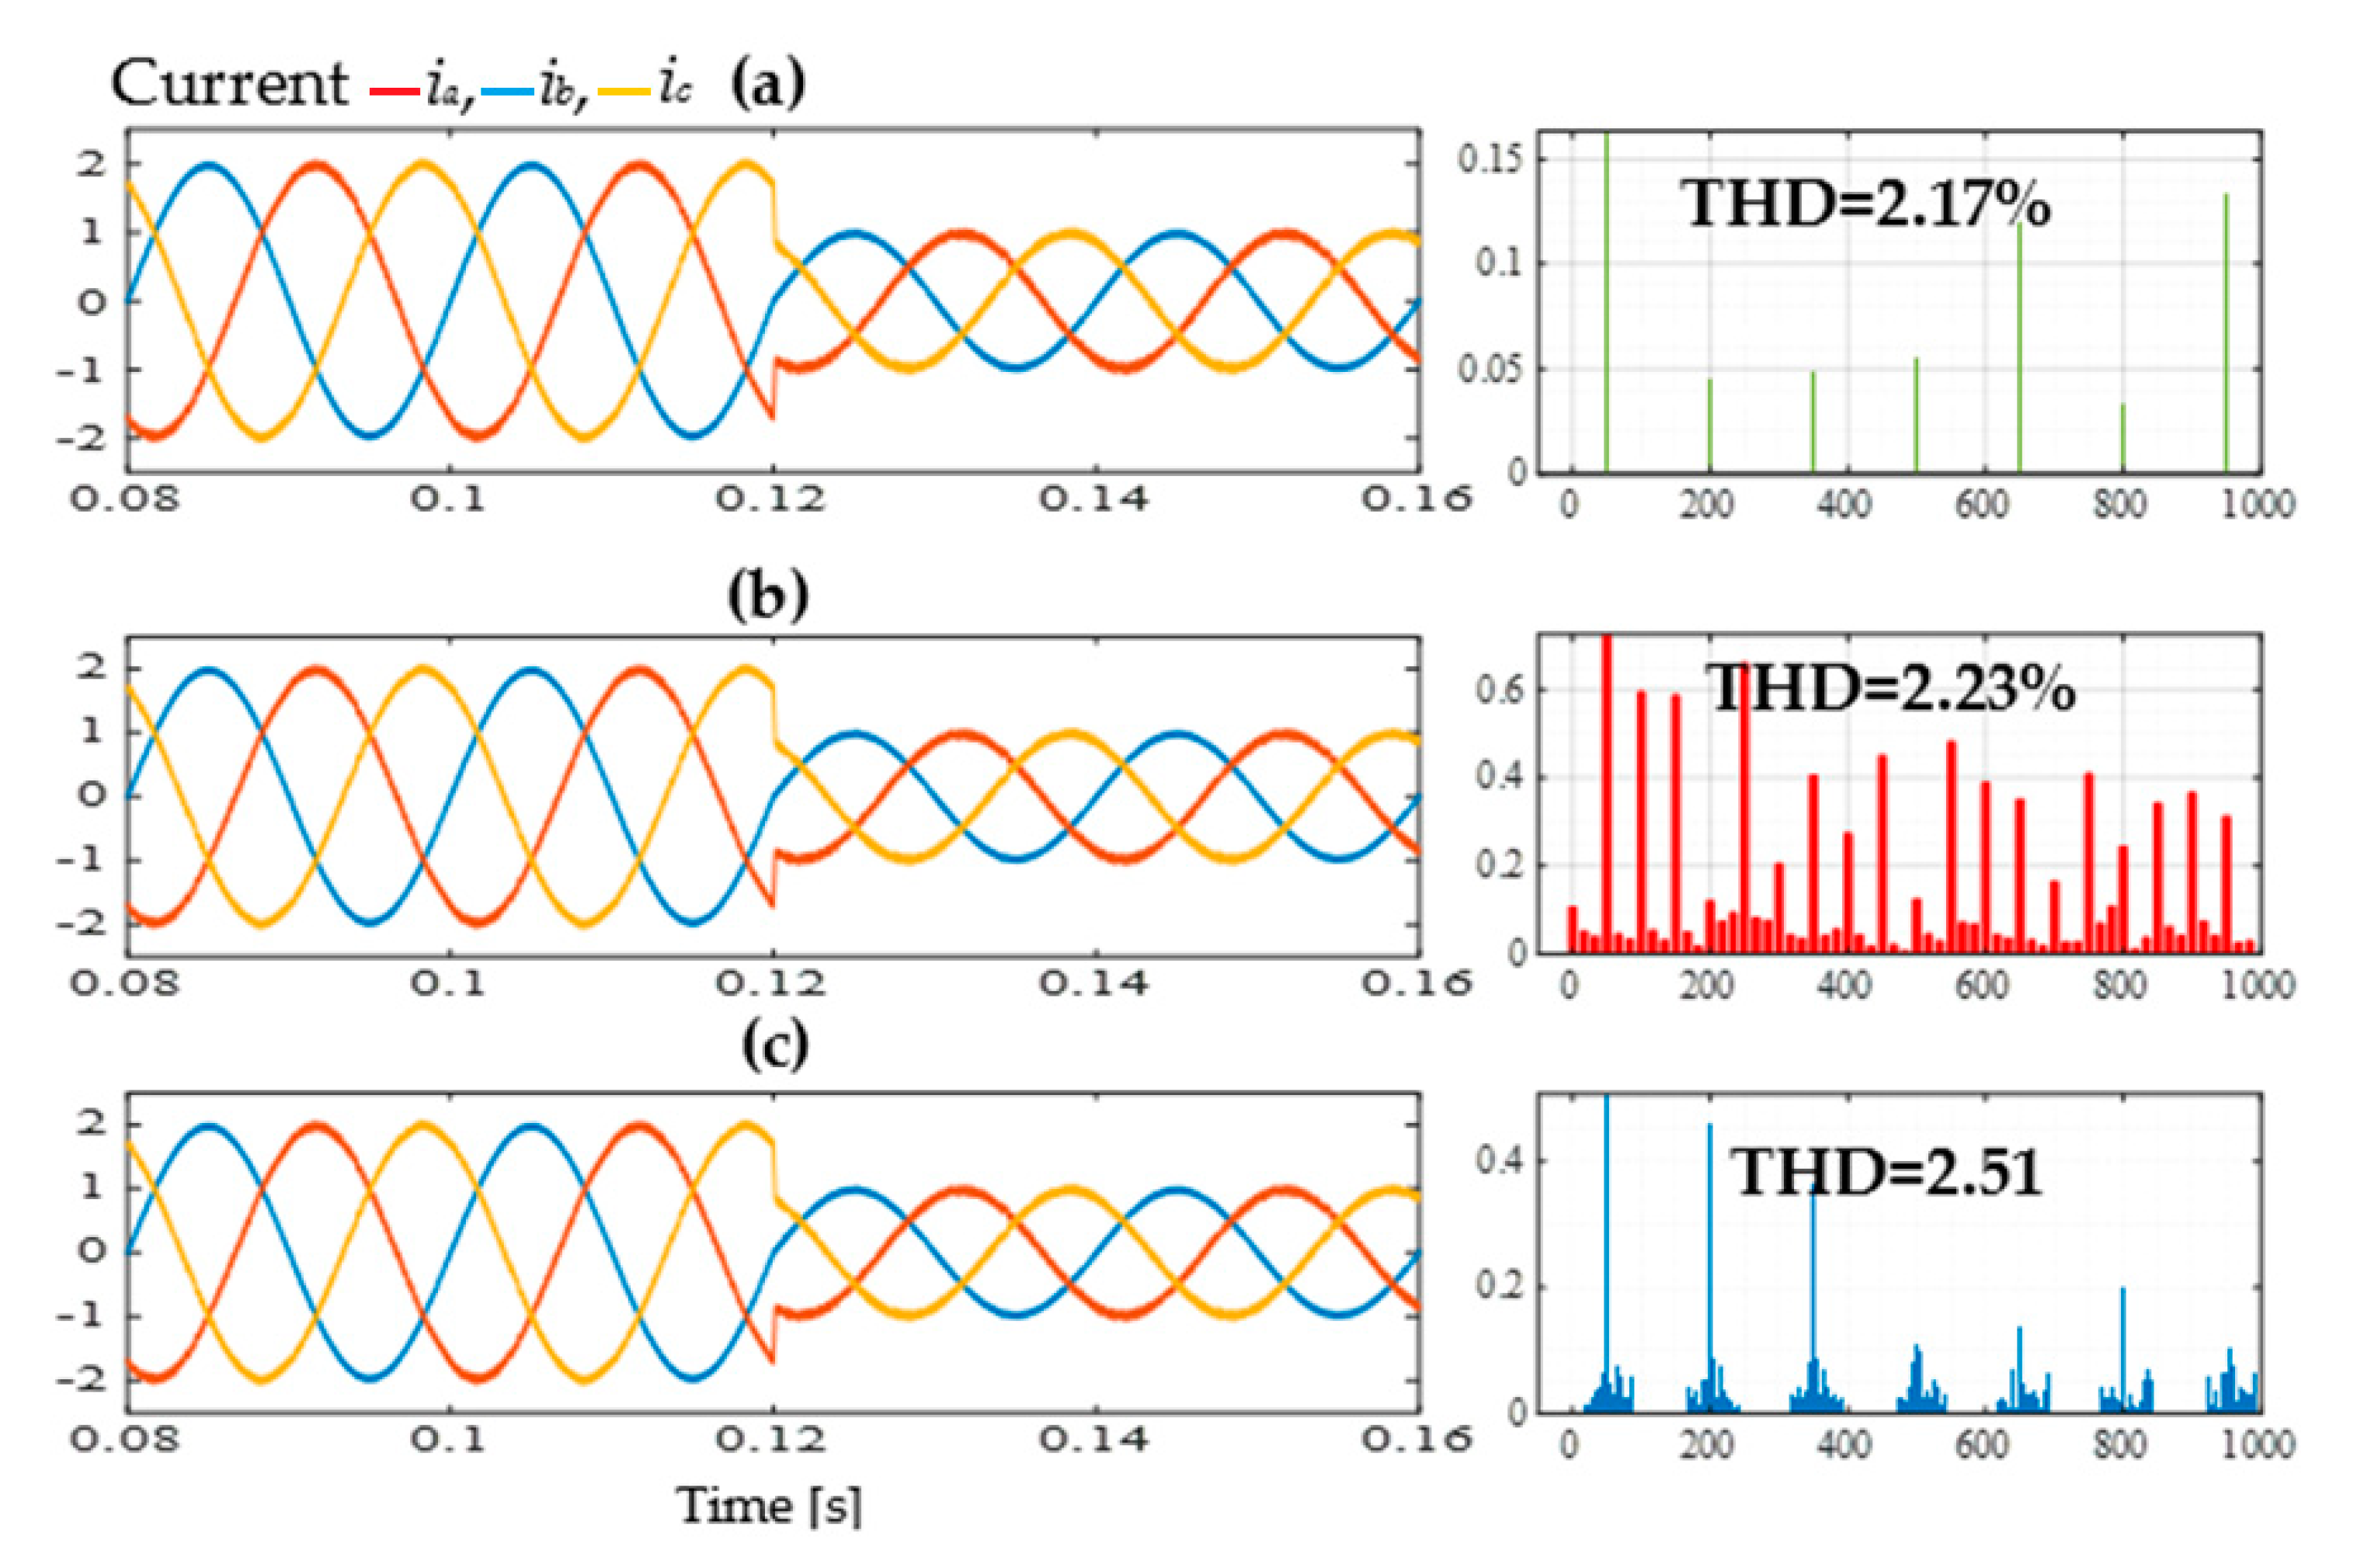
Figure 8a–c illustrates the outcomes of the output current while implementing the proposed strategies (4-VVs and 4-VVsS). Figure 8a presents the output current when the classical MPC strategy is applied, serving as a basis for comparison. The results clearly indicate the favorable performance of all strategies, both under normal operating conditions and when the drawn current is halved at 0.12 s. The same figure also indicates the THD, where the proposed strategies (4-VVs and 4-VVsS) achieve good performance. It confirms that the current is sinusoidal and the current generated by the THD complies with the IEEE 519 harmonic sard.

5. Experimental Evaluations

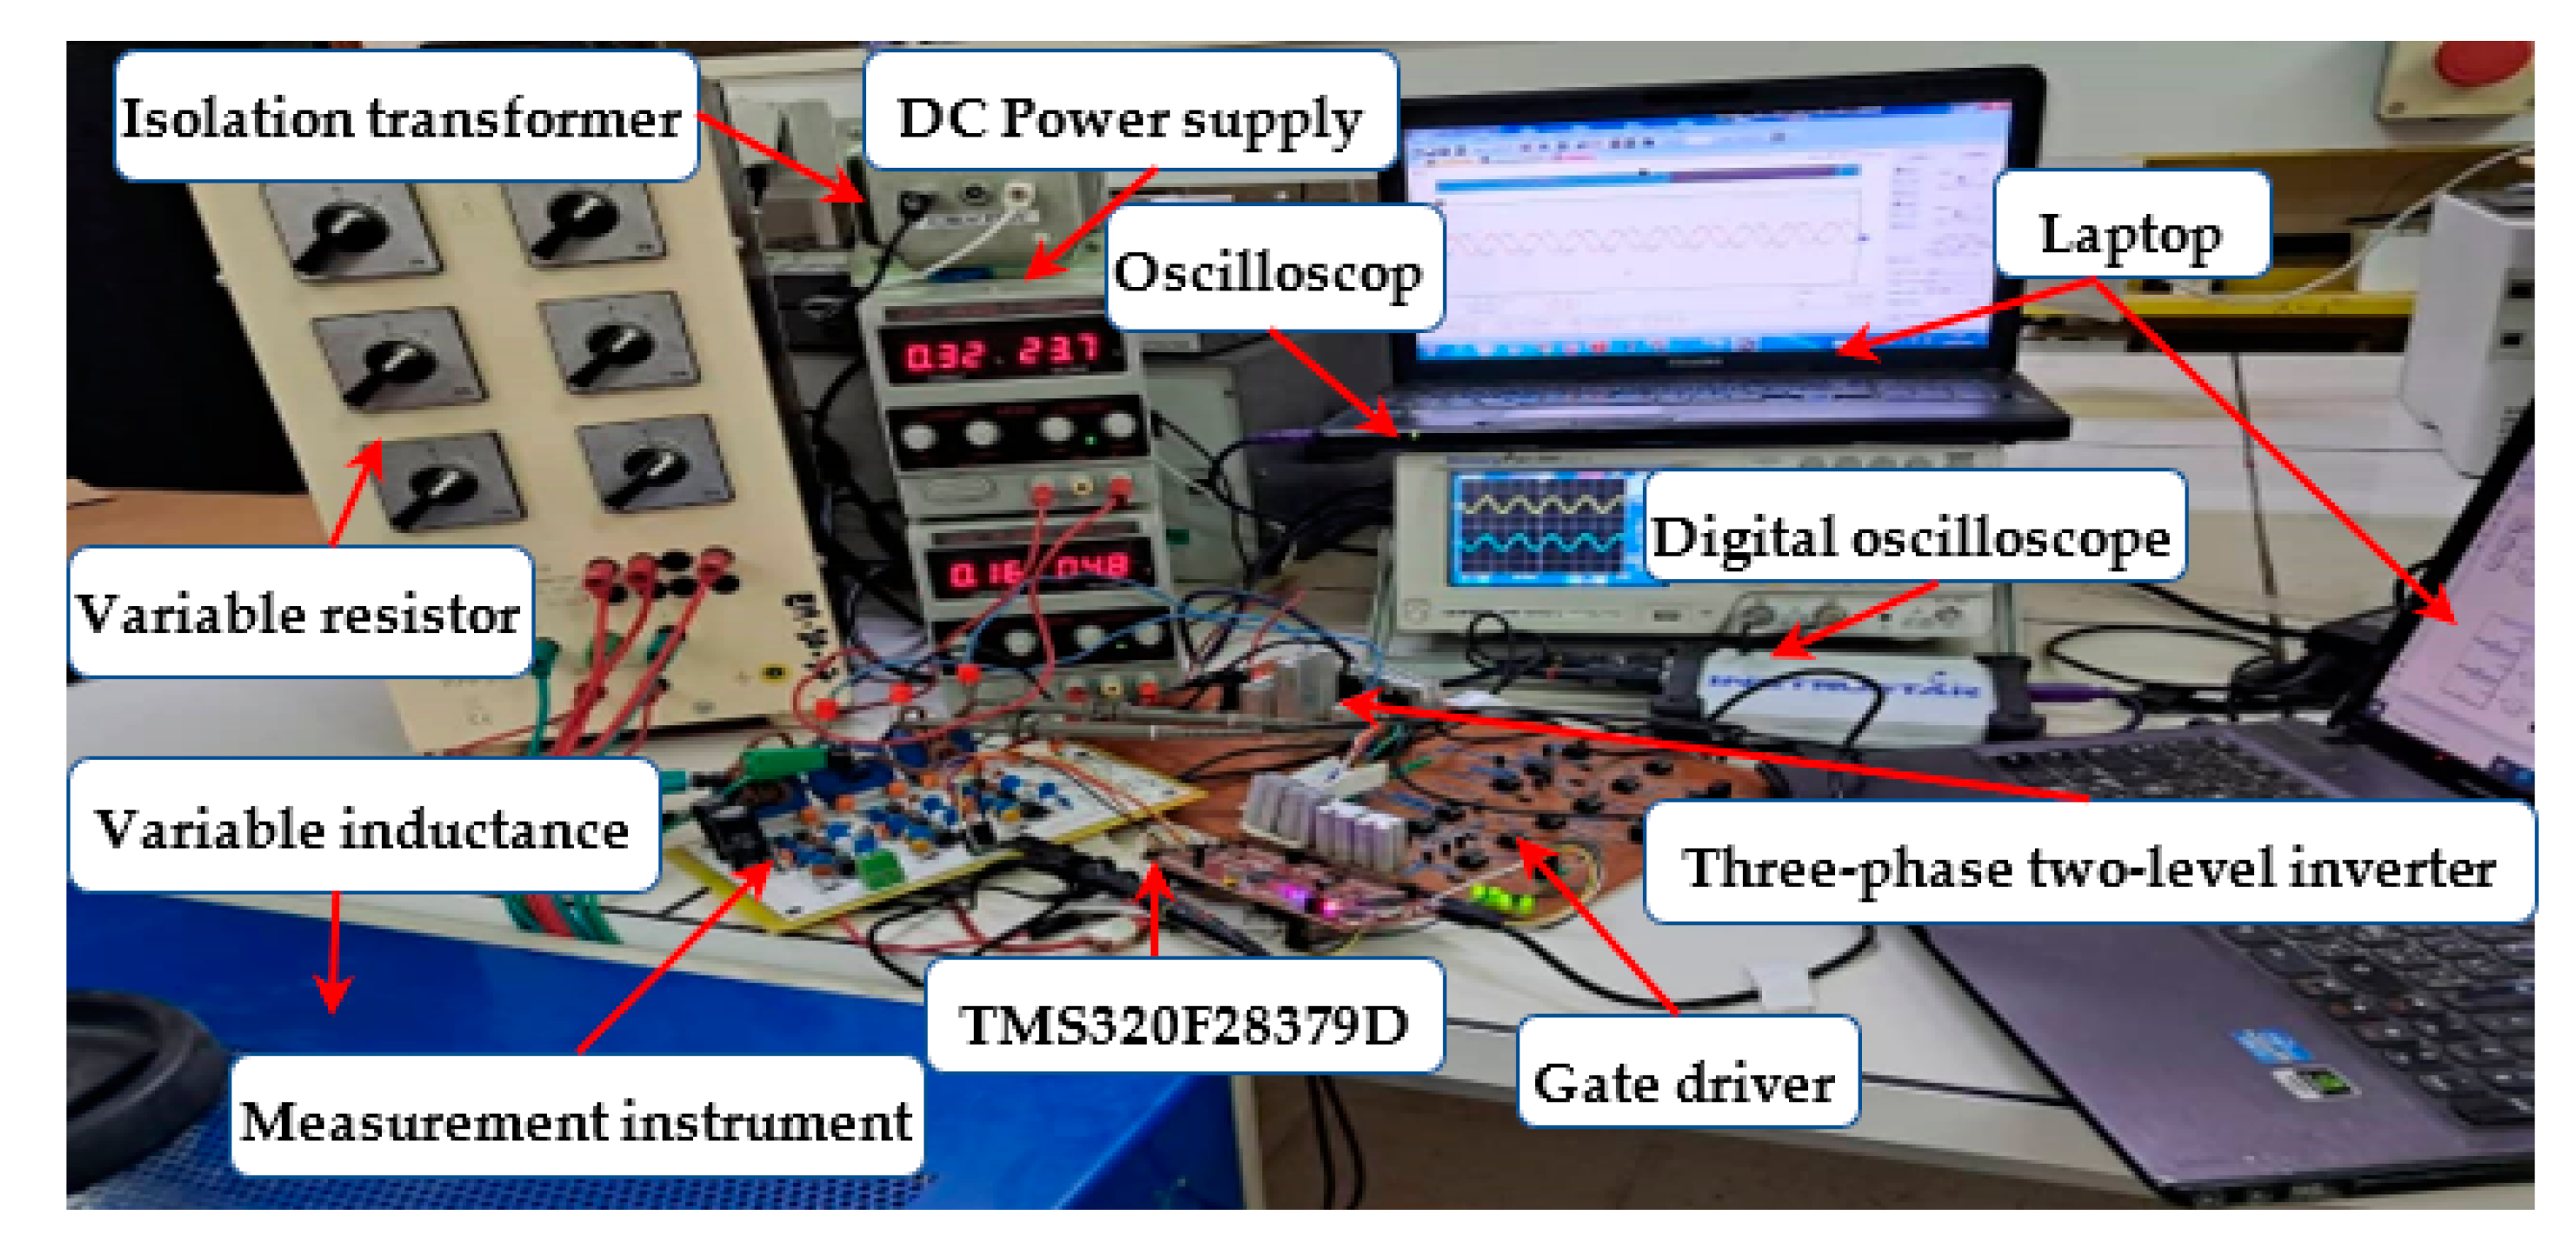
In this section, the performances of the conventional and the two proposed MPC methods (4-VVs and 4-VVsS), for the three phases two-level inverter, are illustrated through experimental results. The experimental test bench that was used includes a three-phase two-level inverter powered by a DC power supply feeding an R-L load. The inverter is built using six FGH40N60 MOSFETs. The DS1104 board built around the Texas instruments TMS320F28379D digital processor (DSP) is used to implement the competing MPC controllers, and the sampling period of the control system is set as 100μs. The switching signals of the IGBT switching devices are generated using three digital outputs from the dSPACE, and only one signal is used for each leg of the inverter when using the gate driver based on the IC IR2104. However, by utilizing this gate driver, two signals are created based on one control signal, one for the high side and the other for the low side. Additionally, a dead time is implemented to introduce a delay between the switching of the high side and low side signals. Three LEM LA-25P current transductions are used to sense the inverter output phase currents. Figure 9 shows the experimental setup, and Table 5 lists main experimental parameters.

5.1. Steady-State Performance

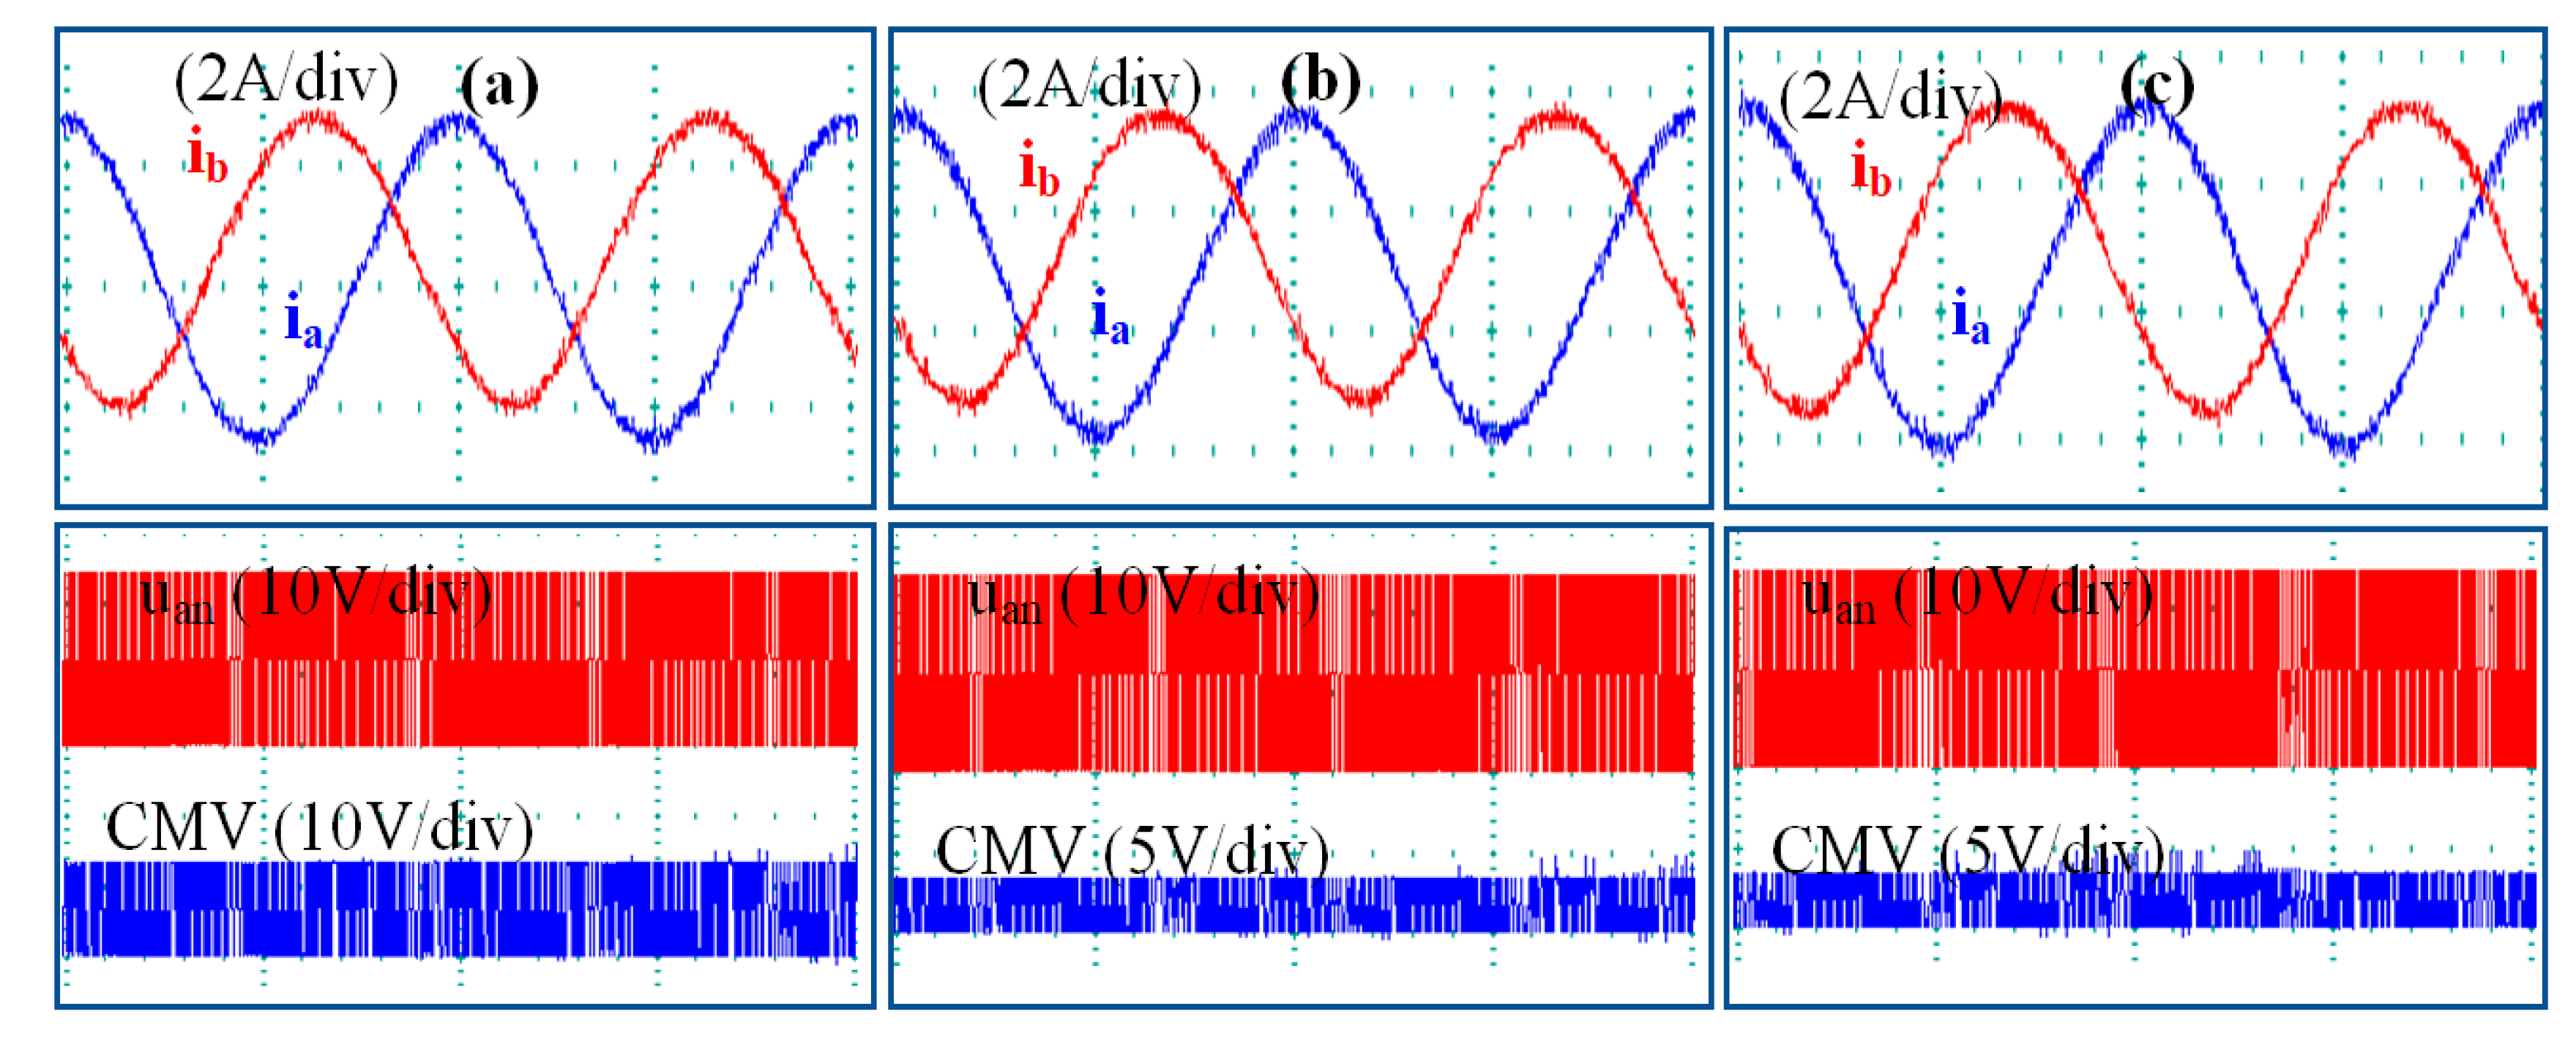
The steady-state performance of the proposed method is tested, as shown in Figure 10 and Figure 11. In Figure 10, the output frequency is set to 50 Hz with iload equal to 2 A. In Figure 11, the output frequency is set to 25 Hz with the same current. Figure 10 demonstrates that the current ripples observed in the proposed strategies closely resemble those obtained from the 8-VVs strategy, as illustrated in Figure 10b,c and Figure 11b,c. This correspondence substantiates the validity of the proposed pre-selection method, and is based on the statistical analysis that was performed. Furthermore, the outcomes depicted in Figure 11 indicate that the two proposed strategies outperform the conventional strategy, as evidenced by the more pronounced waveform in Figure 11a. This finding serves to confirm the overall soundness and efficacy of the proposed method. As shown in Figure 10a and Figure 11a, the application of Z-VVs in the conventional strategy increases the CMV up to ±Vdc/2. The corresponding RMS values for the CMV are 12 V and 12.4 V, respectively. On the contrary, the proposed four VVs strategy effectively limits the CMV within ±Vdc/6, as can be seen in Figure 10b,c and Figure 11b,c. Despite not utilizing the zero vectors (V0 and V7), it can be observed that there are CMV spikes around ±Vdc/2 in Figure 10b,c, due to the dead time effects not being considered. However, the investigation presented in the paper by [35] thoroughly examined and efficiently resolved the dead time effect, where the CMV was reduced and restricted at Vdc/6.

5.2. Dynamic Performance

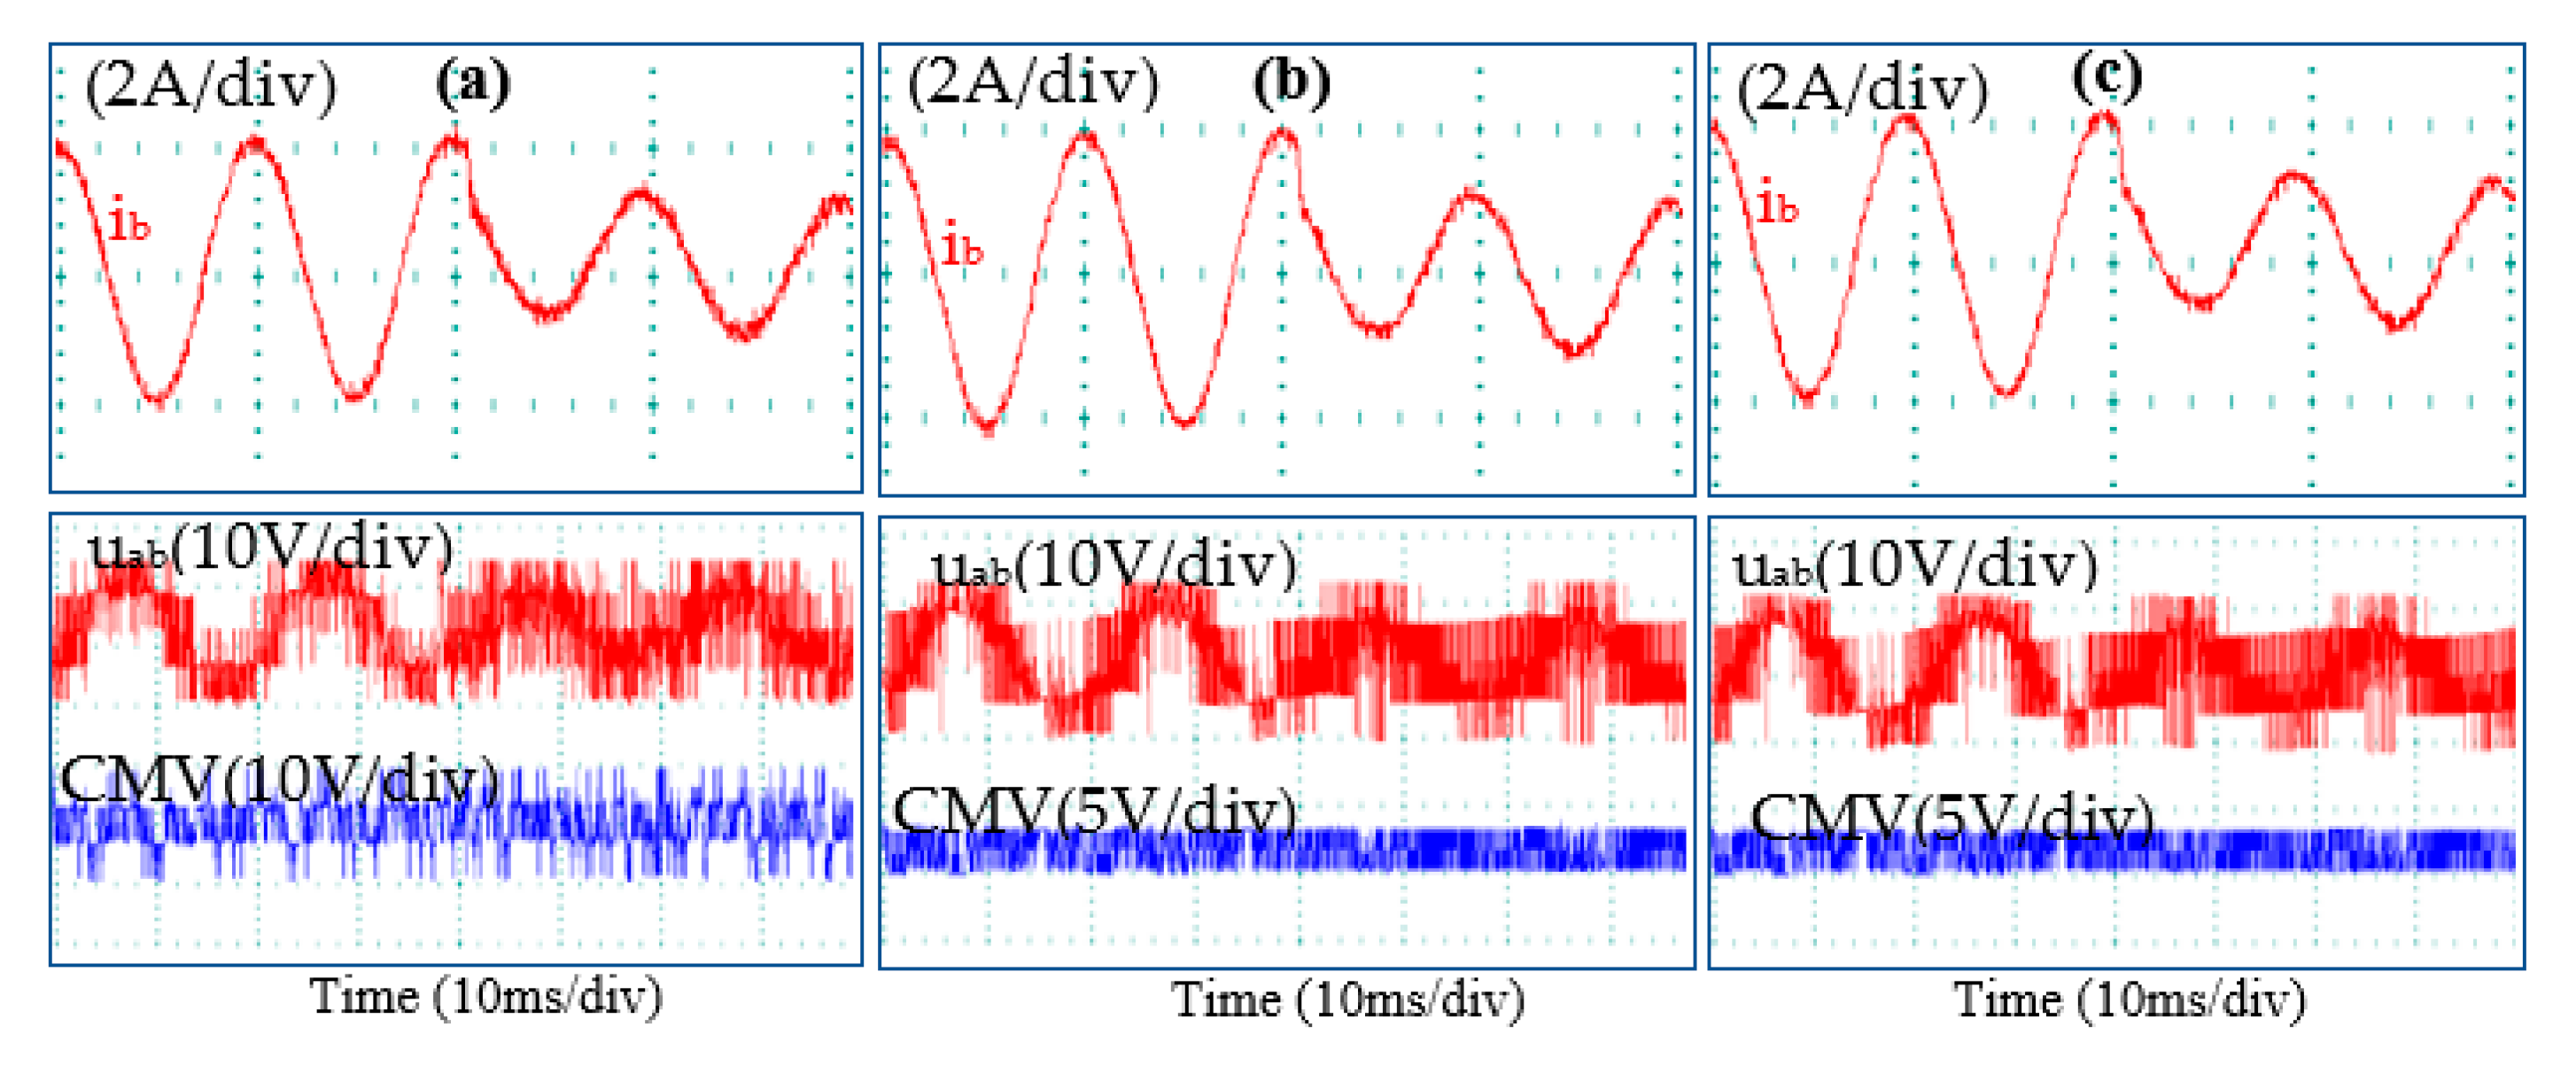
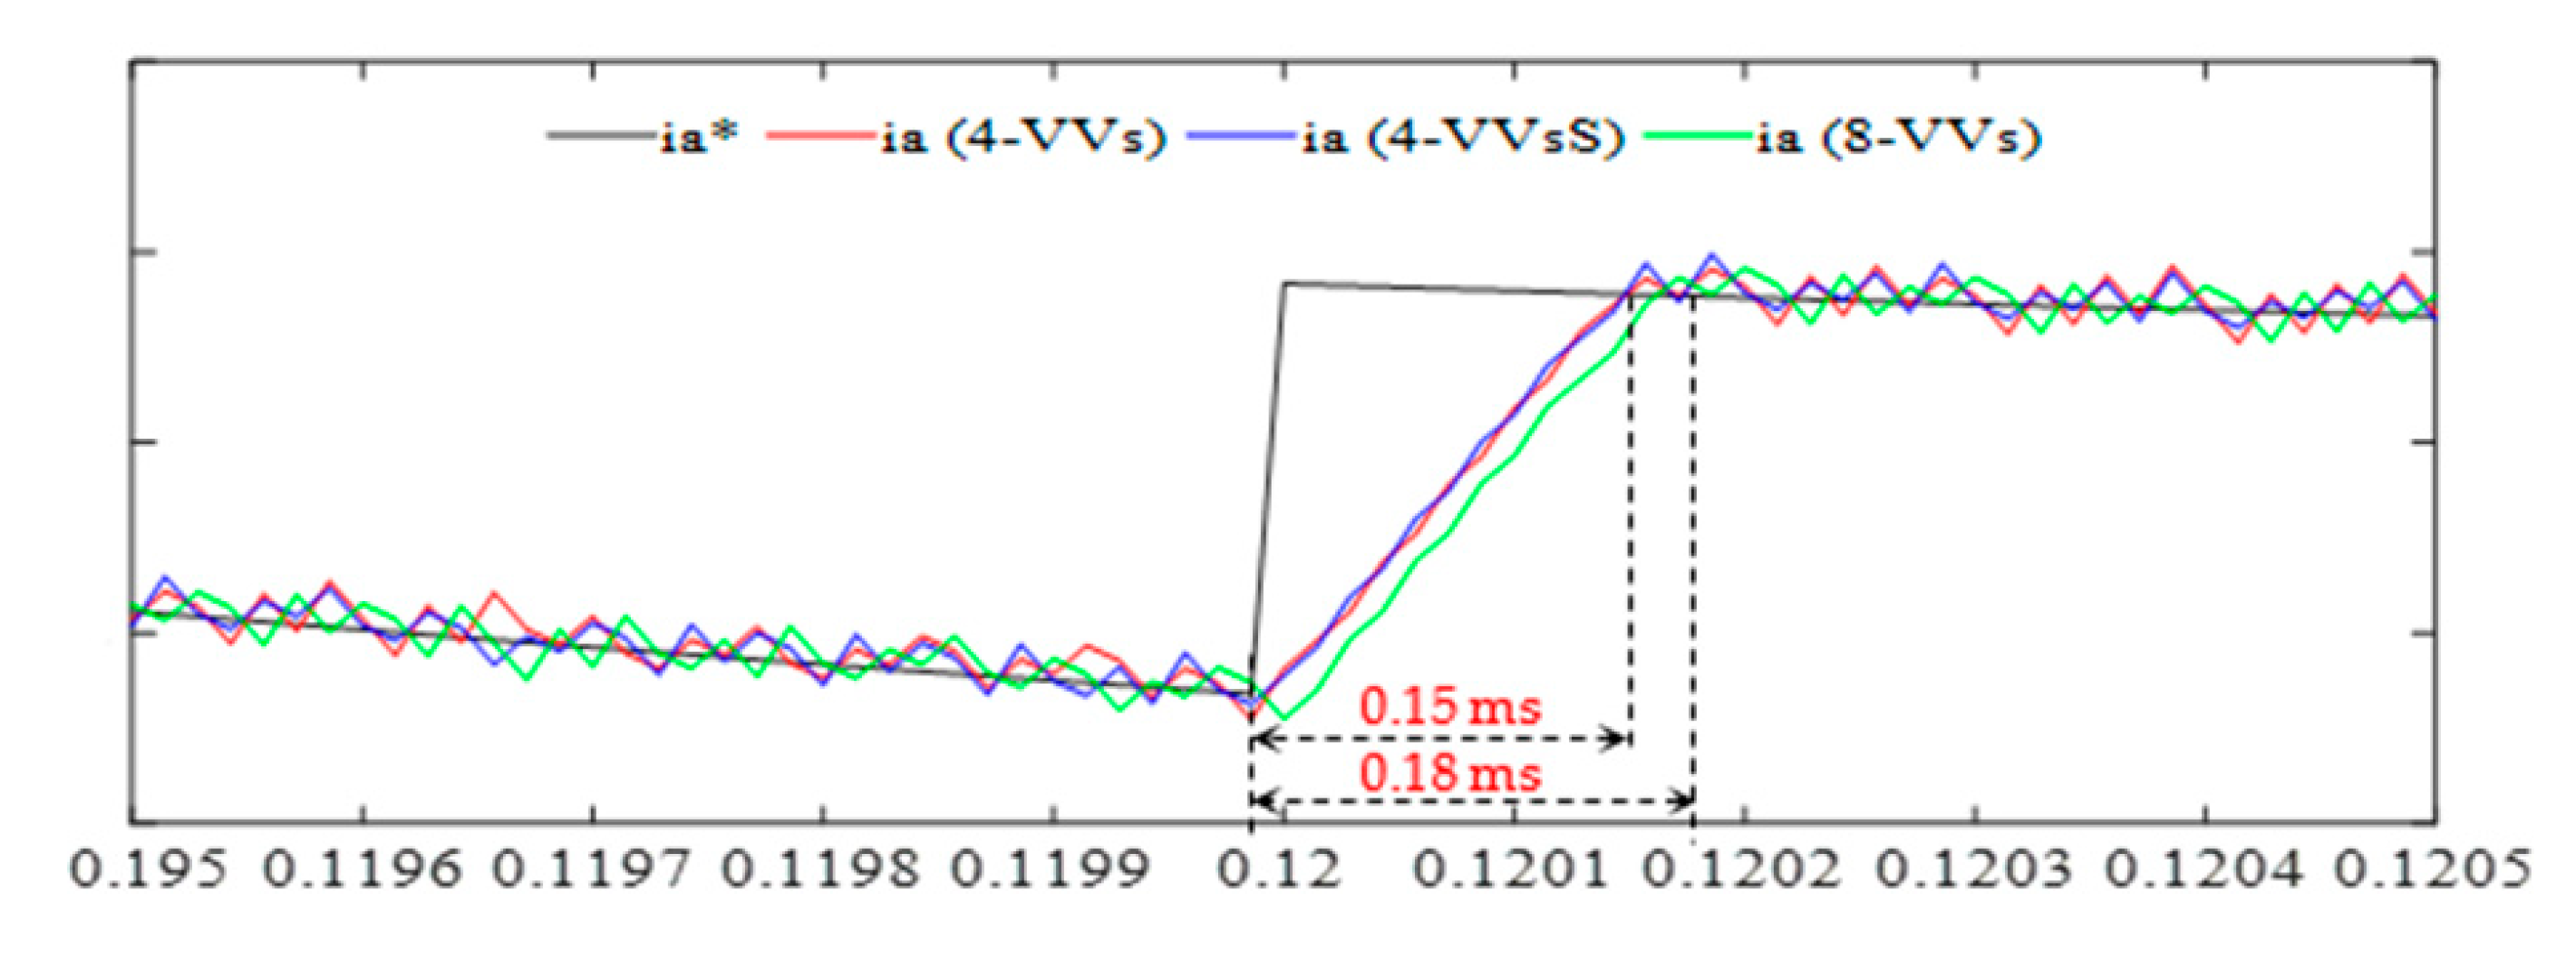
To investigate the transient behavior of the three strategies (8-VVs, 4-VVs, and 4-VVsS), the conventional and proposed algorithms were analyzed under various test conditions. Figure 12 displays the output current waveforms (ia) of the 2L-VSI. The results indicate that the proposed predictive controllers (4-VVs and 4-VVsS) exhibit excellent dynamic performance across different dynamic conditions, during which the reference current experiences sudden increases or decreases. Additionally, the predictive database controllers demonstrate similar dynamic performance, characterized by fast responses without compromising the system. The response time for the two proposed methods was 0.15 milliseconds, while the response time for the traditional method was 0.18 milliseconds. Both proposed methods consistently achieve synchronized output currents of high quality. Figure 13 displays the response speed of the proposed strategies.

6. Performance Tests

In order to ensure the efficacy of the proposed method, the performance of the inverter is tested under different conditions. This is performed by suddenly changing the parameters. THD of the output current is selected as the performance indicator.
Furthermore, the root mean square (RMS) current error is chosen because it is suitable for precisely evaluating how the real current follows the reference current instantaneously. Moreover, it can be calculated as follows:
RMSe = T i T f ( i * ( t ) i ( t ) ) 2 dt T f T i
where i*(t) is the reference current, i(t) is the measured current, and Tf and Ti are the higher and lower boundaries for the time interval chosen, respectively.

6.1. Switching Frequency

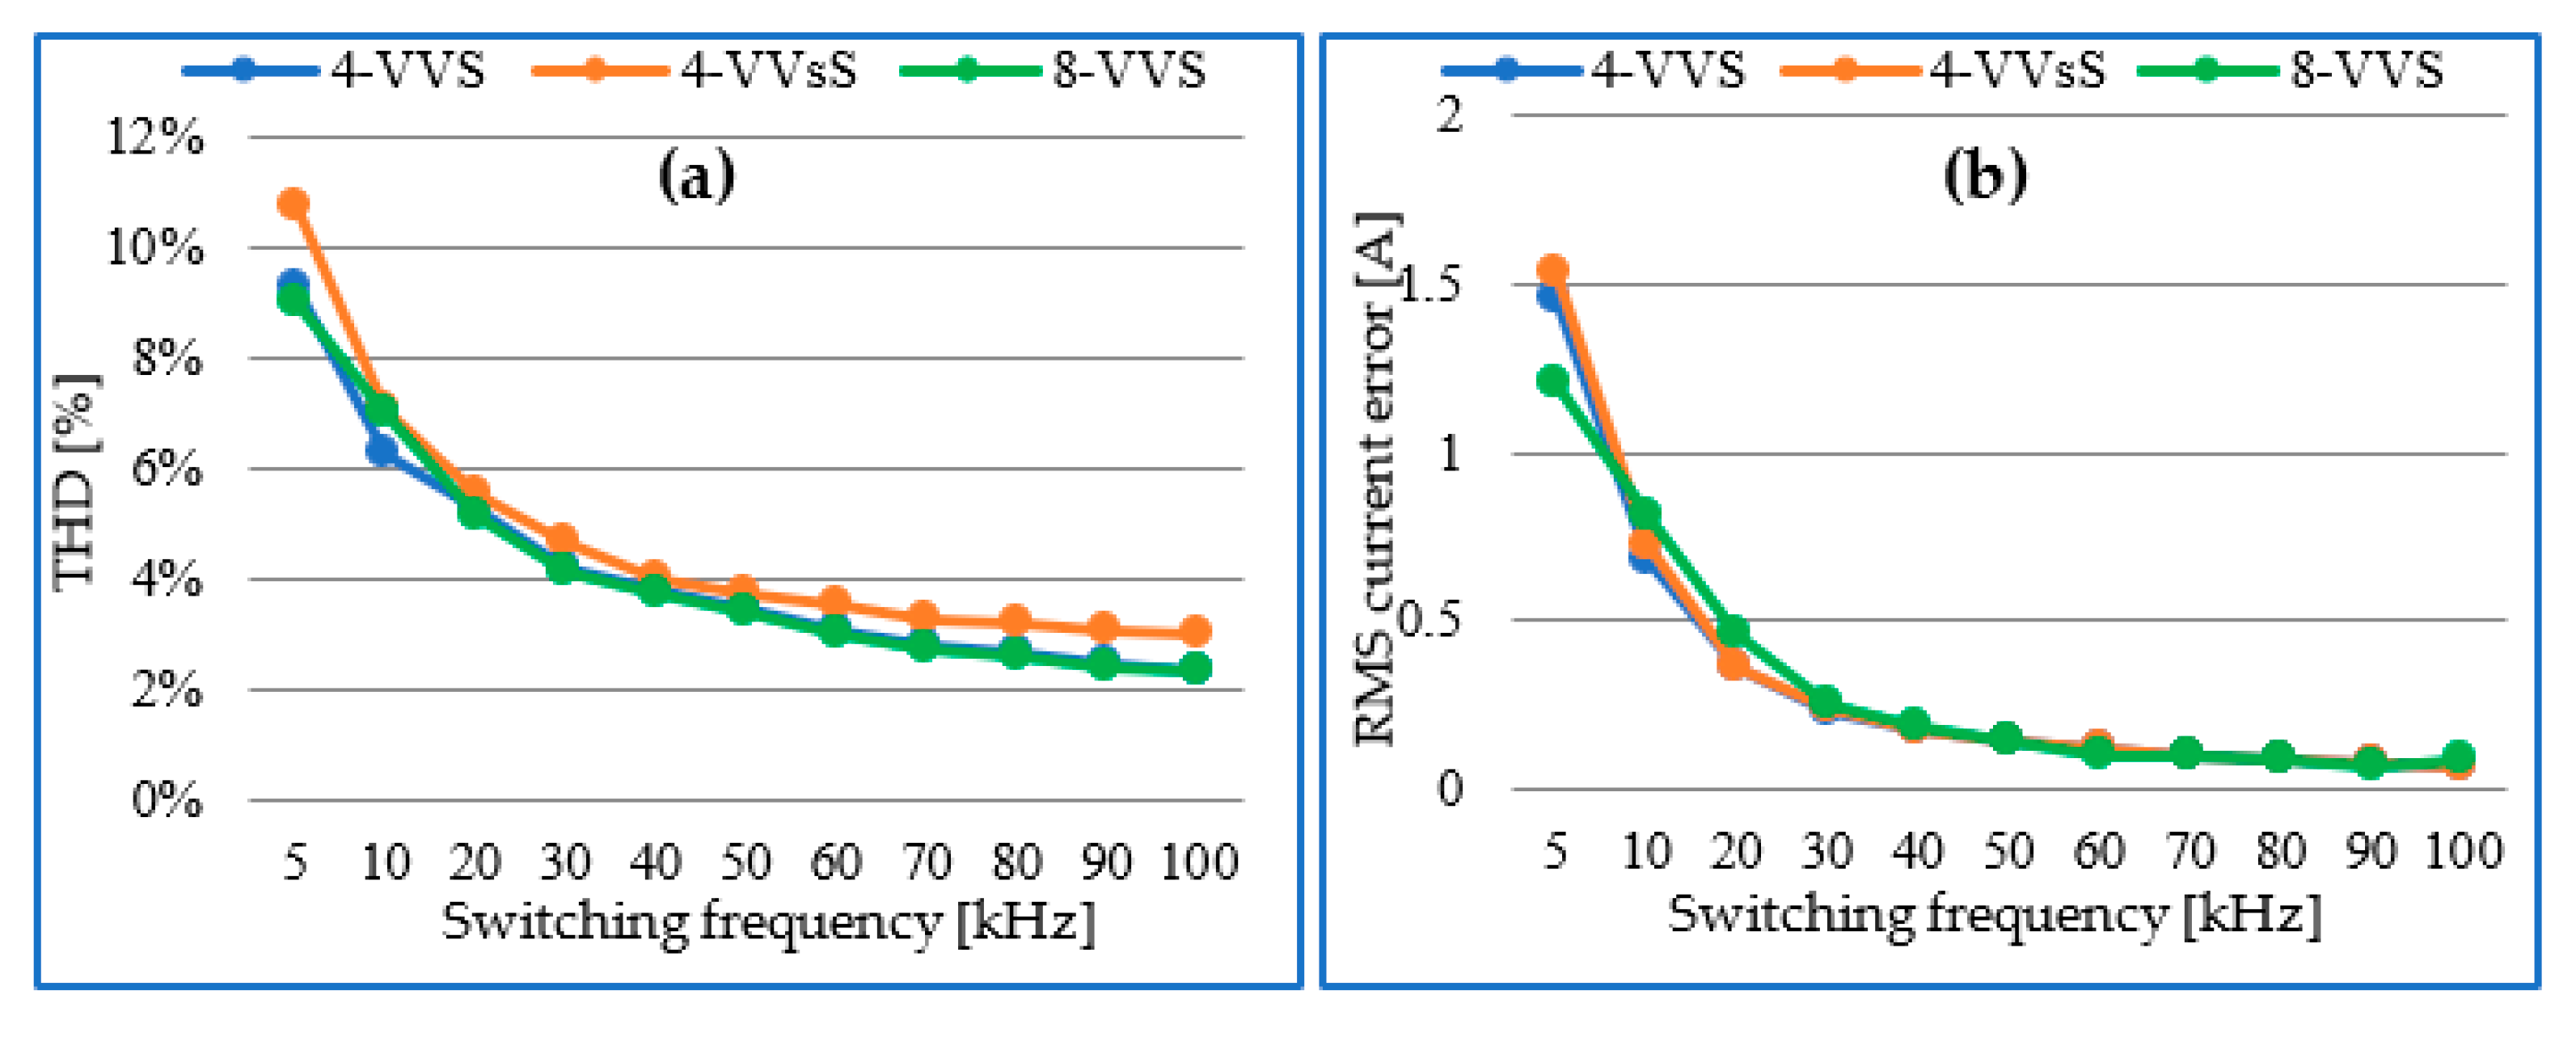
The impact of the switching frequency was examined across various strategies. Figure 14a illustrates the influence of altering the switching frequency on the THD for both proposed strategies and the conventional approach. The strategies’ efficacy was evaluated by modifying the switching frequency within the range of 10 to 100 kHz. It is evident that augmenting the switching frequency enhanced the performance of the proposed strategies, rendering them comparable to the traditional method. Notably, when the switching frequency reached 50 kHz, the outcomes were similar across all strategies. This characteristic underscores the strength of the proposed strategy, as it possesses the capability to achieve higher switching frequencies compared to the traditional method, attributable to its reliance on a mere four (04) candidate vectors, as opposed to the conventional method of eight (08) candidate VVs.
Furthermore, the switching frequency significantly impacts the RMS current error. Figure 14b illustrates the effect of increasing the switching frequency in the RMS current error. At a switching frequency of 40 kHz, the proposed strategies exhibit similar performance to the traditional strategy.

6.2. Inductance Variations

The performance of the proposed technology was evaluated through testing. It is anticipated that abrupt changes in inductance would impact the performance of the 2L-VSI. Consequently, the inverter performance was examined by being subjected to varying inductance changes ranging from −50% to 50%. The test results, as shown in Figure 15a, indicate that the THDs are influenced by the fluctuations in inductance. An increase in the inductance value leads to a reduction in the THD because the inductance acts as a low-pass filter. The proposed strategy demonstrates comparable performance to that of the traditional strategy. Regarding the effect of the RMS current error on the change in inductance, we observed that the proposed strategy shows good performance (Figure 15b), although the conventional strategy outperforms it. It is worth noting that as the inductance value increases, the performance of both strategies becomes similar, and the RMS current error value is limited between 100 and 700 mA.

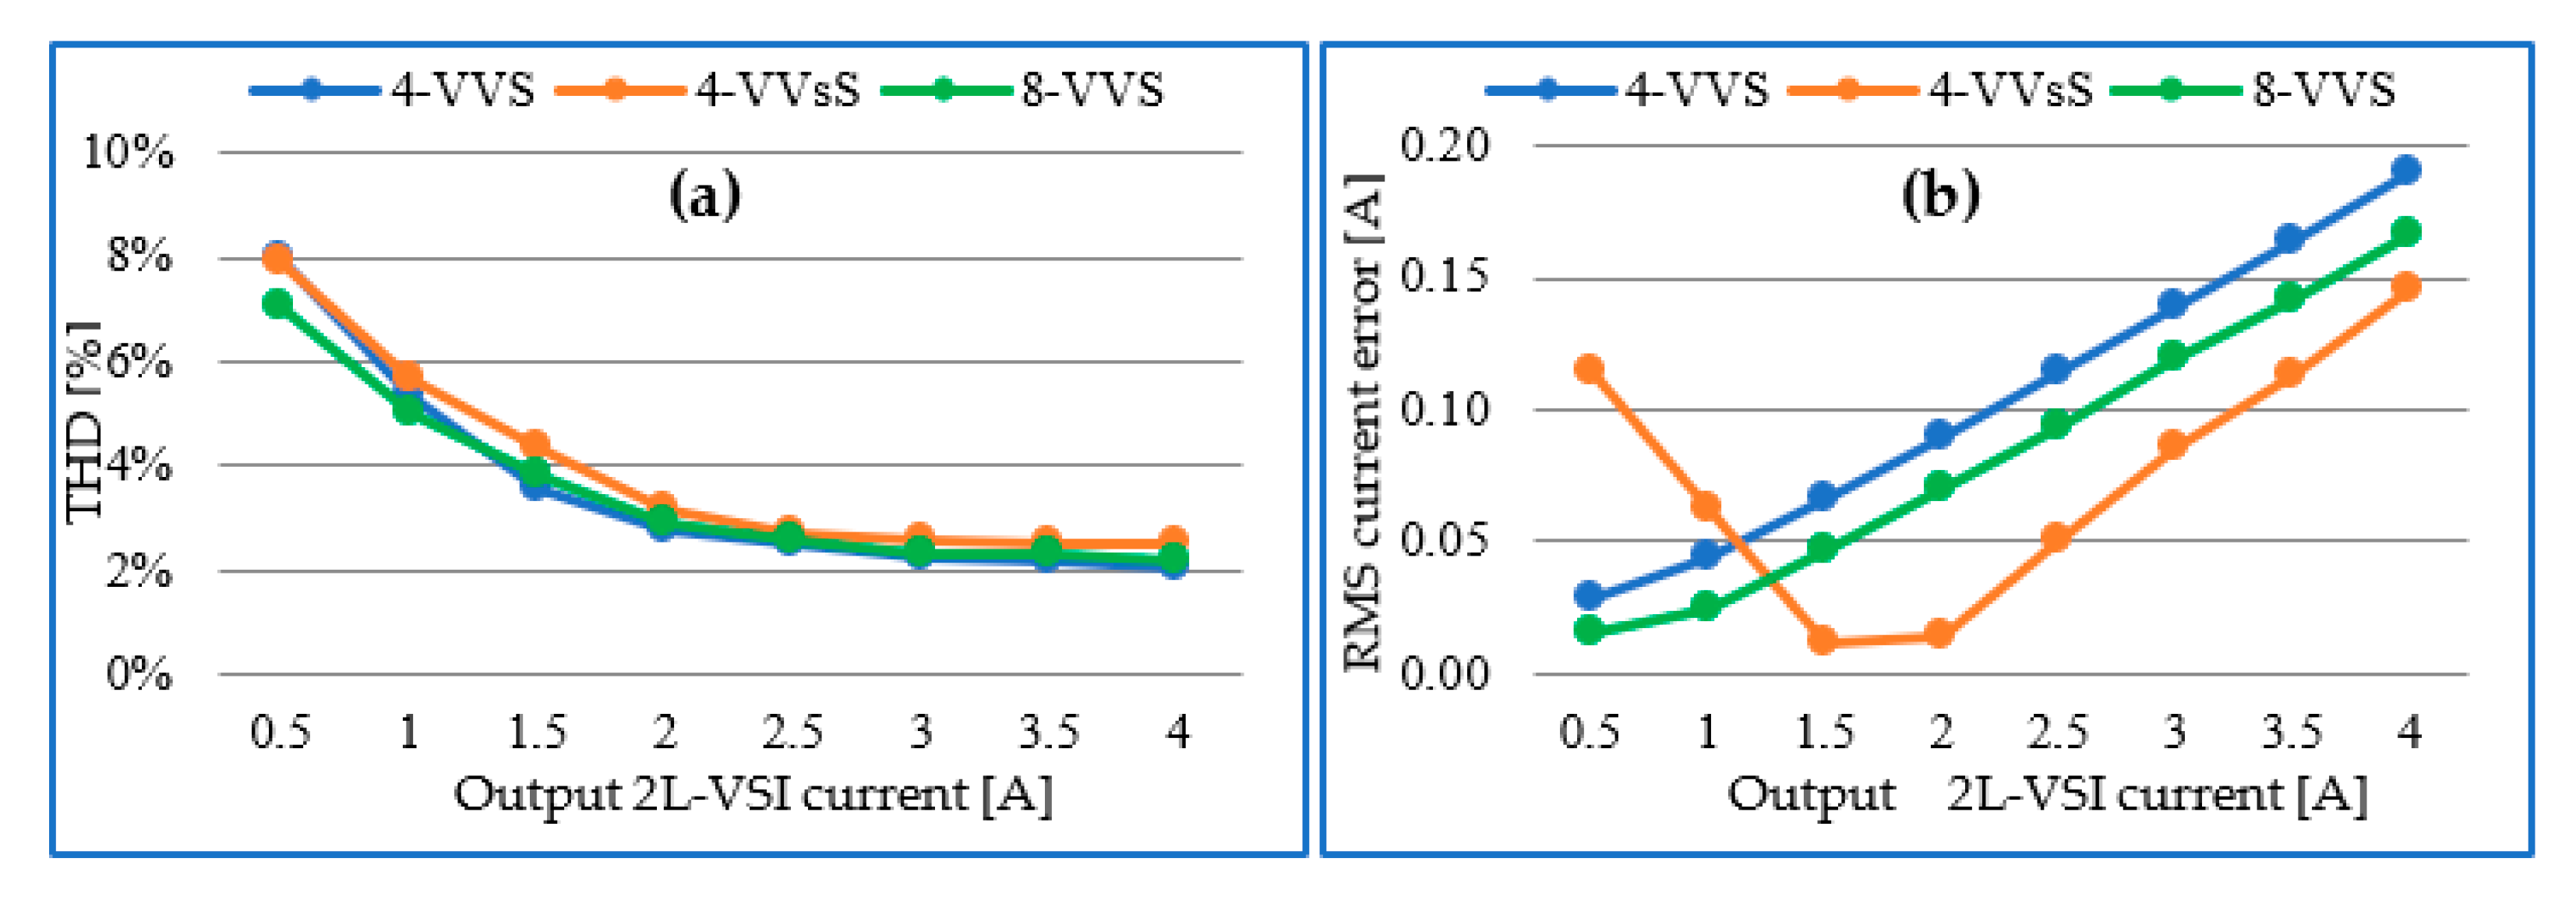
6.3. Output 2L-VSI Current Variation

To evaluate the performance of different strategies for the 2L-VSI, a series of experiments were conducted. These experiments involved varying the current drawn from the 2L-VSI, ranging from 0.5 to 5 A, and assessing the impact on the THD and RMS current error. Figure 16a illustrates a reduction in the THD as the drawn current from the 2L-VSI increases, indicating that the strategies effectively minimize the THD. However, in relation to the RMS current error, an increase in the drawn current exhibits a negative effect, as depicted in Figure 16b. The RMS current error value increases with the rise in the drawn current. Nonetheless, it remains within acceptable limits and does not give rise to significant issues.

7. Conclusions

In this paper, a modified MPC technique is presented to reduce the computational burden for a two-level 2L-VSI by shrinking the candidate VVs in each sector. After excluding Z-VVs, statistical operations are employed using a specially designed algorithm to classify the applied VVs at each step. Then, only four NZ-VVs are considered as candidates, instead of the six NZ-VVs in the modified conventional MPC methods. The exclusion of Z-VVs reduces the undesired CMV, thereby providing a theoretical foundation for the design of the proposed method.
Subsequently, the impact of excluding the least applied VVs on the performance of the proposed strategy is investigated. Based on the statistical results of the proposed strategy (4-VVs), a second strategy (4-VVs) is developed. This new strategy divides the clips into only three sections, in contrast to the traditional approach with six sections. The primary goal of this strategy is to reduce the computational burden and minimize the CMV. Compared to the conventional MPC strategy, the proposed method significantly reduces the computational burden, leading to an increased efficiency of the 2L-VSI inverter while maintaining an acceptable THD ratio. This strategy allows the inverter output to be tuned according to the grid frequency, phase, and voltage, ensuring synchronization with the grid. As a result, photovoltaic systems can be safely and efficiently integrated into the existing energy system. By matching the characteristics of the grid, the proposed strategy ensures that the electricity produced by the photovoltaic system is compatible with the grid, enabling smooth operation and efficient utilization of the generated energy. This synchronization is crucial for the reliable and safe integration of photovoltaic systems into the broader energy infrastructure.
Simulation results and experiments were carried out. These are in perfect agreement and verify the effectiveness and the advantages of our proposed strategy.

Author Contributions

Conceptualization, L.M.; Methodology, L.M., M.H., C.L., K.S. and M.B.; Validation, M.H., C.L., K.S. and M.B.; Formal analysis, L.M., M.H., C.L., K.S. and M.B.; Investigation, L.M.; Writing—original draft, L.M. and C.L.; Writing—review & editing, M.H. and K.S.; Visualization, K.S. and M.B.; Project administration, M.B. All authors have read and agreed to the published version of the manuscript.

Funding

This research received no external funding.

Data Availability Statement

Not applicable.

Conflicts of Interest

The authors declare no conflict of interest.

References

  1. Zhao, R.; Wang, C.; Loh, P.C.; Yan, Q.; Xu, H.; Blaabjerg, F. A practical core-loss estimation method for three-phase three-level grid-connected inverters. IEEE Trans. Power Electron. 2019, 32, 6447–6462. [Google Scholar] [CrossRef]
  2. Abdulrahim, A.; Shokry, M. Efficient Implicit Model Predictive Control of Three-Phase Inverter with an Output LC Filter. J. Comput. Control Eng. 2021, 51, 28–38. [Google Scholar]
  3. Shao, S.; Li, J.; Li, Y.; Liu, Y. Modeling and control of a grid-connected photovoltaic system based on a three-phase voltage source inverter. IEEE Trans. Ind. Electron. 2015, 62, 7008–7018. [Google Scholar]
  4. Guo, L.; Jin, N.; Li, Y.; Luo, K. A Model Predictive Control Strategy with Sliding Mode Observer for Grid-Connected Inverter. IEEE Trans. Power Electron. 2015, 30, 6203–6213. [Google Scholar]
  5. Gui, Y.; Wang, X.; Wu, H.; Blaabjerg, F. Voltage Modulated Direct Power Control for a Weak Grid-Connected Voltage Source Inverters. IEEE Trans. Power Electron. 2019, 34, 11383–11395. [Google Scholar] [CrossRef]
  6. Yang, L.; Xia, Y.; Cai, X. Control strategies of grid-connected inverter systems with LCL filters: A review. IEEE Trans. Power Electron. 2016, 31, 3585–3603. [Google Scholar]
  7. Komurcugil, H.; Bayhan, S.; Abu-Rub, H. Variable- and fixed-switching-frequency-based hcc methods for grid-connected vsi with active damping and zero steady-state error. IEEE Trans. Ind. Electron. 2017, 64, 7009–7018. [Google Scholar] [CrossRef]
  8. Viswadev, R.; Arjun, M.; Ramana, V.V.; Venkatesa perumal, B.; Mishra, S. A novel AC current sensorless hysteresis control for grid-tie inverters. IEEE Trans. Ind. Electron. 2019, 66, 6237–6246. [Google Scholar] [CrossRef]
  9. Zine, M.; Chemsa, A.; Labiod, C.; Ikhlef, M.; Srairi, K.; Benbouzid, M. Coupled indirect torque control and maximum power point tracking technique for optimal performance of 12/8 switched reluctance generator-based wind turbines. Machines 2022, 10, 1046. [Google Scholar] [CrossRef]
  10. Harbi, I.; Lobo Heldwein, M.; Kennel, R.; Abdelrahem, M. Enhanced Fault-Tolerant Robust Deadbeat Predictive Control for Nine-Level ANPC-Based Converter. IEEE Access 2022, 10, 32133–32145. [Google Scholar] [CrossRef]
  11. Harbi, I.; Ahmed, M.; Hackl, C.M. Low-Complexity Dual-Vector Model Predictive Control for Single-Phase Nine-Level ANPC-Based Converter. IEEE Trans. Power Electron. 2023, 15, 567–578. [Google Scholar] [CrossRef]
  12. Zheng, W.; Xie, S.; Chen, S.; He, X. Model predictive control for three-phase four-wire grid-connected inverter based on space vector modulation. IEEE Trans. Power Electron. 2015, 30, 1237–1252. [Google Scholar]
  13. Bhattarai, B.; Ashour, M. Hysteresis current control with the state-space averaging technique for grid-connected inverter under unbalanced and nonlinear loads. IET Power Electron. 2018, 11, 2044–2054. [Google Scholar]
  14. Kwak, S.; Mun, S. Model Predictive Control Methods to Reduce Common-Mode Voltage for Three-Phase Voltage Source Inverters. IEEE Trans. Power Electron. 2014, 30, 5019–5035. [Google Scholar] [CrossRef]
  15. Chen, Y.; Xue, Y.; Blaabjerg, F. Model predictive control of three-phase inverters for grid-connected photovoltaic systems. IEEE Trans. Ind. Appl. 2019, 55, 6466–6476. [Google Scholar]
  16. Alizadeh, P.; Rezaei-Zare, A.; Yazdani, A. Model predictive control of three-phase inverters with predictive current control. IEEE Trans. Ind. Electron. 2018, 65, 4112–4122. [Google Scholar]
  17. Zarei, M.E.; Ramirez, D.; Prodanovic, M.; Venkataramanan, G. Multi-Vector Model Predictive Power Control for Grid Connected Converters in Renewable Power Plants. IEEE J. Emerg. Sel. Top. Power Electron. 2021, 65, 46–57. [Google Scholar]
  18. Zhao, Z.; Zhong, Y.; Gao, H.; Yuan, L.; Lu, T. Hybrid selective harmonic elimination PWM for common-mode voltage reduction in three-level neutral-point-clamped inverters for variable speed induction drives. IEEE Trans. Power Electron. 2014, 29, 3024–3035. [Google Scholar] [CrossRef]
  19. Perez, M.; Aguilar, C.; Ortega, R. Predictive direct power control relying only on non-zero voltage vectors. IEEE Trans. Power Electron. 2017, 32, 5236–5246. [Google Scholar]
  20. Abu-Khader, A.; Abu-Siada, A.; Saidur, R. Predictive Current Control for Voltage Source Inverters Considering Dead-Time Effect. IEEE Trans. Ind. Electron. 2018, 65, 4236–4247. [Google Scholar]
  21. Ooi, B.T.; Liu, Y.; Gao, W. A model predictive control based common-mode voltage suppression strategy for voltage source inverter. IEEE Trans. Ind. Electron. 2016, 63, 6115–6125. [Google Scholar]
  22. Guo, L.; Jin, N.; Li, Y.; Luo, K. A New Adaptive Optimal Control Algorithm for the Permanent Magnet Synchronous Motor. IEEE Trans. Ind. Electron. 2017, 64, 6684–6694. [Google Scholar]
  23. Nguyen, T.D.; Phan, D.Q.; Dao, D.N.; Lee, H.H. Carrier phase-shift PWM to reduce common-mode voltage for three-level T-type NPC inverters. J. Power Electron. 2014, 14, 1197–1207. [Google Scholar] [CrossRef]
  24. Videt, A.; Le Moigne, P.; Idir, N.; Baudesson, P.; Cimetière, X. A new carrier-based PWM providing common-mode current reduction and DC-bus balancing for three-level inverters. IEEE Trans. Ind. Electron. 2008, 54, 3001–3011. [Google Scholar] [CrossRef]
  25. Preindl, M.; Schaltz, E.; Thøgersen, P. Switching Frequency Reduction Using Model Predictive Direct Current Control for High-Power Voltage Source Inverters. IEEE Trans. Ind. Electron. 2011, 58, 2826–2835. [Google Scholar] [CrossRef]
  26. Kouro, S.; Malinowski, M.; Gopakumar, K.; Franquelo, L.G.; Perez, M.A.; Leon, J.I. Recent advances and industrial applications of multilevel converters. IEEE Trans. Ind. Electron. 2010, 57, 2553–2580. [Google Scholar] [CrossRef]
  27. Haque, M.H.; Gaffar, A. Comparative analysis of control strategies for voltage source inverter in renewable energy systems: A review. Int. J. Renew. Energy Res. (IJRER) 2017, 7, 202–212. [Google Scholar]
  28. Nguyen, H.T.; Jung, J.W. Disturbance-Rejection-Based Model Predictive Control: Flexible-Mode Design With a Modulator for Three-Phase Inverters. IEEE Trans. Ind. Electron. 2021, 68, 4793–4803. [Google Scholar] [CrossRef]
  29. Hoseini, S.K.; Adabi, J.; Sheikholeslami, A. Predictive modulation schemes to reduce common-mode voltage in three-phase inverters-fed AC drive systems. IET Power Electron. 2014, 7, 840–849. [Google Scholar] [CrossRef]
  30. Tran, T.-T.; Gguyen, M.-K.; Duong, T.-D.; Choi, J.-H.; Lim, Y.-C.; Zare, F. A Switched-Capacitor-Voltage-Doubler Based Boost Inverter for Common-Mode Voltage Reduction. IEEE Trans. Power Electron. 2019, 7, 98618–98629. [Google Scholar] [CrossRef]
  31. Chen, Y.; Wu, Y.; Ruan, X. A Finite Control Set Model Predictive Control Method for Matrix Converter with Zero Common-Mode Voltage. IEEE Energy Convers. Congr. Expo. (ECCE) 2016, 6, 327–338. [Google Scholar]
  32. Shen, Y.; Wang, K.; Blaabjerg, F. Common-Mode Voltage Reduction in Grid-Connected Inverters: A Comprehensive Study. IEEE Trans. Power Electron. 2018, 33, 3786–3799. [Google Scholar]
  33. Moreira, M.D.C.; Torres, R.P.; Cabral, E.R.; Barreto, L.H.S.C. Common-Mode Voltage Reduction in Transformer less Single-Phase Photovoltaic Inverters. IEEE Trans. Power Electron. 2013, 30, 5019–5035. [Google Scholar]
  34. Giaouris, D.; Kladas, A.; Papanikolaou, N. Hybrid PWM technique for Common-Mode Voltage reduction in three-level neutral point clamped inverter. IEEE Trans. Power Electron. 2013, 28, 1784–1794. [Google Scholar]
  35. Guo, L.; Jin, N.; Gan, C.; Xu, L.; Wang, Q. An Improved Model Predictive Control Strategy to Reduce Common-Mode Voltage for 2-Level Voltage Source Inverters Considering Dead Time Effects. IEEE Trans. Ind. Electron. 2018, 66, 3561–3572. [Google Scholar] [CrossRef]
Figure 1. Overall control diagram of the conventional MPC for 2L-VSI connected with the grid.
Energies 16 07305 g001
Figure 2. 2L-VSI topology connected with the load.
Energies 16 07305 g002
Figure 3. (a) Overall control diagram of the proposed strategy for 2L-VSI connected with the grid. (b) Switching states.
Energies 16 07305 g003
Figure 4. Execution processes of the proposed method.
Energies 16 07305 g004
Figure 5. (a) VVs’ selection ratio in sector 1. (b) VVs’ selection ratio in sector 2. (c) VVs’ selection ratio in sector 3. (d) VVs’ selection ratio in sector 4. (e) VVs’ selection ratio in sector 5. (f) VVs’ selection ratio in sector 6.
Energies 16 07305 g005
Figure 6. (a) Space vector of 4-VVs. (b) Space vector of 4-VVsS.
Energies 16 07305 g006
Figure 7. CMV simulation results. (a) 8-VVs; (b) 4-VVs; and (c) 4-VVsS.
Energies 16 07305 g007
Figure 8. Simulation results of the output current. (a) 8-VVs; (b) 4-VVs; and (c) 4-VVsS.
Energies 16 07305 g008
Figure 9. Experimental setup used for performance evaluation.
Energies 16 07305 g009
Figure 10. Experimental results of steady-state performance (50 Hz). (a) The conventional MPC; (b) 4-VVs strategy; (c) 4-VVsS strategy.
Energies 16 07305 g010
Figure 11. Experimental results of steady-state performance (25 Hz). (a) The conventional strategy; (b) 4-VVs strategy; (c) 4-VVsS strategy.
Energies 16 07305 g011
Figure 12. Experimental results of dynamic performance with the current stepped from 2 to 1 A. (a) The conventional strategy; (b) 4-VVs strategy; (c) 4-VVsS strategy.
Energies 16 07305 g012
Figure 13. Zoomed-in view part of the step change.
Energies 16 07305 g013
Figure 14. Sensitivity of the conventional MPC and the two proposed strategies (4-VVs and 4-VVsS) with different switching frequencies. (a) THD%; (b) RMS current error.
Energies 16 07305 g014
Figure 15. Sensitivity of the conventional MPC and the two proposed strategies (4-VVs and 4-VVsS) with different inductor arm variations. (a) THD%; (b) RMS current error.
Energies 16 07305 g015
Figure 16. Sensitivity of the conventional MPC and the two proposed strategies (4-VVs and 4-VVsS) with output current variations. (a) THD%; (b) RMS current error.
Energies 16 07305 g016
Table 1. Reverse switching between switches.
StateS1 = 1S3 = 1S5 = 1
S2 = 1
S4 = 1
S6 = 1
In the red areas, switches cannot be turned on at the same time.
Table 2. Switching states and voltage vectors.
S1S3S5Voltage Vectors (VVs)Output Voltage of the 2L-VSI
000u00
100u1 2 3 Vdc
110u2 1 3 Vdc + j 3 3 Vdc
010u3 1 3 Vdc + j 3 3 Vdc
011u4 2 3 Vdc
001u5 1 3 Vdc j 3 3 Vdc
101u6 1 3 Vdc j 3 3 Vdc
111u70
Table 3. CMV corresponding to different values of VVs.
StateVoltage Vectors (VVs)uno
(000)u0−Vdc/2
(100)u1−Vdc/6
(110)u2Vdc/6
(010)u3−Vdc/6
(011)u4Vdc/6
(001)u5−Vdc/6
(101)u6Vdc/6
(111)u7Vdc/2
Table 4. VV candidates in each sector for the 4-VVs and 4-VVsS strategies.
SectorCandidate VVs
u1 (100)u2 (110)u3 (010)u4 (011)u5 (001)u6 (101)
4-VVs Strategy
Sector 1XXX X
Sector 6XXX X
Sector 3X XXX
Sector 4 XXXX
Sector 5 XX XX
Sector 2 XXXX
4-VVsS Strategy
Sector 1XXX X
Sector 6XXX X
Sector 3X XXX
Sector 4X XXX
Sector 5 XXXX
Sector 2 XXXX
Table 5. Experimental parameters.
ParameterNumerical Value
DC-link voltage [V]24
Sampling frequency [kHz]10
Reference frequency [Hz]50
Resistance load [Ω]3.4
Inductance load [mH]20
DC-link bus capacitor (C1, C2) [µF]3300
Disclaimer/Publisher’s Note: The statements, opinions and data contained in all publications are solely those of the individual author(s) and contributor(s) and not of MDPI and/or the editor(s). MDPI and/or the editor(s) disclaim responsibility for any injury to people or property resulting from any ideas, methods, instructions or products referred to in the content.