Article

Numerical Study on Cavitating Flow-Induced Pressure Fluctuations in a Gerotor Pump

1
College of Mechanical Engineering, Zhejiang University of Technology, Hangzhou 310014, China
2
College of Metrology and Measurement Engineering, China Jiliang University, Hangzhou 310018, China
3
Engineering Research Center of High-efficiency and Energy-saving Large Axial Flow Pumping Station, Yangzhou University, Yangzhou 225009, China
4
School of Mechanical and Automotive Engineering, Zhejiang University of Water Resources and Electric Power, Hangzhou 310018, China
*
Author to whom correspondence should be addressed.
Energies 2023, 16(21), 7301; https://doi.org/10.3390/en16217301
Submission received: 27 September 2023 / Revised: 18 October 2023 / Accepted: 23 October 2023 / Published: 27 October 2023
(This article belongs to the Special Issue Key Technologies and Challenges of Hydraulic Machinery and Systems)

Abstract

:
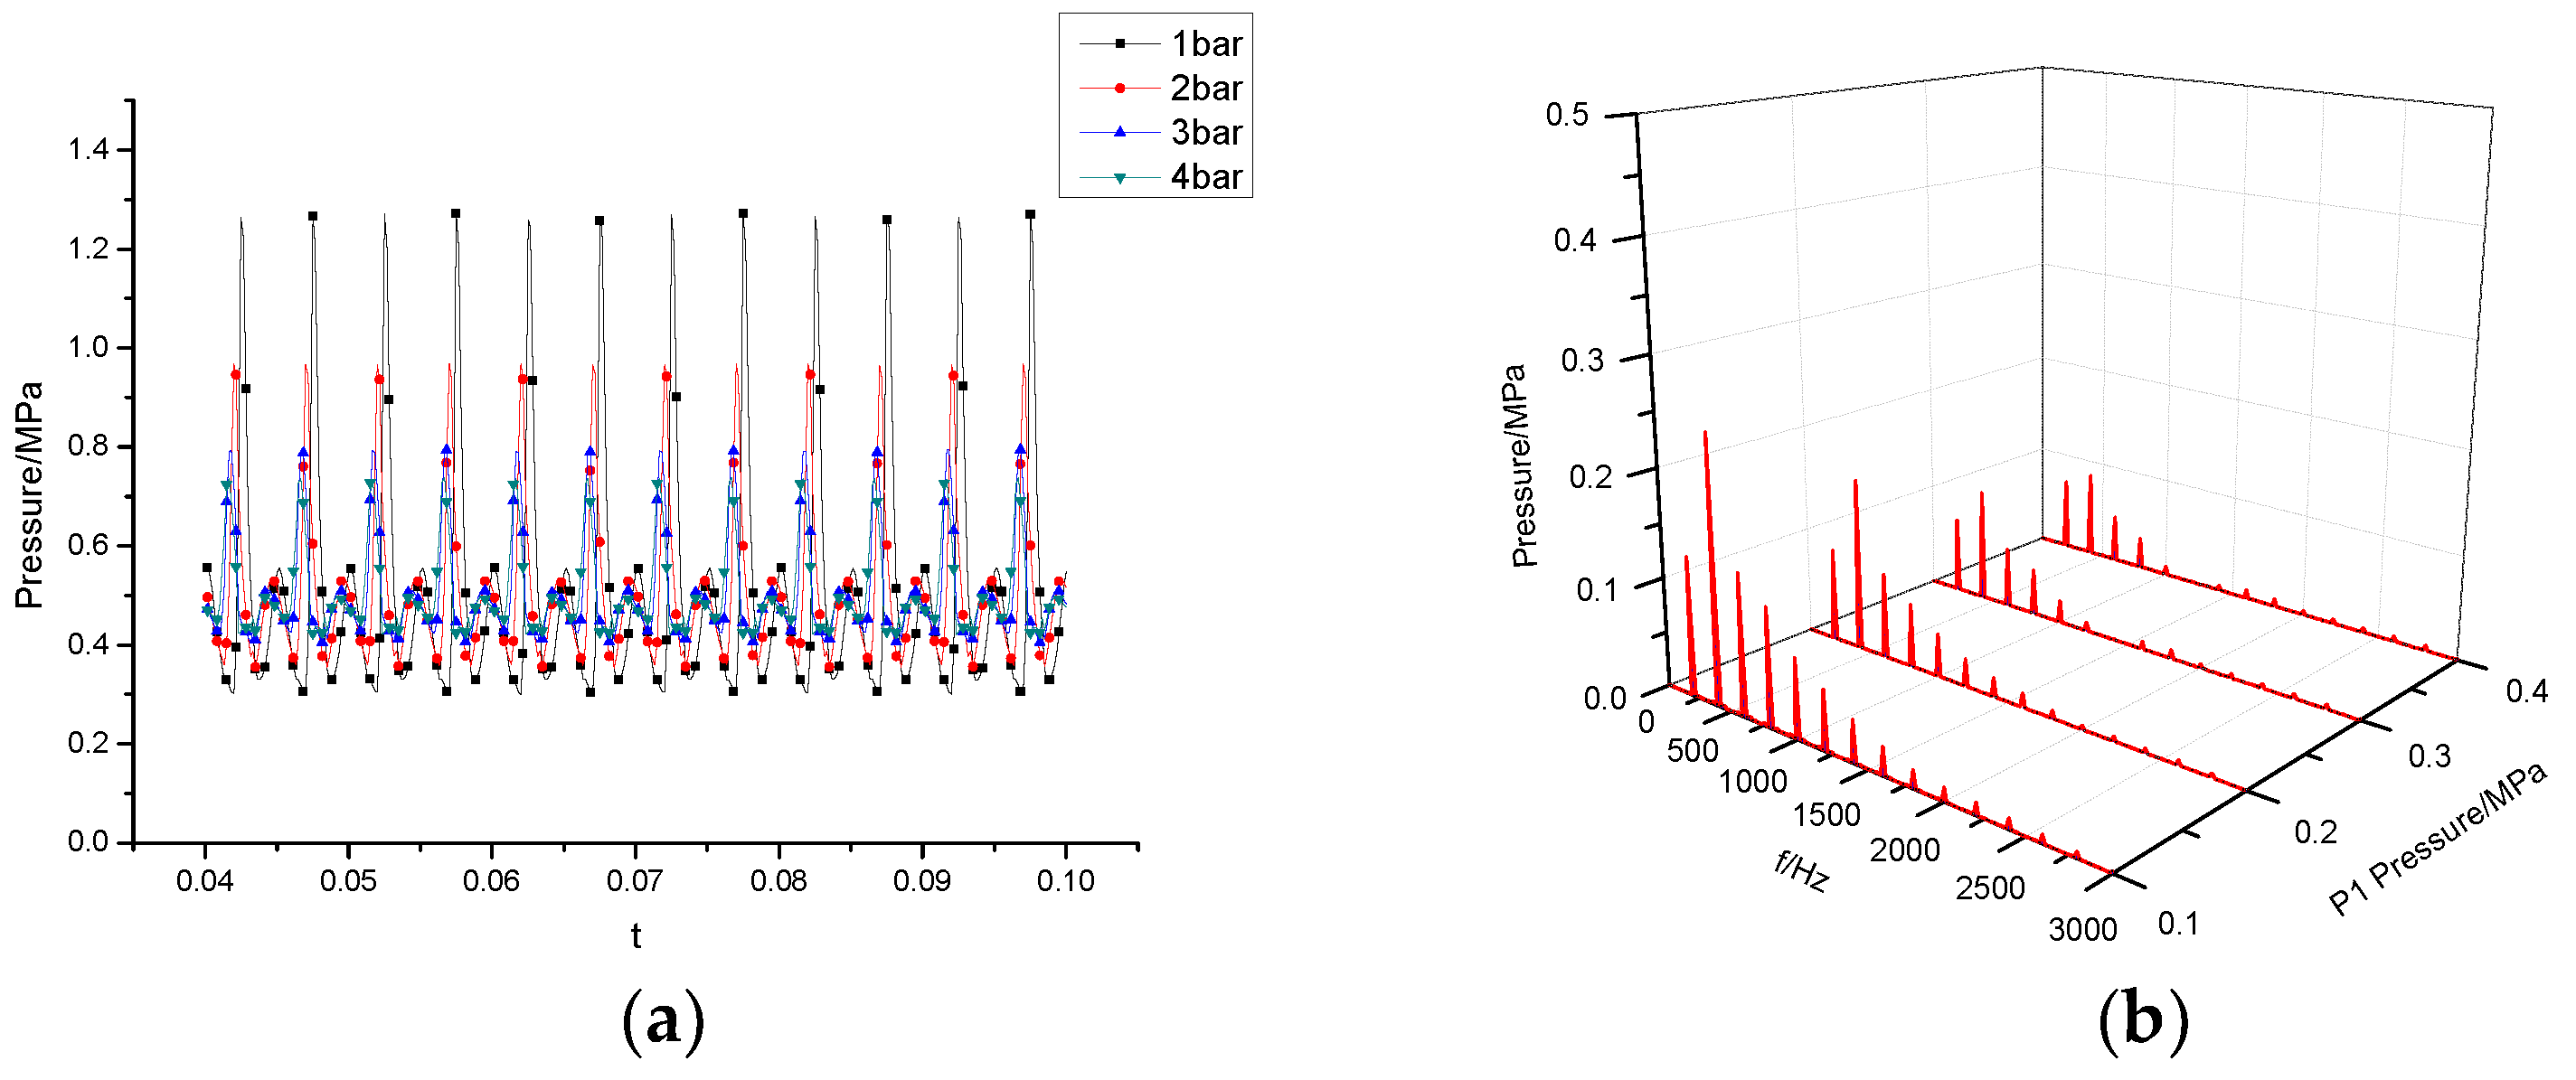
Using the RNG k-ε turbulence model and a full cavitation model, this study numerically simulated cavitating flow-induced pressure fluctuations in a gerotor pump and analyzed the relationship between cavitating flow and pressure fluctuations. The results demonstrate that, as the inlet pressure decreases, the cavitation phenomenon in the gerotor pump intensifies, and the cavitation range in the rotor increases. Some of the vapor even spreads into the oil inlet groove, leading to high vapor content in the chamber that is in contact with the oil inlet groove. The pressure fluctuation characteristics of the flow field in the pump exhibit evident periodic changes. Under different cavitation conditions, the pressure fluctuation amplitude at the monitoring point decreases with increasing inlet pressure, whereas the main frequency of pressure fluctuation remains unaffected by cavitation conditions. The pressure fluctuation amplitude is the strongest at point O1 of demarcation between the low-pressure and high-pressure zones in the chamber, and the volume between the oil inlet groove and the oil outlet groove serves as the main vibration source in the rotor pump. To ensure the stable and efficient operation of the gerotor pump, it is recommended to operate it at a larger NPSH.

1. Introduction

Gerotor pumps are widely used in industrial lubrication systems or fuel lifts because of their simplicity, high volumetric efficiency, low noise, and smooth pumping action [1]. However, the oil discharge mechanism of the gerotor pump results in fluid pressure fluctuations within the pump. Moreover, local cavitation in the flow passages, stall vortex, and secondary flow also contribute to pressure fluctuations within the pumps [2,3,4]. These pressure fluctuations can lead to vibration and noise, intensify local cavitation, further disrupt the flow field structure within the pump, impact the performance of the gerotor pump, and even trigger resonance, resulting in pump losses. Therefore, it is important to investigate cavitating flow-induced pressure fluctuations.
Researchers have employed computational fluid dynamics (CFD) technology to simulate, analyze, and optimize the internal flow and geometric design parameters of pumps [5,6,7]. In a study conducted by Jacazio et al. [8], various profile geometries, such as circular, elliptic, and asymmetric lobes, were compared to investigate their impact on pump performance in terms of wear rate and flow rate irregularity. Zhang et al. [9] studied the effects of inlet pressure, tip clearance, porting, and metering groove geometry on pump flow performance and pressure ripples using CFD. Suresh Kumar et al. [10] investigated the flow performance of gerotor pumps under different operating conditions. They analyzed the effect of solid material concentration in the oil and factors affecting the volume efficiency of gerotor pumps. Frosina et al. [11] employed experimental and numerical simulations to investigate the internal flow field of a lubrication circuit oil pump in a modern high-performance engine using CFD techniques, obtaining pressure and velocity distributions that reflect the flow field characteristics of gerotor pumps. Sung et al. [12] conducted numerical simulations and experimental methods to examine the effect of relief grooves on the port plate of gerotor pumps. They found that installing relief grooves on the port plate can improve the durability of the pump and allow for a reduction in the size of the motor coupled with the pump. Kwak et al. [13] presented a design for a new lobe shape with two ellipses that reduces the sharp change in curvature, improves fuel efficiency, and reduces the noise of the oil pump. Kim et al. [14] suggested designing relief grooves on the port plate to reduce pressure pulsation, but the effectiveness of this approach has not been experimentally verified.
Currently, the flow field and cavitation phenomenon of gerotor pumps has not been fully explored, and the qualitative relationship between cavitation and pressure fluctuation has not been studied. Zhou et al. [15] presented a model to evaluate fluid properties considering the dynamic features of cavitation and conducted a study on the operation of gear pumps under cavitation conditions. They found that the new model for evaluating fluid properties is suitable for lumped parameter models. Ivanovic et al. [16] proposed a mathematical model prediction method for designing the optimal combination of gerotor pump parameters to reduce the impact of the gerotor pump wear and verified the accuracy of the model through experiments, which provided a reference for improving the performance of the gerotor pump. Buono et al. [17] employed experimental and simulation methods to study the cavitation of gerotor pumps, focusing on the induction of cavitation using low-suction pressure and oil void fraction. Rituraj et al. [18] carried out a CFD simulation of curve-constrained flow under cavitation conditions. Based on the results of the experimental simulation, they analyzed and proposed a new model that is suitable for laminar, turbulent, and cavitation flow. Tian et al. [19] established a three-dimensional model of a scroll oil pump with actual clearance and found that the flow in the two working chambers was asymmetric. The author effectively improved pressure pulsation by increasing the axial clearance and reducing the rotational speed and proposed a method to reduce pressure pulsation by shortening the vortex profile. Using the mathematical model of theoretical gears, Ivanovic et al. [20] developed a tooth profile model of gears with clearance, which helps identify contact gears and define the clearance height between non-contact gear profiles. The obtained results can be used in the design of hypocycloid gears that require accurate and silent operation. By analyzing the causes of flow pulsation in the 8 / 9 tooth cycloidal pump and aiming to reduce pressure pulsation in this type of pump, Cao et al. [21] designed a new cycloidal pump with a pulsation buffer. They investigated the pressure pulsation in the cycloidal pump at various speeds, comparing the performance of the pump with and without a pulsation buffer. In a study conducted by Li et al. [22], a quantitative analysis of the high-altitude performance of the aeroengine gerotor pump was carried out. The findings revealed that increasing the flight altitude intensified the cavitation phenomenon in the aeroengine gerotor pump. Reducing the rotational speed was found to meet the fuel supply requirements and alleviate the system’s burden. Nevertheless, no qualitative investigation has been undertaken to explore the connection between cavitation and pressure fluctuations. Based on their research, Gamez-Montero et al. [23] reviewed the literature published over the last decade and concluded that there is insufficient evidence to claim that the specific subcycloid envelope offers the best and most optimized characteristics. Ivanović et al. [24] established a mathematical prediction model and studied the factors affecting gerotor pump flow and volumetric efficiency using a factor design and response surface methodology. In addition to these studies, other relevant works have focused on optimization design methods and machine learning algorithms applied to fluid machinery [25,26,27]. For instance, Huang et al. [28] proposed a hybrid neural network approach for predicting the energy performance of centrifugal pumps. This approach incorporates the theoretical loss model into the backpropagation neural network and optimizes the neural network structure by automatically determining the number of hidden layer nodes. Meanwhile, Luo et al. [29] collected hydraulic model parameters and experimental data from multiple pump models. They proposed a constrained PSO-SVR Model for predicting the multi-condition performance of centrifugal pumps. These studies highlight the potential of optimization techniques and machine learning algorithms in improving the performance and efficiency of fluid machinery, including gerotor pumps.
Existing studies mainly focus on using steady-state calculations to analyze flow characteristics, aiming to optimize the pump’s geometric design parameters. However, they inadequately consider the dynamic effects of cavitation on the internal flow field. Additionally, limited research quantitatively analyzes the relationship between cavitation and pressure fluctuations. Therefore, we adopted an unsteady numerical calculation method that considers rotor motion and cavitation effects to comprehensively reveal the unsteady flow characteristics and cavitation patterns inside a gerotor pump. A quantitative analysis was employed to investigate the impact of different cavitation conditions on pressure fluctuations, aiming to provide a theoretical foundation for the safe and stable operation of the gerotor pump.
The paper is organized as follows: Section 2 describes the computational model, meshing approach, boundary conditions, and simulation methodology. Section 3 presents the results, including the verification of the model, analysis of pressure fluctuations under various cavitation conditions, characterization of unsteady internal flow features, and relationship between cavitation intensity and pressure oscillations. The key findings are summarized in Section 4. This structured approach provides a comprehensive numerical analysis of cavitating flows and pressure fluctuations in gerotor pumps, enabling new physical insights and design recommendations.

2. Computational Objects and Numerical Simulation Methods

2.1. Computational Model

Table 1 presents the main design parameters of the gerotor pump utilized in this study. The pump operates at a rated speed of 3000 r/min with an outlet pressure (P2) of 0.5 MPa. As illustrated in Figure 1, the model comprises three components: the oil inlet groove, the rotor, and the oil outlet groove. The chamber, which serves as the working fluid delivery space, is established by enclosing an inner and outer rotor. Notably, there is no direct contact between the internal and external rotors and tip clearances.
The oil discharge mode of the gerotor pump determines that the flow rate of the output is not constant but periodically fluctuating. Referring to the calculation formula of the inherent flow fluctuation frequency of the internal gear pump, the fluctuation frequency of the gerotor pump pressure is as follows:
f 1 = z f r = nz / 60 ,
where f r is engine shaft frequency, Hz; n is rate speed, r/min; and Z is the number of inner rotor teeth. In this paper, according to Formula (1), the calculation results are as follows: f r = 50 Hz; f 1 = 200 Hz.

2.2. Meshing and Boundary Condition Settings

Due to the mutual meshing and separation between the inner and outer rotors of the gerotor pump, the calculation domain changes with time. To make the geometrical shape of the computational domain consistent with the actual situation, the dynamic mesh technique must be used to trim the mesh. To use the dynamic grid technology, it is necessary to introduce control body variations into the governing equations. The integral form of the governing equation for the governing body can be expressed as follows:
d d t v ρ ϕ d V + V ρ ϕ u u m d A = V Γ ϕ d A + V S ϕ d V ,
where ρ is the density of the fluid, u is the velocity vector of the fluid, u m is the speed of the grids, and V is the boundary of the control body.
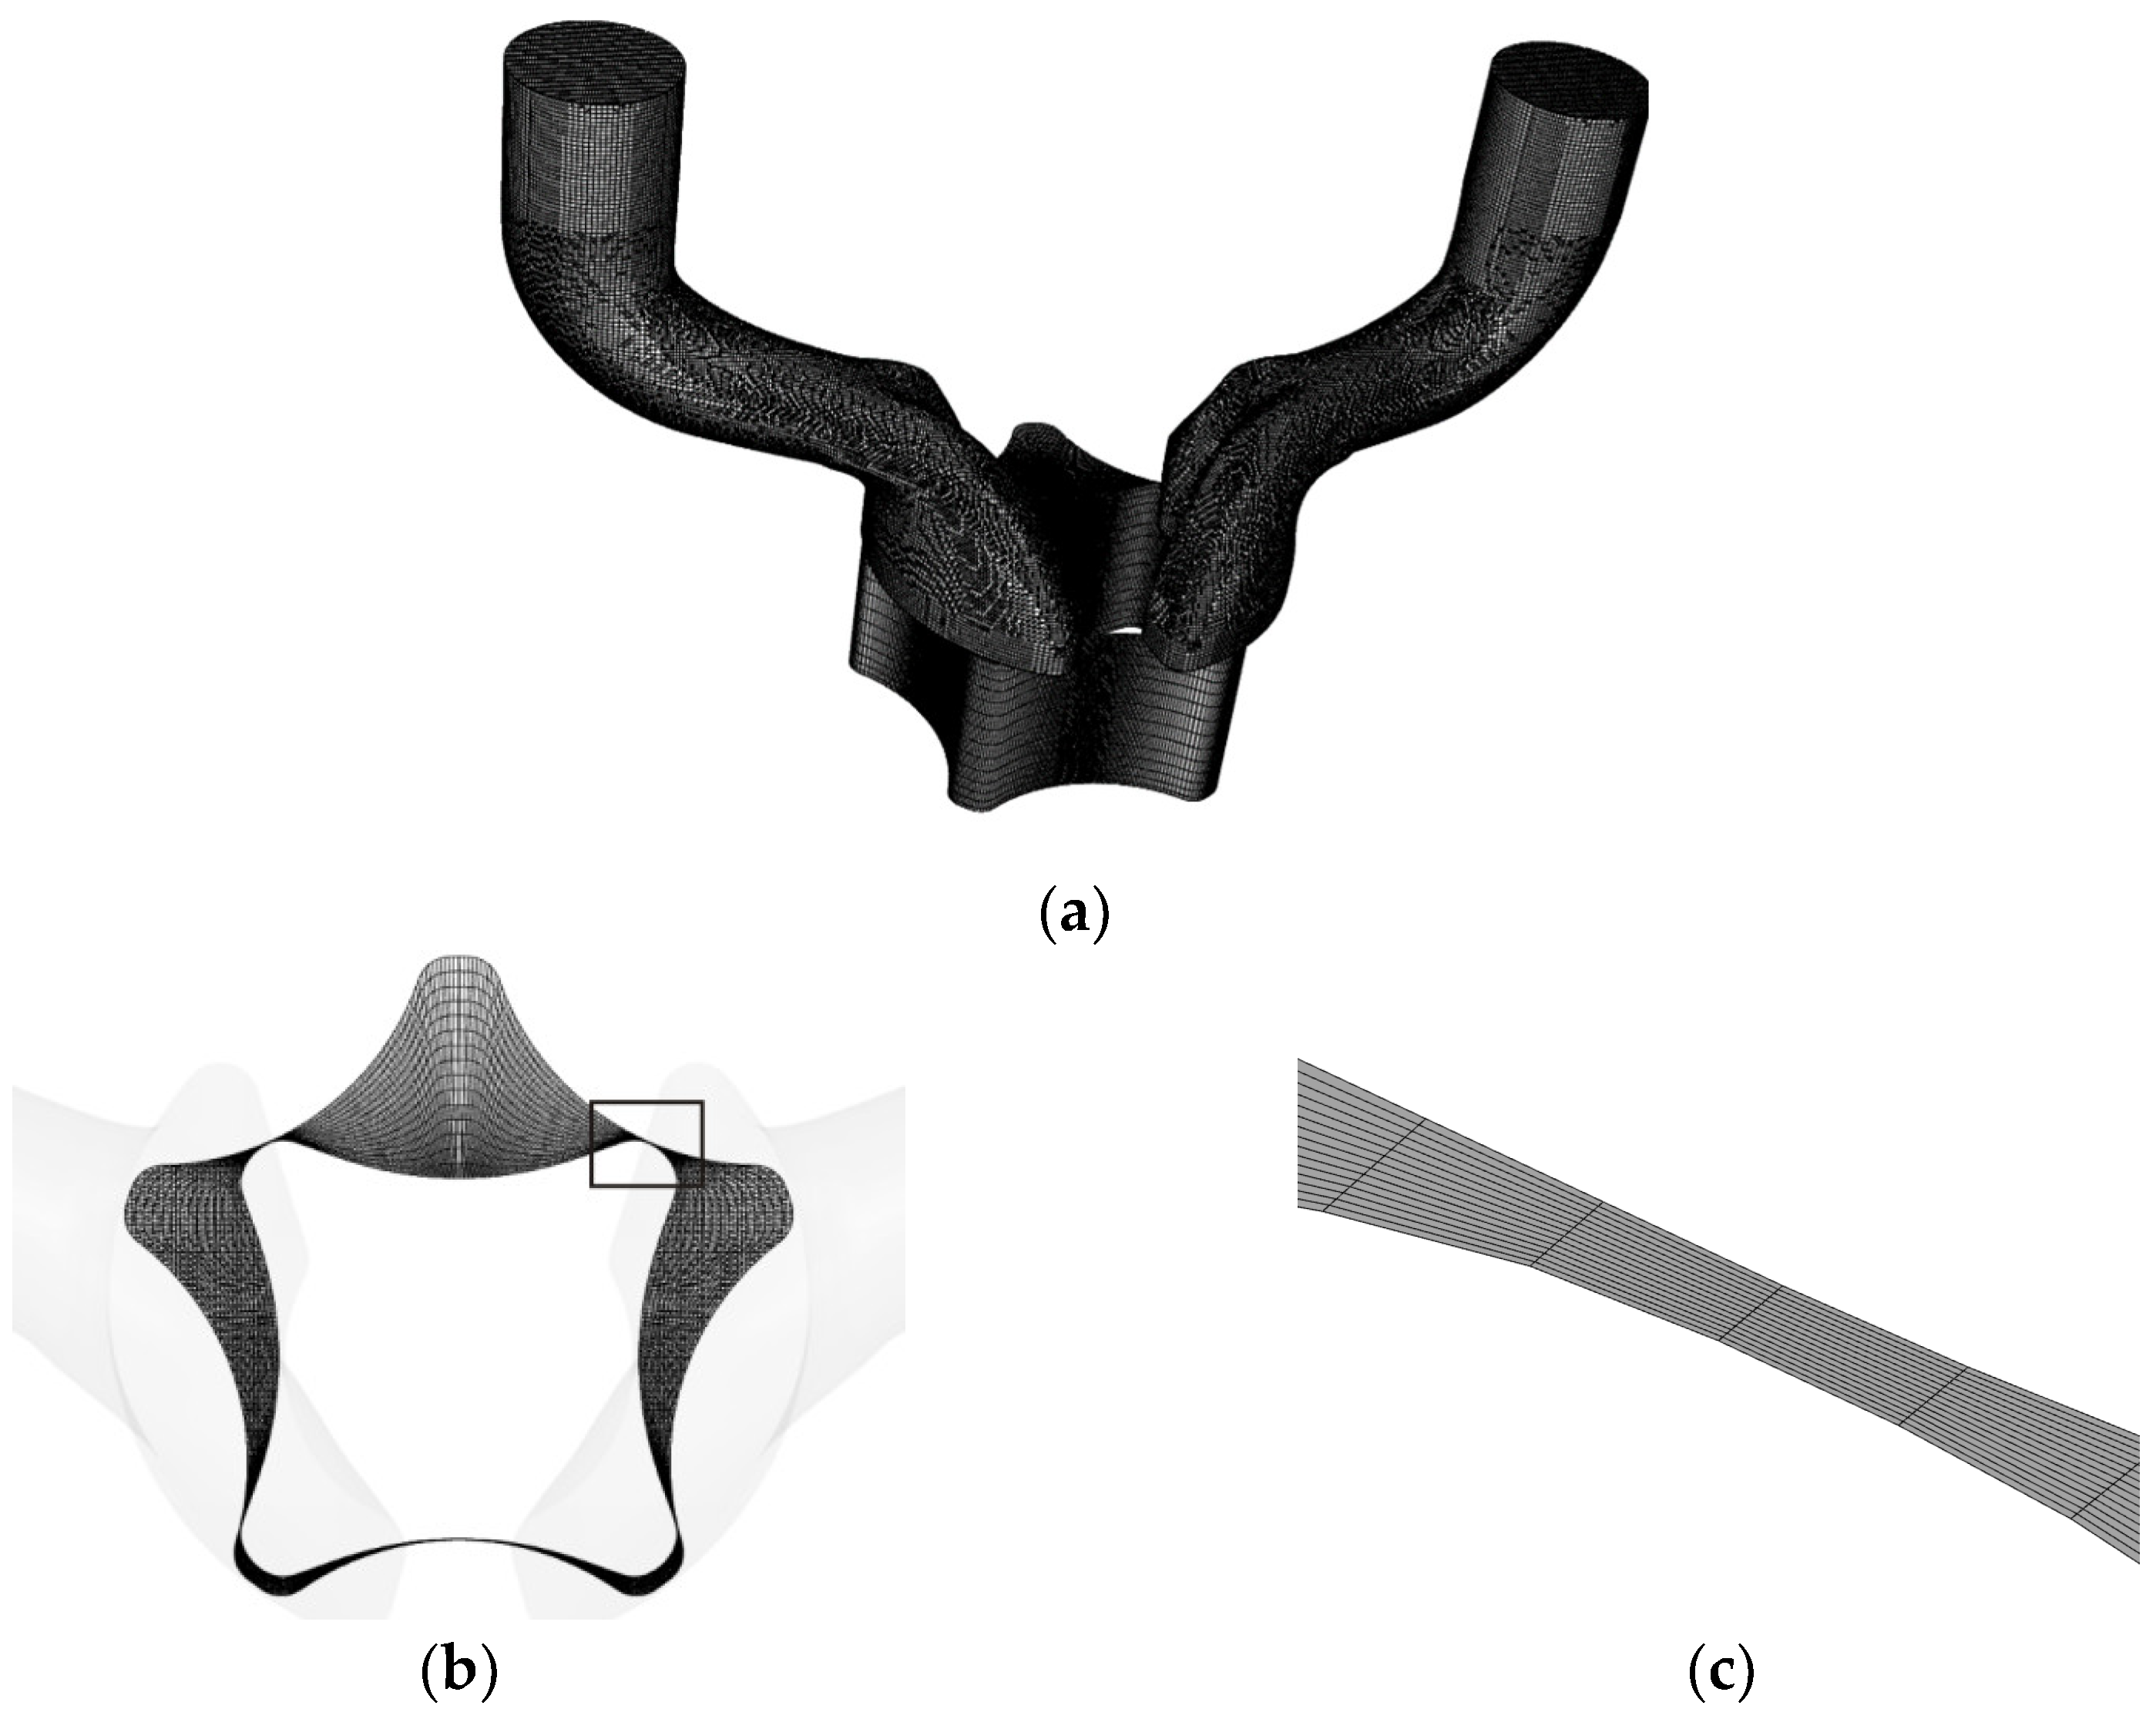
The inlet and outlet runners are equipped with a Cartesian hexahedron mesh generated using geometrically equiangular adaptive binary tree Cartesian mesh technology. In the rotor region, a structured mesh generator is employed. To enhance the accuracy and speed of mesh generation, a mesh template provided in Pumplinx is utilized. In consideration of the minimal tip clearance between the inner and outer rotors, mesh refinement is implemented in the tip clearance area, resulting in the division of the mesh into 15 layers to fulfill computational requirements. To assess grid independence under rated working conditions (n = 3000 r/min, P2 = 0.5 MPa), five sets of grids with different scales are employed. Table 2 reveals that, when the number of grids exceeds 400,000, the outlet flow of the gerotor pump remains fairly stable, with an error of within 1%. Based on this observation, a grid count of approximately 400,000 was chosen for this study. The meshed model is displayed in Figure 2, comprising 358,140 elements and 444,998 nodes.
The end faces of the inlet and outlet grooves of the pump are the pressure inlet and pressure outlet boundary conditions, respectively. The outlet pressure is P2 = 0.5 MPa, and the inlet pressure P1 is 0.1 MPa, 0.2 MPa, 0.3 MPa, and 0.4 MPa, respectively. The other surfaces are set as wall boundary conditions. The near-wall region was treated using a standard wall function, and the wall was set as non-sliding. The convergence accuracy was set to 1 × 10⁻³. The temperature change of the oil is not considered in the calculation, and the model does not incorporate the energy equation. The oil density was 800 kg/m3, the kinematic viscosity was 20 mm2/s, and the saturation pressure was 400 Pa. The inner rotor speed was set to 3000 r/min and the outer rotor speed was set to 2400 r/min. The unsteady calculation time step was taken as 167 ms, which is 1/120 of the rotation period. The maximum number of iteration steps per time step was 50 steps. The number of total rotations was about 10. After the simulation calculation was stable, the data of the last three rotations of unsteady calculation were collected for pressure fluctuation analysis.

2.3. Monitoring Points Setting

In order to study the pressure fluctuation characteristics of a gerotor pump under different cavitation conditions, 10 monitoring points were arranged in the fluid field of internal and external rotors, as shown in Figure 3. The monitoring point J is disposed at the center of the maximum chamber, the monitoring points I1~I4 are set at the inner rotor side, the monitoring points O1~O4 are set at the outer rotor side, and the monitoring point P is taken in the plane of the oil pressure chamber. The motion trajectory of the monitoring point is controlled by an equation. The equation is as follows:
x I 1 = d 1 2 sin π n 30 t ,   y I 1 = d 1 2 cos π n 30 t ,
y I 4 = D 1 2 cos π n 30 t + 1 4 π ,   x I 4 = D 1 2 sin π n 30 t + 1 4 π ,
x O 1 = D 2 2 sin π n 30 t ,   x O 1 = D 2 2 cos π n 30 t + e
x O 4 = d 2 2 sin π n 30 t + 2 11 π ,   y O 4 = d 2 2 sin π n 30 t + 2 11 π + e

2.4. Control Equation and Calculation Method

In this study, the RNG k-ε turbulence model is chosen to simulate the three-dimensional unsteady flow of the gerotor pump. Unlike the SST model, which demands higher computational resources, the RNG k-ε model not only comprehensively considers the rotational and swirling flow within the pump, but also provides a more precise simulation of the near-wall flow.
The cavitation model utilized in this study establishes a relationship between the density of the two gas–liquid phases and other physical quantities in the gerotor pump. To describe the formation and collapse of cavities, the Rayleigh–Plesset equation [30] is employed. The equation is expressed as follows:
R B d 2 R B d t 2 + 3 2 d R B d t 2 + 2 σ ρ l R B = p v p ρ l
where R B is the radius of the cavity, σ is the surface tension coefficient between liquid and vapor, ρ l is the density of liquids, and p v and p are the vaporization pressure of the liquid at a local temperature and the liquid pressure around cavities, respectively.
The change rate of bubble mass is calculated as follows:
d m B d t = ρ v d V B d t = ρ v d d t 4 3 π R B 3 = 4 π R B 2 ρ v 2 3 p v p ρ l
where m B , V B , and ρ v are the mass, volume, and density of the cavity, respectively.
The mass transfer equation of two-phase gas–liquid flow is calculated as follows:
α v ρ v t + ρ v α v u i = R e R c
where α v is the ratio of vapor volume; R e and R c are the water vapor generation rate and condensation rate, respectively.
The full cavitation model [31] is used in this research, and the mass equation of the mixed medium when the gerotor pump undergoes cavitation is as follows:
ρ m t + ρ m u j x i = 0
where ρ m is the density of the mixed phase and u j is velocity vector.
The momentum equation of the gas–liquid mixture is as follows:
ρ m u i t + ρ m u i u j x j = p x j + x j μ m + μ t u i x j + u j x i 2 3 u i x j δ i j

3. Analysis of Calculation Results

3.1. External Characteristic Analysis

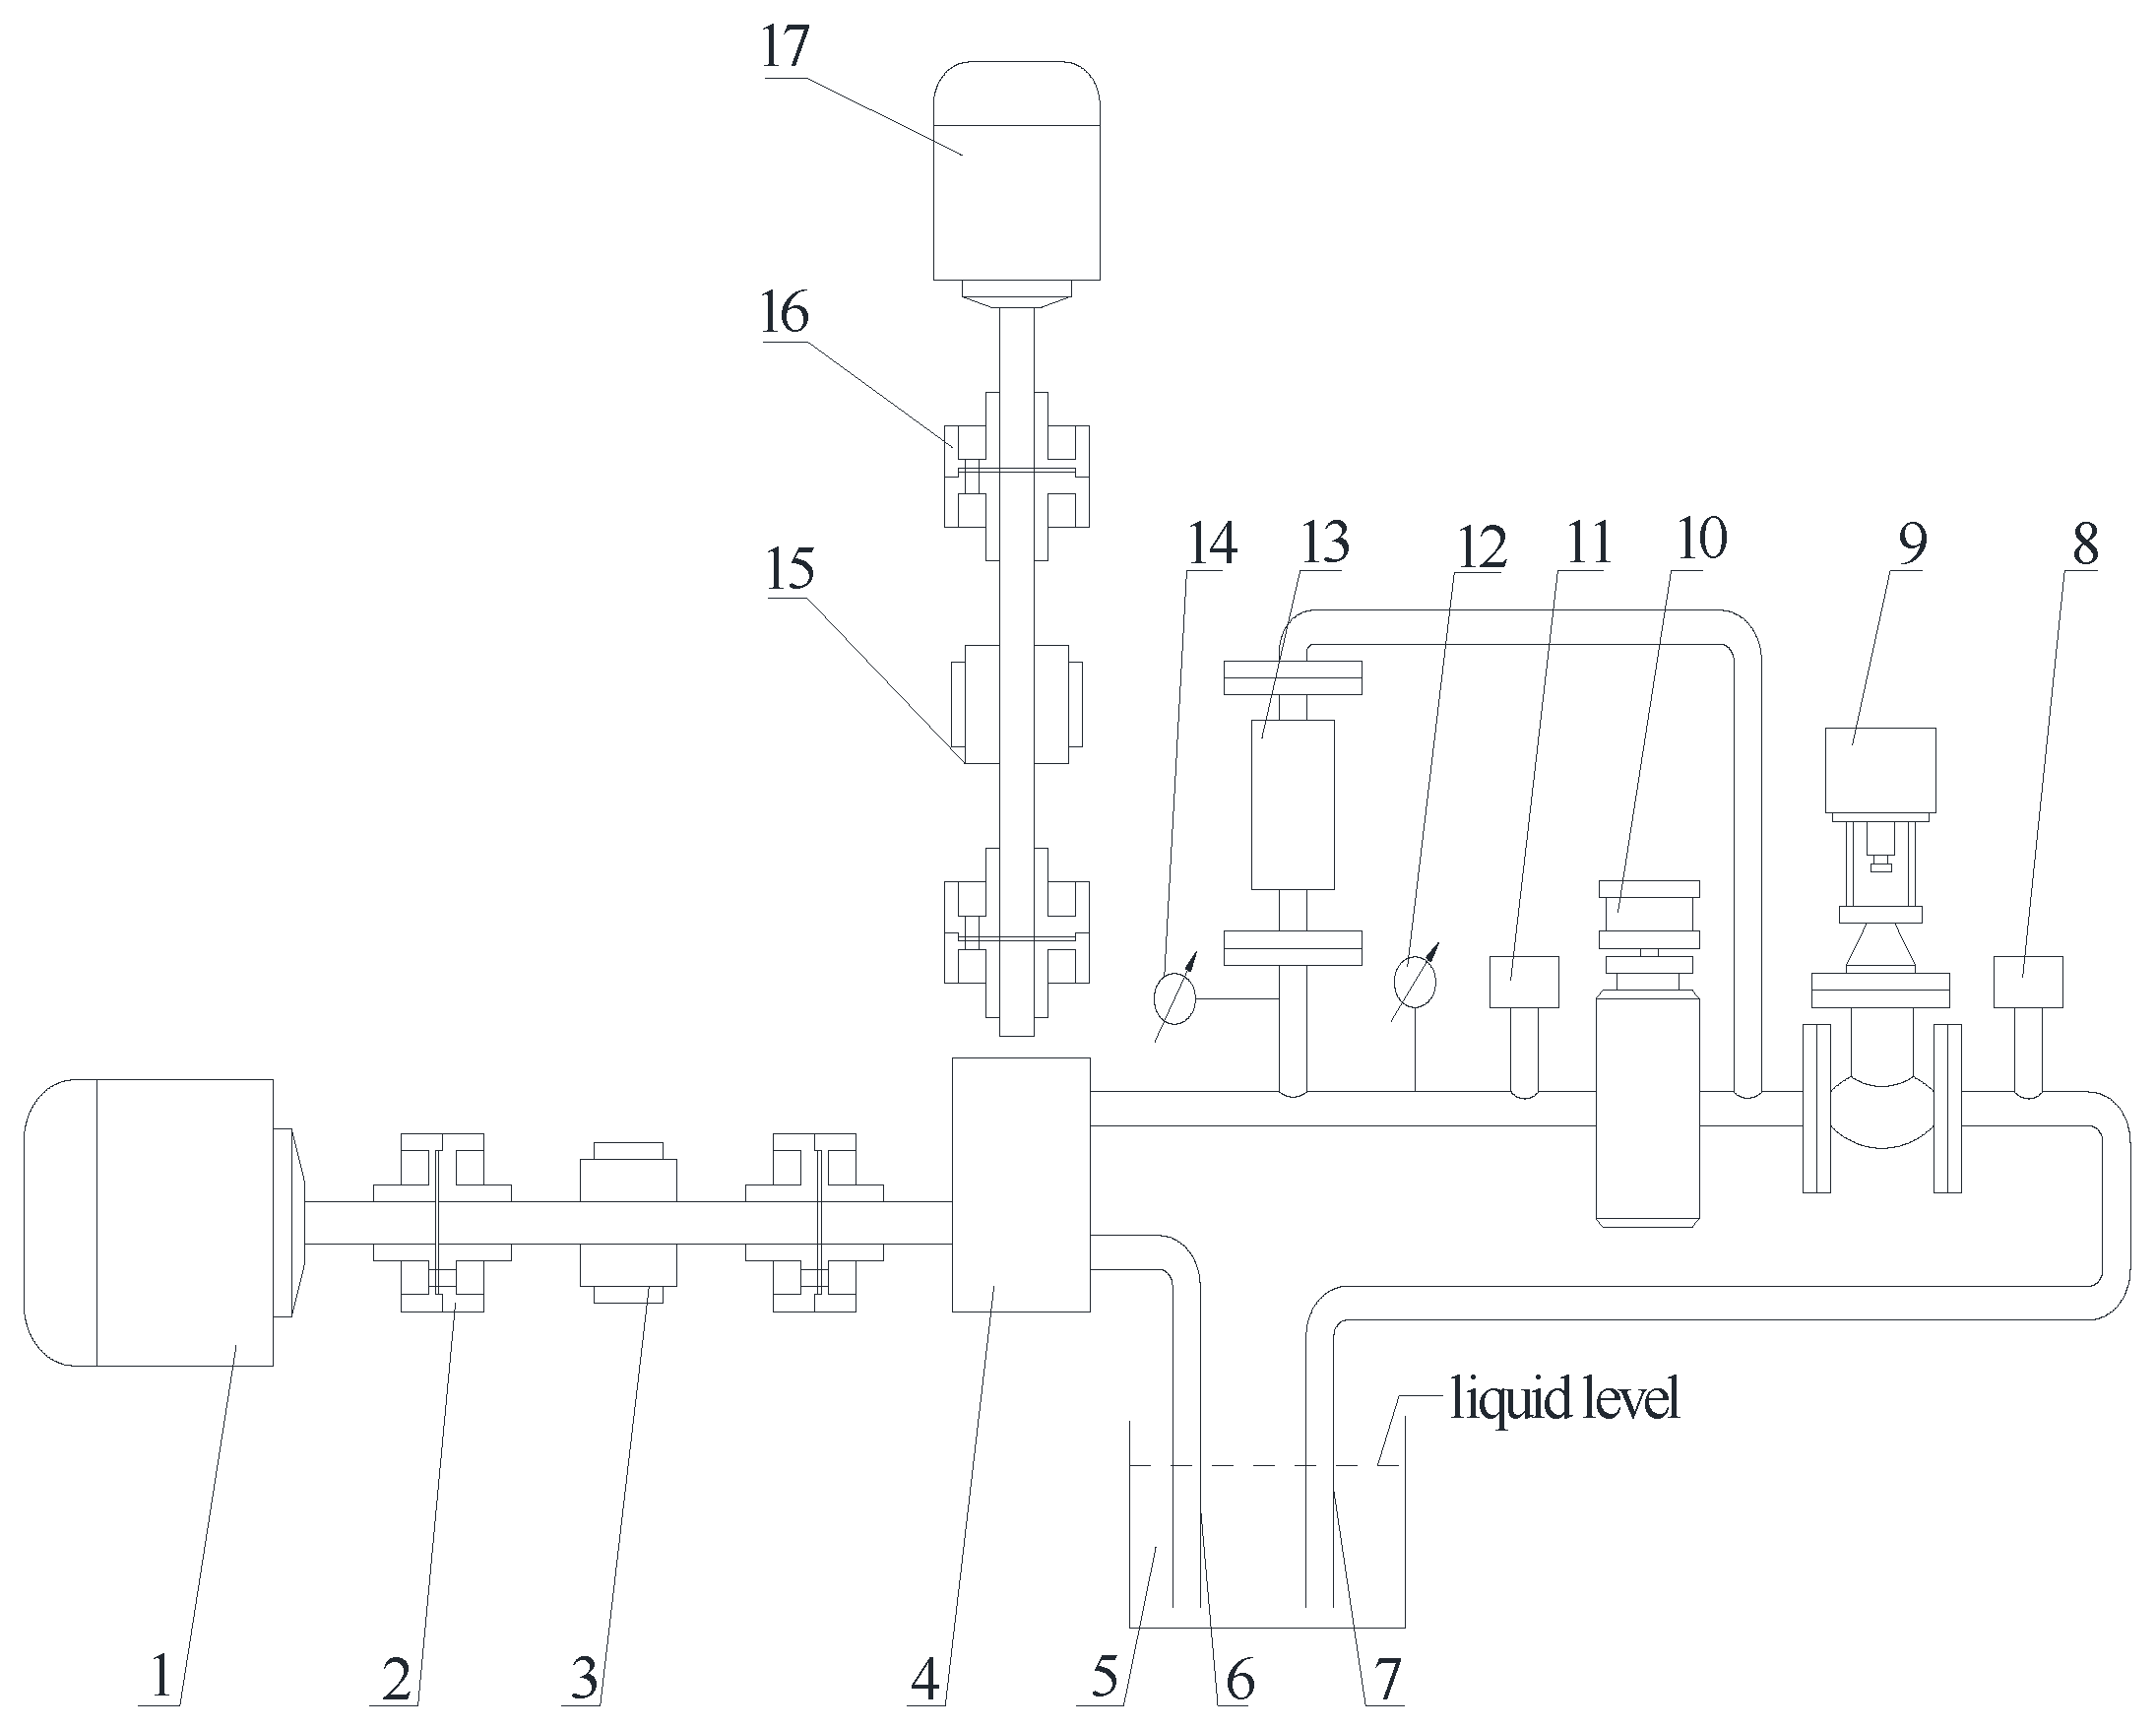
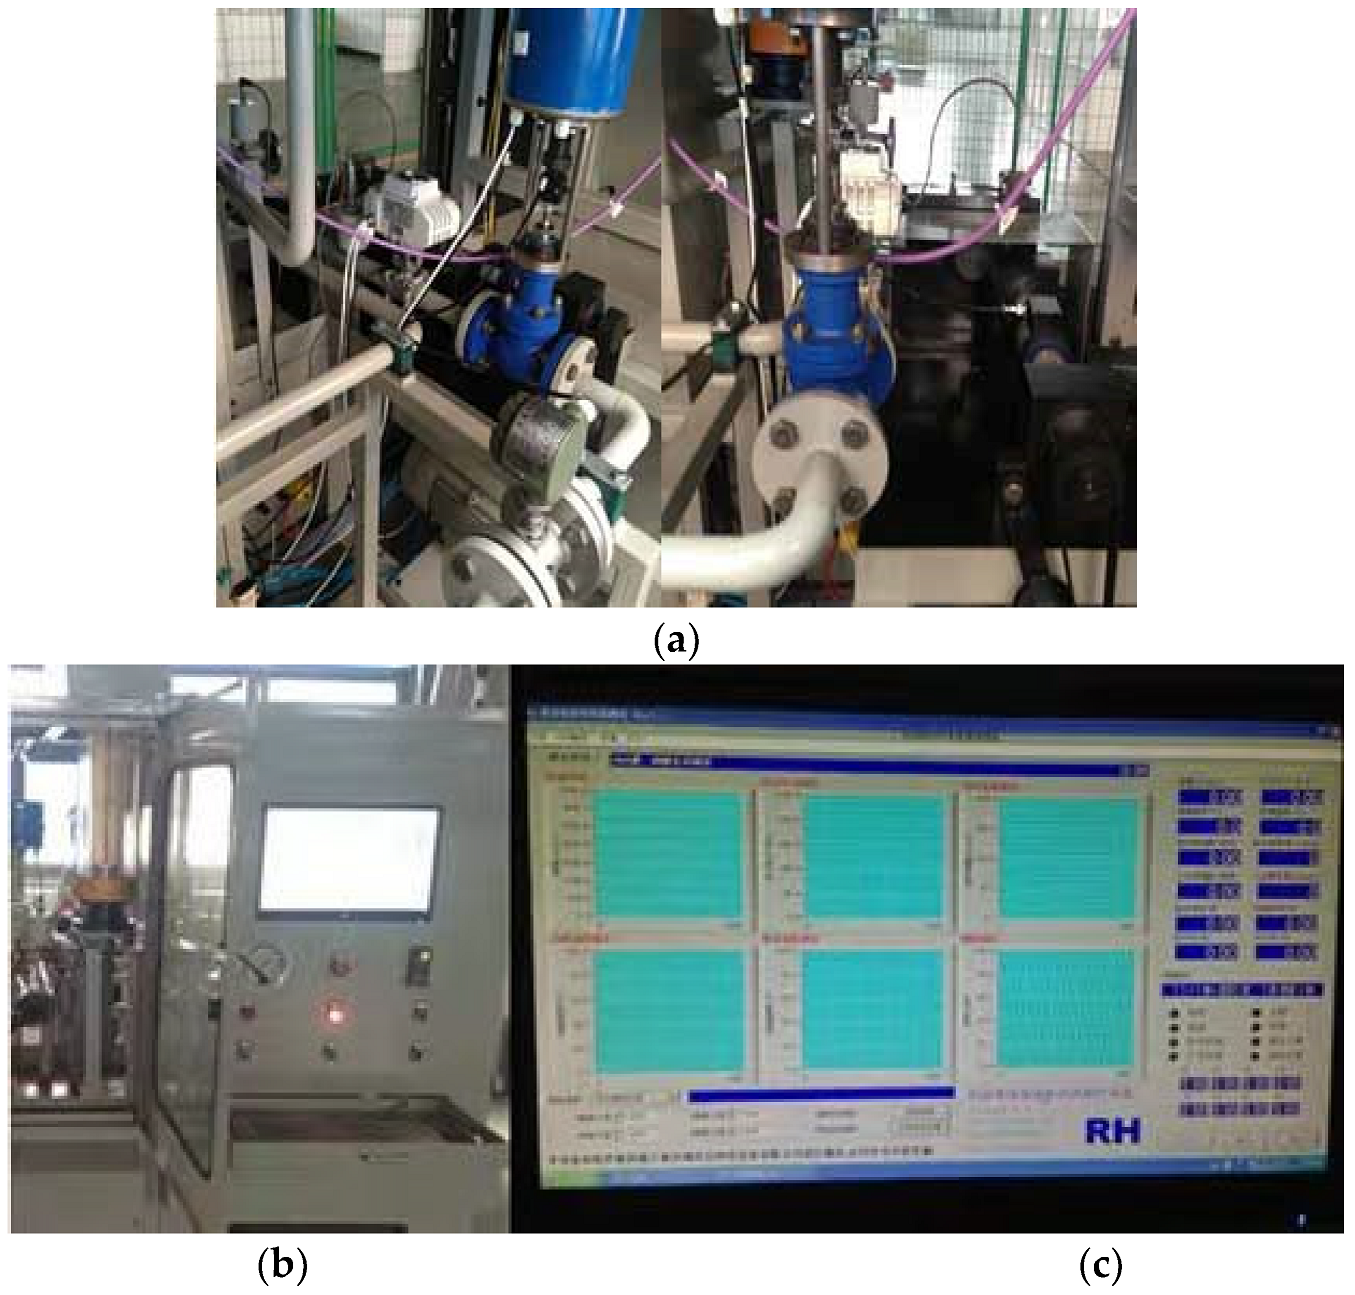
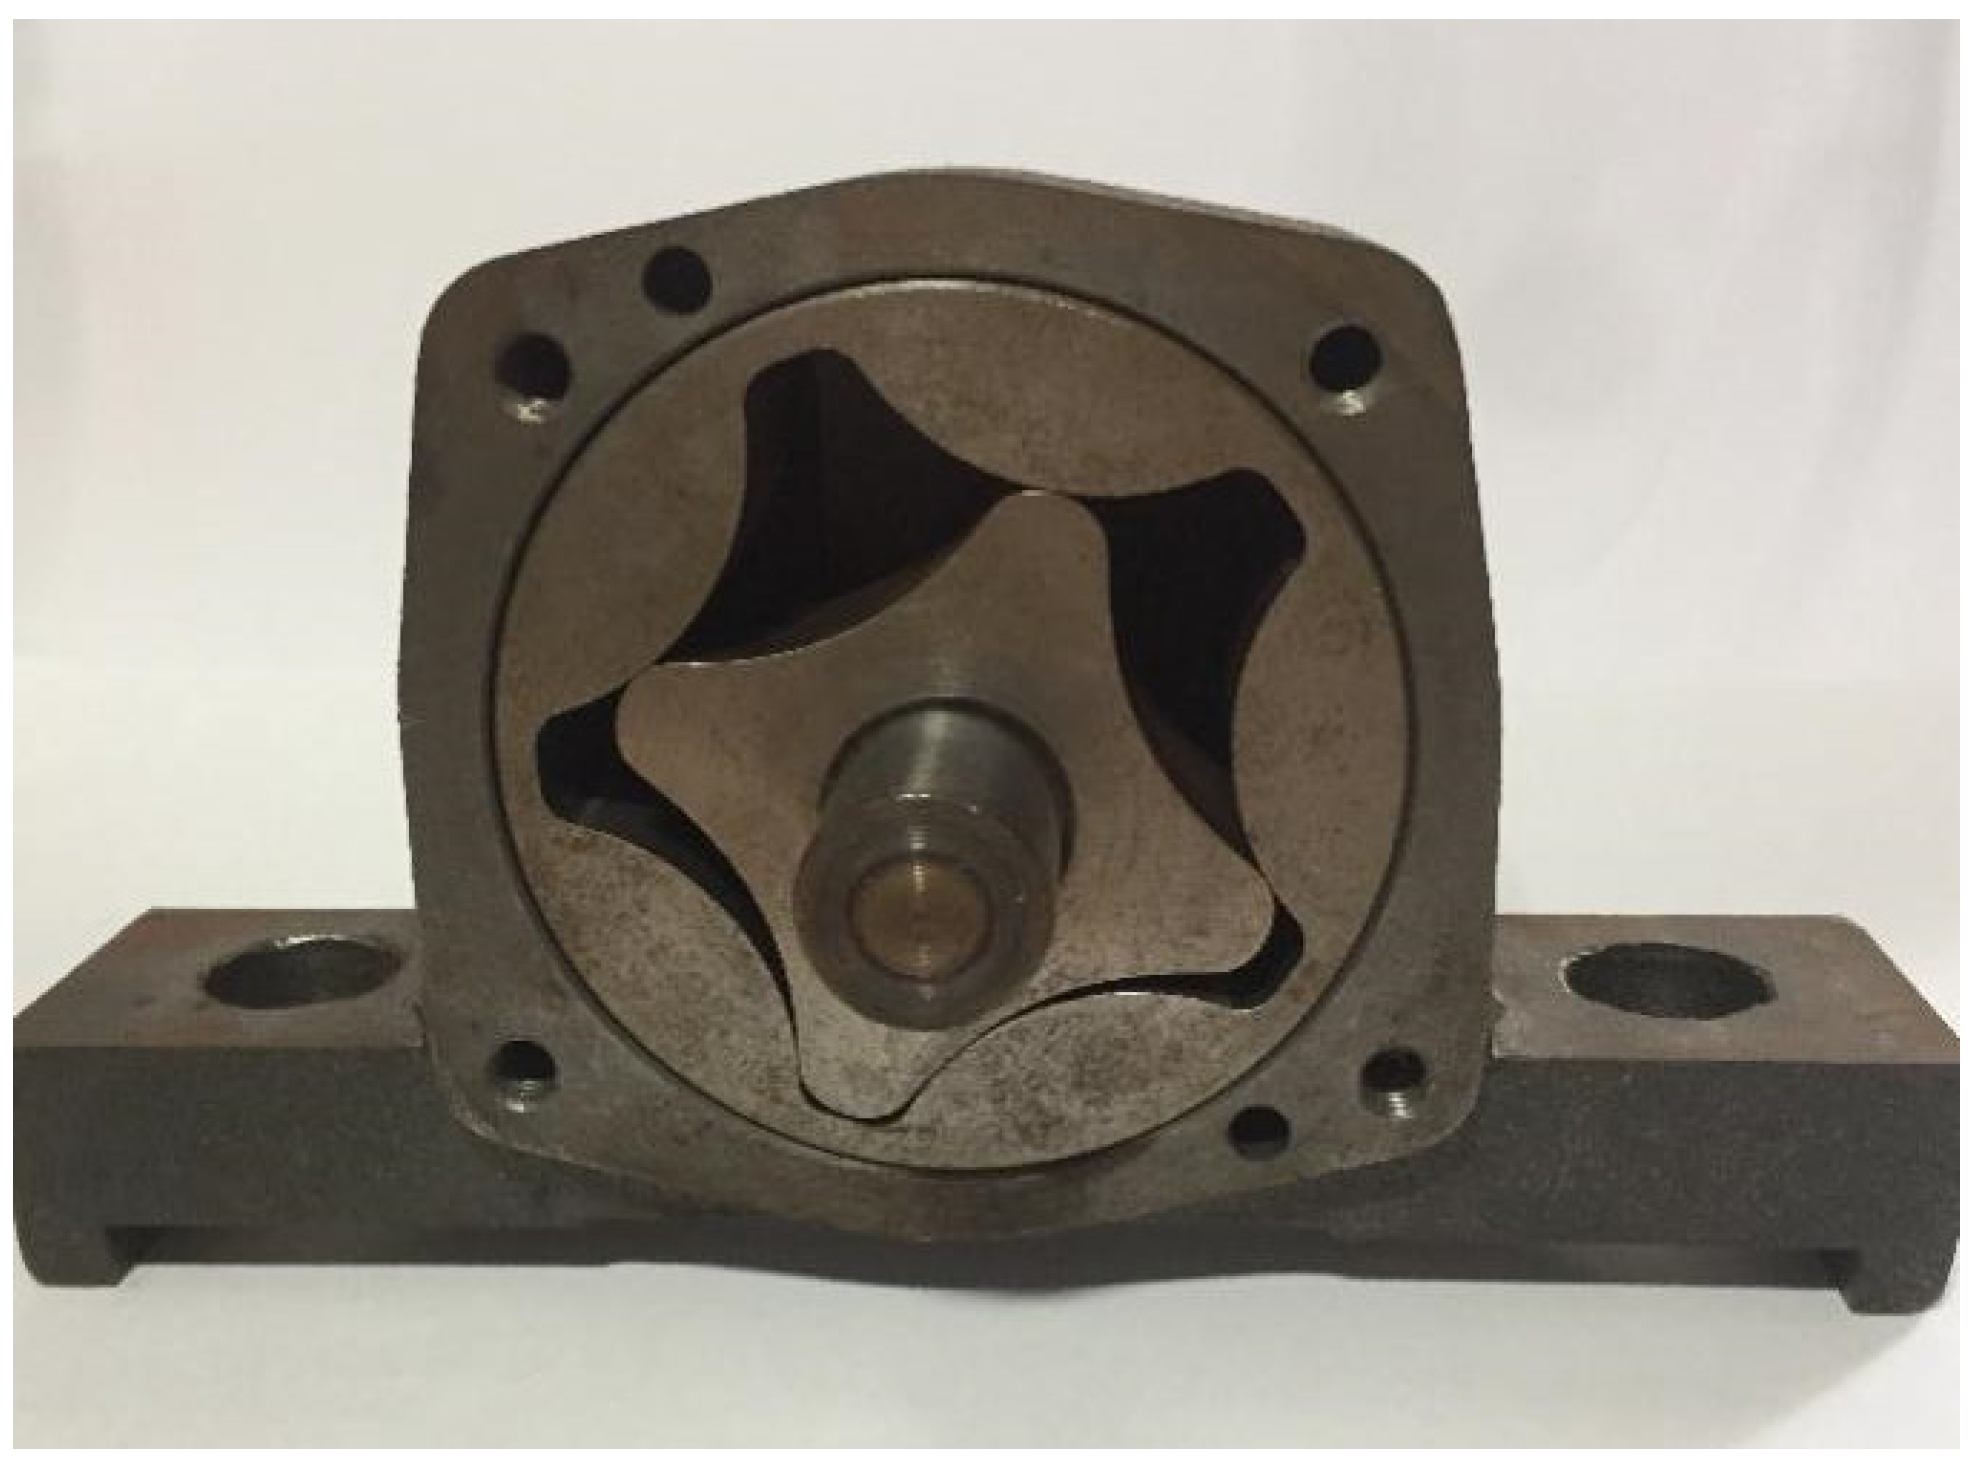
In order to verify the accuracy of the numerical calculations, experimental testing was conducted on a dedicated gerotor pump test rig. The design of the test rig adhered strictly to the national standard ISO 9906:2012 and was calibrated to attain a testing accuracy level of 1. A structural diagram of the test bench is depicted in Figure 4, whereas Figure 5 illustrates the location of the test bench. Lastly, Figure 6 shows the gerotor pump prototype utilized during the testing [32]. The gerotor pump was tested on a dedicated test rig consisting of horizontal and vertical drive motors coupled to the pump, a fuel tank providing the test oil, electronic valves controlling the inlet and outlet pressures, flow and pressure meters measuring the pump flow rate and pressure rise, and a data acquisition system collecting the test data. By operating the pump under different conditions and measuring the resulting flow rate, pressure rise, and speed, pump performance characteristics like the flow–pressure curve were obtained. The experimental results served to validate the accuracy of the numerical simulations across various operating points.
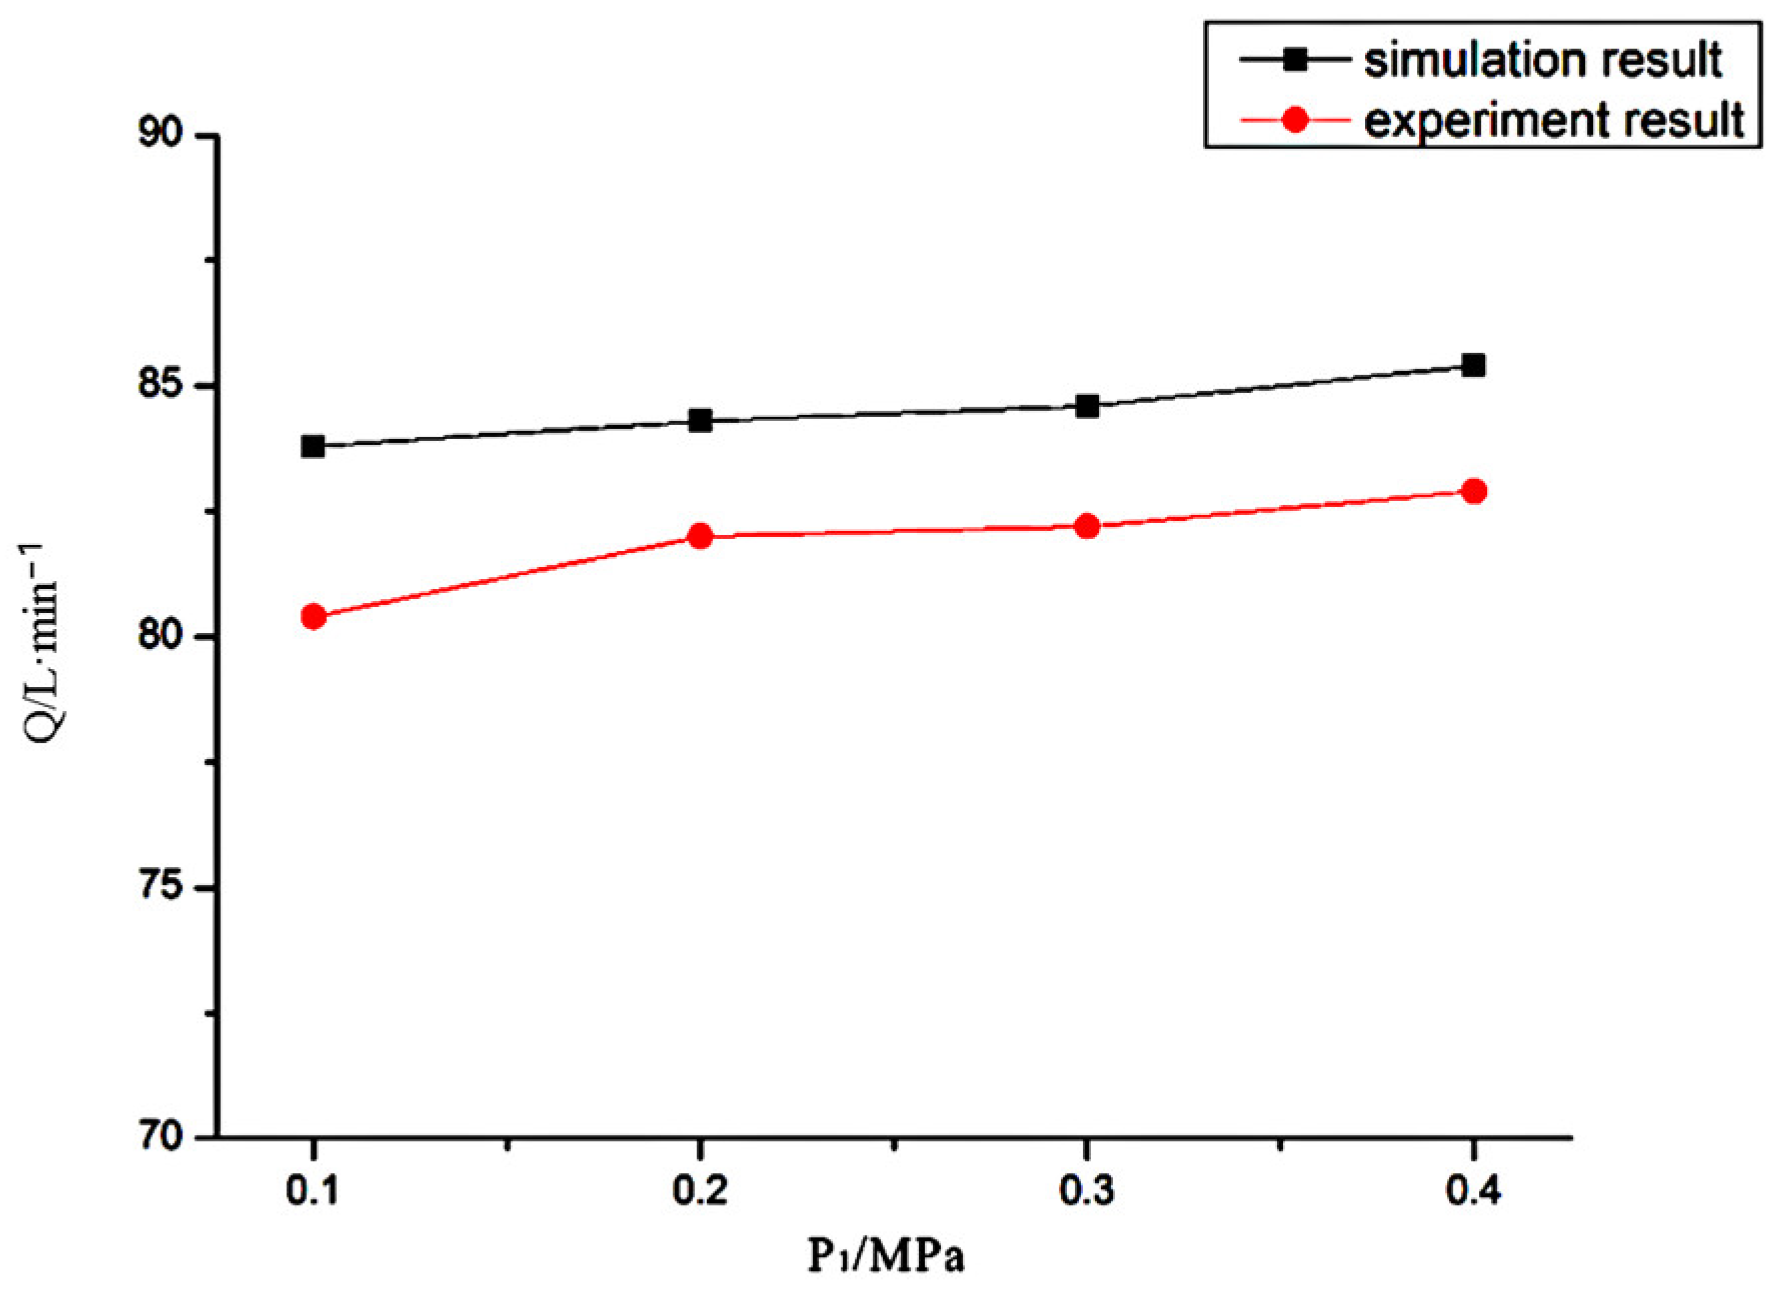
The gerotor pump is simulated under four different operating conditions, namely, P1 = 0.1, 0.2, 0.3, and 0.4 MPa. The comparison between the numerical results and the experimental data is presented in Figure 7. Upon observing the graph, it can be noted that the performance curve obtained from the numerical simulation aligns with the performance curve measured in the experiment. However, the numerical simulation consistently predicts a higher outlet flow compared to the experimental values across all operating conditions. This disparity arises because the simulation does not take into account the actual deviation caused by end-face leakage and axial leakage. Despite this limitation, the comparison between the experimental and simulated values demonstrates good overall agreement, with a calculation error of approximately 3%. These findings indicate that the numerical simulation’s accuracy remains acceptable.

3.2. Effect of Cavitation on Pressure Fluctuation

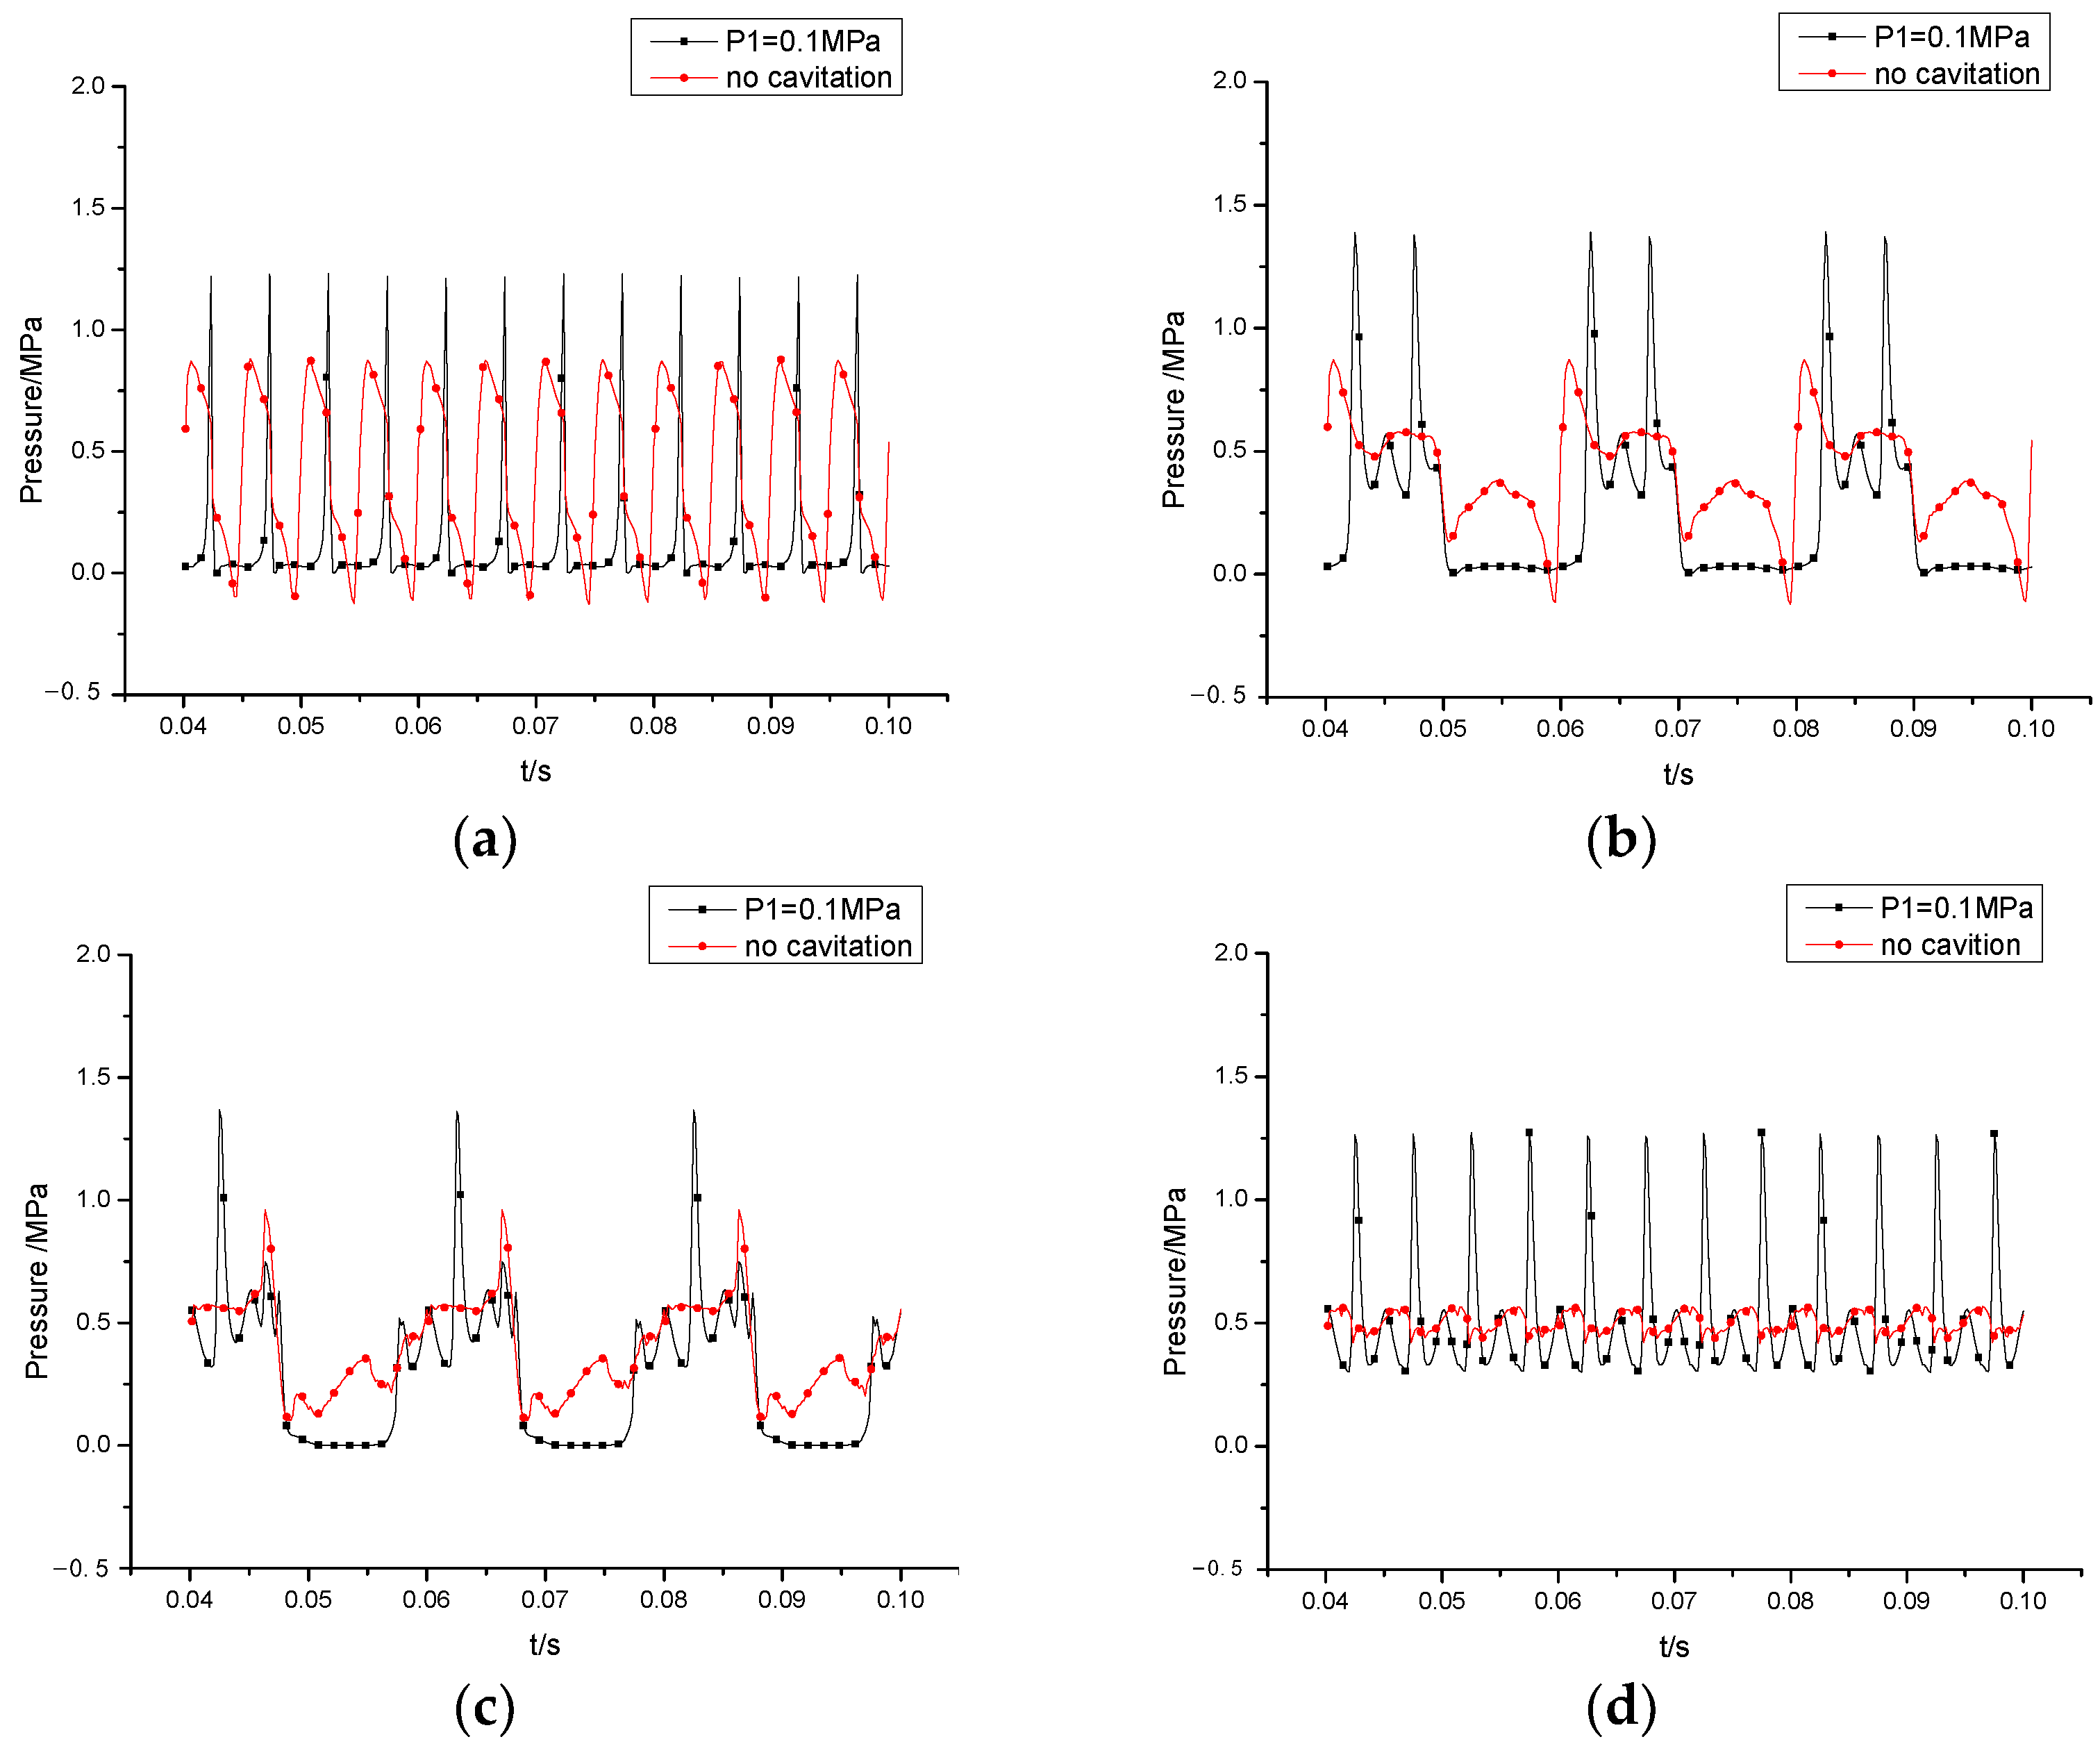
Figure 8 presents a comparison of the influence of cavitation on pressure at monitoring points with and without cavitation. Cavitation-induced pressure fluctuations have a significant impact on overall pressure fluctuations. When examining static monitoring points J and P, at a pressure of P1 = 0.1 MPa, there is a sudden change in pressure, and the amplitude and peak value of pressure fluctuations are noticeably higher in the presence of cavitation, as evident in Figure 8a,d. Figure 8b,c demonstrate that cavitation leads to abrupt pressure changes during the oil discharge stage. The peak of the pressure is approximately 1.5 times higher than that at P1 = 0.1 MPa, and the negative pressure disappears. Moreover, the curve of the pressure fluctuations exhibits a phase shift. Additionally, during the oil injection stage, the pressure rises in line with an increase in the inlet pressure.

3.3. Unsteady Flow Analysis

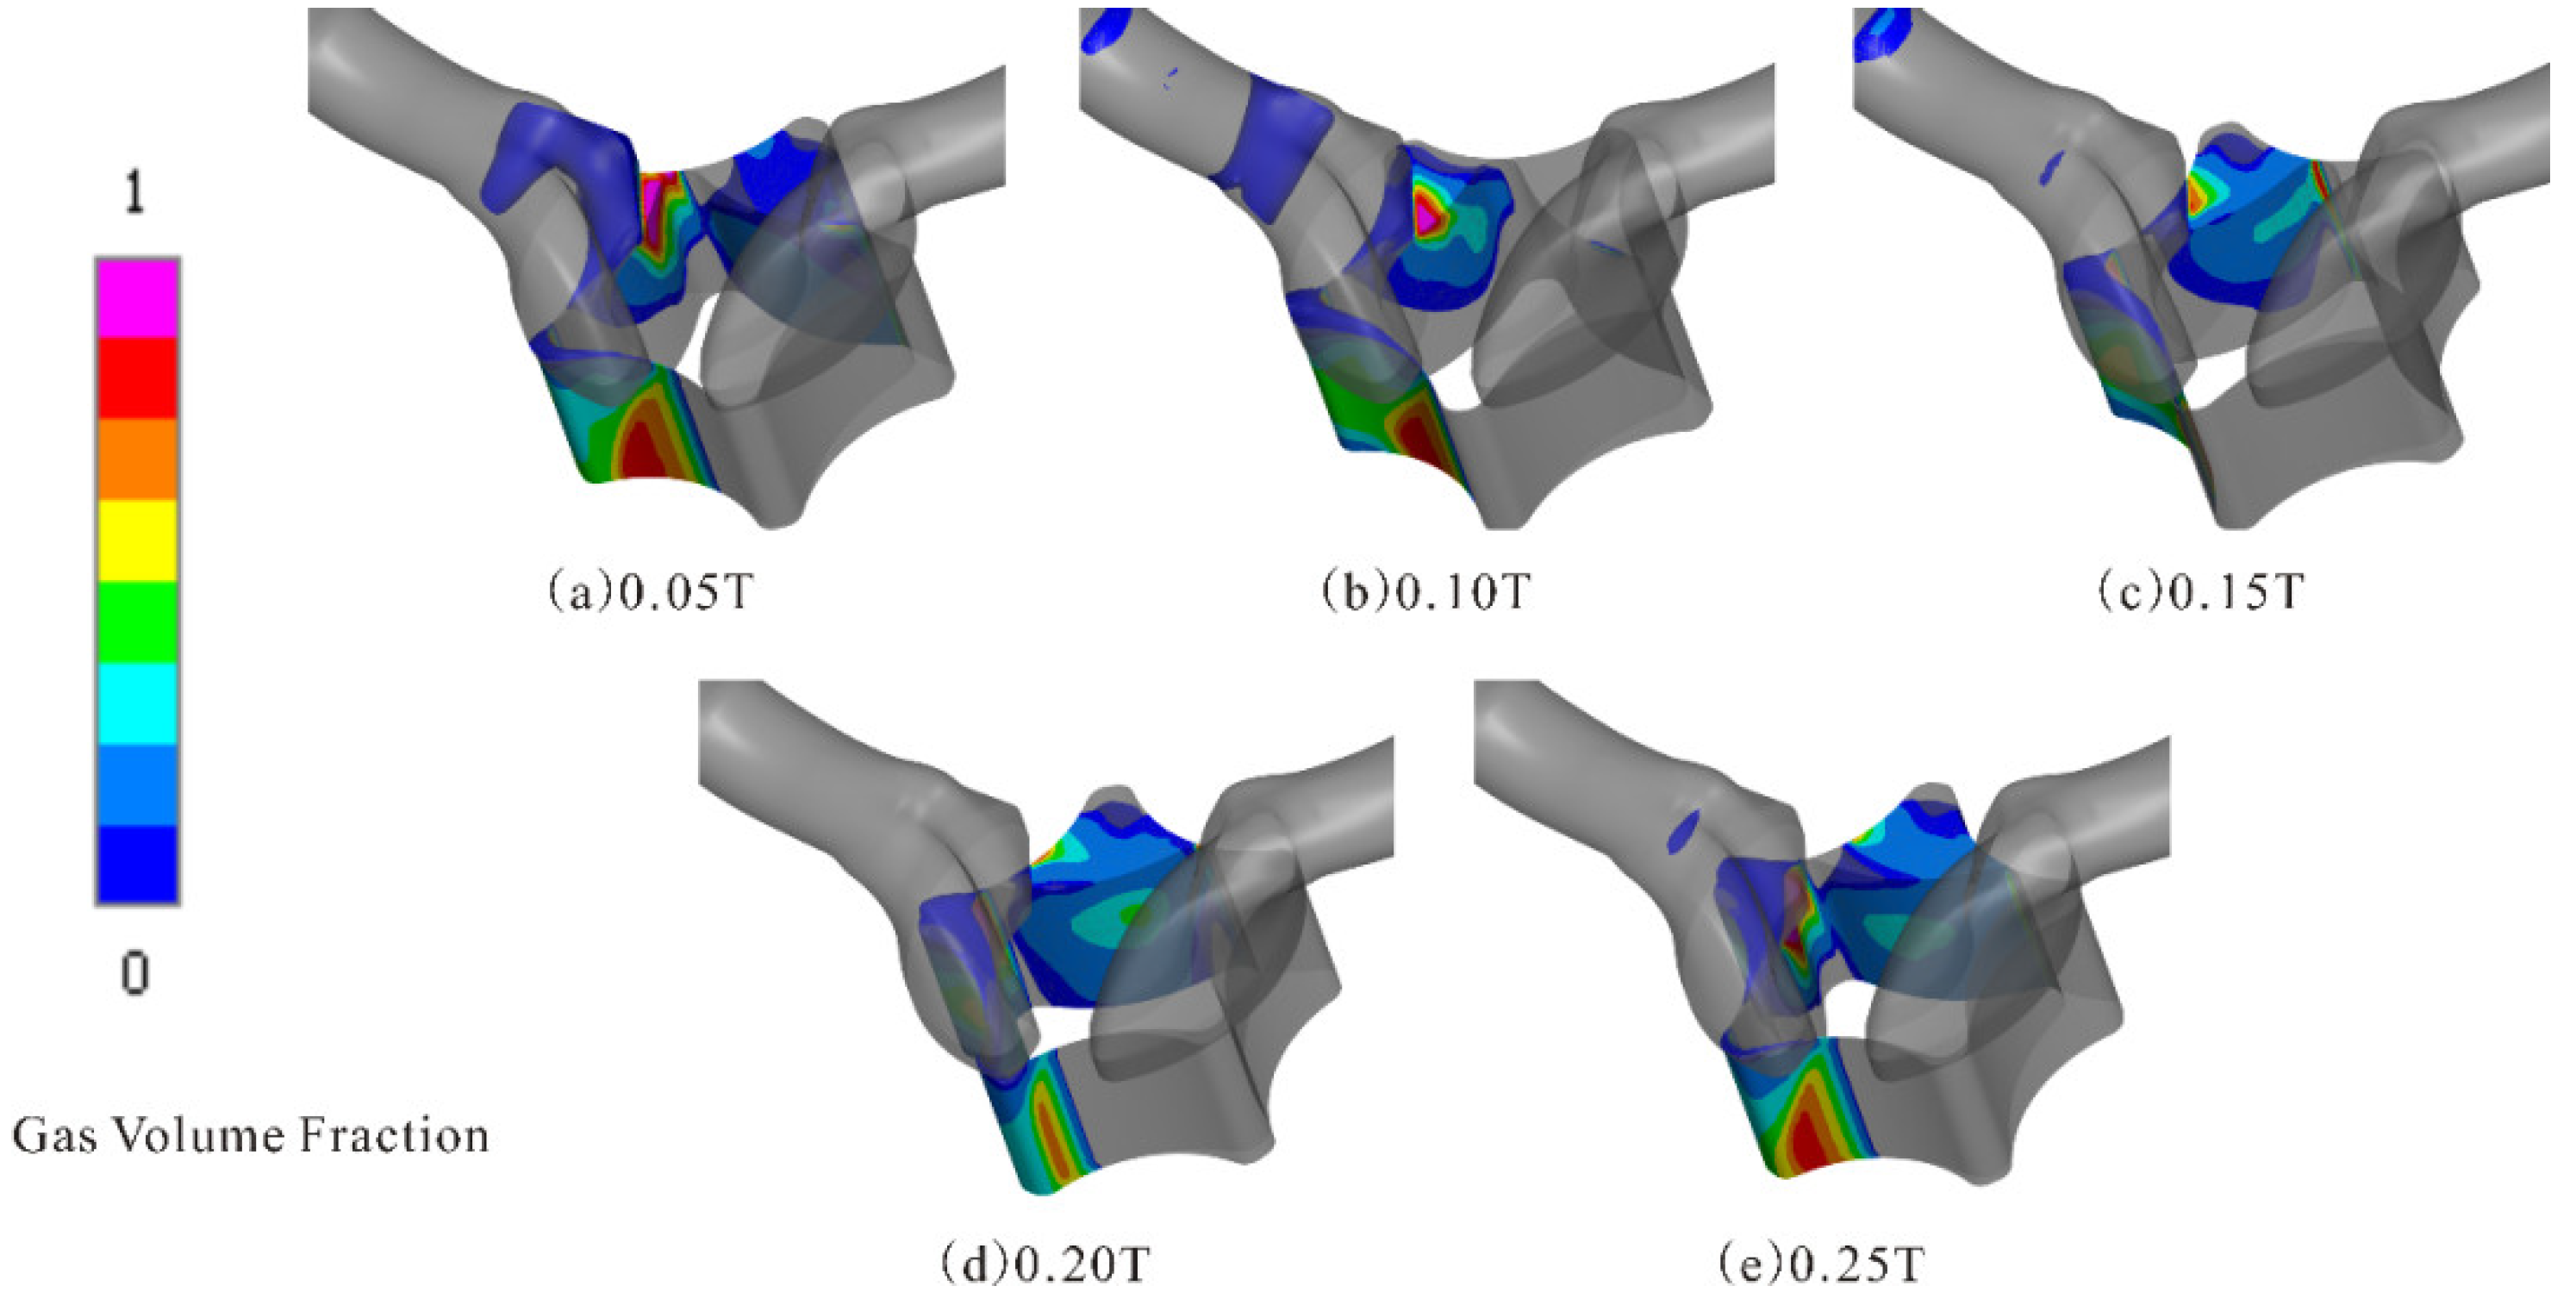
To study the inherent characteristics of the gerotor pump under cavitation, the unsteady flow of internal cavitation phenomena in the fluid domain of the pump is analyzed at an inlet pressure of P1 = 0.1 MPa. Cavitation within the pump is a dynamic process, with the growth, development, and shedding of cavities occurring in tandem with the rotation of the inner rotor. During one cycle, as the rotor spans four teeth, the cavitation process is observed at five intervals when one tooth transitions from its previous position to the next, as depicted in Figure 9. Figure 9a–e illustrates the cavity distribution of the rotor at 0.05 T, 0.1 T, 0.15 T, 0.2 T, and 0.25 T, respectively. It is evident that cavitation is already significant at P1 = 0.1 MPa, with high vapor content in the chamber area adjacent to the oil inlet groove and the dispersion of vapor into the groove itself. At this point, the rotor pump immerses in the oil, leading to an increase in chamber volume, a decrease in pressure, and vapor precipitation within the oil. Once the pressure drops below the saturated vapor pressure of the oil, cavities remain within the fluid. The collapse of these cavities, under the compression of high-pressure fluid, generates severe impact vibrations on the inner and outer rotor walls. Observing Figure 9a–c, when the chamber moves away from the oil inlet groove, the region of cavitation primarily concentrates outside the groove and is noticeably divided by the oil sealing line. Figure 9d–e demonstrates the continued movement of the chamber away from the oil sump, resulting in the gradual expansion of the chamber volume to its maximum. As observed, the cavitation region expands synchronously until the chamber is fully disconnected from the oil inlet groove, and the area where cavities attach to the root of the inner rotor exhibits an expanding trend. A dynamic observation of the cavitation growth reveals that cavitation initiates at around 7 o’clock, close to the meshing point of the oil sealing line in the small section of the oil inlet groove, with cavity pressure decreasing as the chamber expands in line with the previously described cavitation changes. The collapse of the cavitation occurs as shown in Figure 9a–e, with residual cavitation in the maximum chamber of Figure 9a resulting from the collapse of cavities in the previous cycle.

3.4. Analysis of Pressure Fluctuation at Different Positions

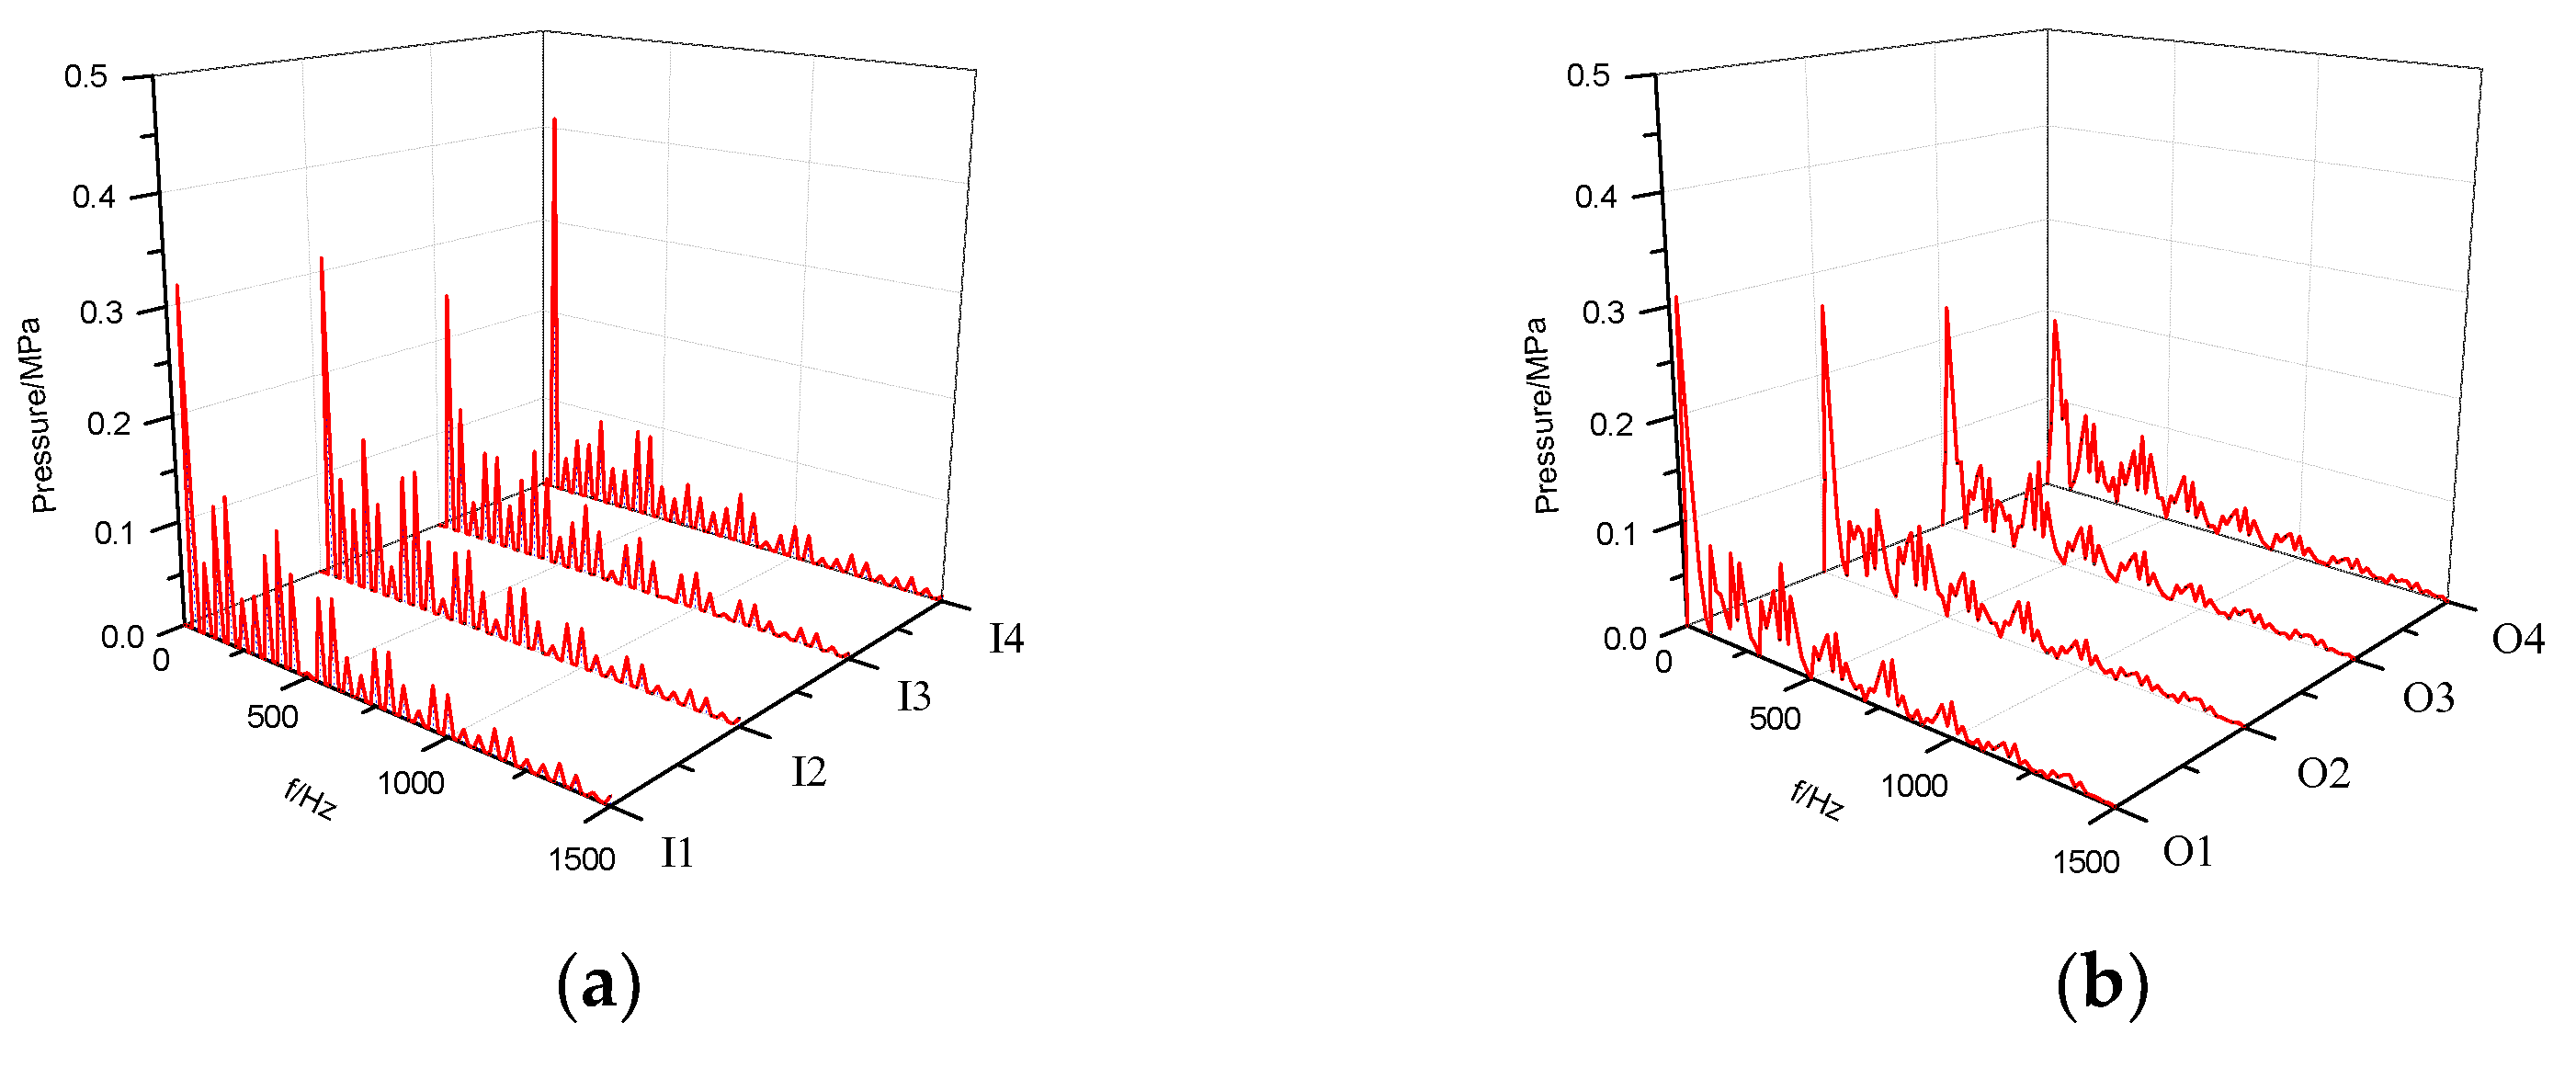
The pressure fluctuation characteristics of the rotor section are examined at an inlet pressure of P1 = 0.1 MPa. The frequency domain of pressure fluctuations at monitoring points on the cross-section is presented in Figure 10. Points I 1 , I 2 , I 3 , and I 4 are circumferentially distributed along the inner rotor edge, while points O 1 , O 2 , O 3 , and O 4 are distributed along the outer rotor’s circumference. Figure 10a demonstrates that the primary frequency of pressure fluctuations at each point corresponds to the rotating frequency f r . The largest amplitude of pressure fluctuation occurs at point I 4 , whereas point I 3 experiences the smallest amplitude, approximately 60% lower than that of point I 4 . This discrepancy can be attributed to the location of point I 4 within the tip clearance, where flow velocity is higher and pressure gradients are larger.
Figure 10 b reveals that the main frequency of pressure fluctuations is 40 Hz, corresponding to the rotating frequency f r . The highest vibration amplitude is observed at monitoring point O 1 , gradually decreasing from the tooth tip to the tooth root, with the minimum amplitude occurring at point O 4 . This can be primarily attributed to the position being the boundary between the low-pressure and high-pressure zones. Along the oil inlet groove to the oil discharge groove, a gradual decrease in pressure occurs, and the level of reduction progressively increases. These findings indicate that the chamber between the inlet and outlet grooves serves as the main source of vibration in the gerotor pump.

3.5. Analysis of Pressure Fluctuation under Different Cavitation Conditions

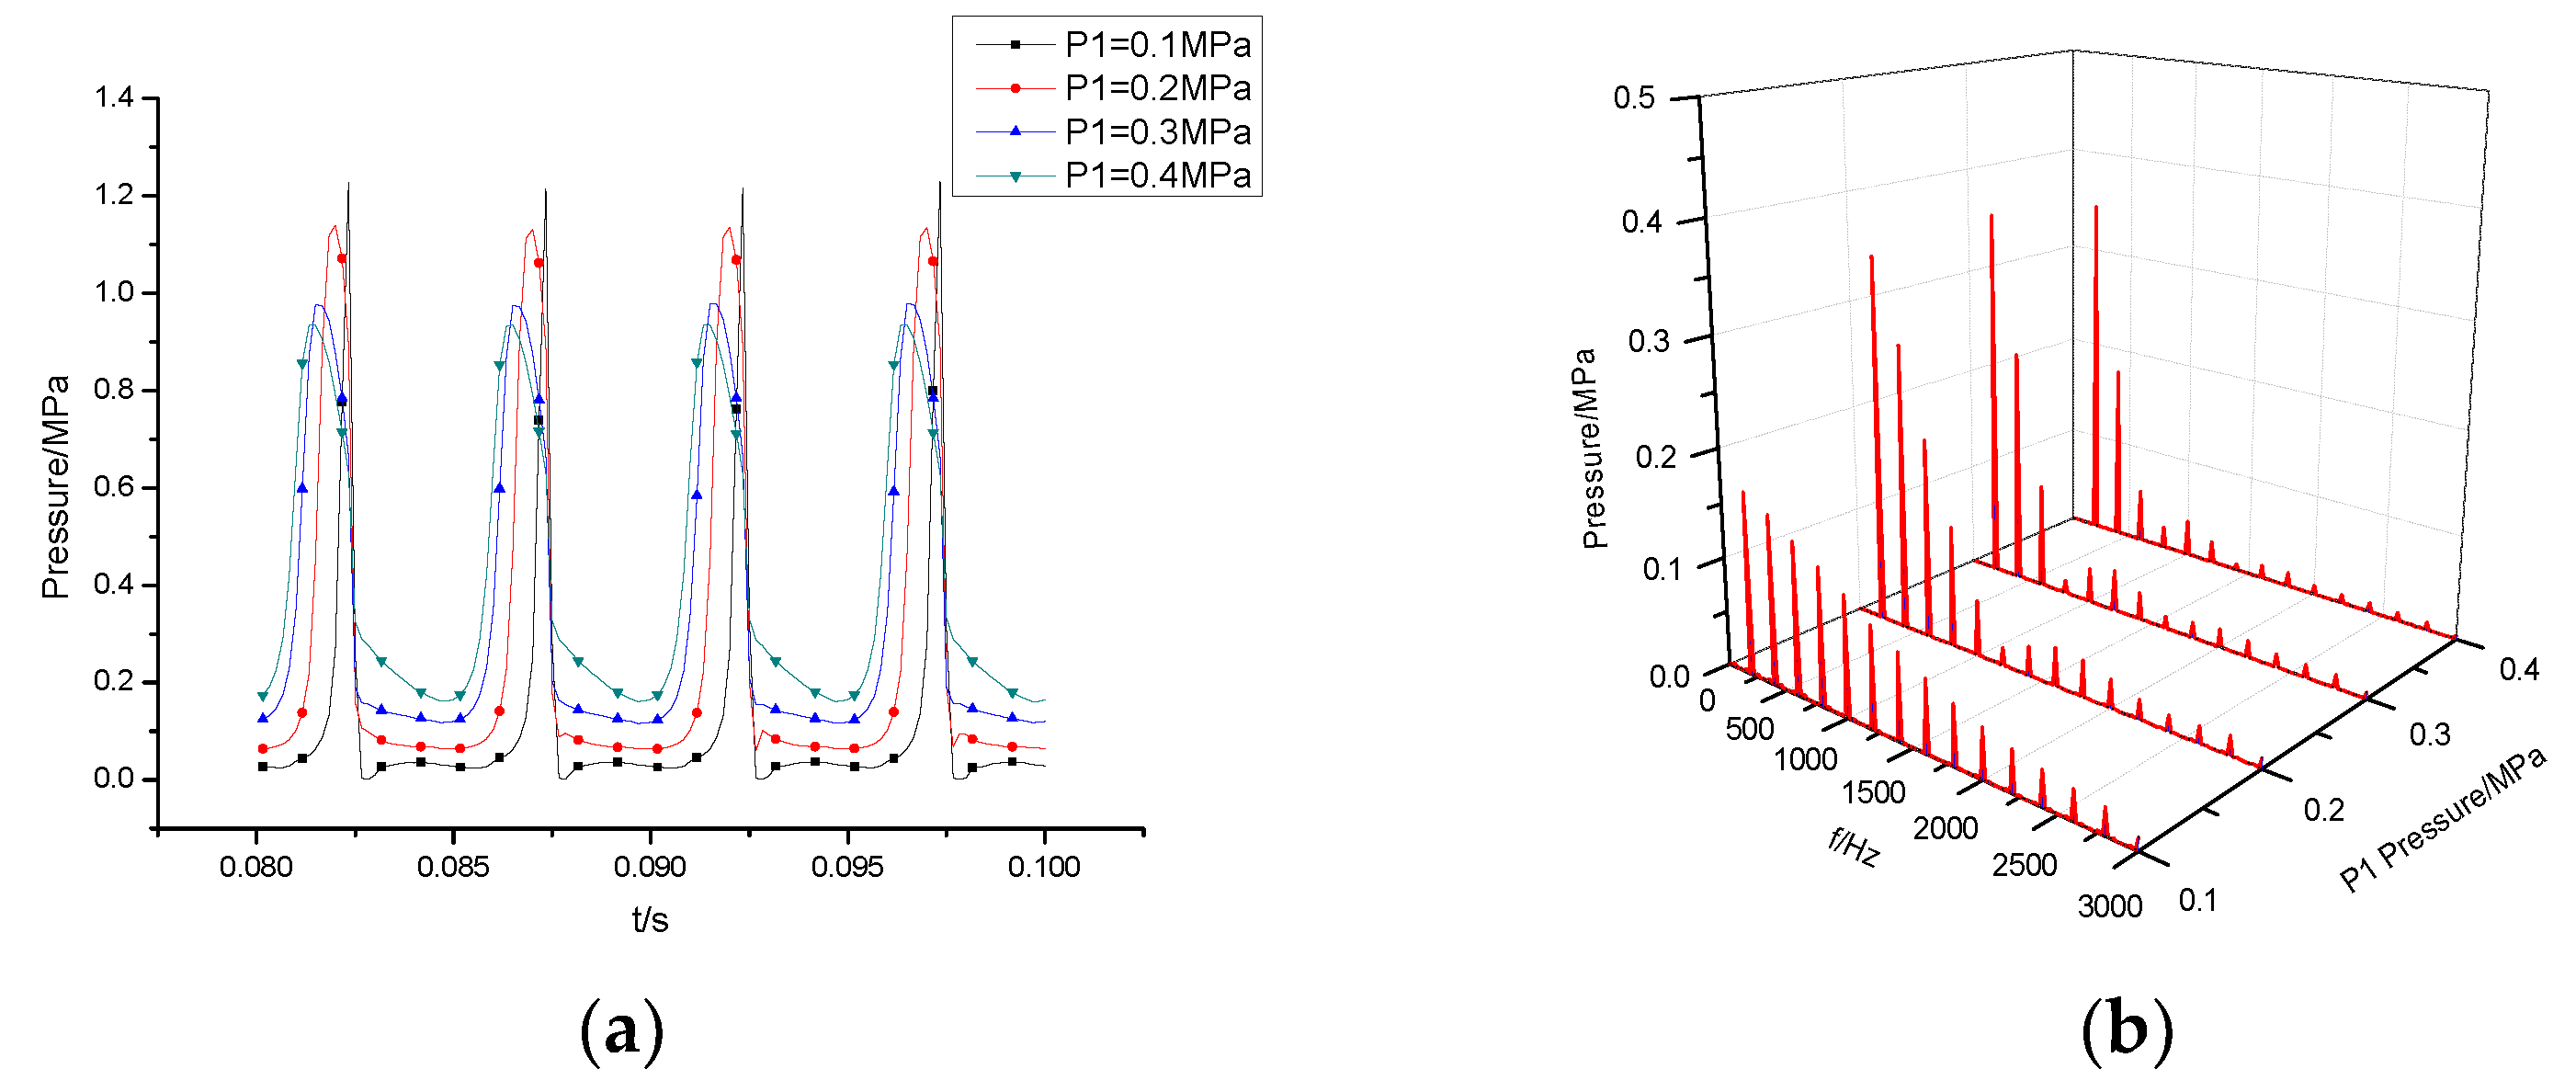
Figure 11 shows the time-domain and frequency-domain of the pressure fluctuation of the stationary monitoring point J under different cavitation conditions. It can be seen from Figure 11 a that the pressure fluctuation trend at the monitoring point is similar under different cavitation conditions. With the decrease in inlet pressure P1, the pressure fluctuation amplitude of the monitoring point gradually increases and its amplitude increases. This is because, when the rotor passes through this area, the volume of the chamber first decreases and then increases, causing the vapor content to increase, which, correspondingly, causes the pressure fluctuation to increase and then suddenly decrease, forming a peak. When P1 = 0.4 MPa, the peak pressure fluctuation decreases by about 23.7% compared with that when P1 = 0.1 MPa. It can be seen from Figure 11b that the main frequency of the pressure fluctuation at point J is f 1 , the other frequency components are 2 f 1 , 3 f 1 , and 4 f 1 , and the main frequency affecting the pressure fluctuation at point J is the fundamental frequency; moreover, the pressure fluctuation amplitude at each monitoring point decreases gradually with an increase in frequency. When P1 = 0.1 MPa, the main frequency of pressure fluctuation is not obvious, and the amplitude of pressure fluctuation is larger at each frequency doubling. With an increase in inlet pressure P1, the frequency bandwidth of pressure fluctuation decreases. When P1 = 0.4 MPa, the fluctuation of the amplitude of pressure fluctuation begins to slow down from the third harmonic of fundamental frequency.
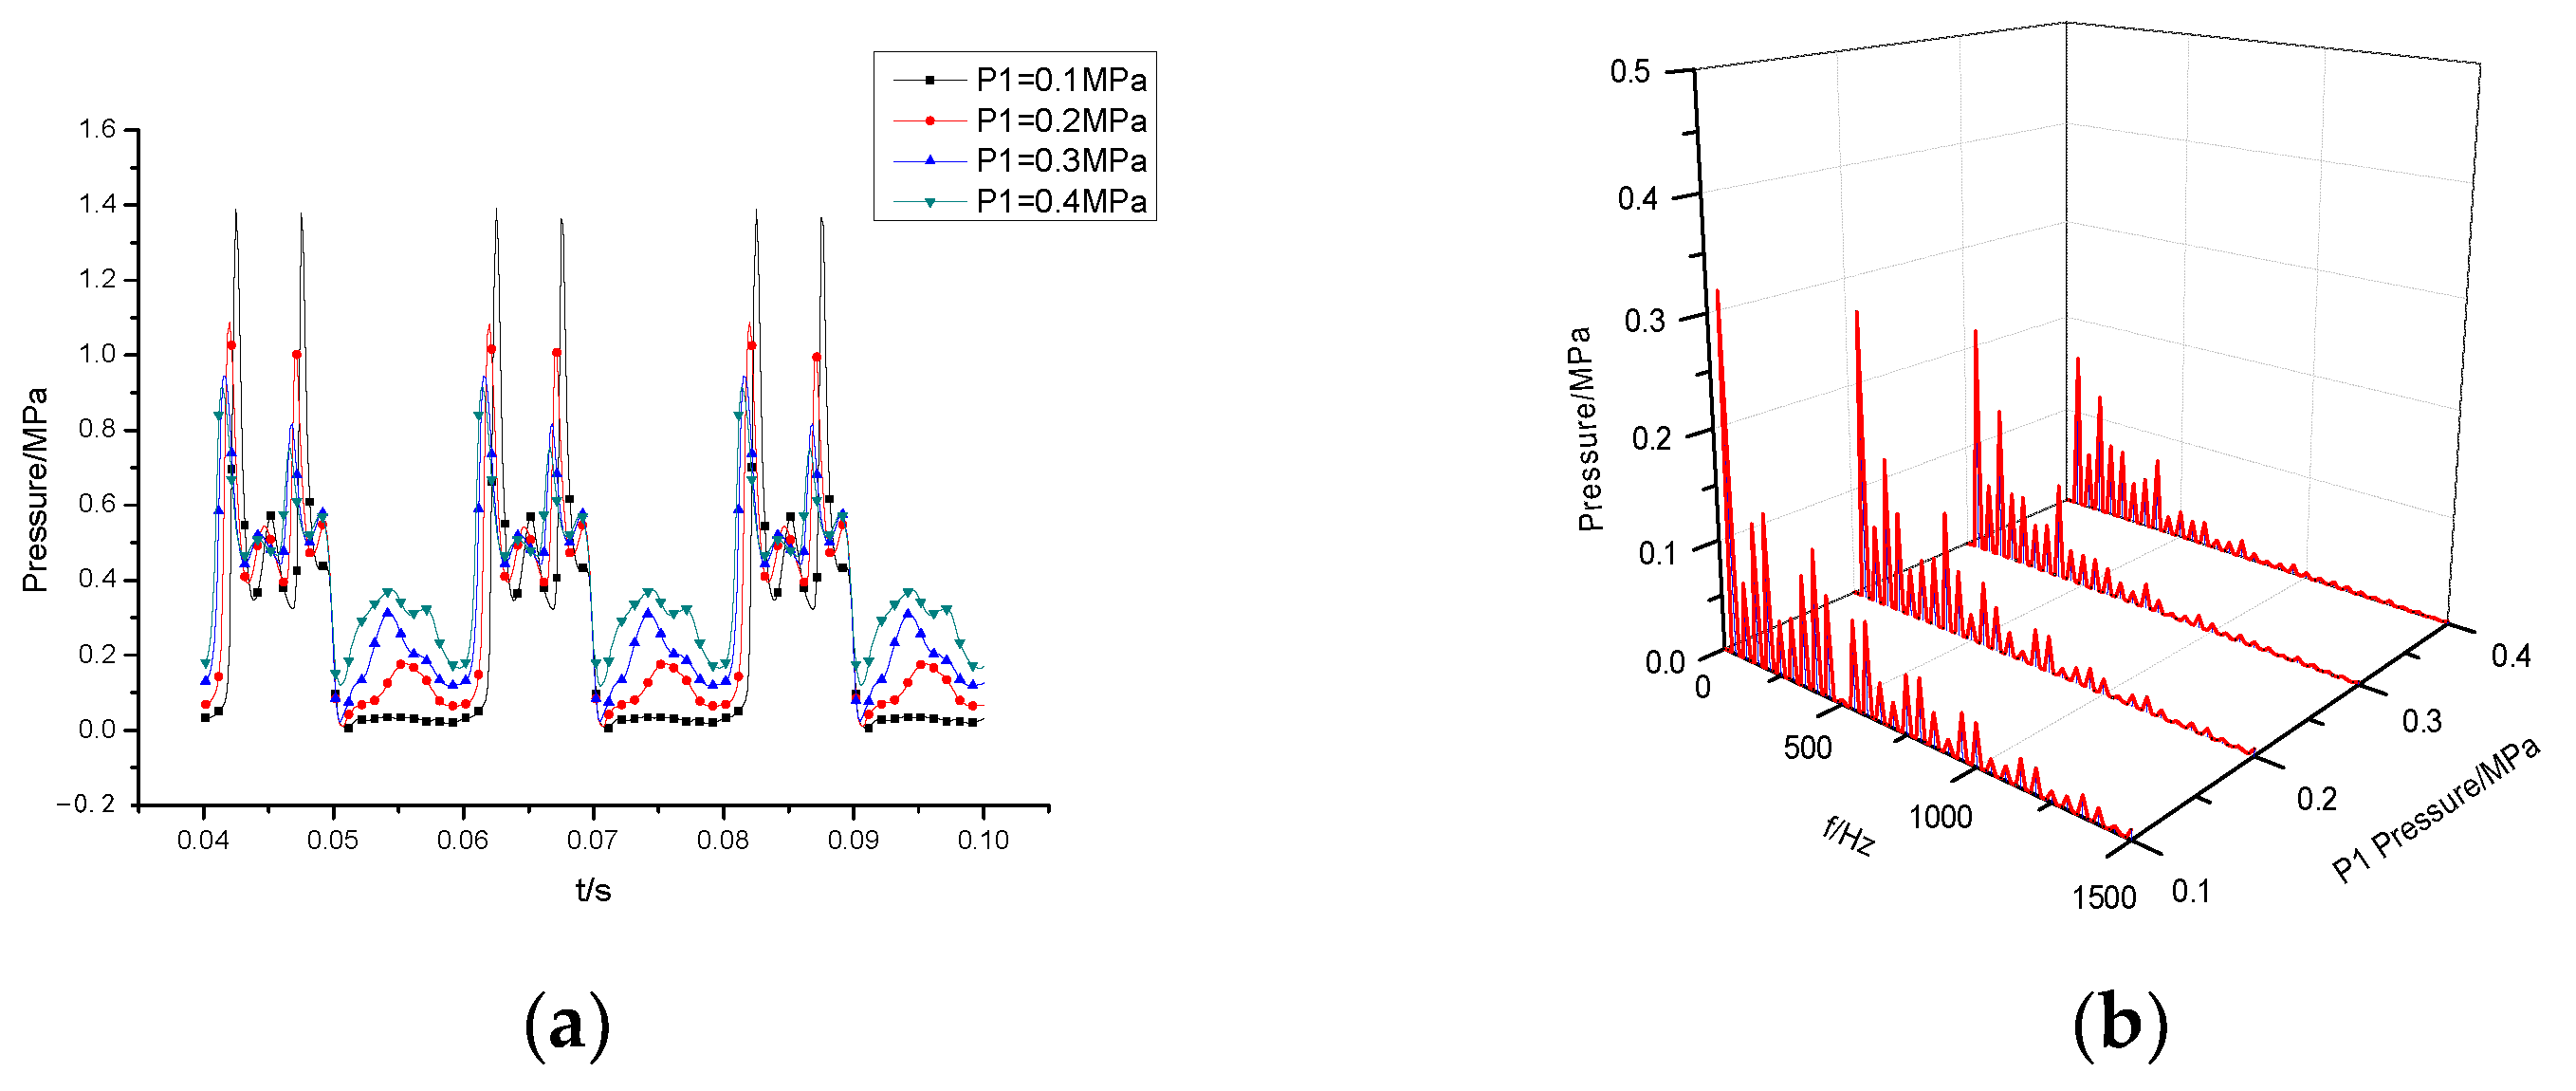
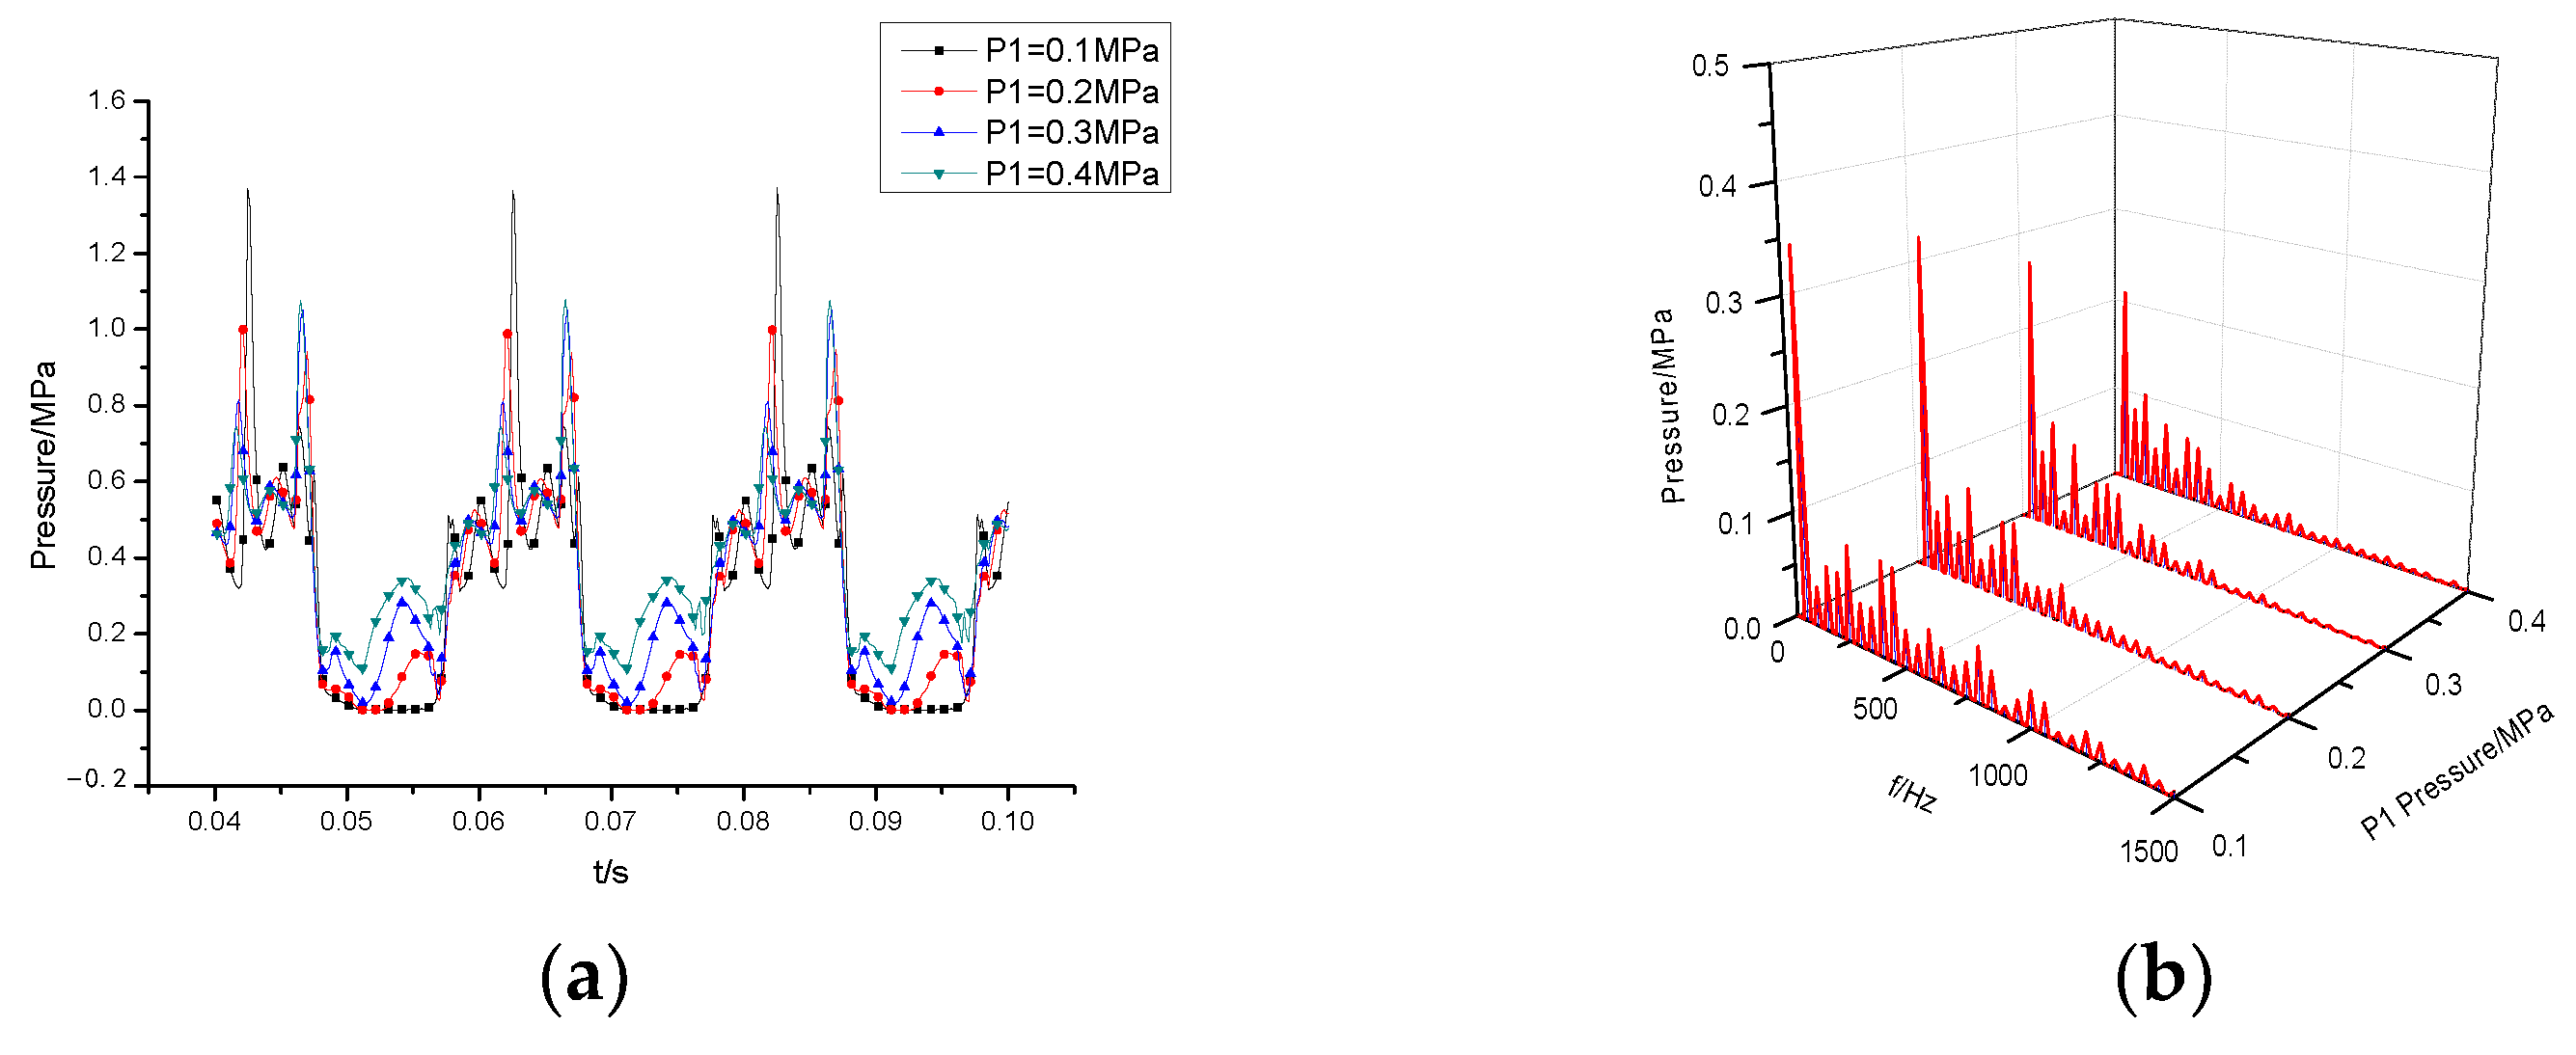
Figure 12 and Figure 13 display the pressure fluctuation in the time and frequency domains at two monitoring points I 1 and I 4 under different cavitation conditions. Figure 12a shows that the pressure fluctuation trend at the monitoring points remains similar across various cavitation conditions. During the oil discharge process, two distinct peaks of pressure are identified, occurring at 1/8T and 3/8T, respectively. The amplitude of pressure fluctuation increases significantly during these points. At 1/8T, the peak pressure decreases as the inlet pressure (P1) increases, which can be attributed to the difference in pressure fluctuation caused by cavity collapse. Moreover, it was noticed that the severity of cavitation in the chamber is directly related to P1, with lower P1 resulting in more severe cavitation and larger cavity volume, thus causing greater pressure fluctuation from cavity collapse.
At 3/8T, the chamber volume at the specific monitoring point progressively decreases, causing oil squeezing and a subsequent rise in pressure. Concurrently, cavity breakage and vibration occur (Figure 14). Figure 15 illustrates that the monitoring point is located in the smallest chamber, where oil trapping ensues due to the minimal leakage flow between the teeth. This trapping leads to pressure shock, amplifying pressure fluctuation, with the peak value increasing with P1.
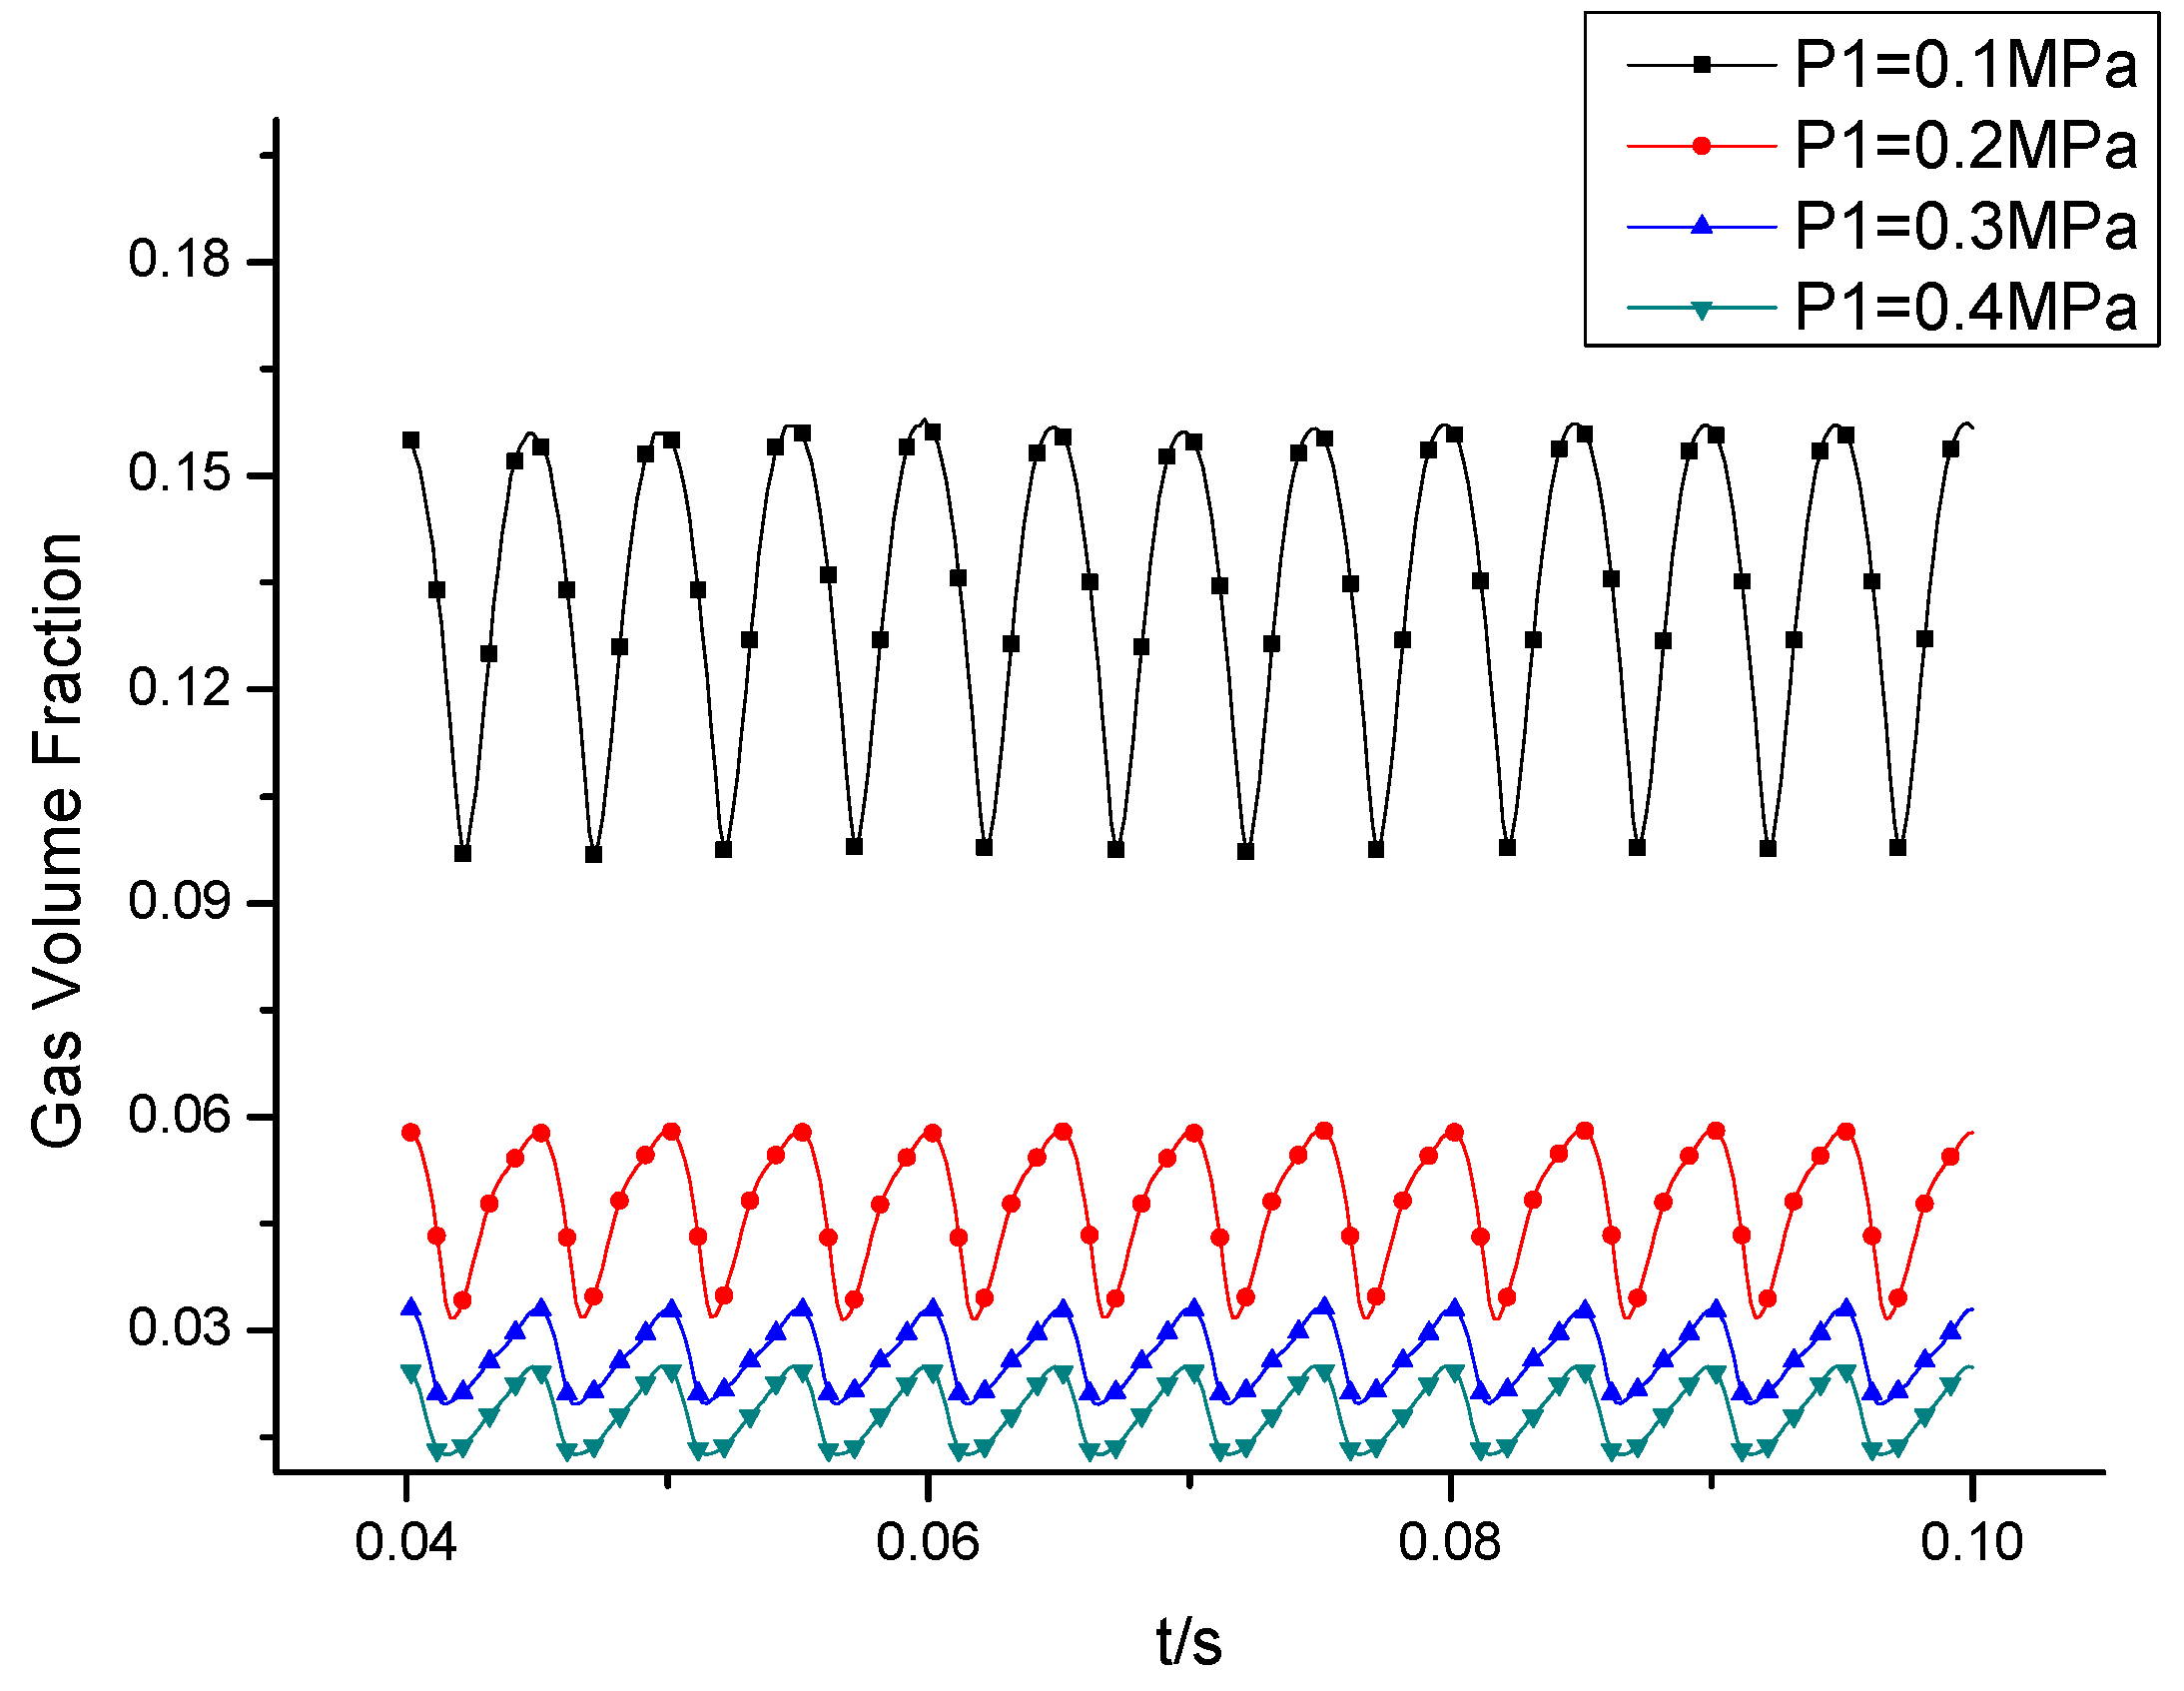
The pressure fluctuation waveforms of I 1 and I 4 demonstrate delayed responses as P1 decreases. This delay is attributed to the small amount of liquid flowing into the chamber through the tip clearance during cavitation. At this moment, the chamber contains a higher vapor content, resulting in high compressibility and a slow rise in pressure. This behavior aligns with the vapor content in the rotor, as shown in Figure 16. The pressure fluctuation amplitude between the two peak pressure points is small, indicating that the chamber is connected to the oil outlet groove during this period, leading to a decrease in pressure due to oil discharge. In the middle stage of oil inflow, the pressure fluctuation at the monitoring point stabilizes and tends toward zero. As P1 increases during this phase, the pressure fluctuation amplitude also increases proportionally.
The frequency domain analysis of I 1 is depicted in Figure 12b. The primary frequency component of the pressure fluctuation at point I 1 is the frequency f r . Additional frequency components include 3 f r and f 1 . The blade frequency and its harmonics are influenced by static and dynamic interference from both the internal and external rotors. As the frequency increases, the amplitude of each monitoring point dramatically decreases. It is evident that the fundamental frequency predominantly affects the pressure fluctuation at point I 1 . The fluctuation amplitude increases with increasing inlet pressure, with the amplitude at P1 = 0.1 MPa being approximately 90% of that at P1 = 0.4 MPa.
Figure 13b demonstrates the frequency f r as the principal frequency of pressure fluctuation at point I 4 , with 3 f r and 5 f r being the subsequent frequency components. Similar to the previous case, as the frequency rises, the amplitude of each monitoring point decreases significantly. The fundamental frequency primarily influences the pressure fluctuation at point I 4 , and the fluctuation amplitude escalates with increasing P1. At P1 = 0.1 MPa, the pressure fluctuation amplitude is about 85% of that at P1 = 0.4 MPa. Additionally, the bandwidth decreases as P1 increases.
Figure 17 shows the time-domain and frequency-domain of the pressure fluctuation of the monitoring point P under different cavitation conditions. The pressure fluctuations at the monitoring points show obvious periodic changes under different cavitation conditions. With a decrease in inlet pressure, the pressure fluctuation amplitude of the monitoring point increases gradually, and its amplitude increases. This is because the decrease in inlet pressure causes the cavitation phenomenon in the rotor to be intensified. When the pressure in the rotor increases, the pressure shock caused by the collapse of the cavity increases. It can be seen from Figure 17b that different cavitation conditions do not affect the main frequency of the pressure fluctuation at the monitoring point. The fluctuation of the flow is mainly concentrated in the low-frequency region; moreover, the main frequency is 2 f 1 , and the secondary frequency is f 1 . When P1 = 0.1 MPa, the pressure fluctuation peak is 0.245 MPa, which is three times as high as 0.084 when P1 = 0.4 MPa.
Figure 14 shows the pressure distribution of the rotor section at 3/8T. With an increase in inlet pressure P1, the pressure of the chamber in contact with the oil inlet groove increases gradually, and the pressure of the chamber in contact with the oil outlet groove decreases gradually.
Regarding the relationship of the variation of the vapor volume fraction in the chamber with time, according to Figure 16, the volume fraction of the air is lowest at 1/8T, when the rotating position is at the maximum oil absorption chamber, the oil outlet groove has not yet been separated, and the suction phenomenon occurs. With the rotation of the rotor, the chamber gradually separates from the oil absorption zone, the oil absorption area is reduced, and the suction phenomenon is more obvious. At 1/4T, the maximum chamber is completely out of the oil absorption zone and the vapor volume fraction is maximized.
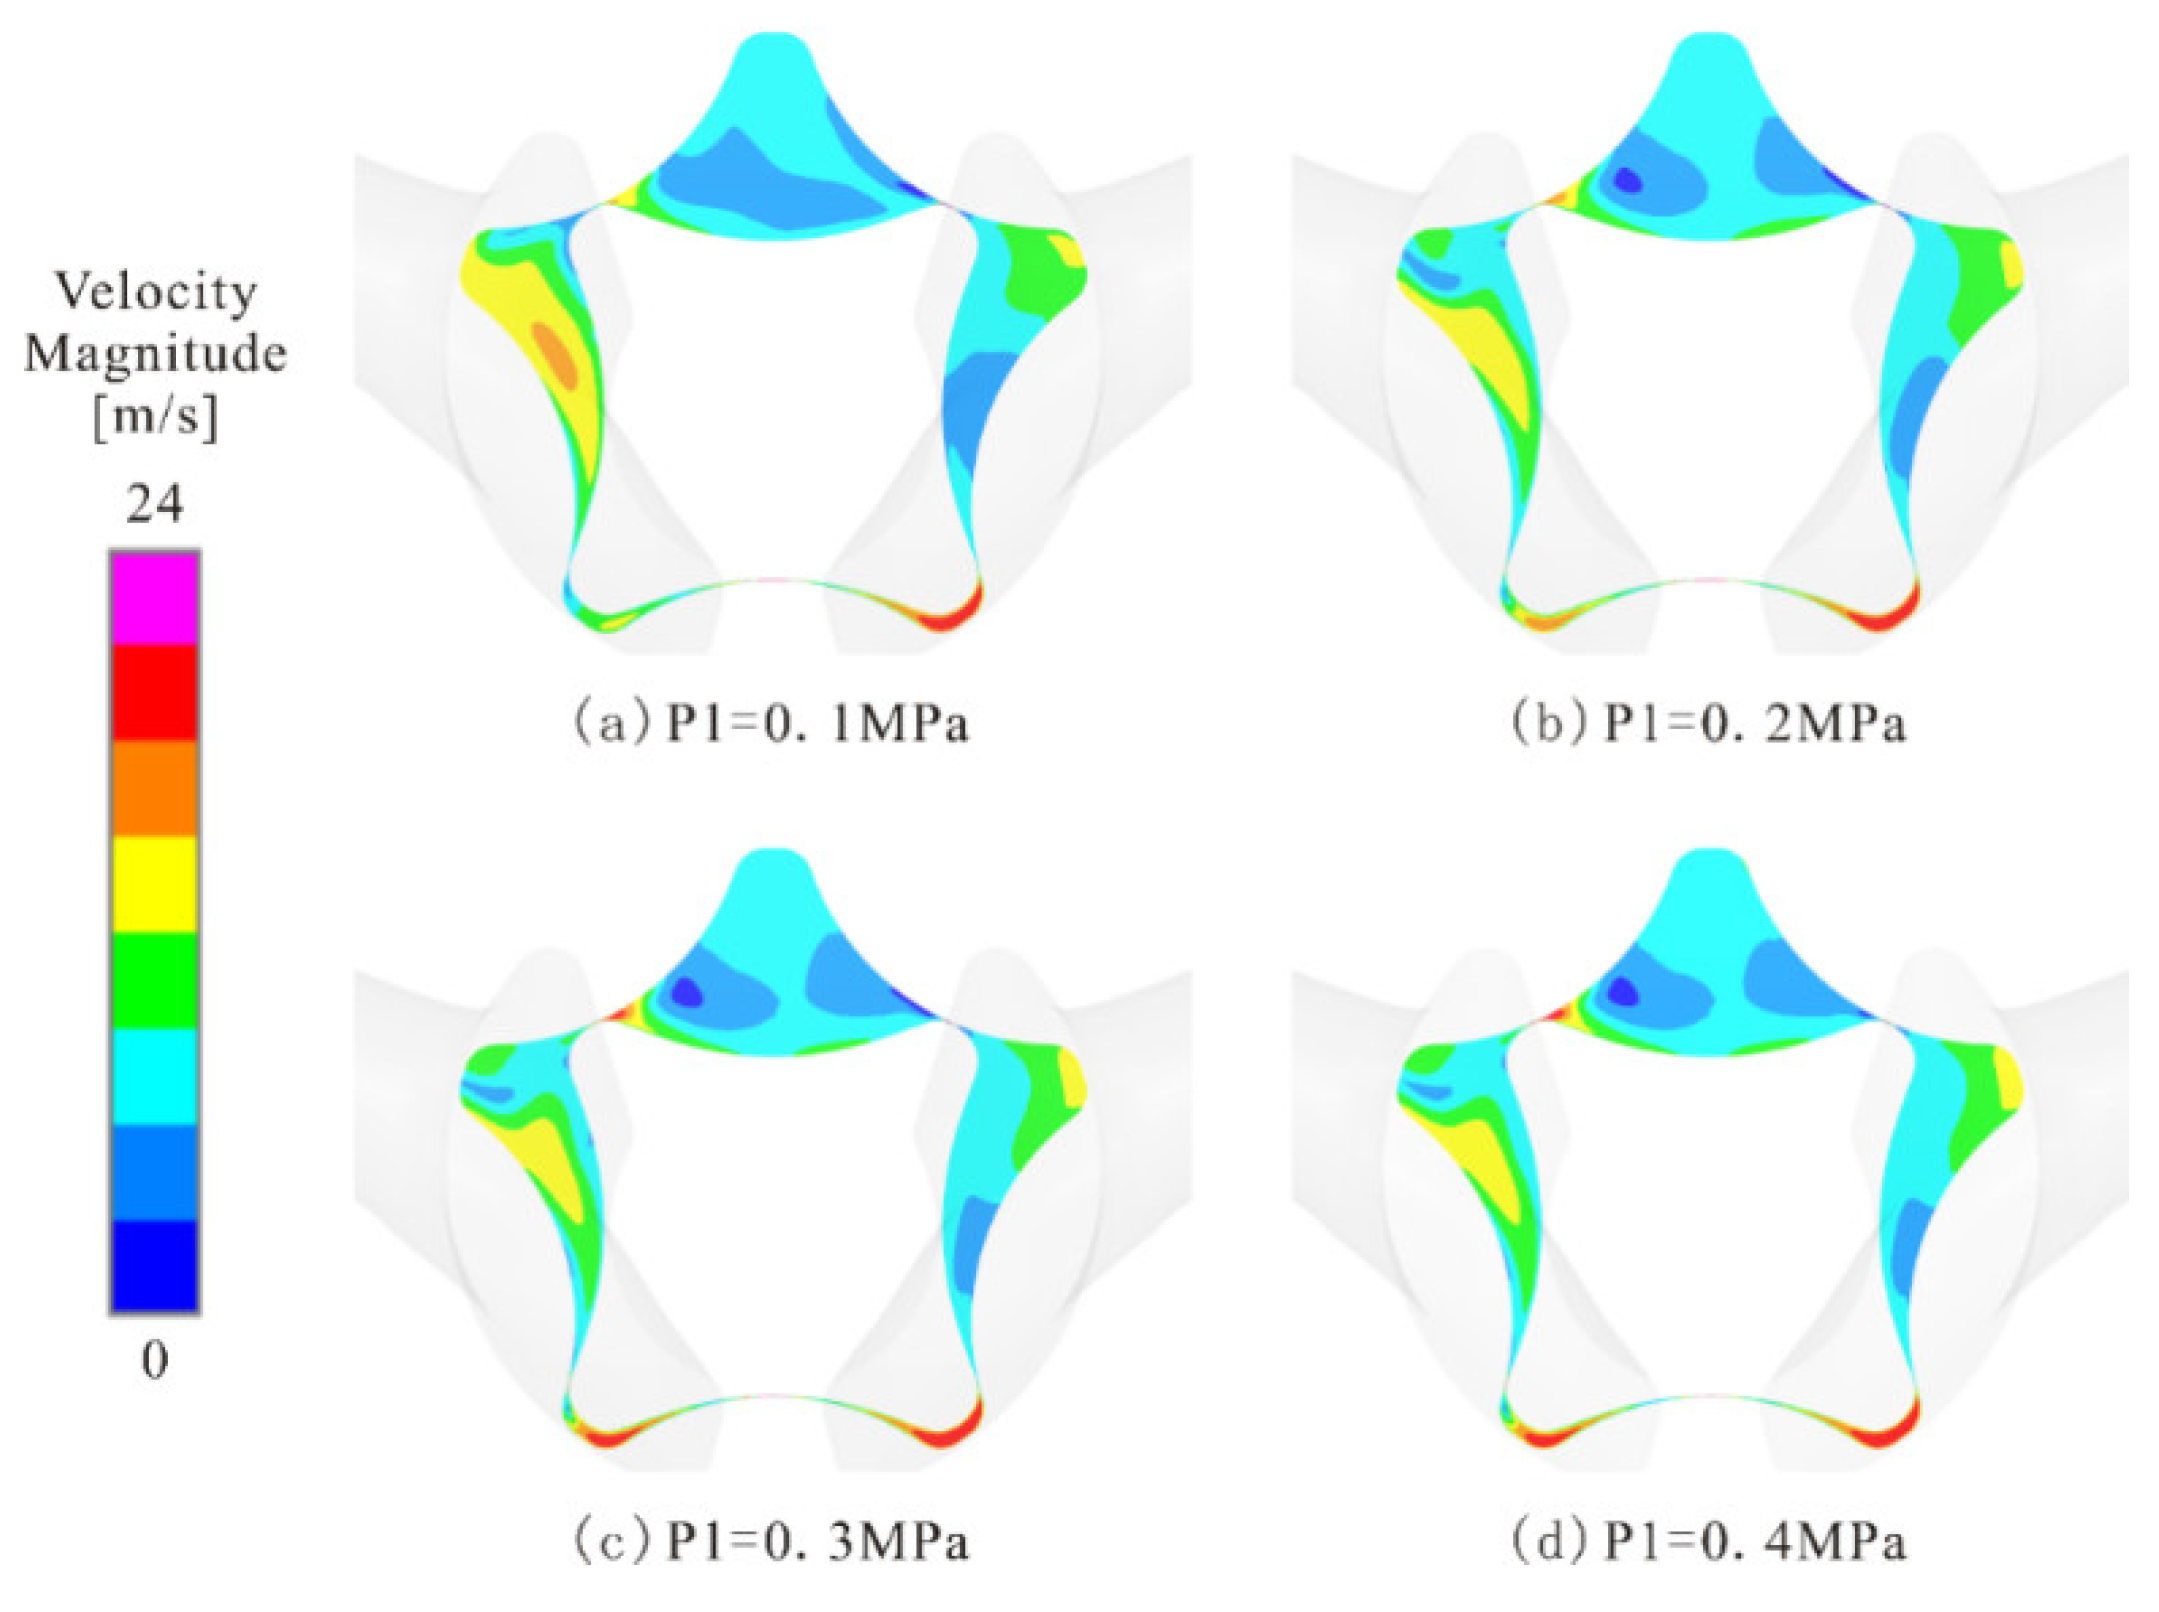
Figure 18 shows the velocity distribution at the cross-section under different inlet pressures. As can be seen from the figure, the velocity of the fluid is distributed stepwise along the direction of rotation of the rotor. The velocity of the chamber in contact with the inlet and outlet groove is larger, and the velocity at the maximum chamber is small. There are two areas near the wall surface of the outer rotor where the velocity is almost zero. With an increase in inlet pressure P1, the velocity at the chamber in contact with the oil inlet groove decreases, and the area of the high-velocity-flow region gradually decreases; the velocity at the chamber in contact with the oil discharge groove increases, and the high-velocity flow occurs at the tip clearance; the low-speed flow area expands at the maximum chamber.
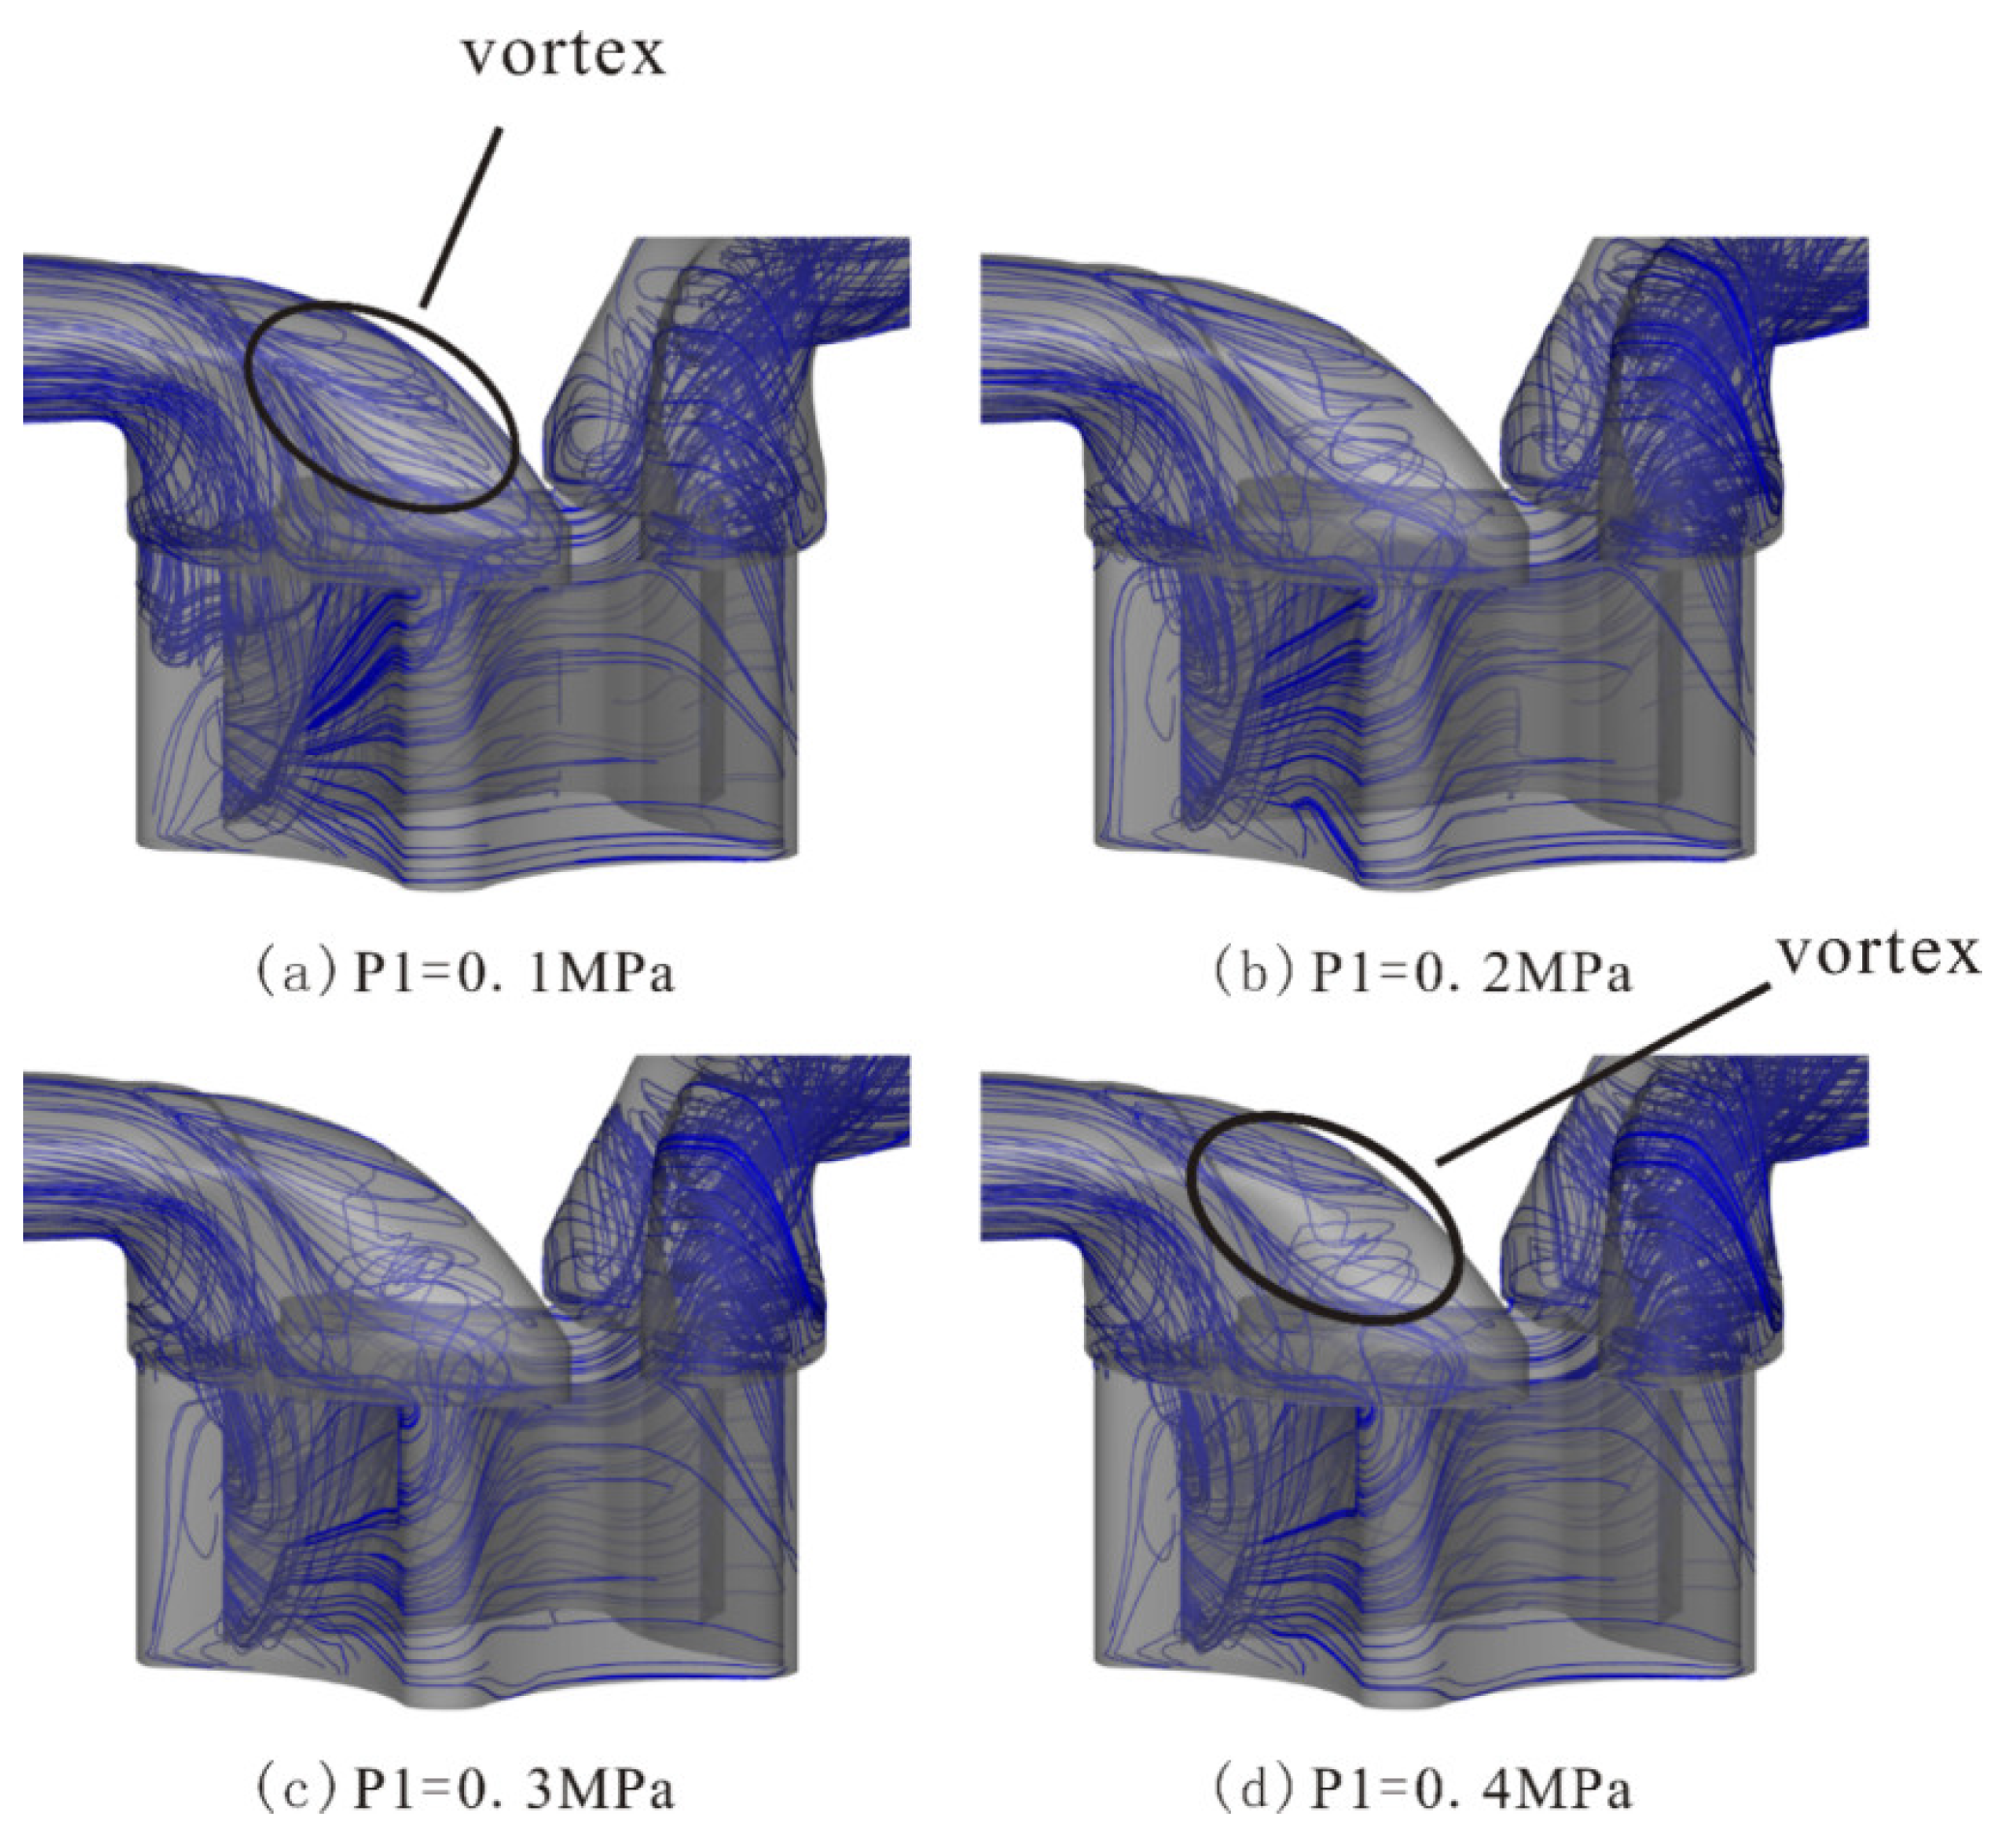
Figure 19 depicts the streamline distribution in the fluid domain under different cavitation conditions. The graph reveals that the streamlines are denser near the sealing line of the inlet and outlet grooves, indicating a more intense flow and increased oil–liquid exchange between the grooves and chambers. Consequently, the chambers experience recirculation and the formation of vortices, characterized by lower central pressures. When the pressure falls below the saturation vaporization pressure of the fluid, cavitation occurs, leading to the formation of more cavities. Additionally, flow disorder in this region results in noise and vibration. As the flow progresses beyond the inlet and outlet grooves, it becomes relatively smoother in the chambers. When comparing Figure 19a,d at the location enclosed by the circle, it can be observed that, at P1 = 0.1 MPa, the flow near the small-end sealing line of the inlet grooves is disordered, resulting in more vortices. However, with increasing inlet pressure (P1), the streamlines become sparser, indicating a more stable flow with fewer vortices. Simultaneously, the streamline in the outlet groove becomes more prominent and the flow intensifies as P1 increases.
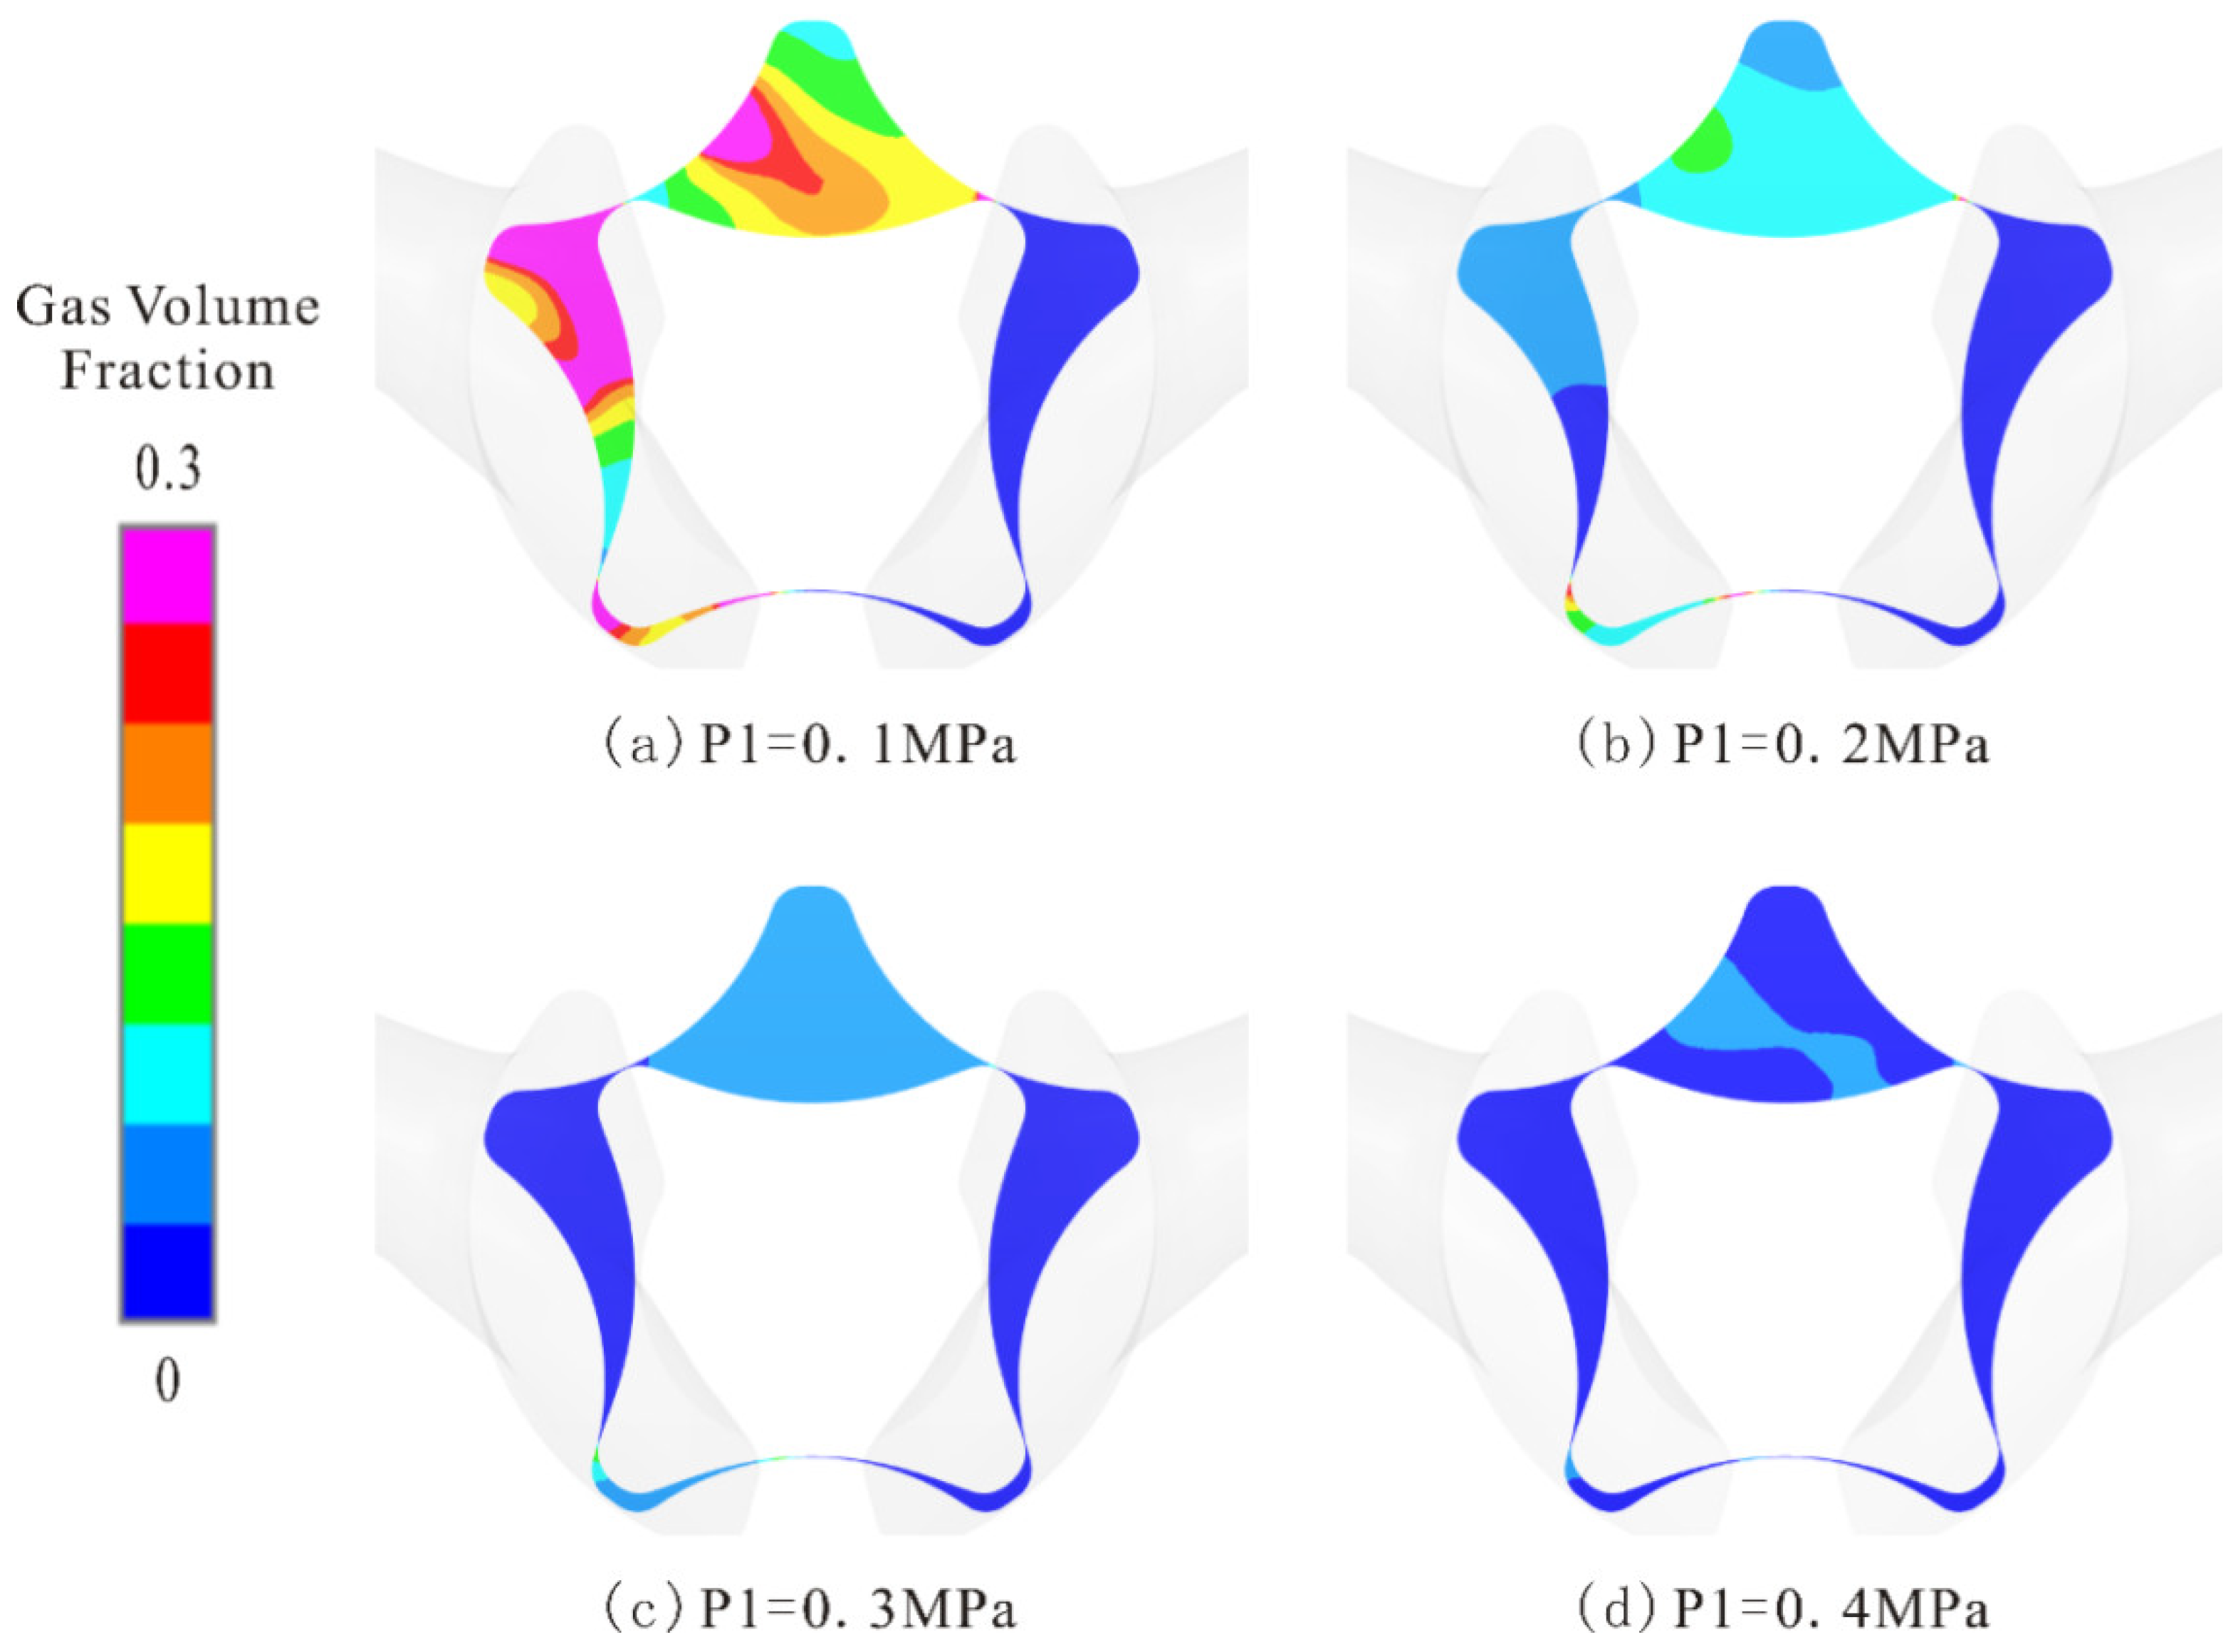
Figure 20 compares the vapor volume fraction at different inlet pressures. As the inlet pressure decreases, the vapor volume fraction in the maximum chamber significantly increases, aligning with the trend observed throughout the rotor chamber. Comparing Figure 20a,b, it is evident that cavitation is more severe when P1 = 0.1 MPa, resulting in larger cavity collapse-induced vibration. Increasing P1 to 0.2 MPa reduces the degree of cavitation and subsequently lowers the pressure. When comparing Figure 20c,d, it can be seen that the cavity in the chamber disappears during this phase. However, the pressure at the inlet and outlet grooves in the latter case is greater than in the former, resulting in larger pressure fluctuations at the monitoring point. By referring to Figure 16, it is evident that changes in the velocity of the working fluid in the pump contribute to local instantaneous pressure drops below the saturation pressure, leading to cavitation in the pump chambers.

4. Conclusions

In this study, the cavitation flow and pressure fluctuations inside the gerotor pump were analyzed using numerical simulation methods, which helps to reveal the fluid dynamic mechanism and provides a theoretical basis for the optimization design and safe operation of the pump. The following conclusions can be drawn:
(a)
The range of cavitation in the rotor increases as the inlet pressure decreases, with vapor even spreading into the oil inlet groove. Unsteady flow analysis predicts the development characteristics of the cavity at an inlet pressure of P1 = 0.1 MPa. The results indicate that the vapor content in the interdental volume in contact with the oil inlet groove is higher and that the cavity collapses under compression, resulting in a greater pressure impact;
(b)
As the inlet pressure decreases, cavitation becomes more severe, and the pressure fluctuation caused by cavity collapse increases. The main frequency of pressure fluctuation is not affected by cavitation conditions. The main frequency of monitoring points on the rotor appears at the rotating frequency f r , and the bandwidth decreases with increasing inlet pressure. The main frequencies of the static monitoring points occur at blade passing frequency f 1 ;
(c)
The pressure fluctuation amplitude is strongest at point O 1 , which is located in the demarcation zone between the low-pressure zone and the high-pressure zone in the chamber. On the outer rotor side, the pressure fluctuation gradually decreases from the top to the root of the tooth, with the reduction increasing gradually. On the inner rotor side, the pressure fluctuation amplitude at point I 3 is the smallest, and the pressure fluctuation amplitude at point I 4 is the largest. The volume between the oil inlet groove and the oil outlet groove is the main vibration source in the rotor pump.
Based on the results of this study, several directions for future research can be proposed. Firstly, conducting parameter optimization studies to determine the optimal structural parameters of the gerotor pump would be beneficial. This would involve finding the most efficient and effective configurations of the pump’s components to enhance its performance. Additionally, it is important to consider fluid–structure coupling in order to accurately predict the pump’s vibration response caused by cavitation. Understanding how cavitation affects the pump’s behavior can help develop strategies to mitigate its negative effects and ensure reliable operation. These research directions can contribute to advancements in gerotor pump design and operation.

Author Contributions

Conceptualization, P.Z. and G.X.; methodology, P.Z.; software, J.D.; validation, J.C. and C.X.; formal analysis, J.C.; writing—original draft preparation, J.C. and J.D.; writing—review and editing, P.Z. and J.C.; supervision, C.X. and S.Z.; project administration, P.Z. and G.X.; funding acquisition, P.Z., S.Z., and C.X. All authors have read and agreed to the published version of the manuscript.

Funding

This work was supported by the China Postdoctoral Science Foundation (Grant No. 2022M712816), the Open Project Program of Engineering Research Center of High-efficiency and Energy-saving Large Axial Flow Pumping Station, Jiangsu Province, Yangzhou University (Grant No. ECHEAP2022-007), Zhejiang Provincial Science and Technology Plan Project of China (Grant No. 2022C02035), and the National Natural Science Foundation of China (Grant No. 51976193).

Data Availability Statement

Not applicable.

Acknowledgments

Authors acknowledge the anonymous referees for their valuable suggestions.

Conflicts of Interest

The authors declare no conflict of interest.

References

  1. Ham, J.; Kim, S.; Oh, J.; Cho, H. Theoretical Investigation of the effect of a relief groove on the performance of a gerotor oil pump. J. Mech. Sci. Technol. 2018, 32, 3687–3698. [Google Scholar] [CrossRef]
  2. Zhou, P.; Dai, J.; Li, Y.; Chen, T.; Mou, J. Unsteady flow structures in centrifugal pump under two types of stall conditions. J. Hydrodyn. 2018, 30, 1038–1044. [Google Scholar] [CrossRef]
  3. Pradhan, A.R.; Sahoo, V. Inter-chamber leakage flow through the transition contacts in epitrochoid generated star and ring hydrostatic units. Proc. Inst. Mech. Eng. Part C J. Mech. Eng. Sci. 2023, 237, 1244–1263. [Google Scholar] [CrossRef]
  4. Zhou, P.; Dai, J.; Yan, C.; Zheng, S.; Ye, C.; Zhang, X. Effect of stall cells on pressure fluctuations characteristics in a centrifugal pump. Symmetry 2019, 11, 1116. [Google Scholar] [CrossRef]
  5. Ye, C.; Tang, Y.; An, D.; Wang, F.; Zheng, Y.; van Esch, B.P.M. Investigation on stall characteristics of marine centrifugal pump considering transition effect. Ocean. Eng. 2023, 280, 114823. [Google Scholar] [CrossRef]
  6. Zhang, S.; Yao, Z.; Wu, H.; Zhong, Q.; Tao, R.; Wang, F. A new turbulent viscosity correction model with URANS solver for unsteady turbulent cavitation flow computations. J. Fluids Eng. 2022, 144, 091403. [Google Scholar] [CrossRef]
  7. Zhou, W.; Zhou, P.; Xiang, C.; Wang, Y.; Mou, J.; Cui, J. A review of bionic structures in control of aerodynamic noise of centrifugal fans. Energies 2023, 16, 4331. [Google Scholar] [CrossRef]
  8. Jacazio, G.; De Martin, A. Influence of rotor profile geometry on the performance of an original low-pressure gerotor pump. Mech. Mach. Theory. 2016, 100, 296–312. [Google Scholar] [CrossRef]
  9. Zhang, D.; Perng, C.; Laverty, M. Gerotor oil pump performance and flow/pressure ripple study. SAE Trans. 2006, 115, 204–209. [Google Scholar]
  10. Suresh Kumar, M.; Manonmani, K. Numerical and experimental investigation of lubricating oil flow in a gerotor pump. Int. J. Automot. Technol. 2011, 12, 903–911. [Google Scholar] [CrossRef]
  11. Frosina, E.; Senatore, A.; Buono, D. A tridimensional CFD analysis of the oil pump of a high performance motorbike engine. Energy Procedia 2014, 45, 938–948. [Google Scholar] [CrossRef]
  12. Sung, H.J.; Min, H.K.; Nam, Y.J.; Park, M.K. Design and experimental verification of a port plate in a gerotor pump to reduce pressure pulsation. J. Mech. Sci. Technol. 2018, 32, 671–678. [Google Scholar] [CrossRef]
  13. Kwak, H.S.; Li, S.H.; Kim, C. Performance improvement of an oil pump: Design of port assembled with gerotor (2-ellipses-combined lobe). Int. J. Precis. Eng. Manuf. 2016, 17, 1017–1024. [Google Scholar] [CrossRef]
  14. Kim, S.Y.; Nam, Y.J.; Park, M.K. Design of port plate in gerotor pump for reduction of pressure pulsation. J. Mech. Sci. Technol. 2006, 20, 1626–1637. [Google Scholar] [CrossRef]
  15. Zhou, J.; Vacca, A.; Casoli, P. A novel approach for predicting the operation of external gear pumps under cavitating conditions. Simul. Model. Pract. Ther. 2014, 45, 35–49. [Google Scholar] [CrossRef]
  16. Ivanović, L.; Matejić, M. Improving gerotor pump performance trough design, modeling and simulation. Int. J. Fluid Power 2020, 327–346. [Google Scholar] [CrossRef]
  17. Buono, D.; Cola, F.D.S.D.; Senatore, A. Modelling approach on a gerotor pump working in cavitation conditions. Energy Procedia 2016, 101, 701–709. [Google Scholar] [CrossRef]
  18. Rituraj, R.; Vacca, A. Investigation of flow through curved constrictions for leakage flow modelling in hydraulic gear pumps. Mech. Syst. Signal Process. 2021, 153, 107503. [Google Scholar] [CrossRef]
  19. Tian, S.; Zhao, Y.; Dong, K.; Liu, G.; Yang, Q.; Li, L. Internal flow and cavitation analysis of scroll oil pump by CFD method. Processes 2021, 9, 1705. [Google Scholar] [CrossRef]
  20. Ivanovic, L.; Devedzic, G.; Cukovic, S.; Miric, N. Modeling of the meshing of trochoidal profiles with clearances. J. Mech. Des. 2012, 134, 041003. [Google Scholar] [CrossRef]
  21. Cao, W.; Liu, Y.; Dong, J.; Niu, Z.; Shi, Y. Research on pressure pulsation characteristics of gerotor pump for active vibration damping system. IEEE Access 2019, 7, 116567–116577. [Google Scholar] [CrossRef]
  22. Li, Z.H.; Liu, Z.X.; Lv, Y.G.; Li, G.Q. Numerical investigation on altitude performance for aeroengine gerotor pump. J. Propul. Technol. 2015, 36, 846–851. [Google Scholar]
  23. Gamez-Montero, P.J.; Codina, E.; Castilla, R. A review of gerotor technology in hydraulic machines. Energies 2019, 12, 2423. [Google Scholar] [CrossRef]
  24. Ivanovic, L.; Velickovic, S.; Stojanovic, B.; Kandeva, M.; Jakimovska, K. The selection of optimal parameters of gerotor pump by application of factorial experimental design. FME Trans. 2017, 45, 159–164. [Google Scholar] [CrossRef]
  25. Wu, T.; Wu, D.; Ren, Y.; Song, Y.; Gu, Y.; Mou, J. Multi-objective optimization on diffuser of multistage centrifugal pump base on ANN-GA. Struct. Multidisc. Optim. 2022, 65, 182. [Google Scholar] [CrossRef]
  26. Xu, M.; Zeng, G.; Wu, D.; Mou, J.; Zhao, J.; Zheng, S.; Huang, B.; Ren, Y. Structural optimization of jet fish pump design based on a multi-objective genetic algorithm. Energies 2022, 15, 4104. [Google Scholar] [CrossRef]
  27. Wang, H.; Zhou, P.; Chen, T.; Mou, J.; Cui, J.; Zhang, H. Optimization of liquid−liquid mixing in a novel mixer based on hybrid SVR-DE model. Energies 2023, 16, 1808. [Google Scholar] [CrossRef]
  28. Huang, R.; Zhang, Z.; Zhang, W.; Mou, J.; Zhou, P. Energy performance prediction of the centrifugal pumps by using a hybrid neural network. Energy 2020, 213, 119005. [Google Scholar] [CrossRef]
  29. Luo, H.; Zhou, P.; Shu, L.; Mou, J.; Zheng, H.; Jiang, C.; Wang, Y. Energy performance curves prediction of centrifugal pumps based on constrained PSO-SVR model. Energies 2022, 15, 3309. [Google Scholar] [CrossRef]
  30. Prosperetti, A. A generalization of the Rayleigh–Plesset equation of bubble dynamics. Phys. Fluids 1982, 25, 409–410. [Google Scholar] [CrossRef]
  31. Ashok, K.; Athavale, M.; Li, H.Y.; Jiang, Y. Mathematical basis and validation of the full cavitation model. J. Fluid. Eng. 2002, 124, 617–624. [Google Scholar]
  32. Yu, L.; Gu, Y.; Mou, J.; Wu, D.; Chen, Z.; Ren, Y.A. A numerical investigation on the characteristics of the radial force in a cycloid gerotor pump. Fluid Dyn. Mater. Proc. 2022, 16, 1007–1018. [Google Scholar] [CrossRef]
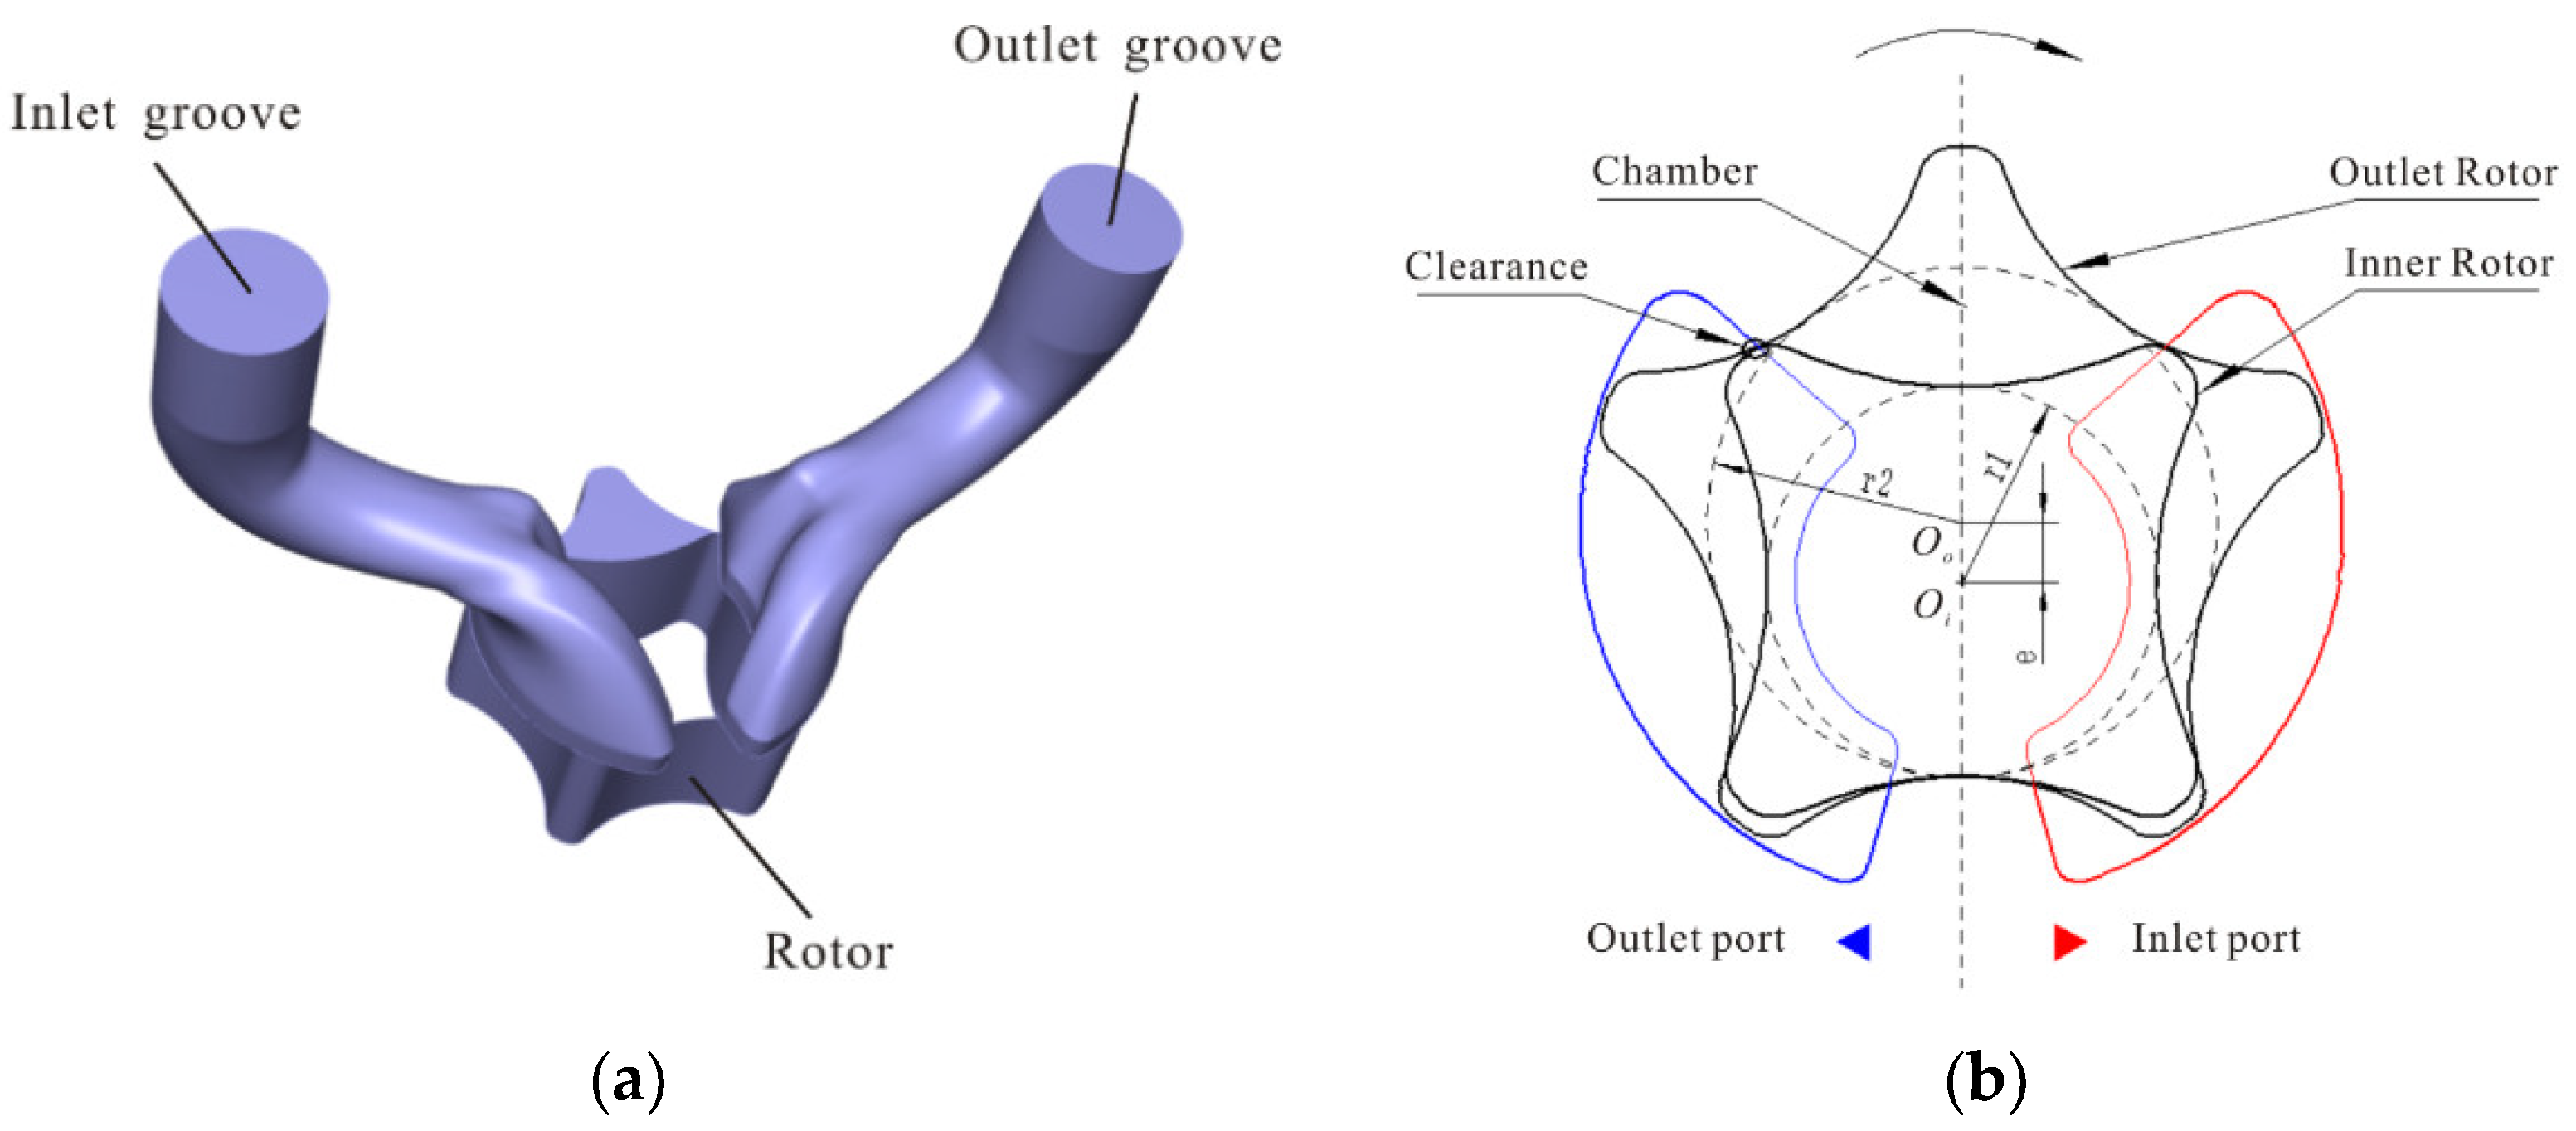
Figure 1. Computational model of the gerotor pump: (a) computational model; (b) gerotor tooth profiles.
Energies 16 07301 g001
Figure 2. Mesh generation for (a) overall mesh generation; (b) mesh grid of rotor chamber; (c) tip clearance-refined grid.
Energies 16 07301 g002
Figure 3. Monitoring point settings.
Energies 16 07301 g003
Figure 4. The test rig for the gerotor pump: 1. Horizontal drive motors; 2, 16. Couplings; 3, 15. Torque-speed measuring instruments; 4. Oil pump fixtures; 5. Fuel tank; 6. Intake tubing; 7. Outlet tubing; 8. Flow converter; 9. Electronic electric regulator; 10. Electric pressure regulator; 11. Pressure converter; 12, 14. Regulator; 13. Glass rotor flowmeter; 17. Vertical drive motor.
Energies 16 07301 g004
Figure 5. Gerotor pump testing device for (a) oil pump fixtures; (b) monitoring equipment; (c) test console.
Energies 16 07301 g005
Figure 6. The test gerotor pump prototype.
Energies 16 07301 g006
Figure 7. External characteristic analysis of gerotor pump.
Energies 16 07301 g007
Figure 8. Comparison of the influence of cavitation on pressure fluctuation for (a) point J; (b) point I 1 ; (c) point I 4 ; and (d) point P.
Energies 16 07301 g008
Figure 9. Schematic diagram of cavity change for (a) 0.05 T; (b) 0.10 T; (c) 0.15 T; (d) 0.20 T; (e) 0.25 T.
Energies 16 07301 g009
Figure 10. Frequency domain comparison of pressure fluctuation at monitoring points for (a) the inner rotor side; (b) the outer rotor side.
Energies 16 07301 g010
Figure 11. Diagrams of pressure fluctuation at monitoring point J for the (a) time-domain diagram and (b) frequency-domain diagram.
Energies 16 07301 g011
Figure 12. Diagrams of pressure fluctuation at monitoring point I 1 for the (a) time-domain diagram and (b) frequency-domain diagram.
Energies 16 07301 g012
Figure 13. Diagrams of pressure fluctuation at monitoring point I 4 for the (a) time-domain diagram and (b) frequency-domain diagram.
Energies 16 07301 g013
Figure 14. Pressure distribution of rotor section at 3/8T: (a) P1 = 0.1 MPa; (b) P1 = 0.2 MPa; (c) P1 = 0.3 MPa; (d) P1 = 0.4 MPa.
Energies 16 07301 g014
Figure 15. Pressure distribution while oil is trapped: (a) P1 = 0.1 MPa; (b) P1 = 0.2 MPa; (c) P1 = 0.3 MPa; (d) P1 = 0.4 MPa.
Energies 16 07301 g015
Figure 16. Vapor volume fraction of rotor.
Energies 16 07301 g016
Figure 17. Diagrams of pressure fluctuation at monitoring point P for the (a) time-domain diagram and (b) frequency-domain diagram.
Energies 16 07301 g017
Figure 18. Velocity of cross-section under different inlet pressures: (a) P1 = 0.1 MPa; (b) P1 = 0.2 MPa; (c) P1 = 0.3 MPa; (d) P1 = 0.4 MPa.
Energies 16 07301 g018
Figure 19. Distribution of streamline: (a) P1 = 0.1 MPa; (b) P1 = 0.2 MPa; (c) P1 = 0.3 MPa; (d) P1 = 0.4 MPa.
Energies 16 07301 g019
Figure 20. Maximum vapor volume fraction under different inlet pressures: (a) P1 = 0.1 MPa; (b) P1 = 0.2 MPa; (c) P1 = 0.3 MPa; (d) P1 = 0.4 MPa.
Energies 16 07301 g020
Table 1. Design parameters of the gerotor pump.
External diameter of outer rotor (mm)D2 = 69.7
External diameter of inner rotor (mm)D1 = 52.6
Eccentricity (mm)e = 4.95
Gerotor height (mm)B = 28
Number of lobes in the outer rotorZ2= 5
Number of lobes in the inner rotorZ1= 4
Tip clearance (mm)0.05
Table 2. Prediction for volumetric efficiency using different meshes.
Number of Grids/10,000Simulation Value of Exit Flow /L·min−1Volumetric Efficiency/%
2096.3487.28
3097.2588.04
4098.8789.39
5098.9289.43
6098.7389.28
Disclaimer/Publisher’s Note: The statements, opinions and data contained in all publications are solely those of the individual author(s) and contributor(s) and not of MDPI and/or the editor(s). MDPI and/or the editor(s) disclaim responsibility for any injury to people or property resulting from any ideas, methods, instructions or products referred to in the content.