1. Introduction
Considering that solar cells are vital components of photovoltaic systems, they are being rapidly developed, with their performance, longevity, and reliability fundamentally determined by the quality of their constitutive materials and the precision of manufacturing processes. However, various types of mechanical defects have been found in solar cells, thus making the identification and characterization of such defects, particularly shunt defects, a critical concern in the field of photovoltaics. Among nondestructive testing methodologies, thermography has emerged as a compelling tool for this task, with two primary techniques gaining prominence: biased thermography and lock-in thermography (LIT) [
1,
2,
3,
4,
5,
6].
Biased thermography, known as quasi-steady-state thermography, monitors temporal temperature variations by applying a continuous electrical bias, whereas LIT synchronizes the thermal signal with the modulation frequency to improve the signal-to-noise ratio. Despite the superior resolution offered by LIT, its application is limited by the need for sophisticated and expensive equipment [
5,
6].
Diagnostic strategies, including thermography, can find applications in various photovoltaic devices, such as silicon-based and perovskite solar modules, particularly in copper indium gallium selenide (CIGS) solar modules. However, each material and architecture presents unique challenges, with the results affected by the inherent material properties and defect type. Thus, recognizing these nuances is paramount to effectively apply diagnostic techniques across a wide variety of photovoltaic devices [
5,
6,
7,
8,
9].
Recent studies have provided a better understanding of the application of these techniques. For instance, Fecher et al. demonstrated how imaging illuminated LIT could be combined with 2D electrical simulations for effective loss analysis in CIGS modules [
10], followed by complementary studies such as those of Guthrey et al., who focused on the reverse-bias breakdown in CIGS photovoltaic devices, and Aninat et al. and Palmiotti et al., who provided detailed examinations of defects in CIGS PV modules [
11,
12,
13]. These studies collectively represent the state-of-the-art in nondestructive defect detection and have contributed to the methodological discourse in the field.
However, there remains a challenge in many laboratories where commercially available LIT systems are used without a comprehensive understanding of the respective strengths and drawbacks of each method. This study aimed to address this knowledge gap by conducting a comparative analysis of biased thermography and LIT, focusing on investigating shunt defects in CIGS modules [
4,
5,
6,
7,
8,
9,
10,
11,
12,
13,
14,
15,
16,
17,
18,
19].
We present an analysis of a CIGS mini-module by employing a system capable of both biased thermography and LIT. Through a comparison analysis, we demonstrate the efficacy of these two techniques and identify scenarios in which biased thermography performed adequately [
4,
5,
6,
7,
8,
9,
10,
11,
12,
13,
14,
15,
16,
17,
18,
19]. We also provide an in-depth discussion of the advantages and limitations of each thermography method when diagnosing shunt defects in CIGS modules. In addition, practical guidelines for selecting and optimizing a suitable technique for specific applications are suggested. Hence, this paper contributes to ongoing research in improving the quality and performance of CIGS modules in the field of photovoltaics, including potential future directions in this area.
3. Results
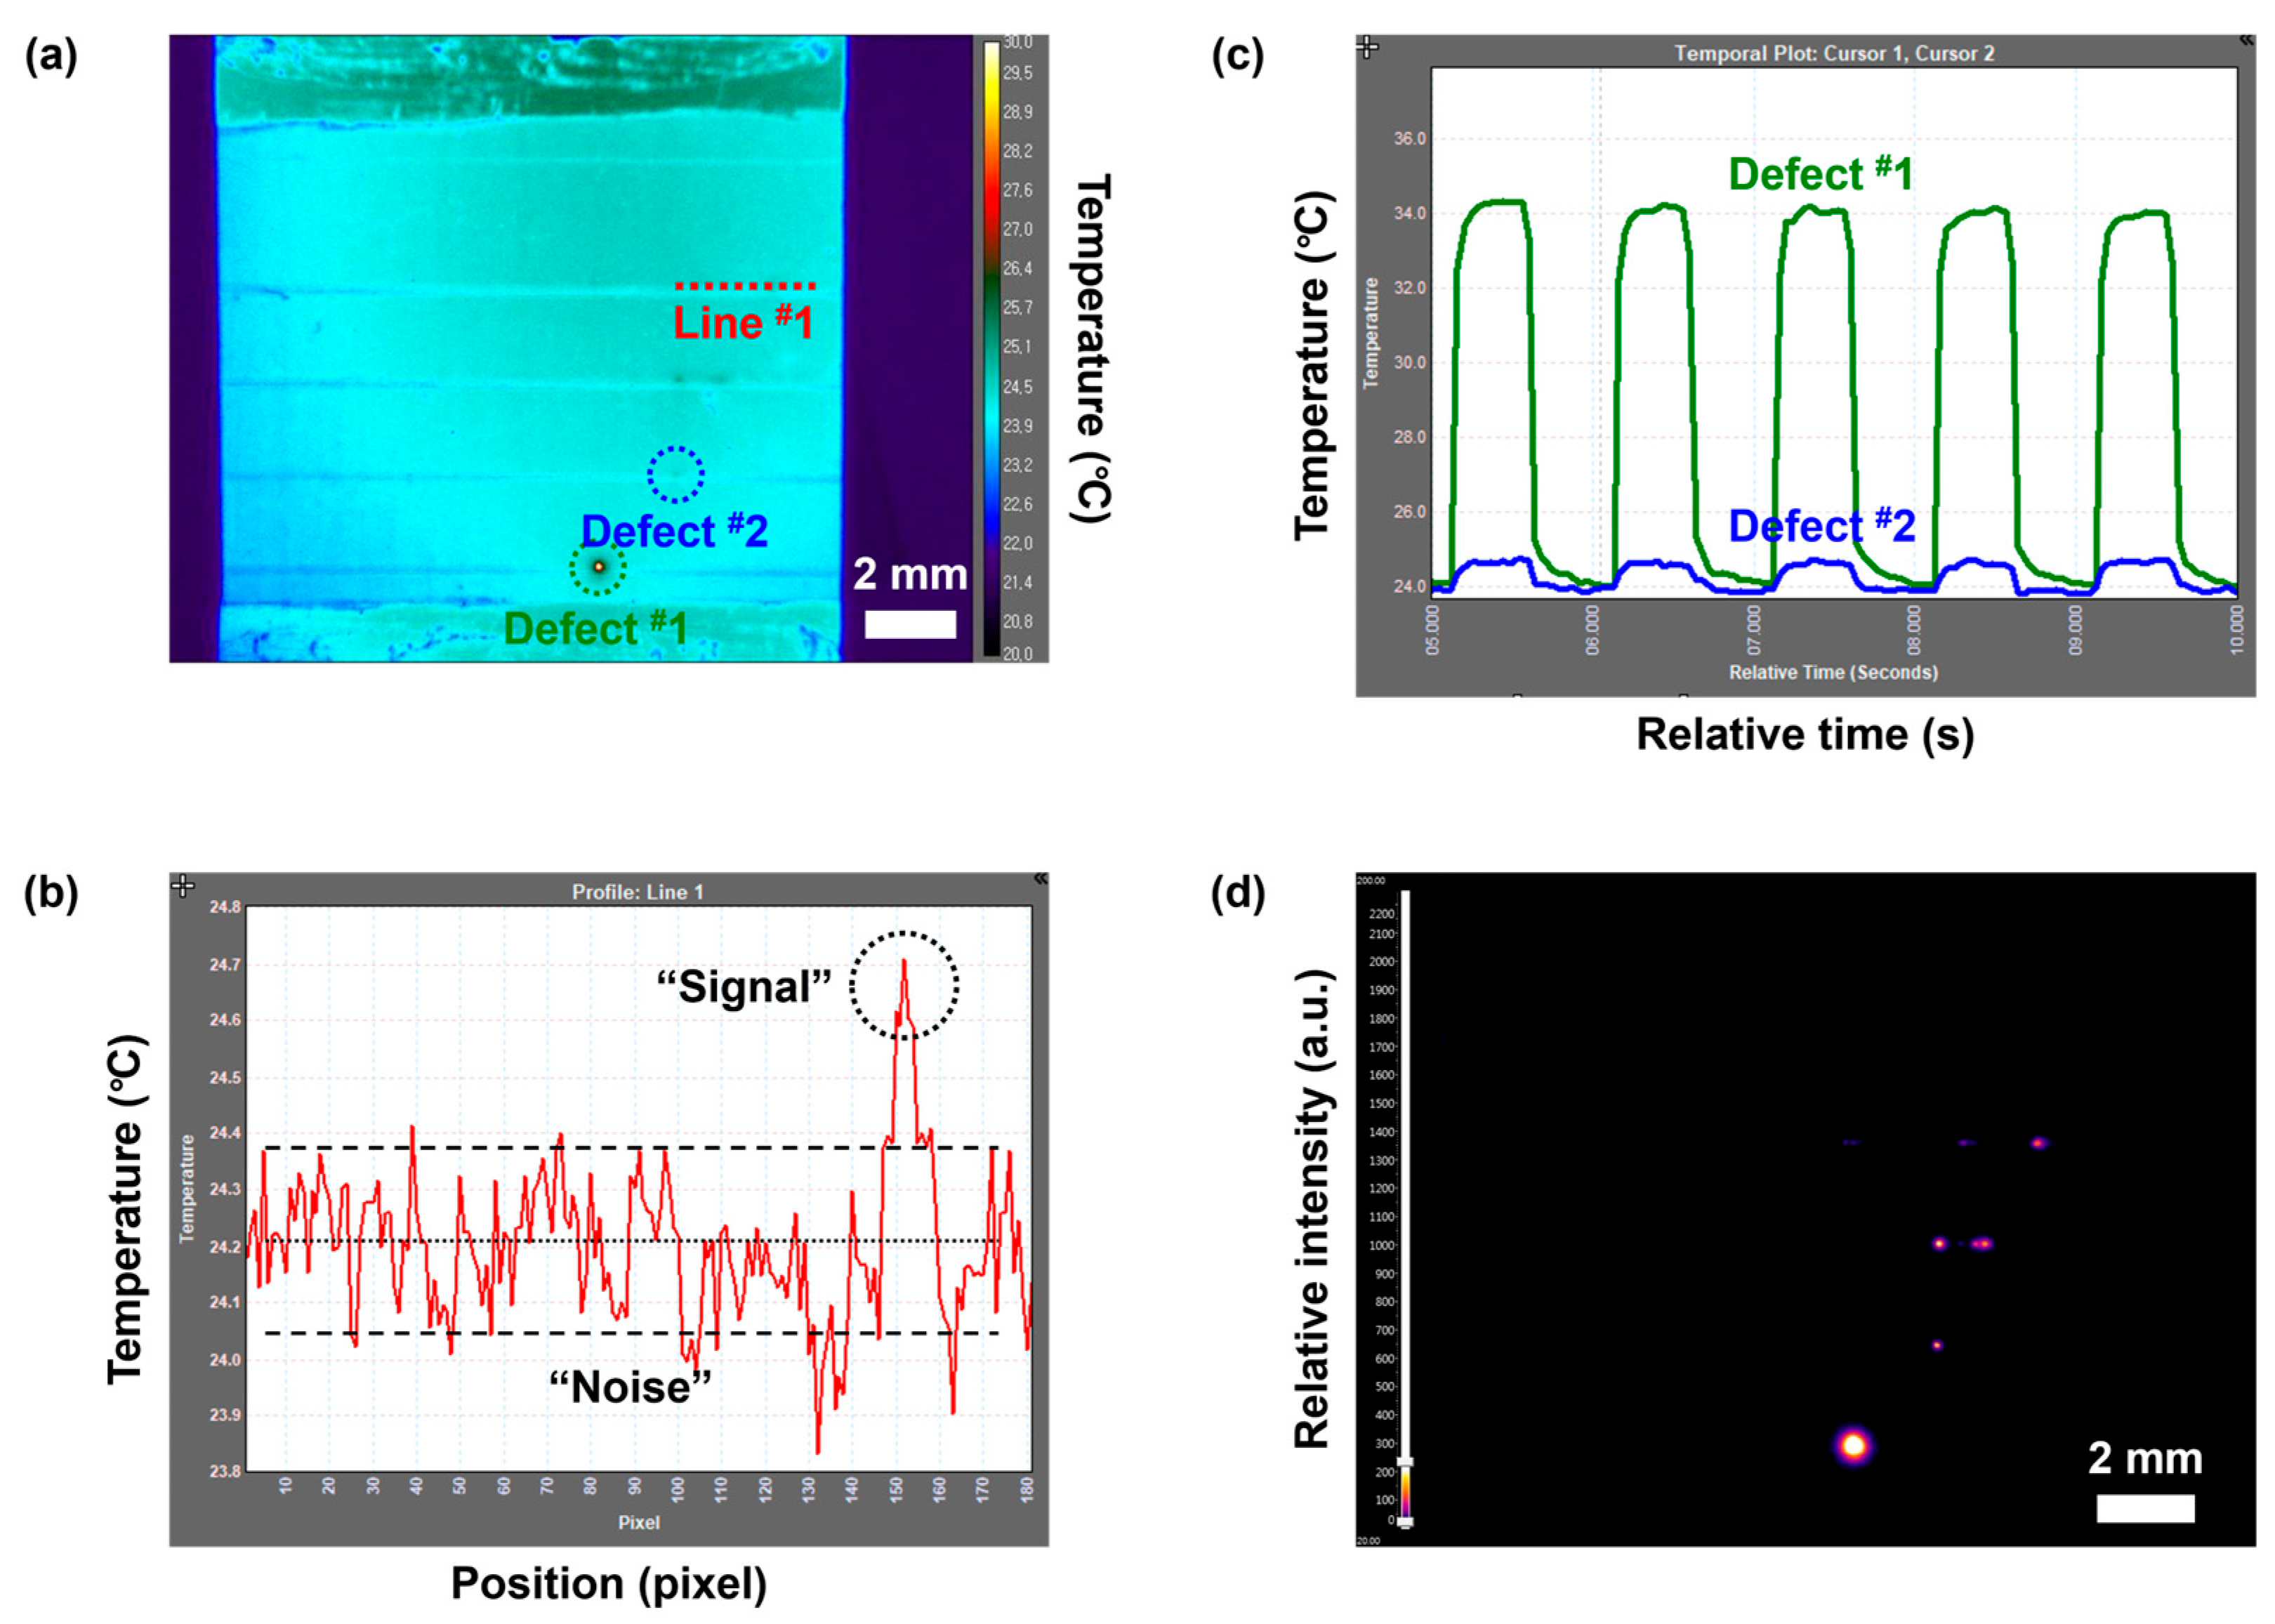
Figure 1 shows the results of our experimentation using both biased and LIT techniques.
Figure 1a shows a thermographic image of a CIGS mini-module sample subjected to a bias of −6 V. This image primarily demonstrates the temperature resolution or detection limit of the IR camera, indicating that only signals surpassing the noise amplitude can be detected.
Figure 1b shows the temperature profile for line-shaped regions of interest (ROI), highlighted in red in
Figure 1a, indicating that random fluctuations, approximately 0.2 °C at 24.2 °C, arise independently of the applied bias and can, thus, be classified as noise. Temperature signals exceeding this noise level can be detected using biased thermography. In the example given in
Figure 1b, biased thermography detected a shunt site signal at 24.7 °C, while signals within the noise range remained indistinguishable.
Previous observation results showed that biased thermography has several limitations: first, for a signal to be detected, it must be of sufficient strength. Second, thermal dispersion from distinct shunt sites can decrease the spatial resolution as adjacent areas heat up simultaneously over time. Finally, applying a continuous bias may damage the sample at high temperatures. A pulsed bias was applied to mitigate these limitations.
Figure 1c presents the temporal temperature profiles for ROIs labeled as defects #1 and #2 in
Figure 1a, indicated by the green and blue markers, respectively. The temperature fluctuations in response to the pulsed bias are distinctly visible in these profiles.
LIT can be executed by repeating this process and gathering multiple images.
Figure 1d presents the outcome of an LIT analysis conducted on the data shown in
Figure 1a. Applying the lock-in technique yielded a high signal-to-noise ratio, resulting in clear and reliable images. Overall, these results demonstrate the superior capabilities of lock-in thermography in relation to biased thermography, particularly in terms of the signal-to-noise ratio and spatial resolution.
Figure 2 shows a simplified representation of the LIT principle, illustrated in a matrix format. Each matrix element represents the temperature of an individual pixel, with changes occurring either in response to the applied pulsed bias or independently. These temperature changes induced by the applied bias are characterized as signal components, whereas random temperature fluctuations are considered noise.
The noise dispersion, indicated by n, diverges randomly from the mean temperature value and approximately aligns with temperature resolution. By contrast, the mean temperature value of a particular pixel, designated by m, remains constant throughout the measurements. If the temperature of a pixel varies differently from the applied bias, this additional temperature change is denoted by S, highlighting the presence of additional signals in these pixels. To optimize the signal-to-noise ratio, the number of measurement cycles, denoted as c, should be high.
The advantage of this matrix representation becomes apparent in the LIT process, where thermal images are continuously acquired in response to an external pulsed bias. Once these images are collected, the time-dependent thermal changes captured in the images are Fourier-transformed into frequency-dependent thermal signals. This essential step in the lock-in principle enables the clear extraction and isolation of significant signal components amidst the noise. Consequently, this combined process facilitates improved noise reduction and signal extraction, highlighting the effectiveness of the LIT methodology [
5,
6].
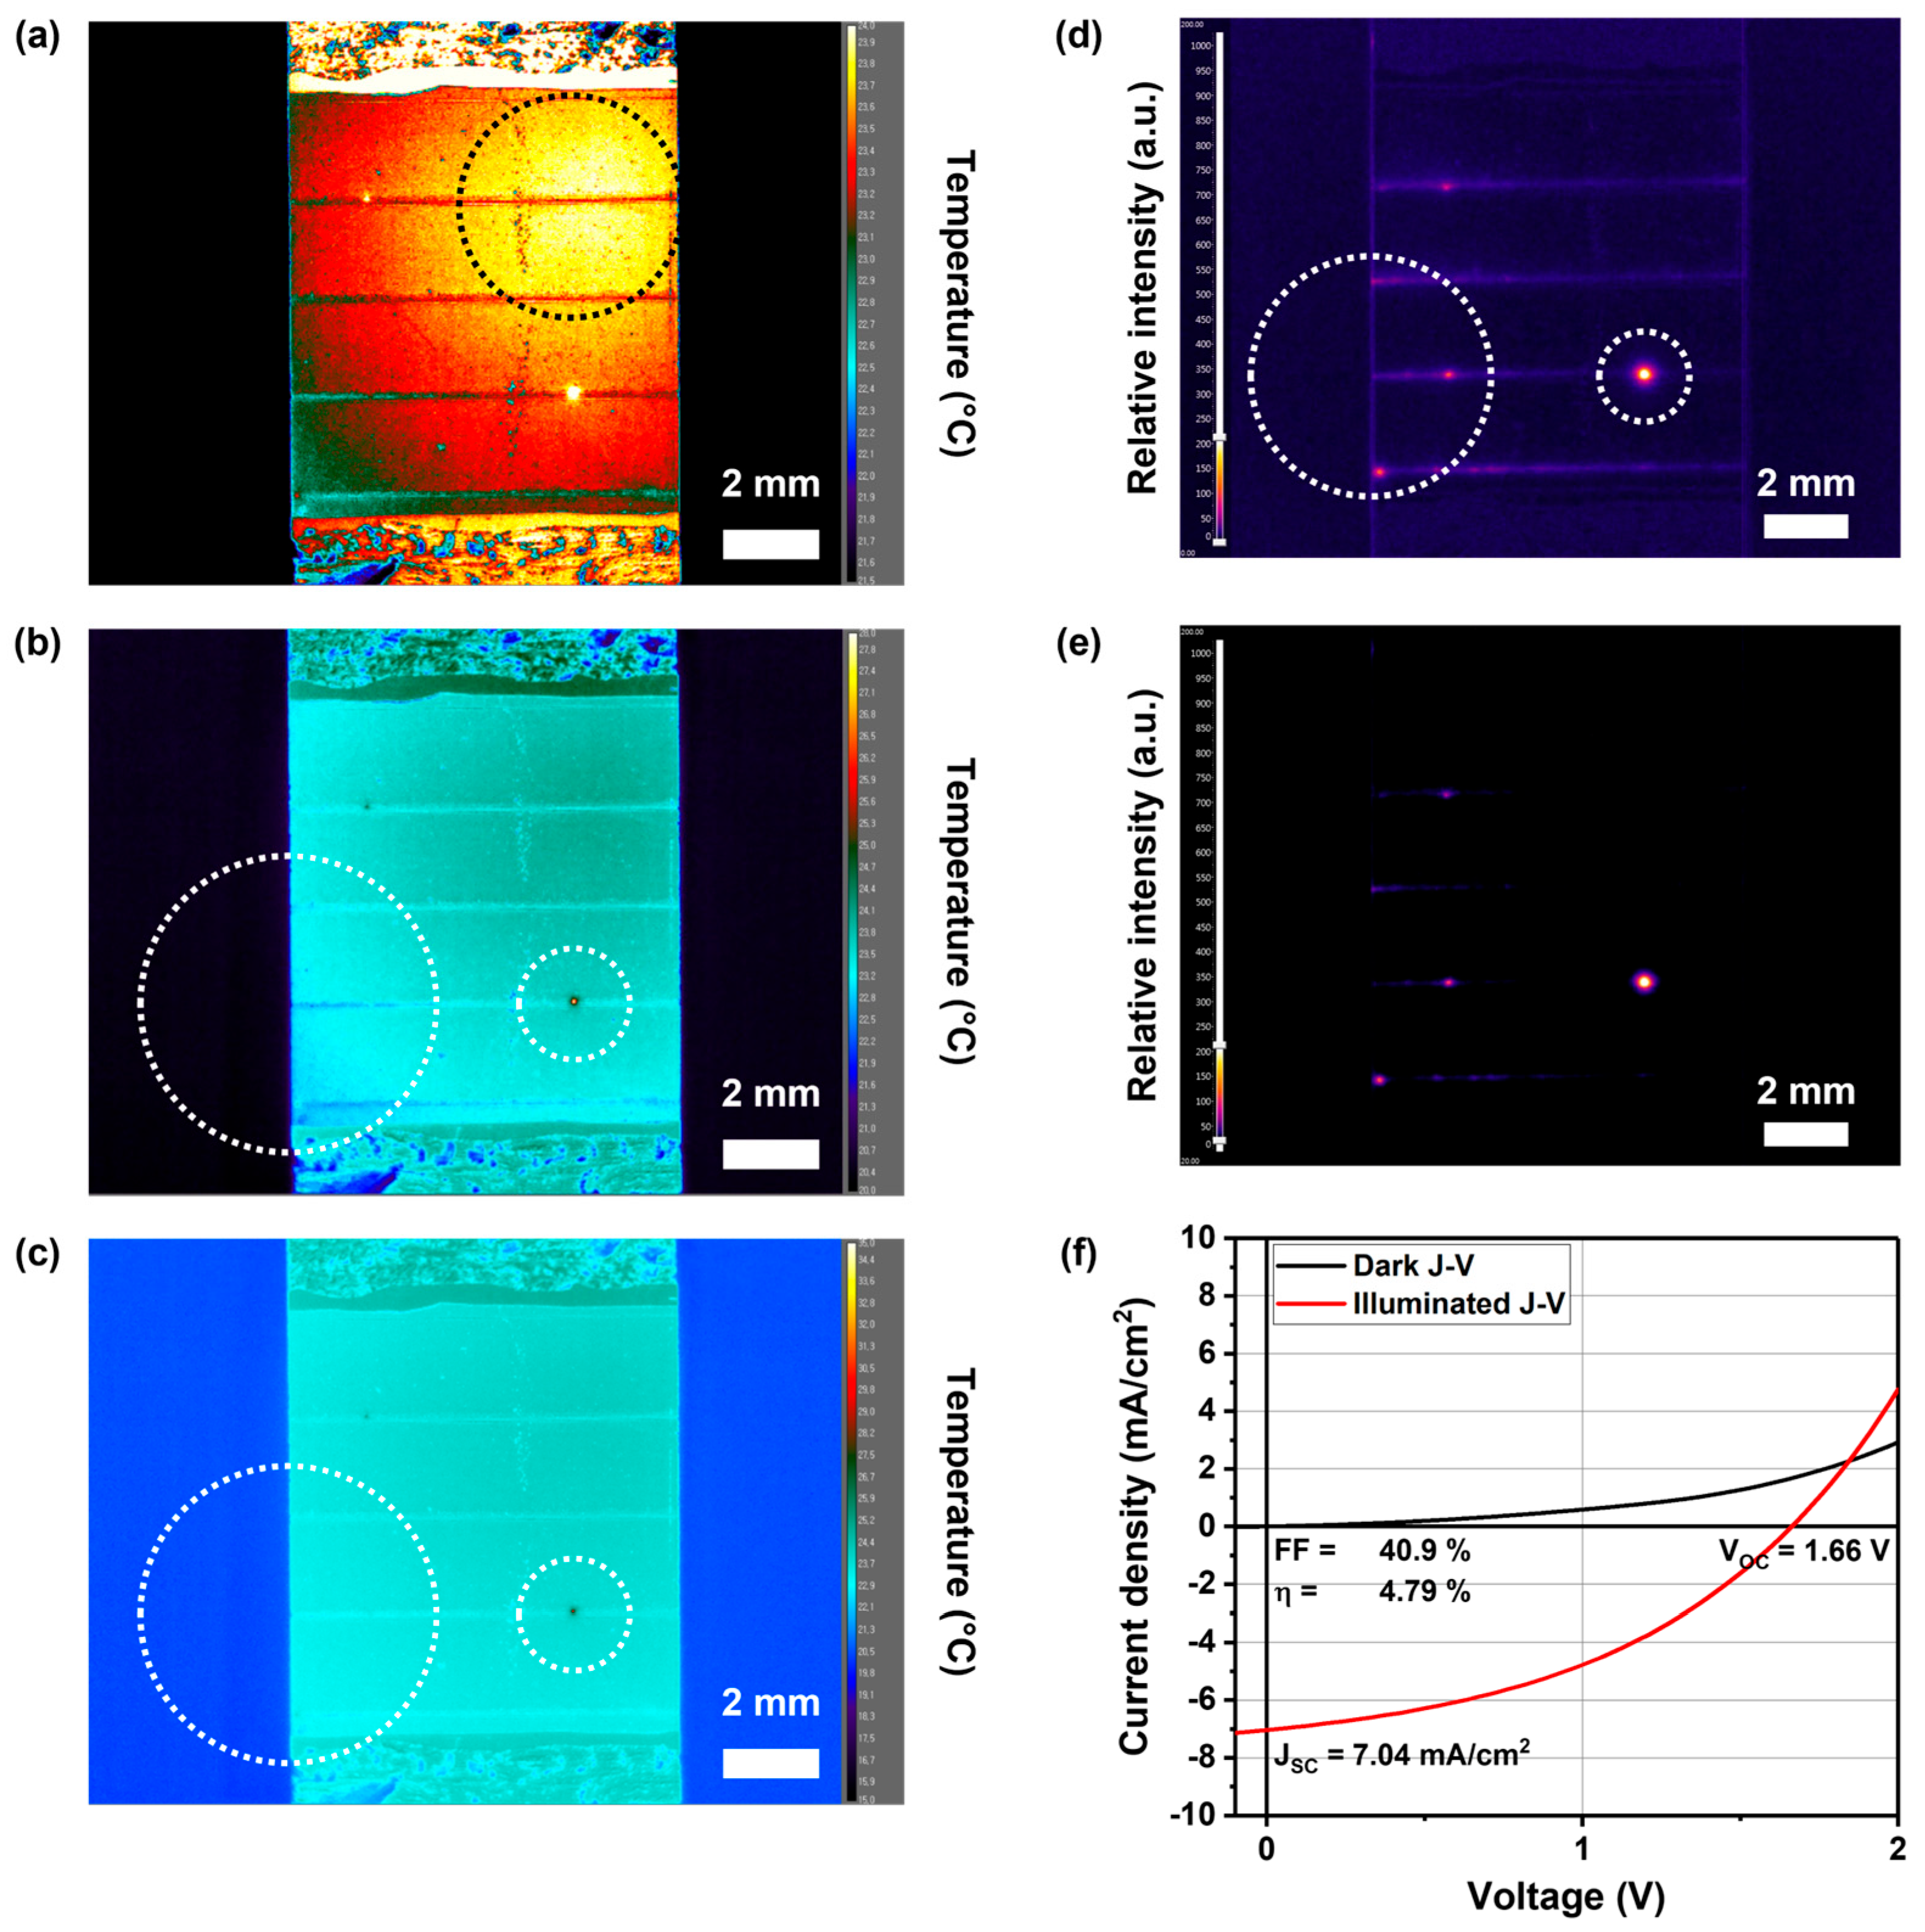
Figure 3 shows a comparison between biased thermography and LIT. Both techniques were applied to a CIGS mini-module sample under a +3 V voltage and visually compared through thermographic and LIT images, each presented with a different scale. Specifically,
Figure 3a–c show the thermographic images at varying temperature scales of −21.5–24, 20–28, and 15–35 ℃, respectively.
Figure 3d,e show LIT images with signal scales of −0–200 and 20–200 arbitrary units, respectively.
In
Figure 3a, the area enclosed by a black circle has a higher temperature than its surroundings. However, this temperature increase did not result from a shunt site signal caused by an externally applied bias but arose from a biased baseline originating from the measurement environment, known as the “Narcissus effect”. This unforeseen noise or bias can be suppressed by adjusting the temperature scale when the degree of bias is low. As shown in
Figure 3b,c, widening the temperature scale can reduce the relative strength of bias. However, this strategy inherently weakens the relative strength of the signal, making shunt sites with subtle signals invisible.
As an example, in
Figure 3d, the defect, which has a weak signal, highlighted within the large white circle on the left, is only visible in the LIT image. By comparison, the shunt site indicated within the small white circle on the right is visible in both the biased thermography and LIT images, owing to its robust signal.
Notably, LIT isolates the signal due to the thermal change depending directly on the intentionally applied bias, eliminating the baseline bias seen in
Figure 3a and making only the true signal visible, as shown in
Figure 3e. This unique aspect of LIT reduces the need for stringent control of the measurement environment to reduce unintentional bias.
In the results illustrated in
Figure 3a–e, both the biased thermography and LIT images clearly show the presence of shunt sites within the module sample; this is particularly evident in the LIT image, where the bright regions indicate these shunt sites. The illuminated J–V curve in
Figure 3f exhibits an open circuit voltage (
Voc) of 1.66 V. Given that the corresponding CIGS mini-module comprises four unit cells connected in series, this
Voc value is notably low. The deviation in
Voc could be attributed to one of the unit cells being bypassed due to the shunt path. A bypassed unit cell has minimal contribution to the overall device voltage, which can influence the performance of the entire modular device.
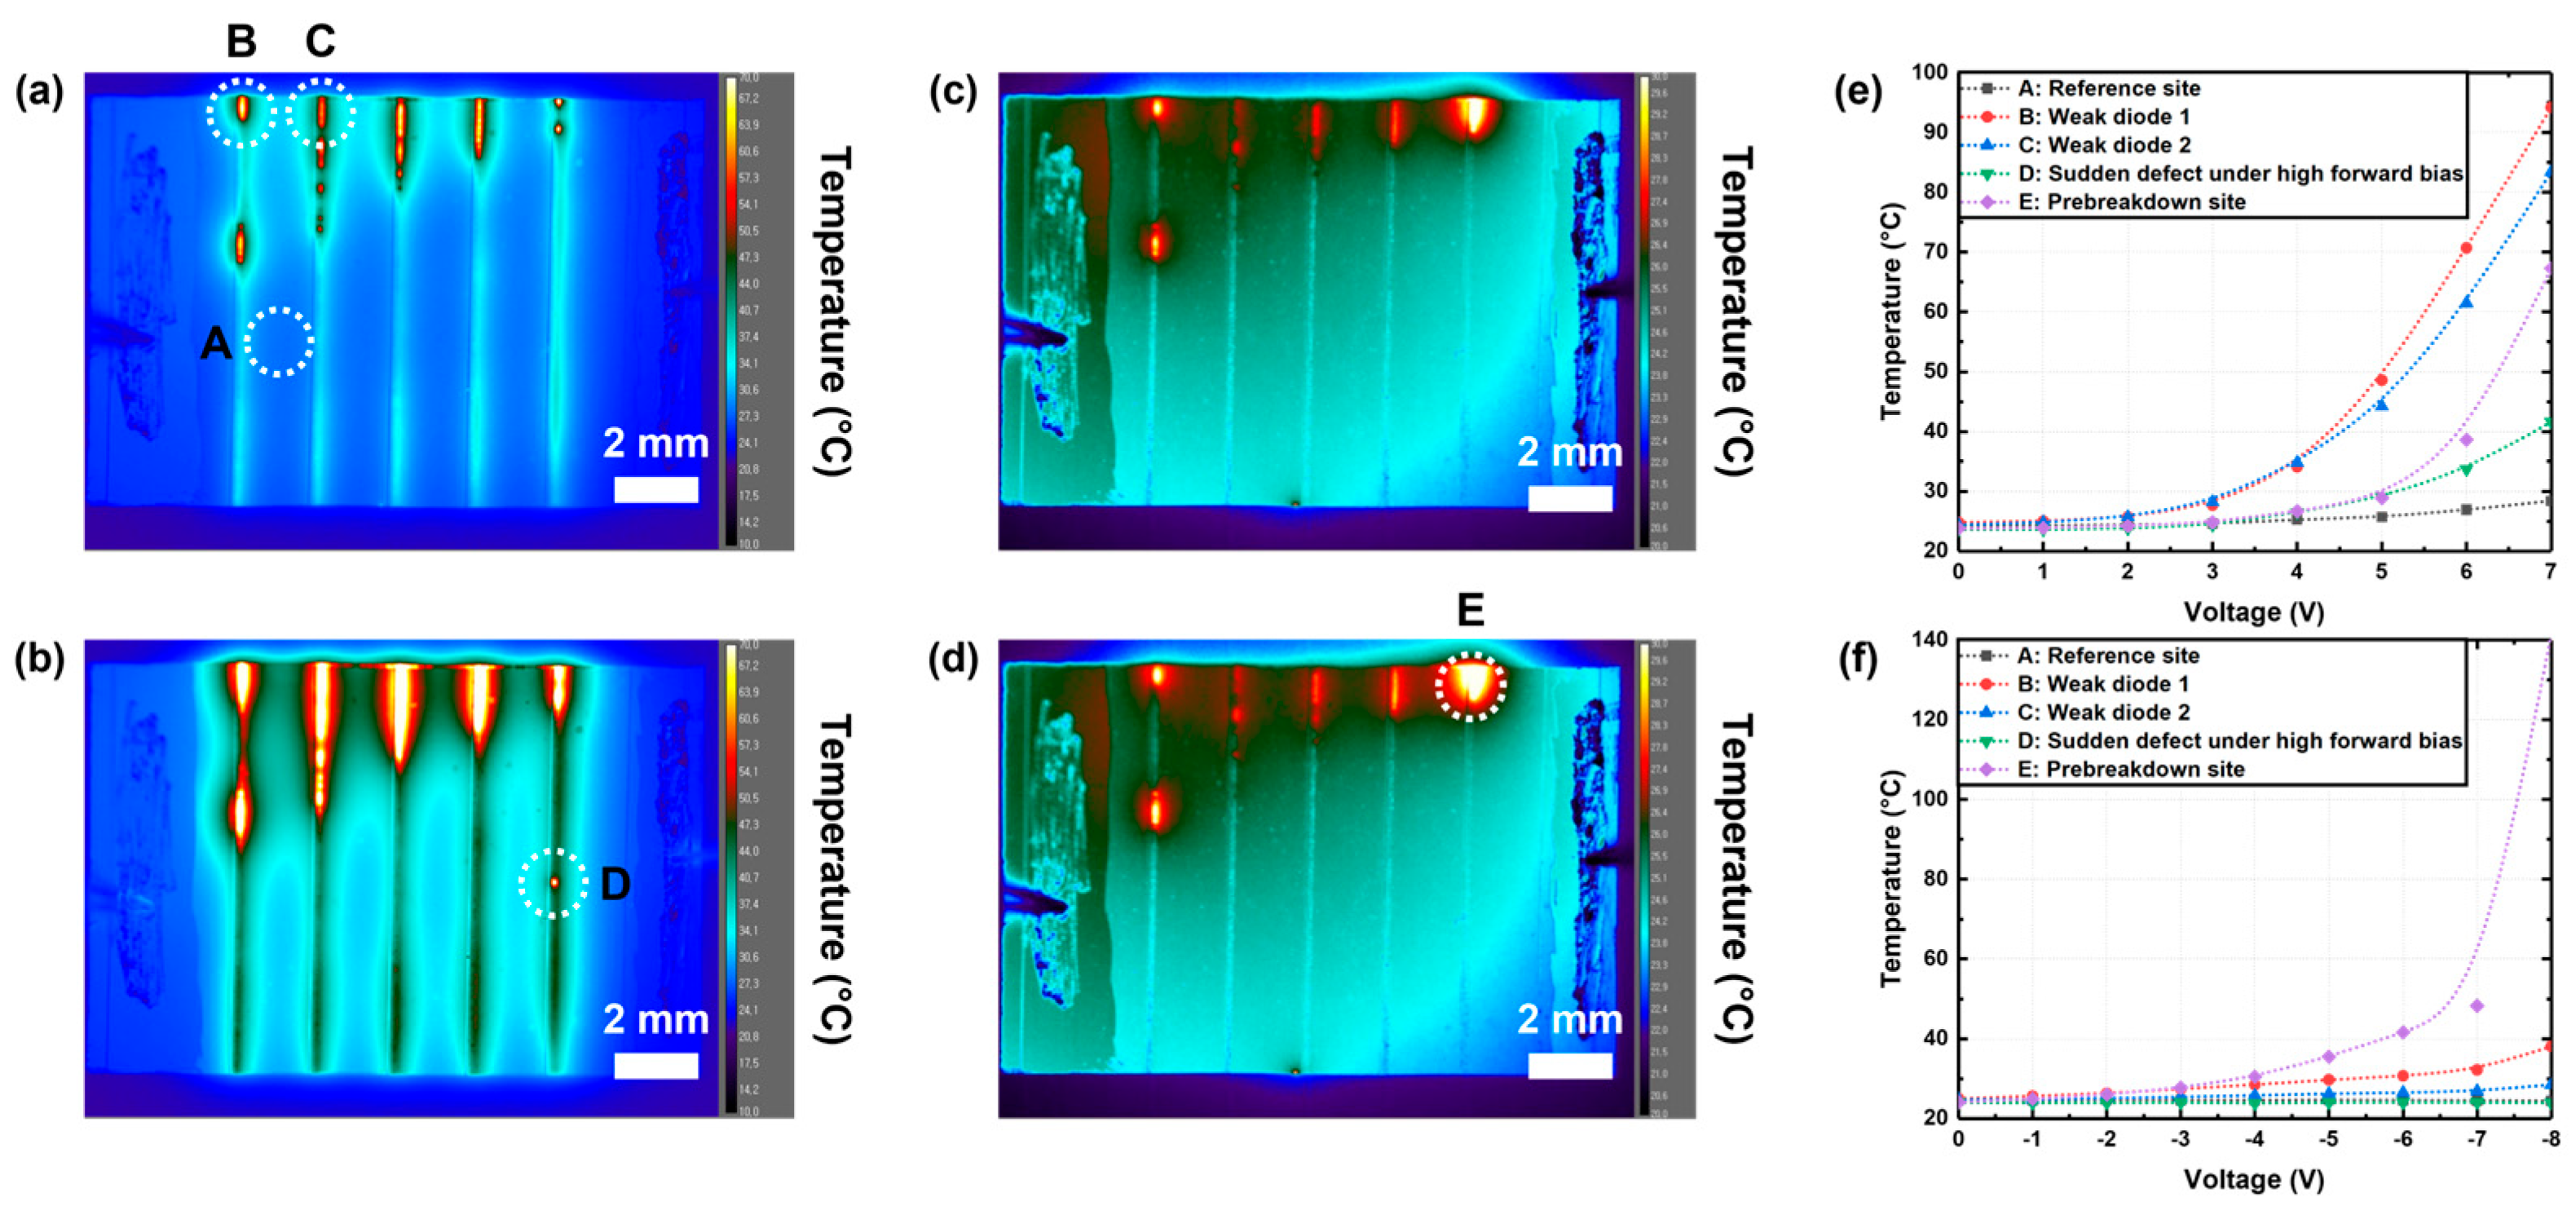
Figure 4 presents the results of biased thermography analysis, indicating the potential for enhancing the signal from shunt defects either through the application of a high-voltage bias or prolonged bias exposure. The thermography images in
Figure 4a,b under a +6 V and +7 V bias, respectively, employ a temperature scale of 10–70 °C. By contrast, the thermography images in
Figure 4c,d under −6 V and −7 V bias, respectively, employ a temperature scale of 20–30 °C. A detailed examination of thermal variations in the regions marked A to E in
Figure 4a–d was conducted with respect to the applied positive and negative biases (
Figure 4e,f).
These thermographic images (
Figure 4a–d) reveal a range of shunt defects, each manifesting different thermal behaviors under the applied bias. For instance, Regions B and C in
Figure 4a indicate weak diode shunt behavior, with the temperature rising exponentially under forward bias alongside an increase in the voltage and exhibiting a relatively minor increase under reverse bias. By contrast, the defect in Region D,
Figure 4b, remains invisible under low-voltage conditions, appears abruptly under high voltage, and is absent under reverse bias. Region E, as depicted in
Figure 4d, shows a pre-breakdown site, demonstrating a drastic rise in temperature under high-reverse-bias conditions. At −7 V, the temperature was approximately −38.3 °C but swiftly increased to 141.3 °C at −8 V.
Subjecting the sample to elevated temperatures over an extended period during thermography analysis can lead to irreversible damage to the device. Consequently, while a high applied bias can enhance the visibility of shunt sites, it poses a risk of permanent damage. Given this aspect, the LIT analysis is more valuable as it utilizes a brief pulsed bias to produce the thermal signal, representing a more viable nondestructive analysis method for shunt site detection than the method in which the sample is exposed to a high and continuous voltage bias for an extended duration. Nevertheless, the temporal temperature profile monitoring offered by biased thermography can provide valuable insights into the thermal behavior of defects under various voltage conditions.
In
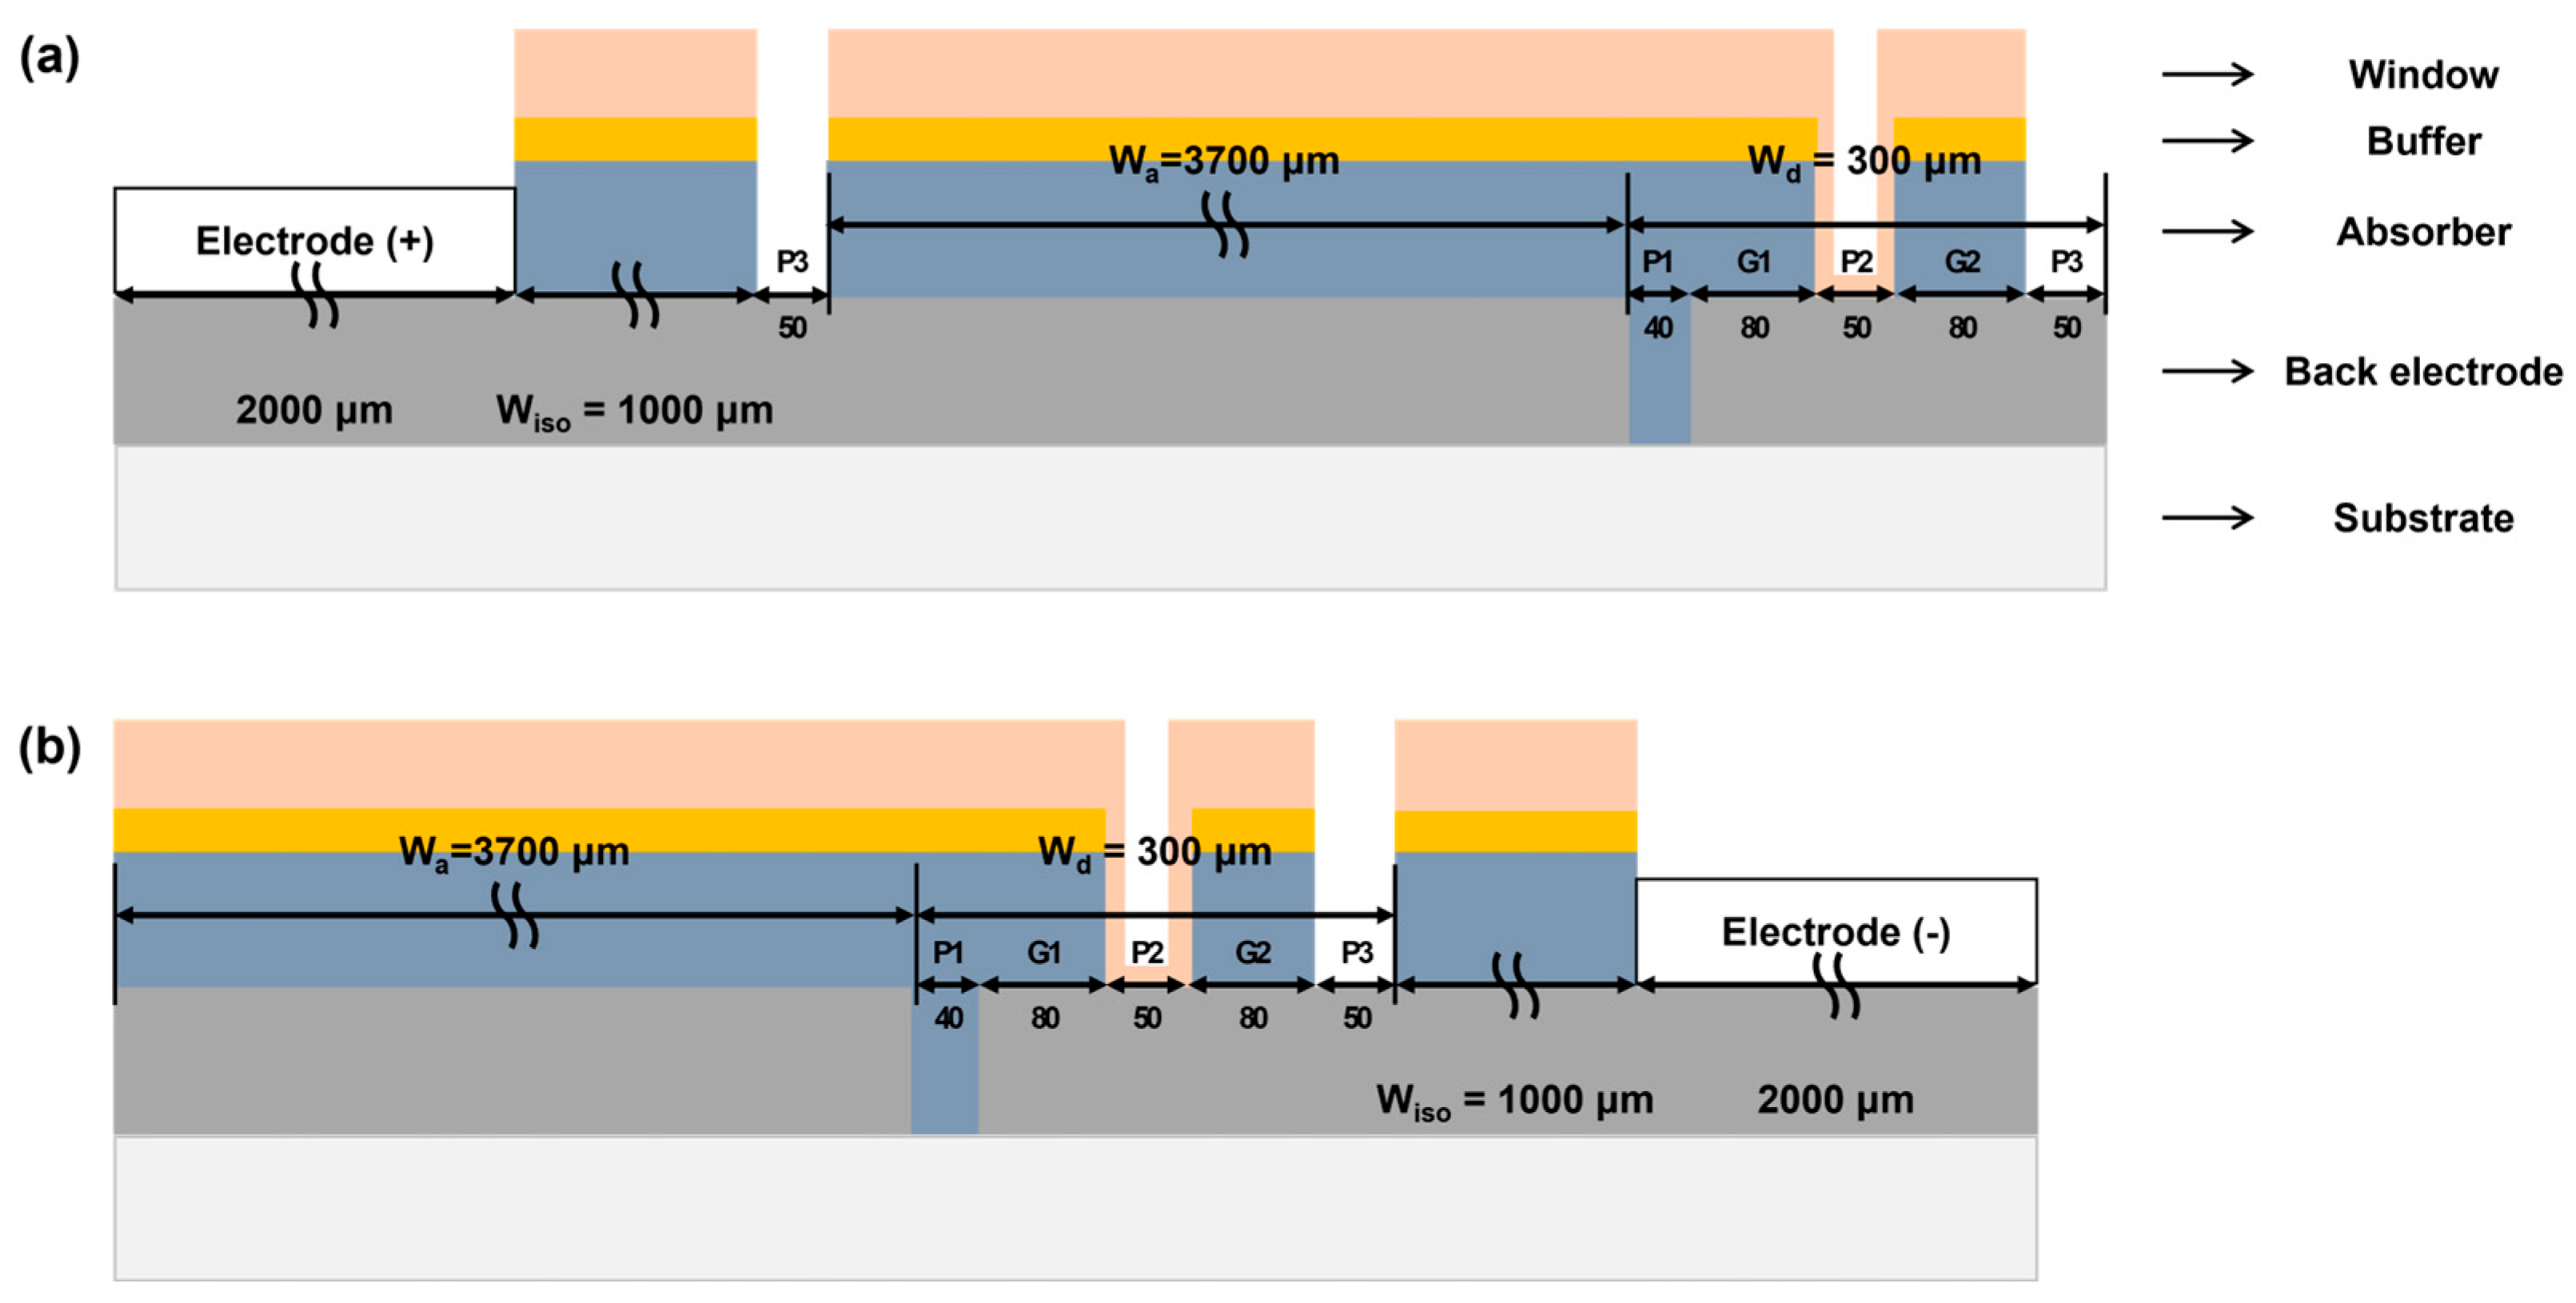
Figure 4, a noticeable difference between the subcells in panels (a) and (b) can be observed as opposed to those in panels (c) and (d). Notably, all the panels depict segments from an identical CIGS mini-module, each comprising five unit cells. The nuanced appearance of the rightmost unit cell, exclusively isolated by P3, makes it less visibly pronounced in panels (a) and (b). In terms of the electrode characteristics, the current in the electrode, designated as negative, flowed to the adjacent cells primarily through the TCO due to the isolation of the back electrode. By contrast, the current in the electrode designated as positive predominantly flowed through Mo, given the non-isolated state of the back electrode (
Figure 5). This distinct current pathway mitigated heat generation due to the sheet resistance of TCO, which is otherwise manifested in the four other cells. These observations demonstrate the intricate dynamics of the structural and electrical factors, influencing both the operational behavior and visual representation of unit cells under distinct voltage conditions.
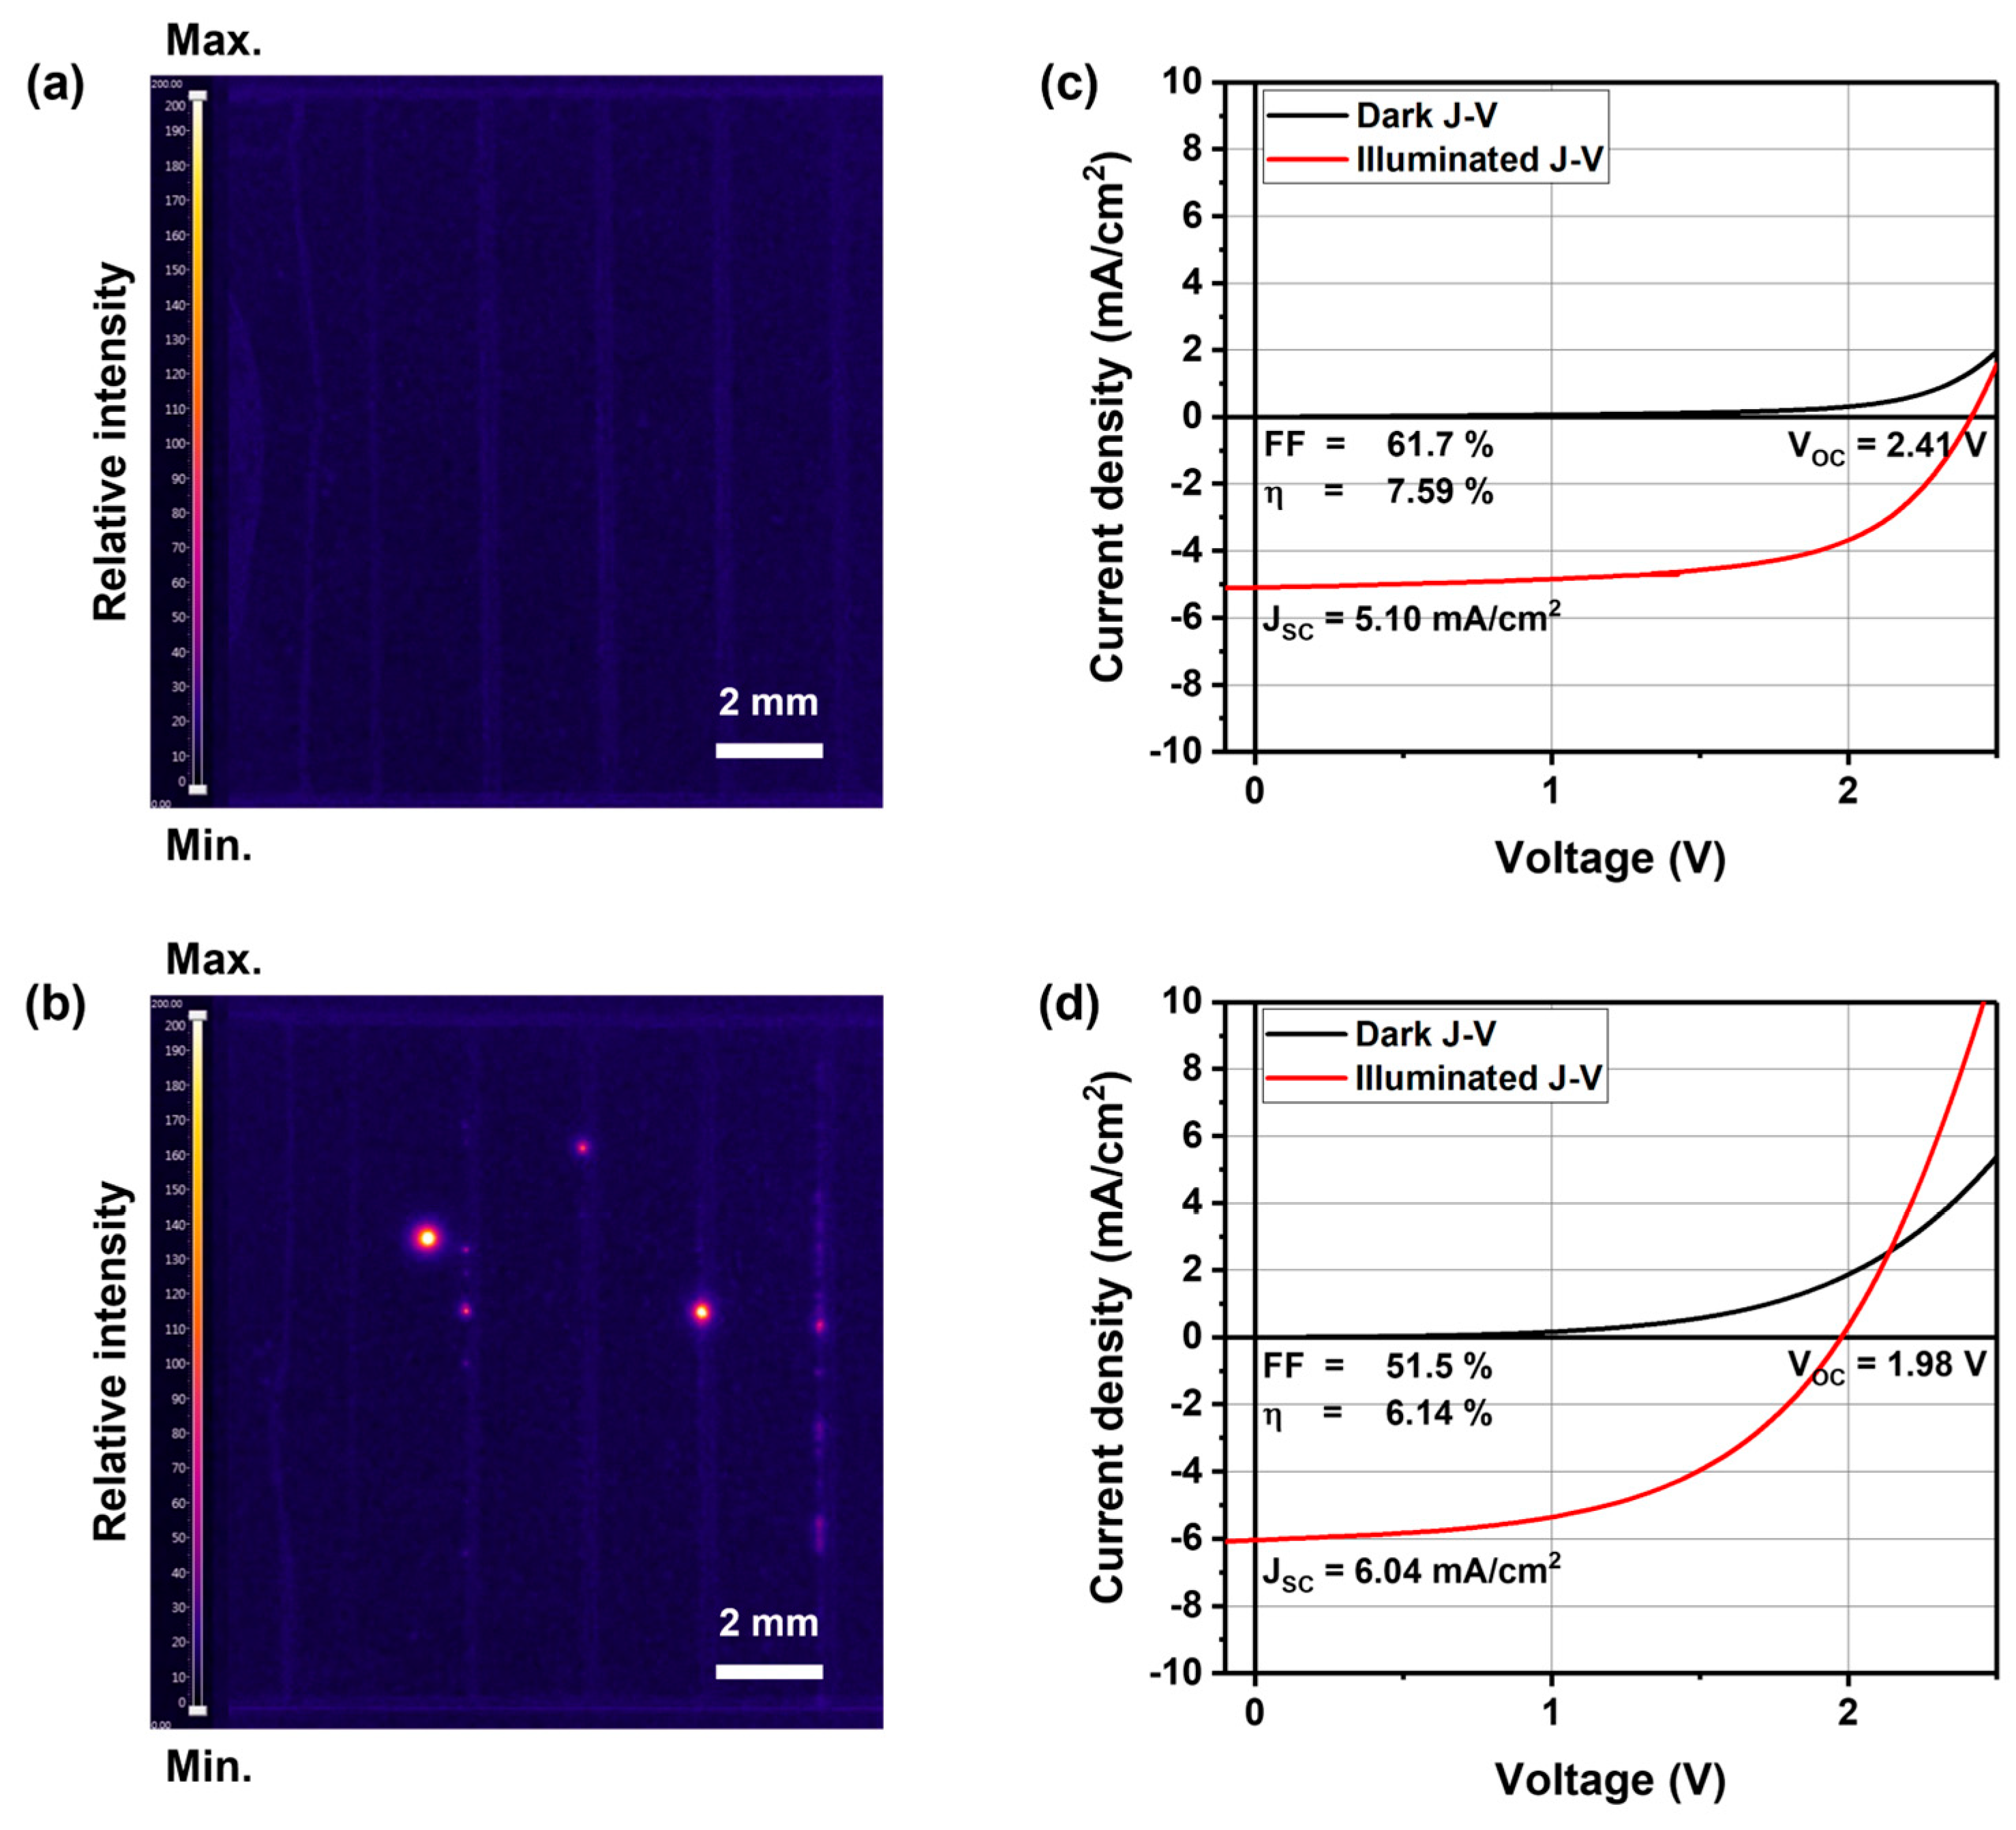
Figure 6 presents a comparison of CIGS mini-modules under distinct shunt conditions. The LIT image in
Figure 6a depicts a scenario with rare occurrences of critical shunt sites. The LIT image in
Figure 6b shows frequent shunt sites throughout the sample. Photovoltaic performance parameters for these cases are delineated in
Figure 6c,d.
For mini-modules with minimal shunting, as evident from
Figure 6a, the shunt resistance loss remains marginal. Consequently, both the open-circuit voltage (
Voc) and fill factor (FF) are moderately retained post-modularization, as illustrated in
Figure 6c. Conversely, when frequent shunting is observed (
Figure 6b), there is a notable decline in the fill factor (FF), which is accompanied by a significant loss in
Voc due to leakage, thus confirming a direct correlation between the prevalence of shunt sites and a corresponding reduction in efficiency—a relationship further elucidated by juxtaposing LIT images with the J–V curves.
The origin of these shunt sites can be mainly attributed to local absorber delamination and fracture, triggering an ohmic shunt due to the partial short-circuiting of the top and bottom electrodes. Comprehensive insights into the causative factors of shunt sites and prospective countermeasures have been discussed in our previous report [
15].
