Review

Cooling Technologies for Internet Data Center in China: Principle, Energy Efficiency, and Applications

1
School of Mechanical & Automotive Engineering, South China University of Technology, No. 381, Wushan Rd., Tianhe District, Guangzhou 510640, China
2
Guangdong Artificial Intelligence and Digital Economy Laboratory, No. 70, Yuean Rd., Haizhu District, Guangzhou 510640, China
*
Author to whom correspondence should be addressed.
Energies 2023, 16(20), 7158; https://doi.org/10.3390/en16207158
Submission received: 7 September 2023 / Revised: 12 October 2023 / Accepted: 15 October 2023 / Published: 19 October 2023
(This article belongs to the Section K: State-of-the-Art Energy Related Technologies)

Abstract

:
The highlighted energy consumption of Internet data center (IDC) in China has become a pressing issue with the implementation of the Chinese dual carbon strategic goal. This paper provides a comprehensive review of cooling technologies for IDC, including air cooling, free cooling, liquid cooling, thermal energy storage cooling and building envelope. Firstly, the environmental requirements for the computer room and the main energy consumption items for IDC are analyzed. The evaluation indicators and government policies for promoting green IDC are also summarized. Next, the traditional cooling technology is compared to four new cooling technologies to find effective methods to maximize energy efficiency in IDC. The results show that traditional cooling consumes a significant amount of energy and has low energy efficiency. The application of free cooling can greatly improve the energy efficiency of IDC, but its actual implementation is highly dependent on geographical and climatic conditions. Liquid cooling, on the other hand, has higher energy efficiency and lower PUE compared to other cooling technologies, especially for high heat density servers. However, it is not yet mature and its engineering application is not widespread. In addition, thermal energy storage (TES) based cooling offers higher energy efficiency but must be coupled with other cooling technologies. Energy savings can also be achieved through building envelope improvements. Considering the investment and recovery period for IDC, it is essential to seek efficient cooling solutions that are suitable for IDC and take into account factors such as IDC scale, climate conditions, maintenance requirements, etc. This paper serves as a reference for the construction and development of green IDC in China.

1. Introduction

With the rapid development of the digital economy, the global data size is experiencing explosive growth. As the hub of data storage, network communication and computing, the number and scale of Internet data center (IDC) are continuously expanding [1]. However, this expansion comes at a cost of significant energy consumption [2], which can be up to 100 times higher than that of standard office accommodation [3]. According to a statistical report [4], the total energy consumption of IDC accounted for approximately 1% of the global total energy consumption in 2018. It is estimated [4] that the global proportion of energy consumption by IDC will rise to 4.5% in 2025 and up to 8% in 2030.
China is also facing a critical situation regarding IDC energy consumption. Since 2010, the total energy consumption of IDC has been growing at a rate of more than 12% for eight consecutive years [5]. In 2020 [6], the energy consumption of IDC nationwide in China reached 150,700,000,000 kWh, resulting in over 94,850,000 tons of carbon emissions [7]. It is estimated [8] that by 2035, IDC in China will produce more than 150,000,000 tons of carbon emissions. The significant energy consumption of IDC is not in line with China’s energy-saving policy of “3060 double carbon”. Therefore, there is an urgent need to improve the energy utilization efficiency of IDC [9].
Information technology (IT) devices and auxiliary equipment are the physical components of an IDC. IT devices, such as servers, network switches and routers, play crucial roles in data transmission and processing within the IDC. Furthermore, auxiliary equipment, i.e., cooling system, lighting and other systems, are essential for maintaining the stable operation of IT devices. In short, IT equipment is the core equipment of IDC. As shown in Figure 1, the energy consumption of IT equipment accounts for approximately 45–50% of the total energy consumption in an IDC [2]. Additionally, a significant portion of the power consumed by IT equipment is converted into heat. To ensure the safe and reliable operation of the IDC, it is necessary to dissipate the heat generated by the IT equipment to the external environment through the cooling system. Failure to do so can lead to increased temperatures in the computer room, posing a serious threat to the safety of the IT equipment [10]. The energy consumption of the cooling system accounts for about 35–40% of the total energy consumption [11] in an IDC, making it the second largest energy-consuming component. Furthermore, the cooling system in an IDC is different from other traditional architectures. On the one hand, the cooling system operates continuously throughout the year due to the constant operation of IT equipment [12]. On the other hand, the heat flux and energy consumption in an IDC are significantly higher compared to other traditional architectures [13]. For example, a rack [14] with a wind inlet area of 2.4 m2 and a heat load of 10 kW can generate a heat flux as high as 4.2 kW/m2. Therefore, optimizing and adjusting the cooling system is a crucial approach to promoting green and low-carbon development in IDC.
Generally, a typical IDC cooling system consists of a mechanical refrigeration sub-system (MRSS) and a terminal cooling sub-system (TCSS) [15]. The MRSS is responsible for providing a cold source for heat transfer, while the TCSS moves heat from the computer room to the outdoor environment. Generally, the MRSS consists of chillers, pumps and cooling towers, while the TCSS includes a computer room air conditioning (CRAC) and a computer room air handler (CRAH). Generally, fresh air is not used in IDC computer rooms due to the high air quality requirements of servers. The basic mechanism of the typical cooling system is illustrated in Figure 2. The chilled water (indicated by the blue line) is circulated from the chillers to the terminal cooling units in the computer room through chilled water pumps. The chilled water absorbs heat from the IT equipment and returns to the collector (indicated by the red line), where it is then sent back to the chillers. At the same time, cooling water (indicated by the yellow line) is pumped from the chillers to the cooling towers, where it dissipates heat to the outdoor environment. The cooled water is then returned to the chillers for reuse (indicated by the green line).
While this typical cooling system is safe and reliable, it does have some drawbacks. Firstly, it relies on a vapor compression cycle to operate throughout the year, even in winter when the outdoor temperature is low, resulting in high electricity [16]. Secondly, the mixing of cold and hot airflow in the computer room can lead to poor heat exchange due to inefficient airflow control. Lastly, the use of pumps and fans for water and air transport in the cooling system consumes a significant amount of energy and results in losses, regardless of the transport distance [17].
The disadvantage of the typical cooling system is its high electricity consumption. According to statistical results in Figure 1, when the cooling system accounts for approximately 40% of the total energy consumption in an IDC, the chiller alone consumes approximately 16% of the energy, while the terminal and other equipment (pumps and cooling towers) each consume approximately 12%. Studies have shown that for every 1 Kw of heat generated by the IT equipment, around 1.5 Kw of electricity is needed for cooling [18]. This high energy consumption presents a significant opportunity for energy conservation in the cooling system in an IDC. For instance, a 20,000 m2 IDC can save over 680,000 kWh of electricity annually by increasing the cooling system efficiency by just 1%. That would result in a reduction of nearly 187 tons of carbon emission and save approximately RMB 600,000 in electricity costs [19]. Therefore, improving cooling efficiency is a key focus for reducing energy consumption and carbon emissions in IDC.
Currently, extensive research is underway to explore more energy-efficient cooling methods and technologies in order to address the challenges in IDC. For instance, a study by [20] reviews the performance characteristics of free cooling and heat pipe cooling. Additionally, the same study also summarizes the performance evaluation criteria for free cooling in IDC [20]. Moreover, [2] provides an overview of four cooling technologies, namely, free cooling, liquid cooling, two-phase cooling and building envelopes, discussing their characteristics, applicability and energy saving. Furthermore, [21] reviews the technical principles, advantages and limitations of cooling technologies such as pipe cooling, immersion cooling and thermal energy storage (TES) based cooling.
Nonetheless, there are still certain aspects that remain unclear. Firstly, there is a lack of comprehensive performance comparisons between different technologies, and when such comparisons exist, they are often based on different key performance parameters. Secondly, there is a dearth of thorough reviews comparing traditional cooling technologies with newer ones. This paper aims to provide an overview of energy consumption and efficiency improvement technologies in IDC in China. The main contributions of this paper can be summarized as follows.
(1)
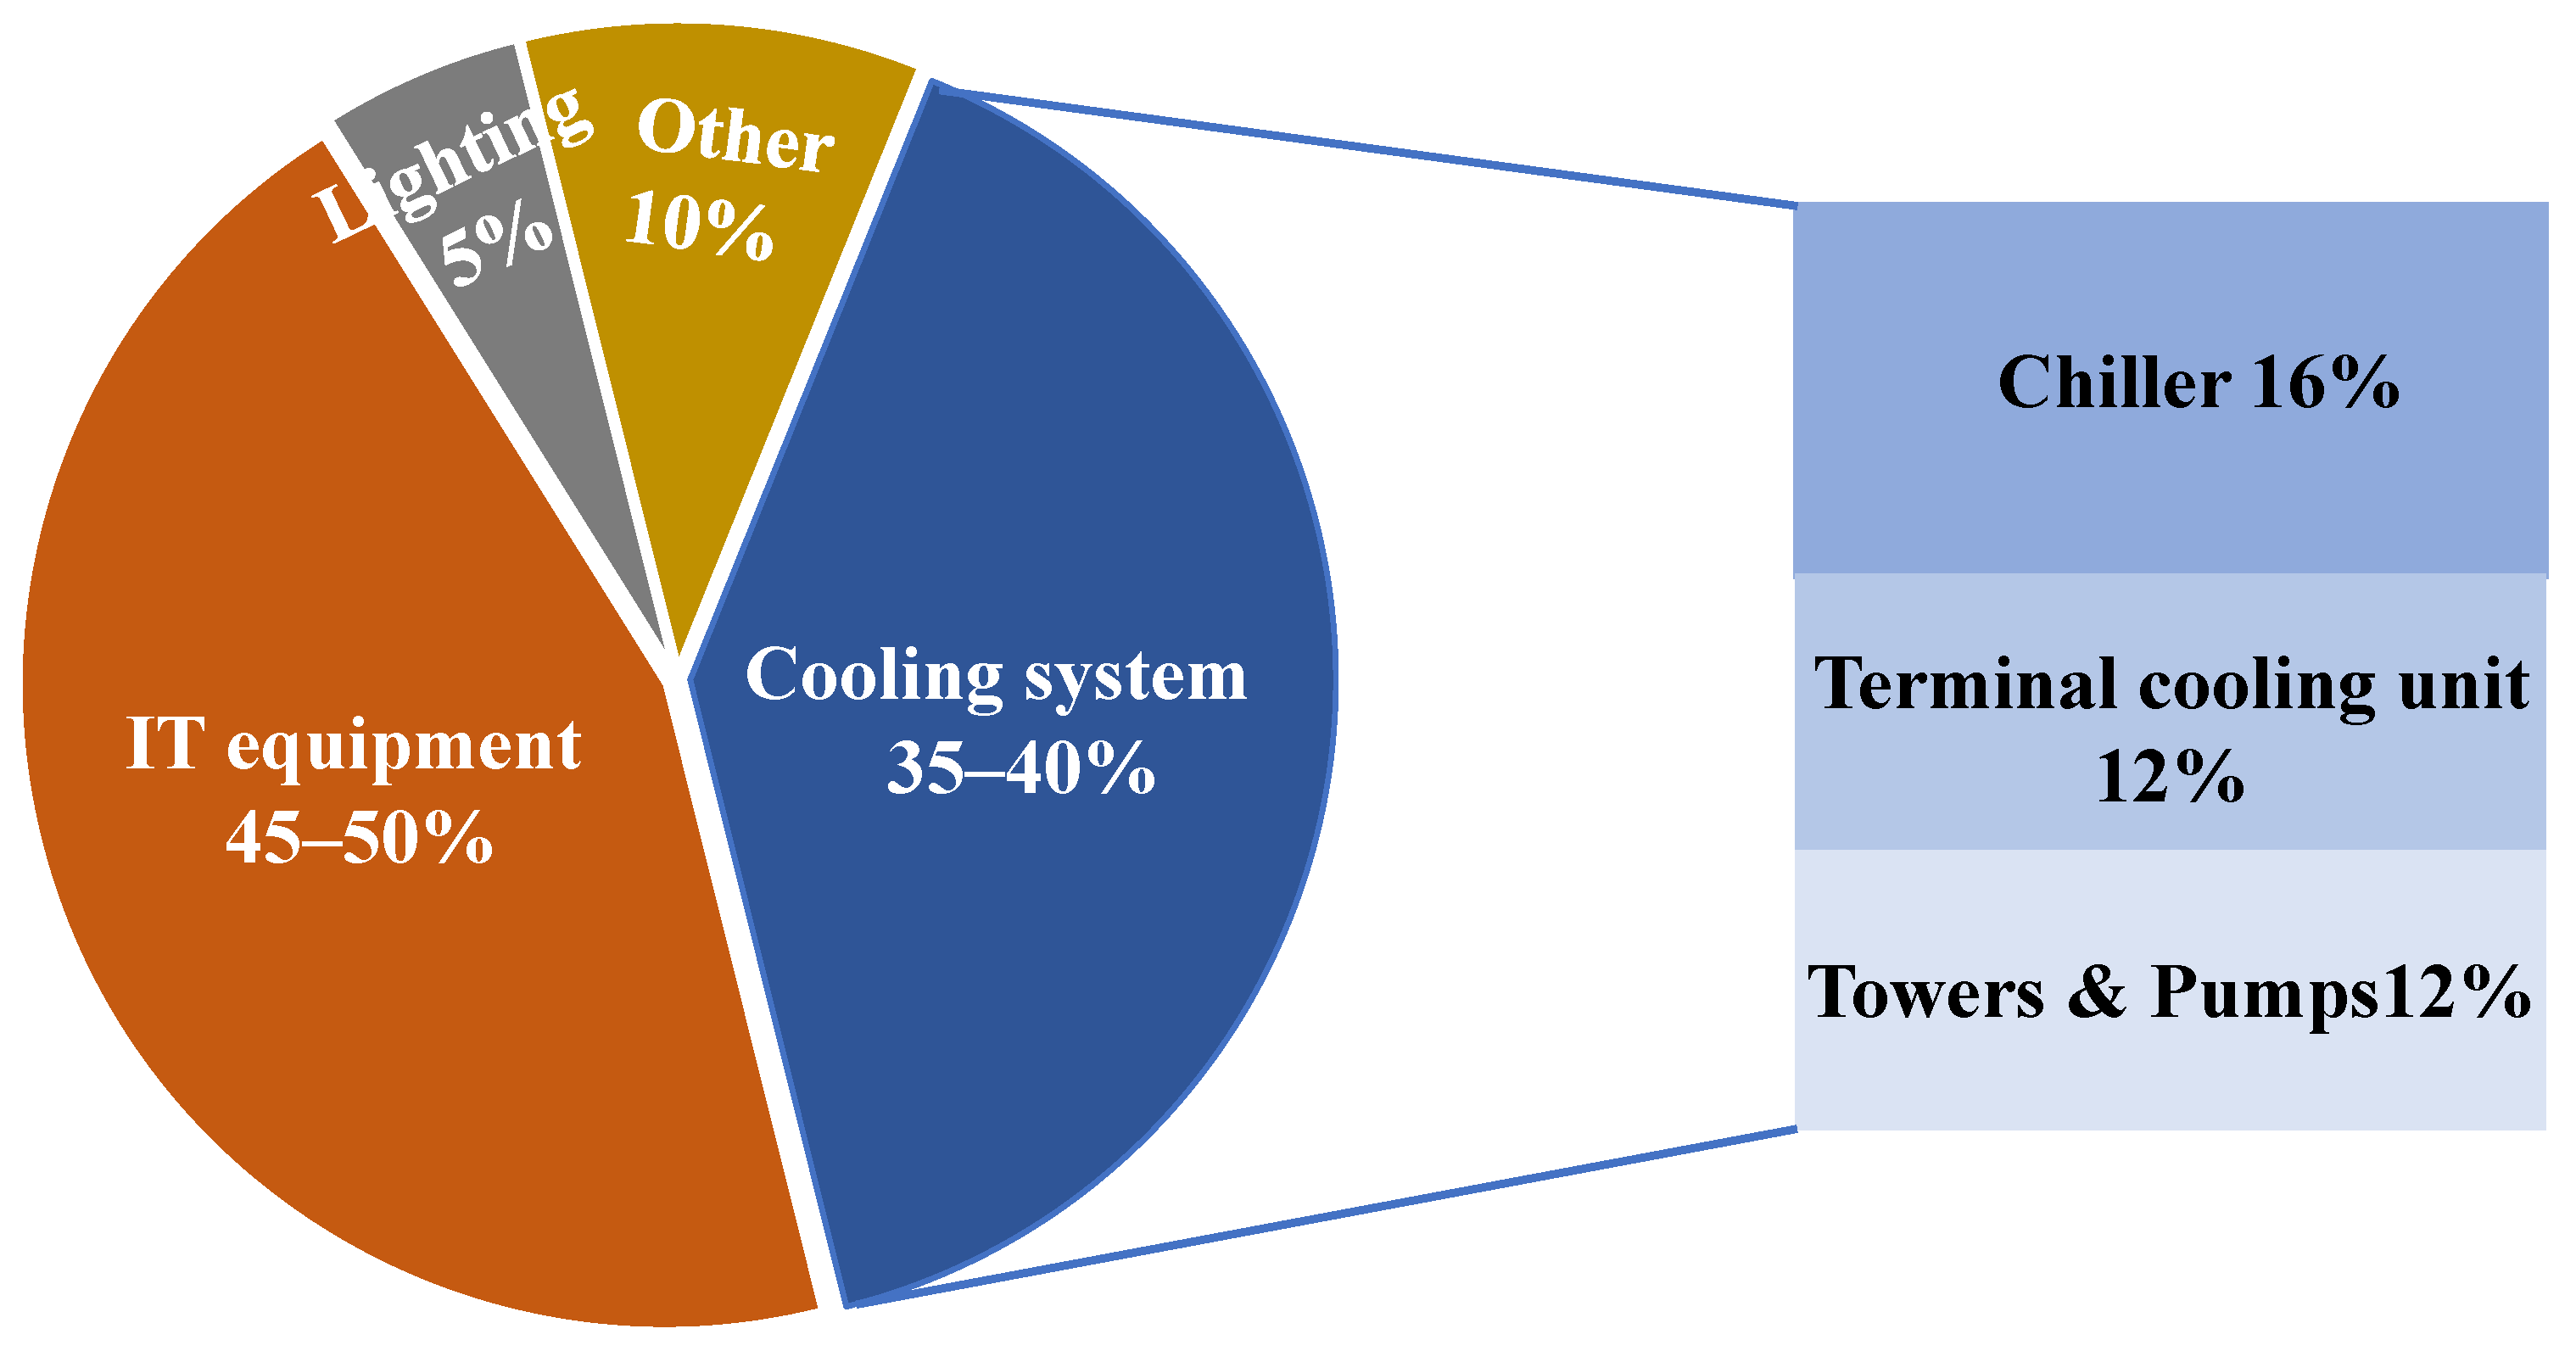
Summarizing the evaluation metrics for IDC efficiency. This section discusses the impact of the cooling system on IDC energy efficiency. It also summarizes the requirements for the computer room environment and the related policies for IDC energy efficiency. Furthermore, it analyzes the benefits and drawbacks of different evaluation metrics, helping users select the most relevant one;
(2)
Summarizing the principles, energy efficiency and applications of both traditional and four new cooling technologies. Section 4 and Section 5 introduce the configurations of traditional and new cooling technologies in IDC, including combinations with mechanical refrigeration and air cooling terminals, free cooling, liquid cooling, TES based cooling and building envelope. By analyzing their advantages and limitations, the suitable scenarios for these five techniques are also summarized;
(3)
Proving a future development prospect for IDC cooling systems. This paper deeply analyzes the energy efficiencies of these cooling technologies and compares them using the same evaluation metrics. Notably, this review covers both laboratory-scale and commercial-scale systems.
The paper’s structure is depicted in Figure 3, outlining the main sections and their interconnections. The aim of this paper is to serve as a reference for the development of environmentally friendly IDC, contributing to the high-quality development and digital transformation outlined in China’s 14th Five-Year Plan.

2. Methodology

2.1. Requirement for Computer Room Environment

The computer room environment in an IDC plays a crucial role in ensuring the stable operation of IT equipment [22]. There are several factors that need to be considered to maintain an optimal environment for the equipment. One important factor is the presence of dust and mineral particles in the air. These particles can cause scratches on the IT equipment, leading to potential damage and reduced performance. Additionally, toxic and harmful gases, i.e., nitrogen oxides and sulfides, can be present in the air, which can corrode the IT equipment and shorten its lifespan. Another factor to consider is the heat dissipation capacity of the IDC. Due to the large scale of IDC, there is a significant amount of sensible heat generated per unit area. For instance, the heat dissipation capacity of a single rack can reach over 20 kW, with a sensible heat ratio exceeding 95%. This high heat generation can result in a rapid temperature rise in the computer room, leading to server downtime and failure. Generally, an inadequate thermal environment can also lead to poor cooling efficiency, premature equipment failure, poor reliability, and increased power and operating costs. Therefore, the environmental requirements for computer rooms in an IDC are much higher compared to conventional places.
The American Society of Heating Refrigeration and Air Conditioning in Engineers (ASHRAE) has developed a series of guidelines to ensure that IT equipment operates under optimal environmental conditions [23]. Table 1 shows the classification recommendations and allowable environmental parameters of the computer room given by ASHRAE TC9.9. In addition, China has its own Code for Design of Data Center (GB 50174–2017) that provides guidance on the computer room environment. For instance, in the computer room, the temperature of the cold aisle and of the air inlet area of the rack is required for 18 °C–27 °C. The dew point temperature is required for 5.5 °C–15 °C. The relative humidity is required not to exceed 60%. However, when the requirements of IT equipment are relaxed, the temperature range for the cold aisle and air inlet area of the rack can be expanded to 15 °C–32 °C.

2.2. Performance Criteria

2.2.1. Energy Efficiency Assessment Indicator

The structure of an IDC is quite complex, so it is important to consider the measurability of metrics when evaluating its energy efficiency. The existing metrics for evaluating energy efficiency in IDC can be categorized into two types, i.e., coarse-granularity metrics and fine-granularity metrics.
One widely used coarse-granularity metric is Power Usage effectiveness [24] (PUE). PUE is calculated by dividing the total energy consumption of the IDC by the energy consumption of the IT equipment [24], as shown in Equation (1).
P U E = T o t a l   e n e r g y   c o n s u m p t i o n   o f   I D C T o t a l   e n e r g y   c o n s u m p t i o n   o f   I T   e q u i p m e n t = T o t a l   e n e r g y   c o n s u m p t i o n   o f   I T   e q u i p m e n t + T o t a l   e n e r g y   c o n s u m p t i o n   o f   c o o l i n g   s y s t e m + T o t a l   e n e r g y   c o n s u m p t i o n   o f   o t h e r T o t a l   e n e r g y   c o n s u m p t i o n   o f   I T   e q u i p m e n t
where other energy consumption includes uninterruptible power supply (UPS), power distribution unit (PDU), lighting system, power system, monitoring system, etc. Theoretically, the minimum value of PUE can approach l infinitely when the energy consumption of the cooling and other is negligible compared to the IT equipment. Conversely, a higher PUE indicates a lower energy efficiency, suggesting that a significant portion of the power is consumed by cooling and other systems. PUE is a simple metric to calculate and provides an overall evaluation of the IDC’s energy efficiency. However, it does not provide specific recommendations for energy savings.
To complement the coarse-granularity metrics, fine-granularity metrics like the Cooling Load Factor, CLF [25], can be used to evaluate the cooling energy consumption of the IDC. CLF is calculated by dividing the energy consumption of the cooling system by the IT equipment [25], as shown in Equation (2). Moreover, this metric provides more specific information about the energy efficiency of the cooling system.
C L F = T o t a l   e n e r g y   c o n s u m p t i o n   o f   c o o l i n g   s y s t e m T o t a l   e n e r g y   c o n s u m p t i o n   o f   I T   e q u i p m e n t
Eventually, fine-granularity metrics offer a more accurate evaluation of the energy efficiency of IDC. These metrics take into account the diversity and pertinence of the IDC’s components and operations, allowing for a more detailed analysis of energy consumption and efficiency.

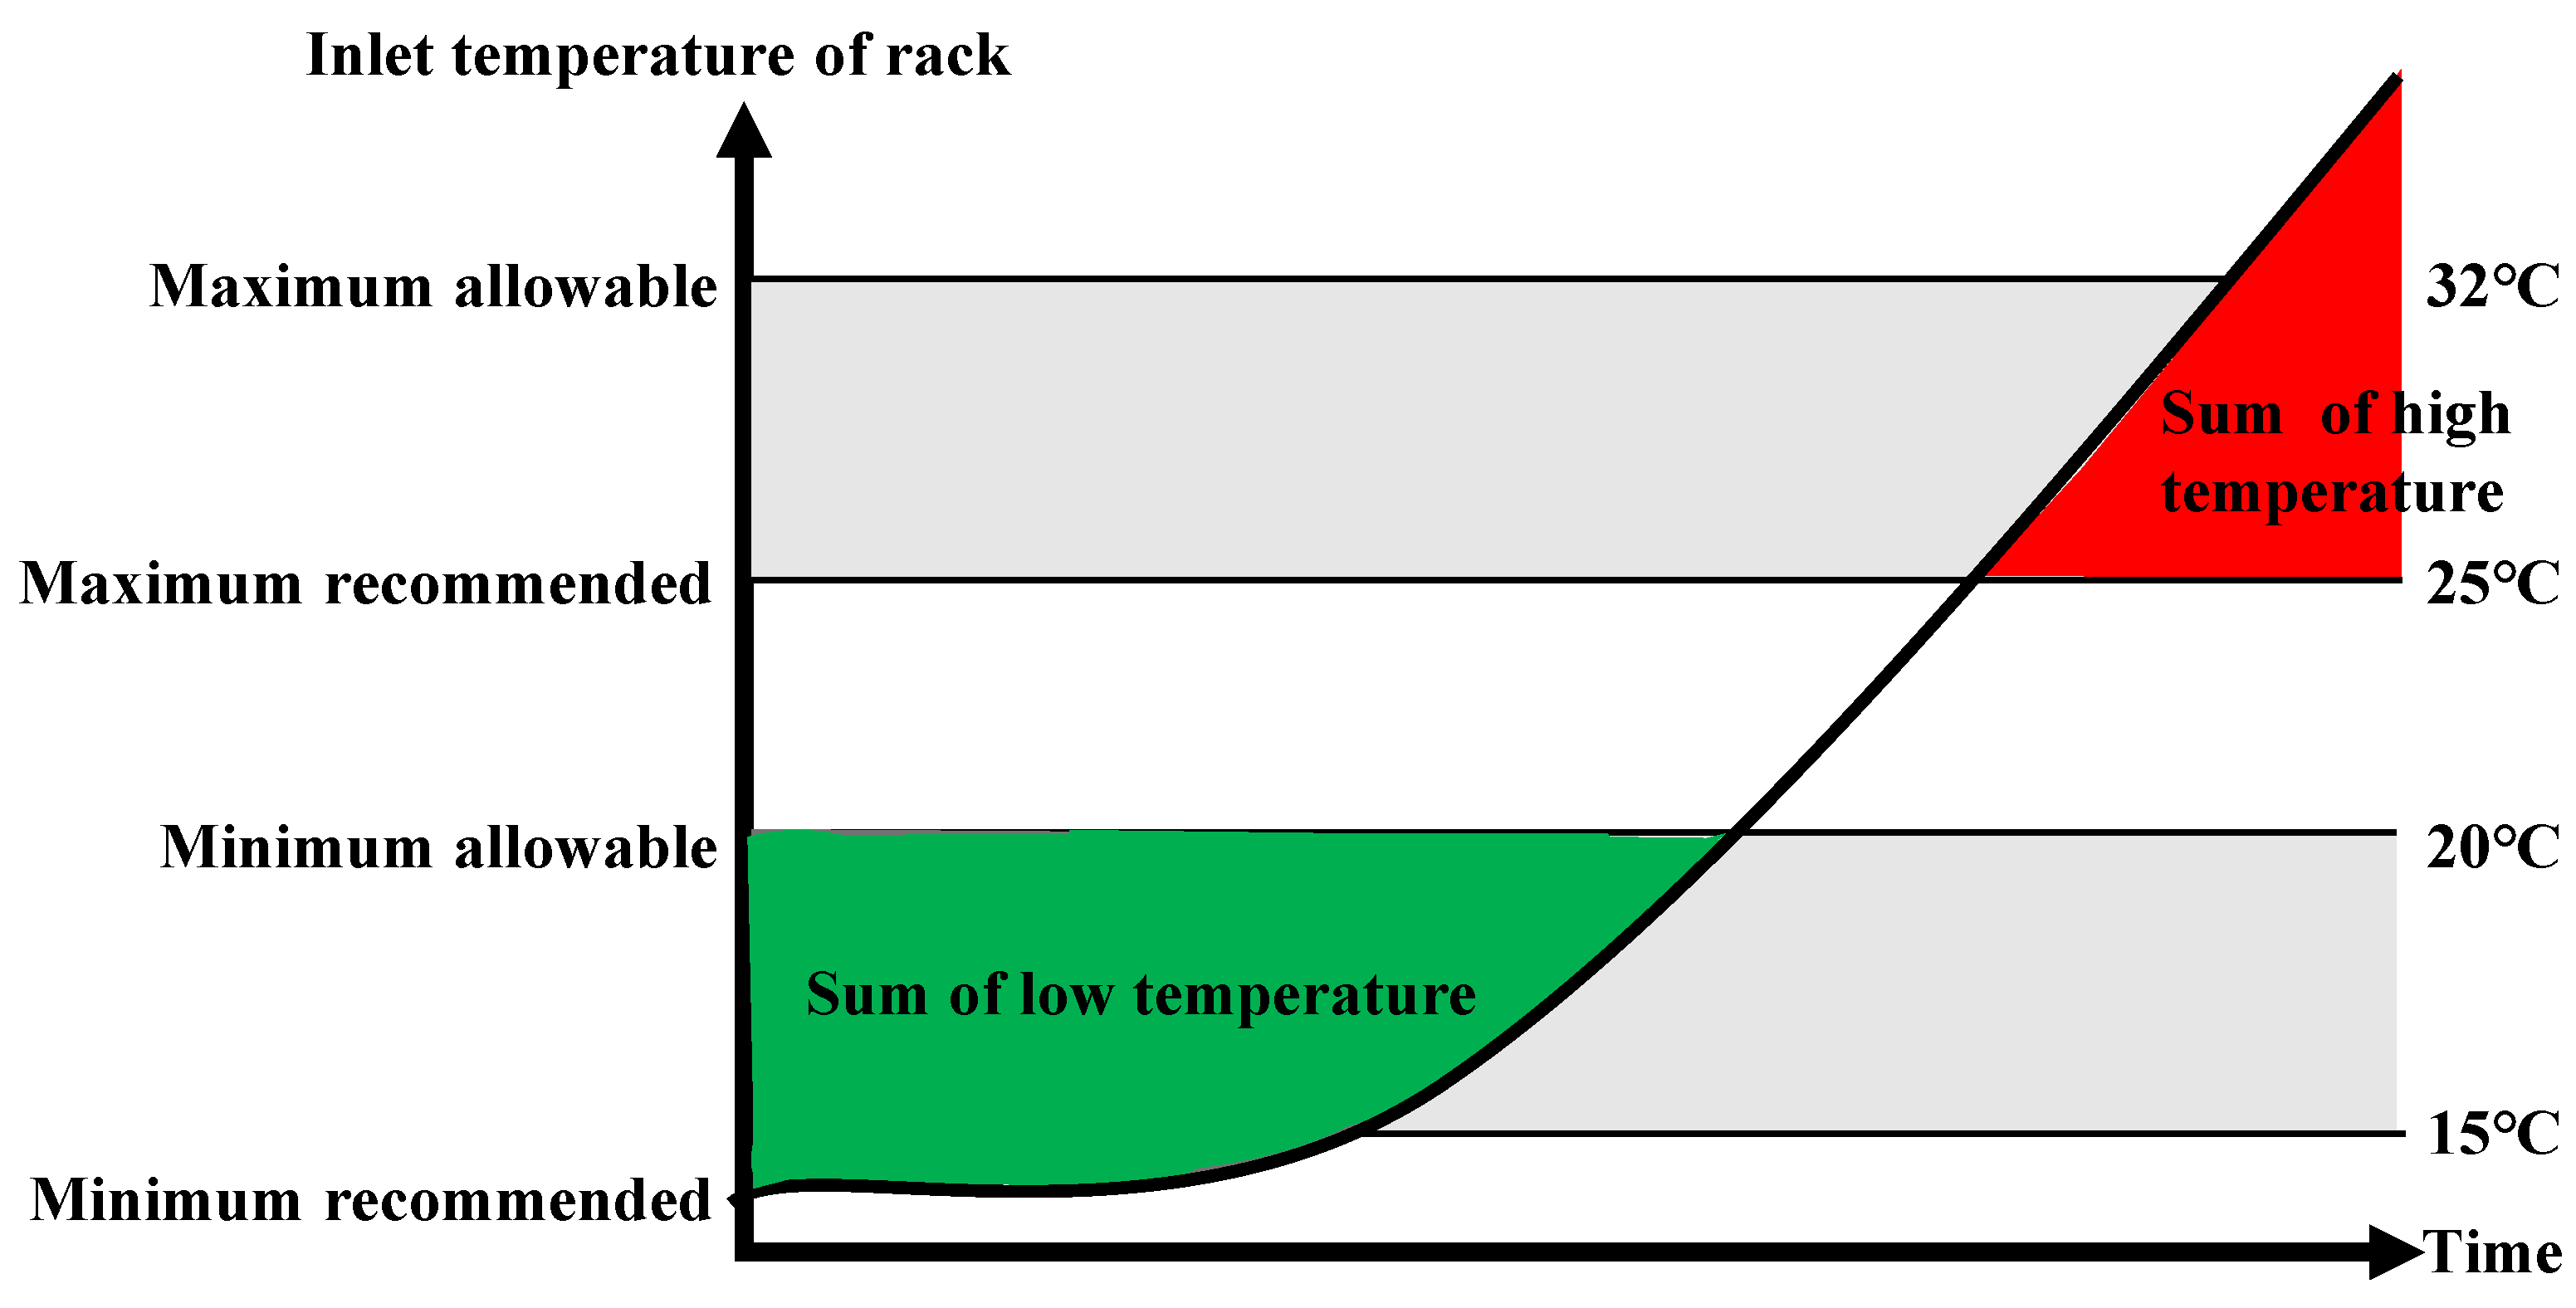
2.2.2. Thermal Environment Assessment Indicator

PUE and CLF are commonly used metrics to evaluate the energy efficiency of an IDC at a macro level. However, there are also several micro level indicators that researchers have promoted to evaluate the energy efficiency in computer rooms. These micro level indicators include Supply Heat Index (SHI) [26], Return Heat Index (RHI) [26], β [27], Rack Cooling Index (RCI) [28] and Return Temperature Index (RTI) [29], which are expressed as Equations (3)–(12). In fact, these micro level indicators provide a more detailed evaluation of the cooling system’s utilization efficiency in the computer room. However, it is important to note that indicators such as SHI, RHI and β are not specifically applicable to evaluating the cooling efficiency at the IT equipment level.
SHI [26] and RHI [26] are defined as an indicator of the thermal cooling performance in a row of racks. In Equation (3), the numerator is defined as the heat absorbed by the cold airflow from the air conditioning supply to the rack inlet and the denominator is defined as the heat absorbed by the cold airflow from the air conditioning supply to the rack outlet. The smaller the SHI value, the higher the utilization rate of cold airflow. In Equation (4), the numerator is defined as the capacity of the cooling server and the denominator is defined as the capacity of the cold airflow from the air conditioning supply to the rack outlet. The larger the RHI value, the higher the utilization efficiency of cooling.
S H I = δ Q Q + δ Q
R H I = Q Q + δ Q
Q = j i m i , j r ρ T o u t r i , j T i n r i , j
δ Q = j i m i , j r ρ T i n r i , j T r e f
β = T i n T r e f T o u t T i n
where Q is the total heat dissipation from all the racks in the data center and δ Q is the rise in enthalpy of the cold air before entering the rack; i is the number of cabinet lines; j is the number of cabinet columns; m i , j r is the mass airflow rate through ith rack in the jth row of racks, m3/h; ρ is the specific heat, J/kg °C; T o u t r i , j and T i n r i , j are average outlet and inlet temperatures from the ith rack in the jth row of racks, °C. Tref denotes the supply air temperature of terminal cooling units, assumed to be identical for all rows, °C. In addition, β [27] is a correction to the calculation method based on SHI, which uses the average temperature difference between the inlet and outlet airflow of the rack as a reference standard for measuring the mixing intensity of hot and cold airflows, as illustrated in Equation (7). The phenomenon of the thermal cycle in the computer room can be evaluated by β, i.e., β > 1.
RCI [28] is used to evaluate the cooling performance of environmental conditions in an IDC facility. It takes into account both the upper index and the lower index, i.e., rack cooling index high (RClHi) and rack cooling index low (RCILo). Specifically, RCIHi measures the extent to which the rack inlet airflow temperature exceeds the recommended upper temperature limit, while RCILo measures the extent to which the rack inlet airflow temperature falls below the recommended lower temperature limit. As shown in Figure 4, the proportion of the time exceeding the recommended inlet airflow temperature of the rack to the total time is RCIHi and RCILo. The specific formulas [28] are shown in Equations (8)–(11).
R C I H i = 1 T x T m a x r e c A T m a x a l l T m a x r e c n 100 %
R C I L O = 1 T m i n r e c T x B T m i n r e c T m i n a l l n 100 %
A = T x > T m a x r e c
B = T x < T m i n r e c
where Tx is the mean temperature of the xth server inlet, °C; Tmax-rec is the maximum recommended temperature value in ASHRAE TC 9.9, °C; Tmax-all is the maximum allowable temperature value in ASHRAE TC 9.9, °C; n is the total number of servers inlet; Tmin-rec is the minimum recommended temperature value in ASHRAE TC9.9, °C; Tmin-all is the minimum allowable temperature value in ASHRAE TC 9.9, °C. The two metrics provide a quantitative assessment of the cooling performance in the computer room, helping to identify areas where the temperature is outside the recommended range.
In addition, RTI is an indicator that can describe the airflow distribution characteristics within a rack [29]. It is defined as the ratio of the temperature difference between the computer room and the IT equipment. The specific formula [29] for RTI is shown in Equation (12).
R T I = T R A T S A T E q u i p 100 %
where TRA is the return airflow temperature of CRAC/H, °C; TSA is the supply airflow temperature of CRAC/H, °C; ΔTEquip refers to the temperature difference between the inlet and outlet of IT equipment, °C. If RTI < 100%, there is a bypass of cold airflow in the computer room. If RTI > 100%, it means that there is a cycle of hot airflow in a computer room. This indicator provides insights into the airflow distribution and cooling effectiveness within the rack.
In a word, some of the mentioned metrics (RTI, RCI) can evaluate the airflow organization and cooling efficiency of the overall or local space in an IDC. However, they cannot describe the thermal environment of individual IT equipment, nor can they determine where the mixing of cold and hot airflows occurs. Therefore, they are unable to depict the distribution of the thermal environment in an IDC, making it difficult to make targeted improvements and optimizations. On the other hand, some metrics (SHI, RHI, β) can describe certain distribution characteristics of the airflow organization in an IDC, but they cannot reflect the temperature levels at which cold and hot air mixing occurs in the entire data center, local spaces, or individual racks. As a result, they cannot determine whether there will be local hotspots or if they are in the “thermal safe zone”.

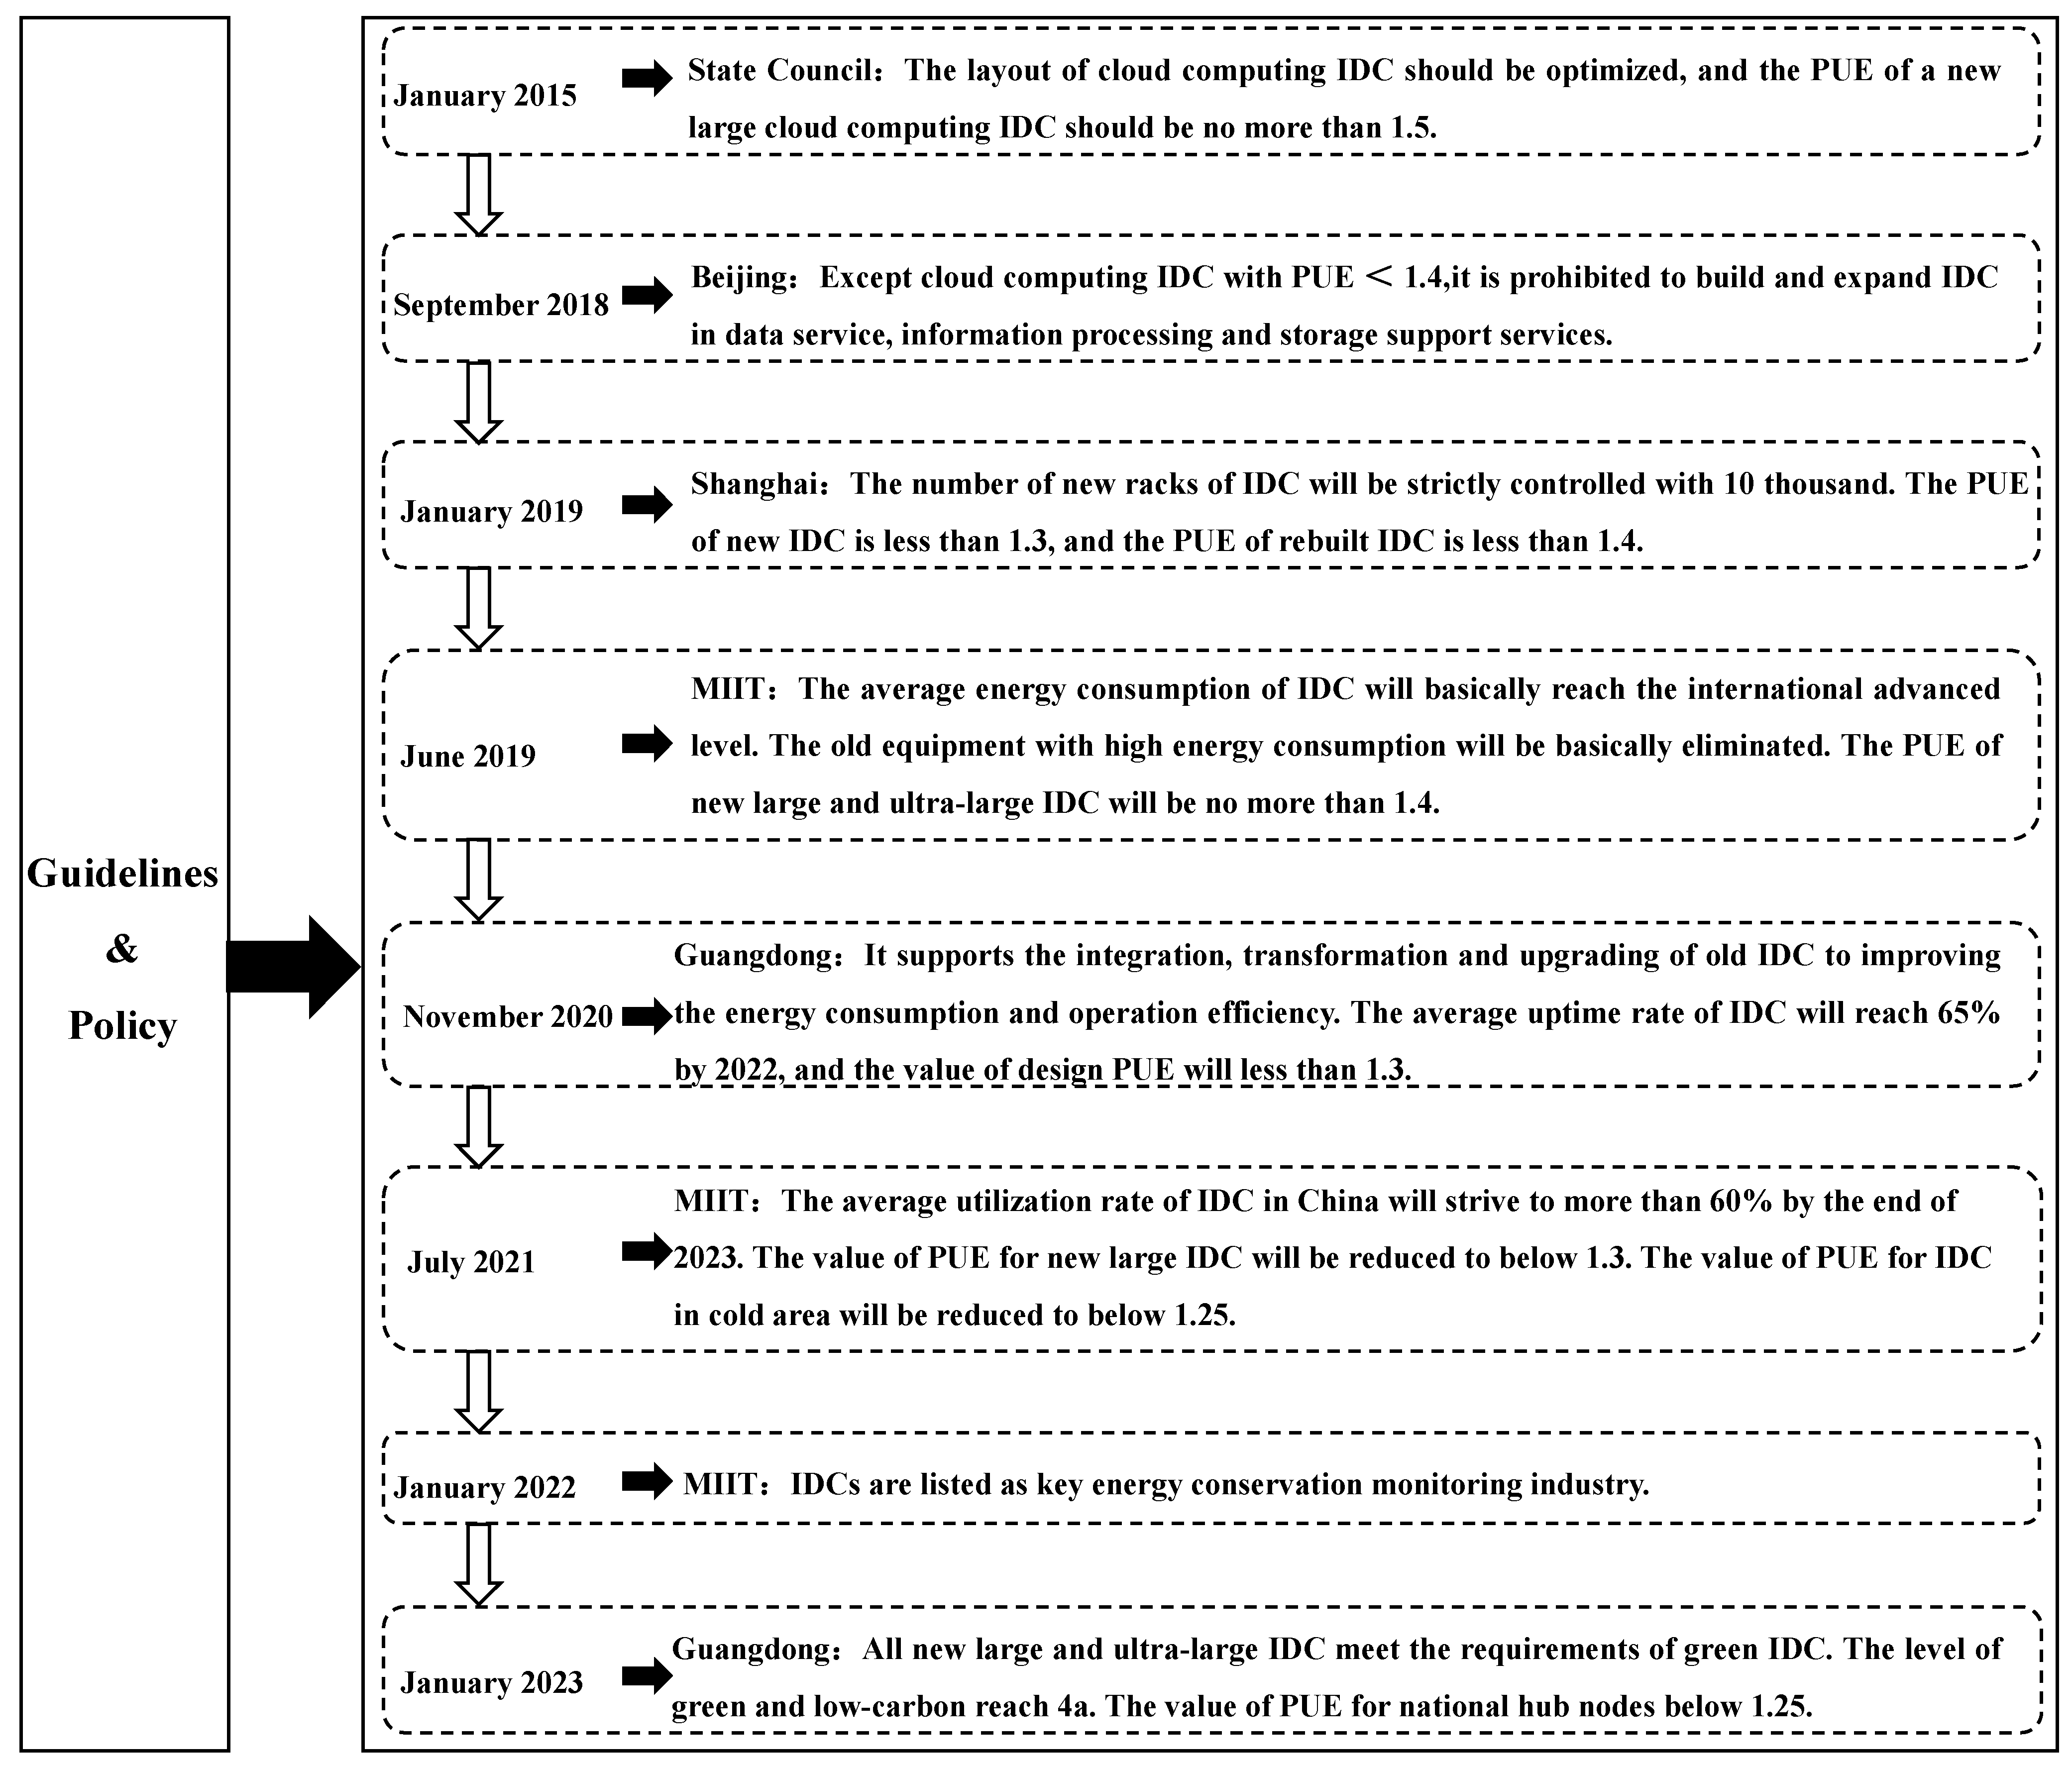
3. Status and Policies for Energy Conservation in China

The energy conservation potential of IDC in China is significant, as highlighted in a report published by the Ministry of Industry and Information Technology (MIIT) of the People’s Republic of China. The report reveals that more than half of Chinese IDCs have a PUE value between 1.3 and 1.5, with 37% of IDCs having a PUE value greater than 1.5. Additionally, only a few IDCs have achieved a PUE value lower than 1.2. Furthermore, the CLF value of most IDCs in China falls within the range of 0.15 to 0.25, with only 5% having a CLF value between 0.01 and 0.1 [30].
To guide the construction of environmentally friendly IDC, various opinions and policies have been issued in recent years, as depicted in Figure 5. The MIIT in China has set a target for large IDCs to achieve a PUE value below 1.3 by the end of 2023. In cold areas, the aim is to achieve a PUE value below 1.25. Guangdong Province has also established a requirement that newly built IDCs should have a PUE value no higher than 1.25 by 2025. Notably, failure to meet these PUE requirements may result in the prohibition of building or expanding the IDC.
The efficiency of the cooling system is a key factor influencing the PUE value. Currently, most IDCs in China utilize traditional cooling technologies, resulting in an annual average PUE value of no less than 1.7. These cooling systems exhibit characteristics such as high total electricity consumption, low energy efficiency and a significant potential for energy savings. Therefore, the adoption of new and efficient cooling technologies is crucial to ensure energy efficiency in IDC.

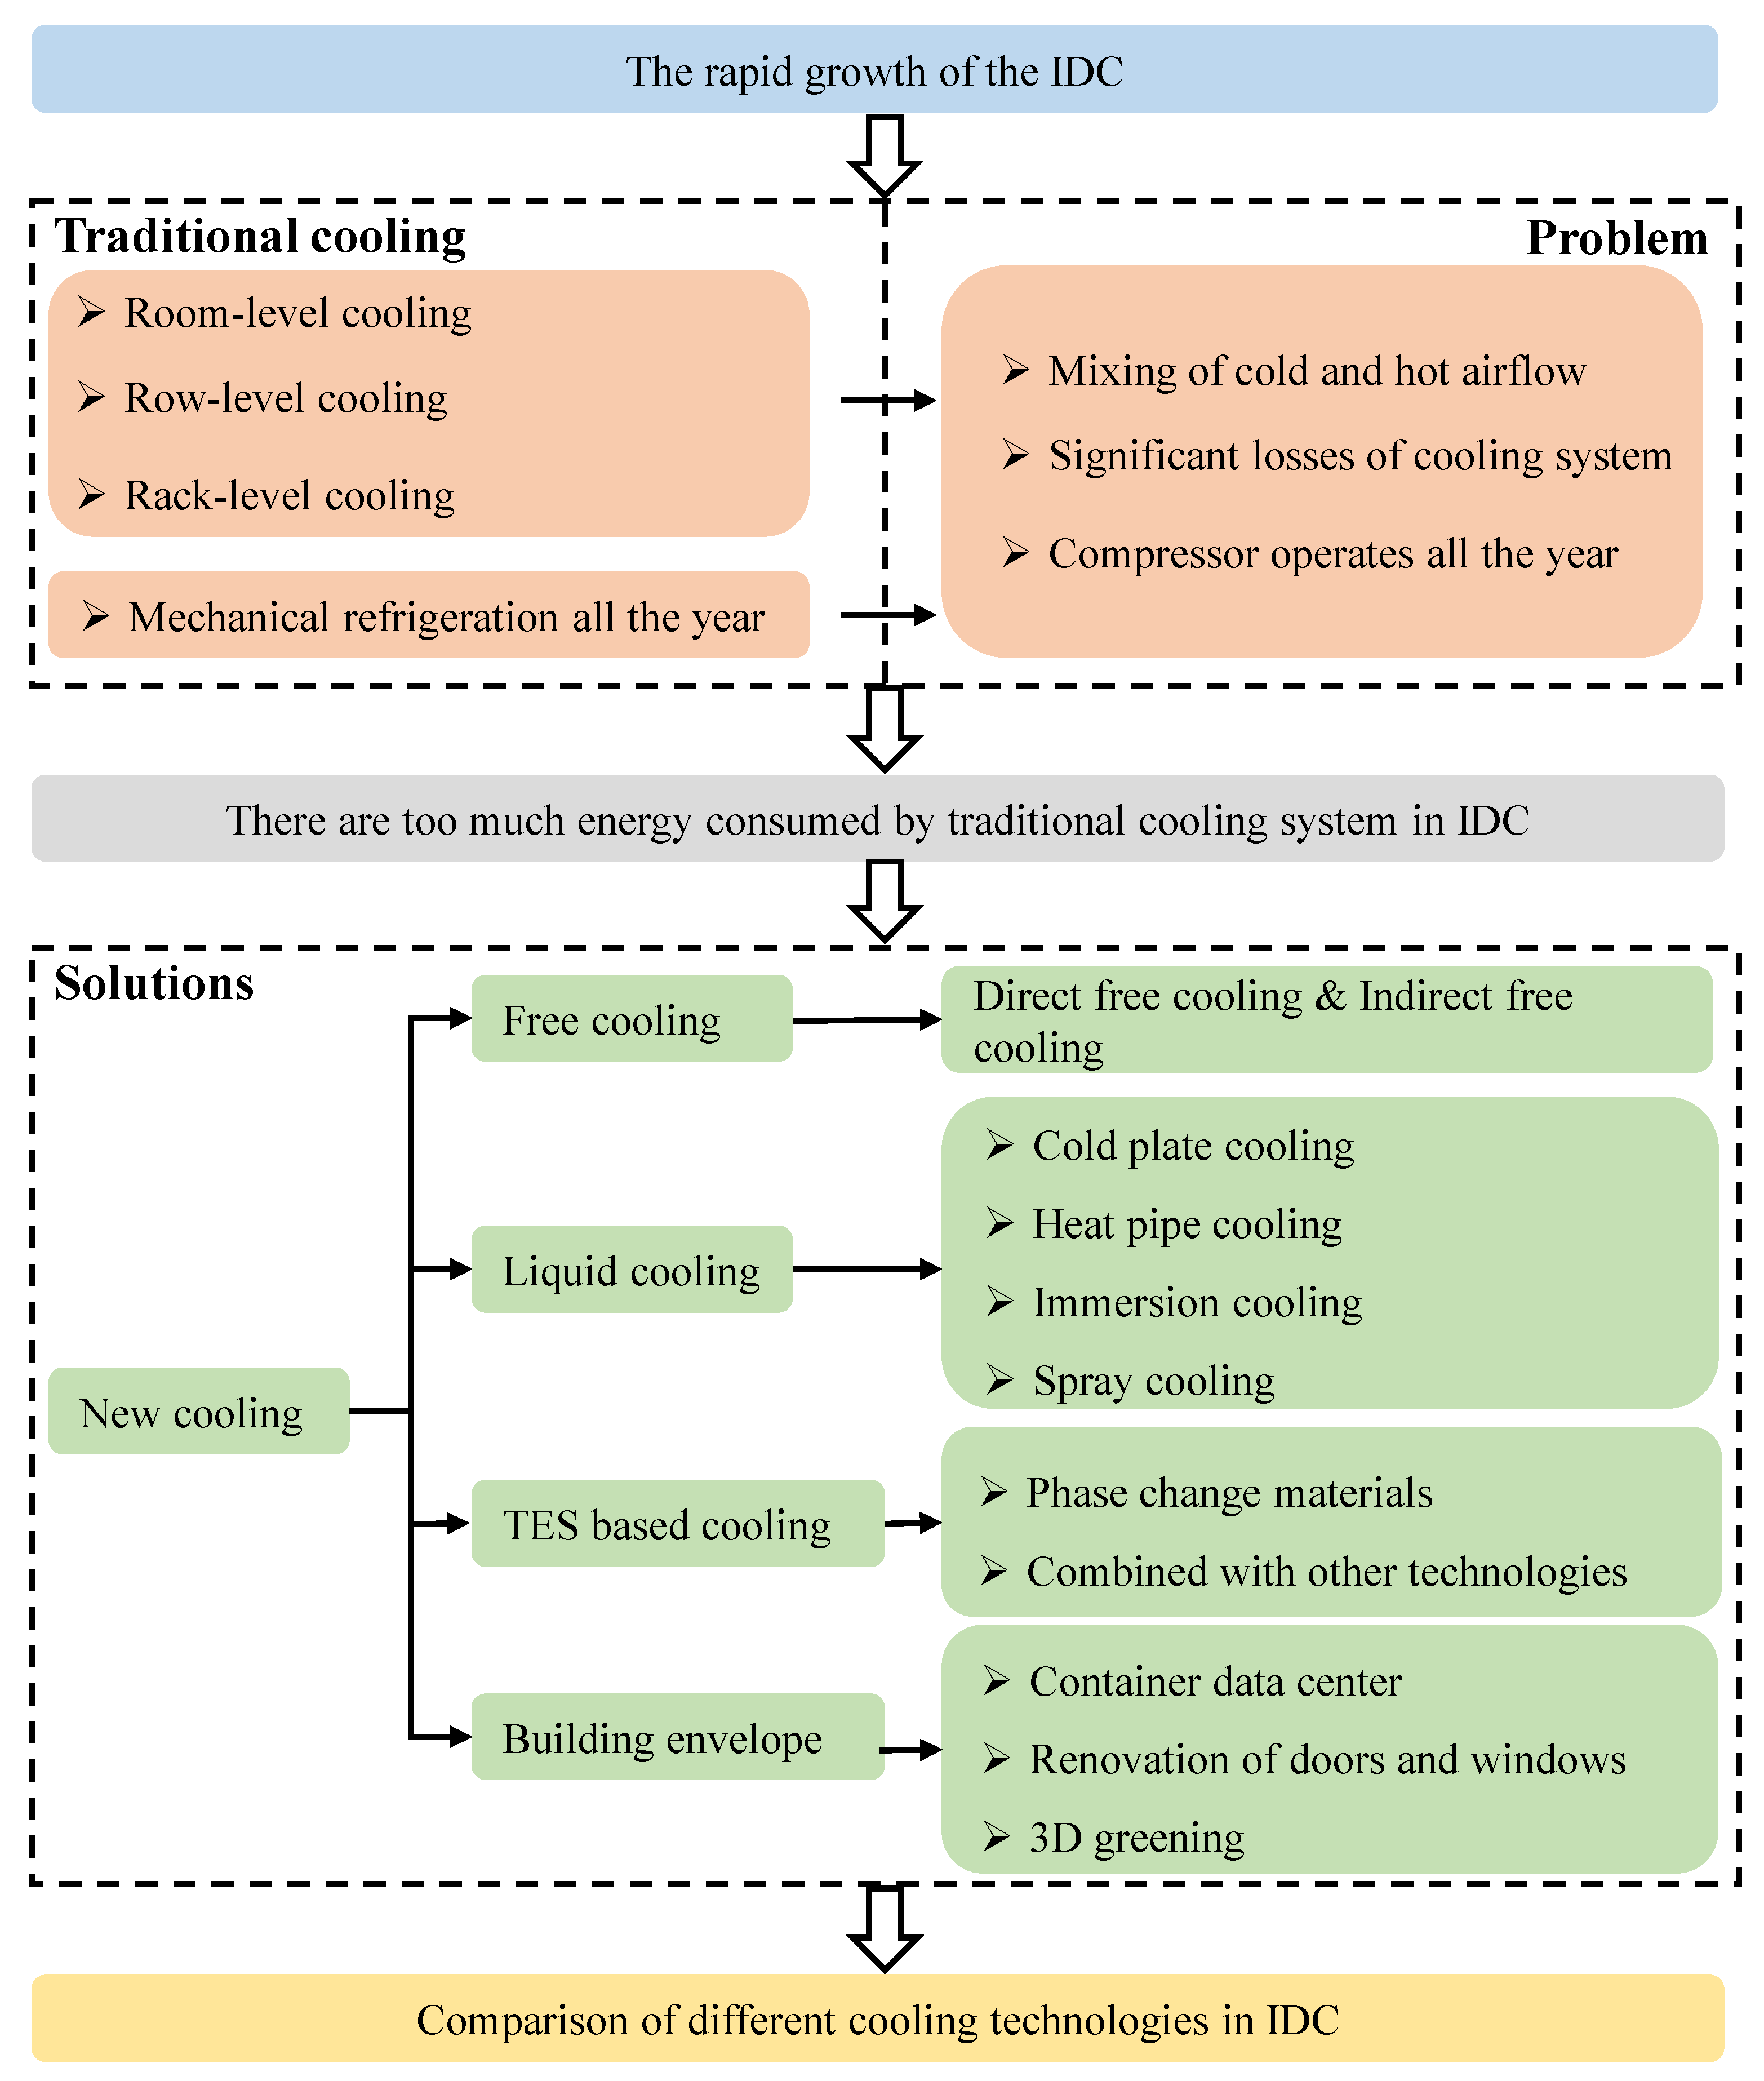
4. Traditional Cooling Technologies

It is the most traditional solution, combined with mechanical refrigeration and terminal of air cooling, for transferring heat generated by IT equipment to the outdoor environment [31]. The traditional solution has the advantages [32] of high reliability, simple maintenance, low operating cost, etc. Additionally, the terminal of air cooling technology is widely used in IDC. The heat exchange in the terminal of the air cooling technology is achieved by the airflow of TCSS. The cooling source for TCSS is provided by the MRSS. In this section, the mechanical refrigerating and terminal of air cooling technology are discussed, respectively.

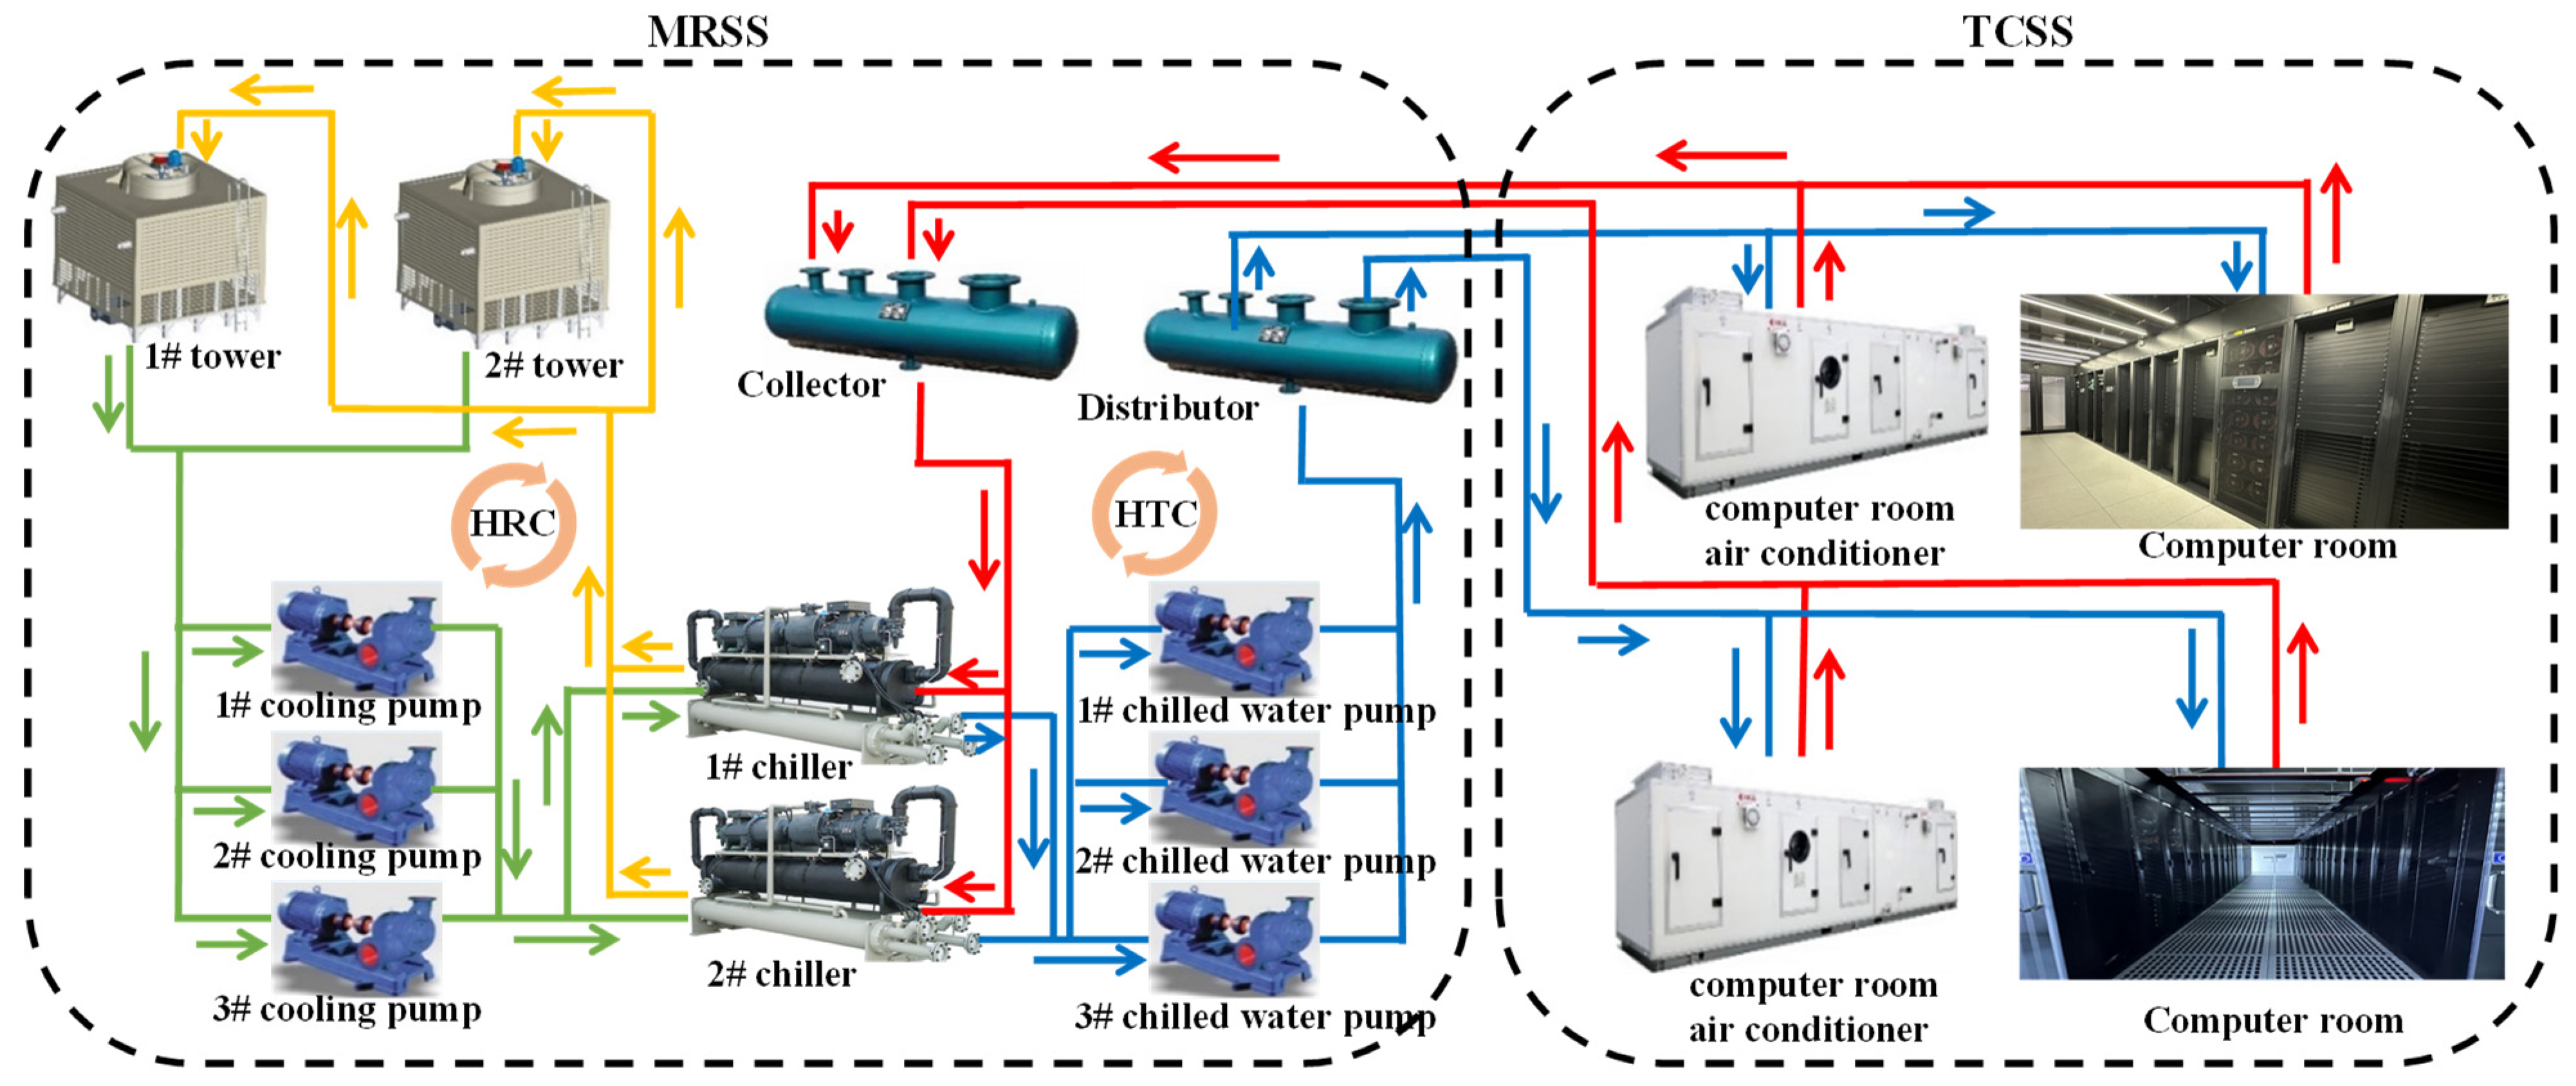
4.1. Mechanical Refrigeration Technology

The heat absorbed by the TCSS from the computer room environment is transferred to the outdoor environment via the dual refrigeration cycles [33] (DRCs) inside the MRSS, as shown in Figure 2. The DRCs consist of a heat transfer cycle (HTC) and a heat rejection cycle (HRC), with the chiller acting as the connector.
In the HTC, the water is cooled by the refrigerating medium via a vapor–liquid phased transition at the compressor of the chiller. The chilled water is continuously pumped into the terminal equipment, i.e., computer air conditioning (CRAC) and computer room air handling (CRAH), in the computer room. Then, the chilled water is warmed by the hot airflow through the cooling coils of the interminal equipment. Meanwhile, airflow, which is cooled by chilled water, returns to the computer room driven by fans. Lastly, the chilled water is warmed, flows out of the terminal equipment and returns to the chiller. In the HRC, the cooling water is warmed by the refrigerating medium via a vapor–liquid phased transition at the condenser of the chiller, which is pumped into the cooling tower. Then, the heat contained in the cooling water is dissipated to the outdoor environment by the cooling towers.
In the refrigeration cycles, the dynamic parameters, e.g., supply water temperatures of chillers, water flow rate and indoor temperature, can affect the system efficiency parameters, such as coefficient of performance (COP), energy efficiency ratio (EER), etc., thus resulting a high energy consumption [34].

4.2. Terminal of Air Cooling Technology

The terminal of air cooling technology [35] can be classified into three branches, i.e., room-level air cooling technology, row-level air cooling technology, and rack-level air cooling technology, according to the IT equipment heat densities in a computer room.

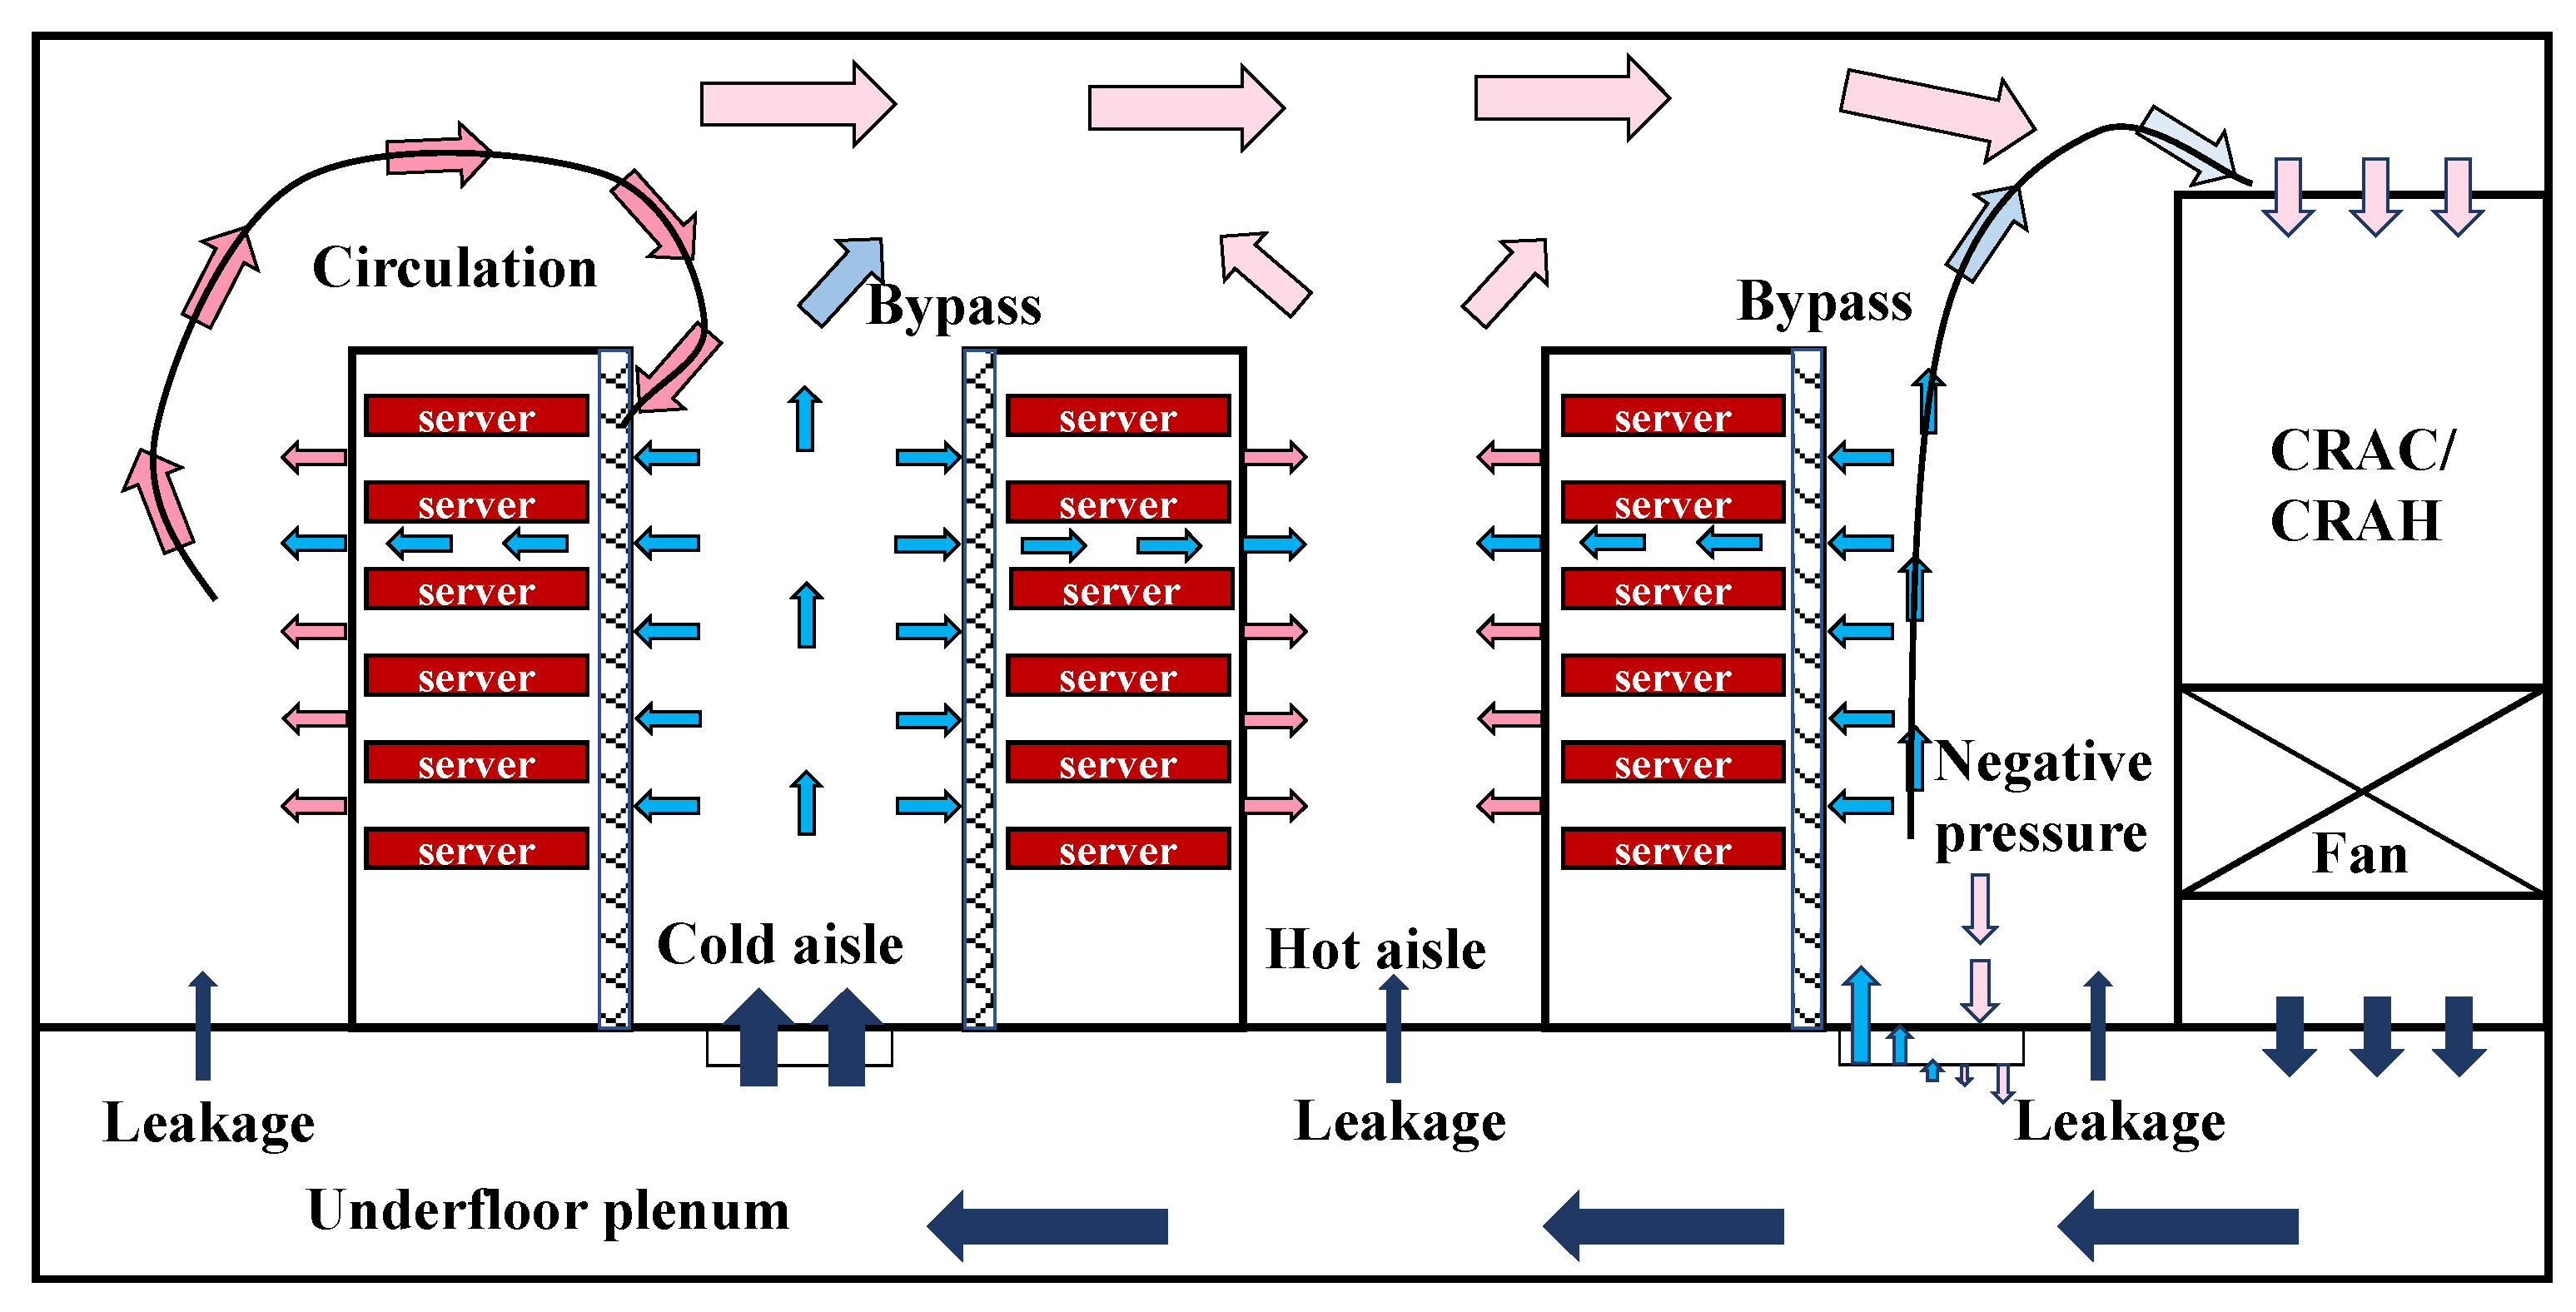
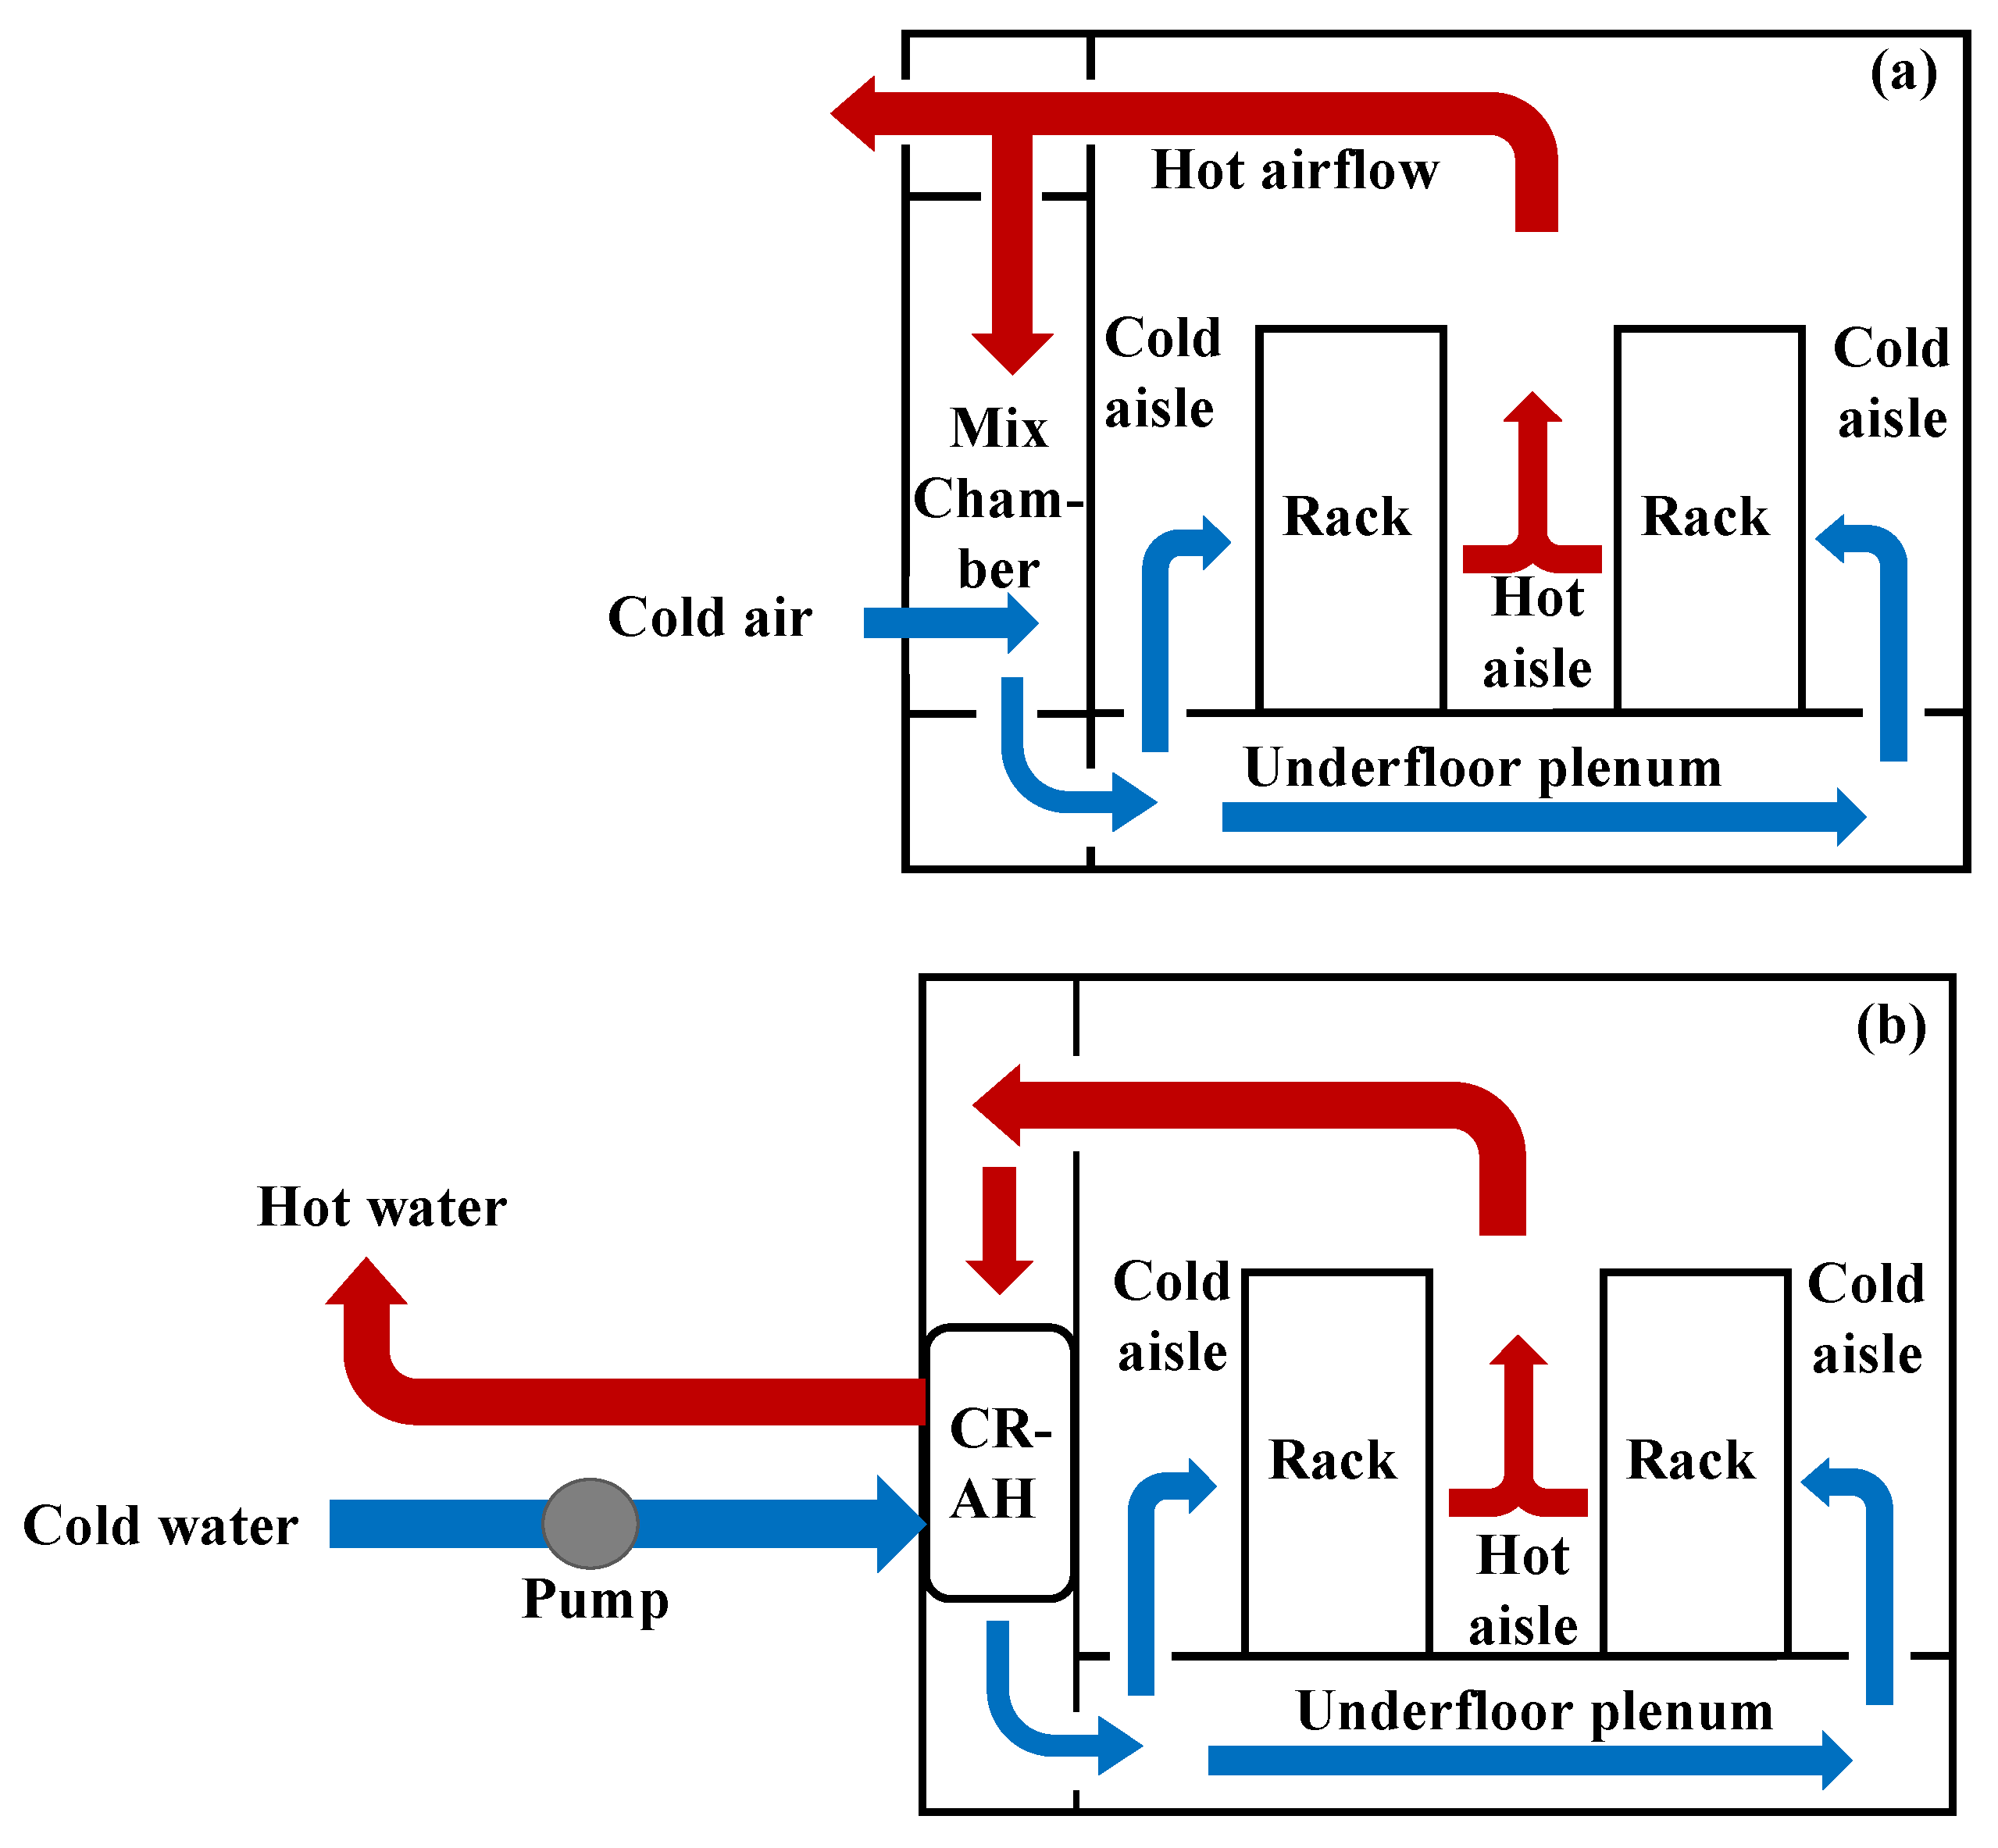
4.2.1. Room-Level Air Cooling

The room-level air cooling realizes the heat exchange of the computer room and outdoor environment, which is through CRAH, CRAC and the distribution system. Actually, room-level air cooling has the advantages of practical design, strong installation adaptability, simple operation, etc. Figure 6 shows a typical room-level air cooling with a Raised Floor Air Supply system (RFAS) [36]. The racks are placed in an orderly manner, “face-to-face, back-to-back” to form a cold and hot aisle. In theory, the cold air flows from the CRAC to the floor underfloor plenum. Then, it spreads to the cold aisle through the air outlet to cool the servers. Lastly, the hot airflow heated by the servers is discharged from the back of racks to the hot aisle, where it returns to the CRAC under the differential air pressure, completing the heat exchange cycle.
However, certain factors such as rack layout, CRAC location and IT load distribution can have a significant impact on airflow during heat exchange, leading to the formation of “cold bypass” [37] (i.e., the cold airflow bypass the server and return directly to the CRAC/CRAH, reducing cooling efficiency) and “hot circulation” [38] (i.e., the heated airflow from the server returns to the rack’s inlet, potentially causing server overheating). To prevent these issues, IDC maintenance personnel often resort to measures such as increasing the power of cooling equipment and lowering the cooling temperature to ensure the safe and stable operation of the computer room. However, these measures result in a nearly 40% increase in IDC [39] cooling cost.
The containment for the cold aisle and hot aisle can effectively prevent the formation of “cold bypass” and “recirculation” in the computer room [40]. As shown in Figure 7, by using special materials like fireproof glass to close the cold aisle, heat exchange efficiency can be improved [41], reducing cooling bypass by up to 94% and saving 63% [42] of electricity for cooling. Additionally, research has shown that [43] aisle containment can help reduce the inlet temperature of the rack and prevent the formation of local hot spots. For instance, a campus IDC implemented hot aisle containment, resulting in improved [44] heat exchange efficiency and reducing electricity consumption by 820 MWh, saving over 100,000 dollars cost annually. In addition, other methods [16], such as using panels to close empty slots in servers within the rack, can further reduce the rate of cold bypass by 2% to 3.2% [45]. Moreover, there are additional measures that can be taken to improve cooling efficiency, such as using improved floor perforated brick [46], optimizing rack layout [47], adjusting the depth of underfloor plenum [48], implementing airflow management techniques [3] and utilizing intelligent control systems [49].
However, the airflow distribution in room-level air cooling systems can be challenging due to various constraints [47], such as ceiling height, room shape, obstacle, rack layout and the location of CRAH/CRAC. These constraints limit the practical application of room-level cooling in IDC. Furthermore, room-level air cooling systems often suffer from a poor thermal environment and low energy efficiency, making them unsuitable for IDCs with high-power density. The inefficiency of room-level cooling can lead to increased energy consumption and cooling costs, which are undesirable for green IDC initiatives.

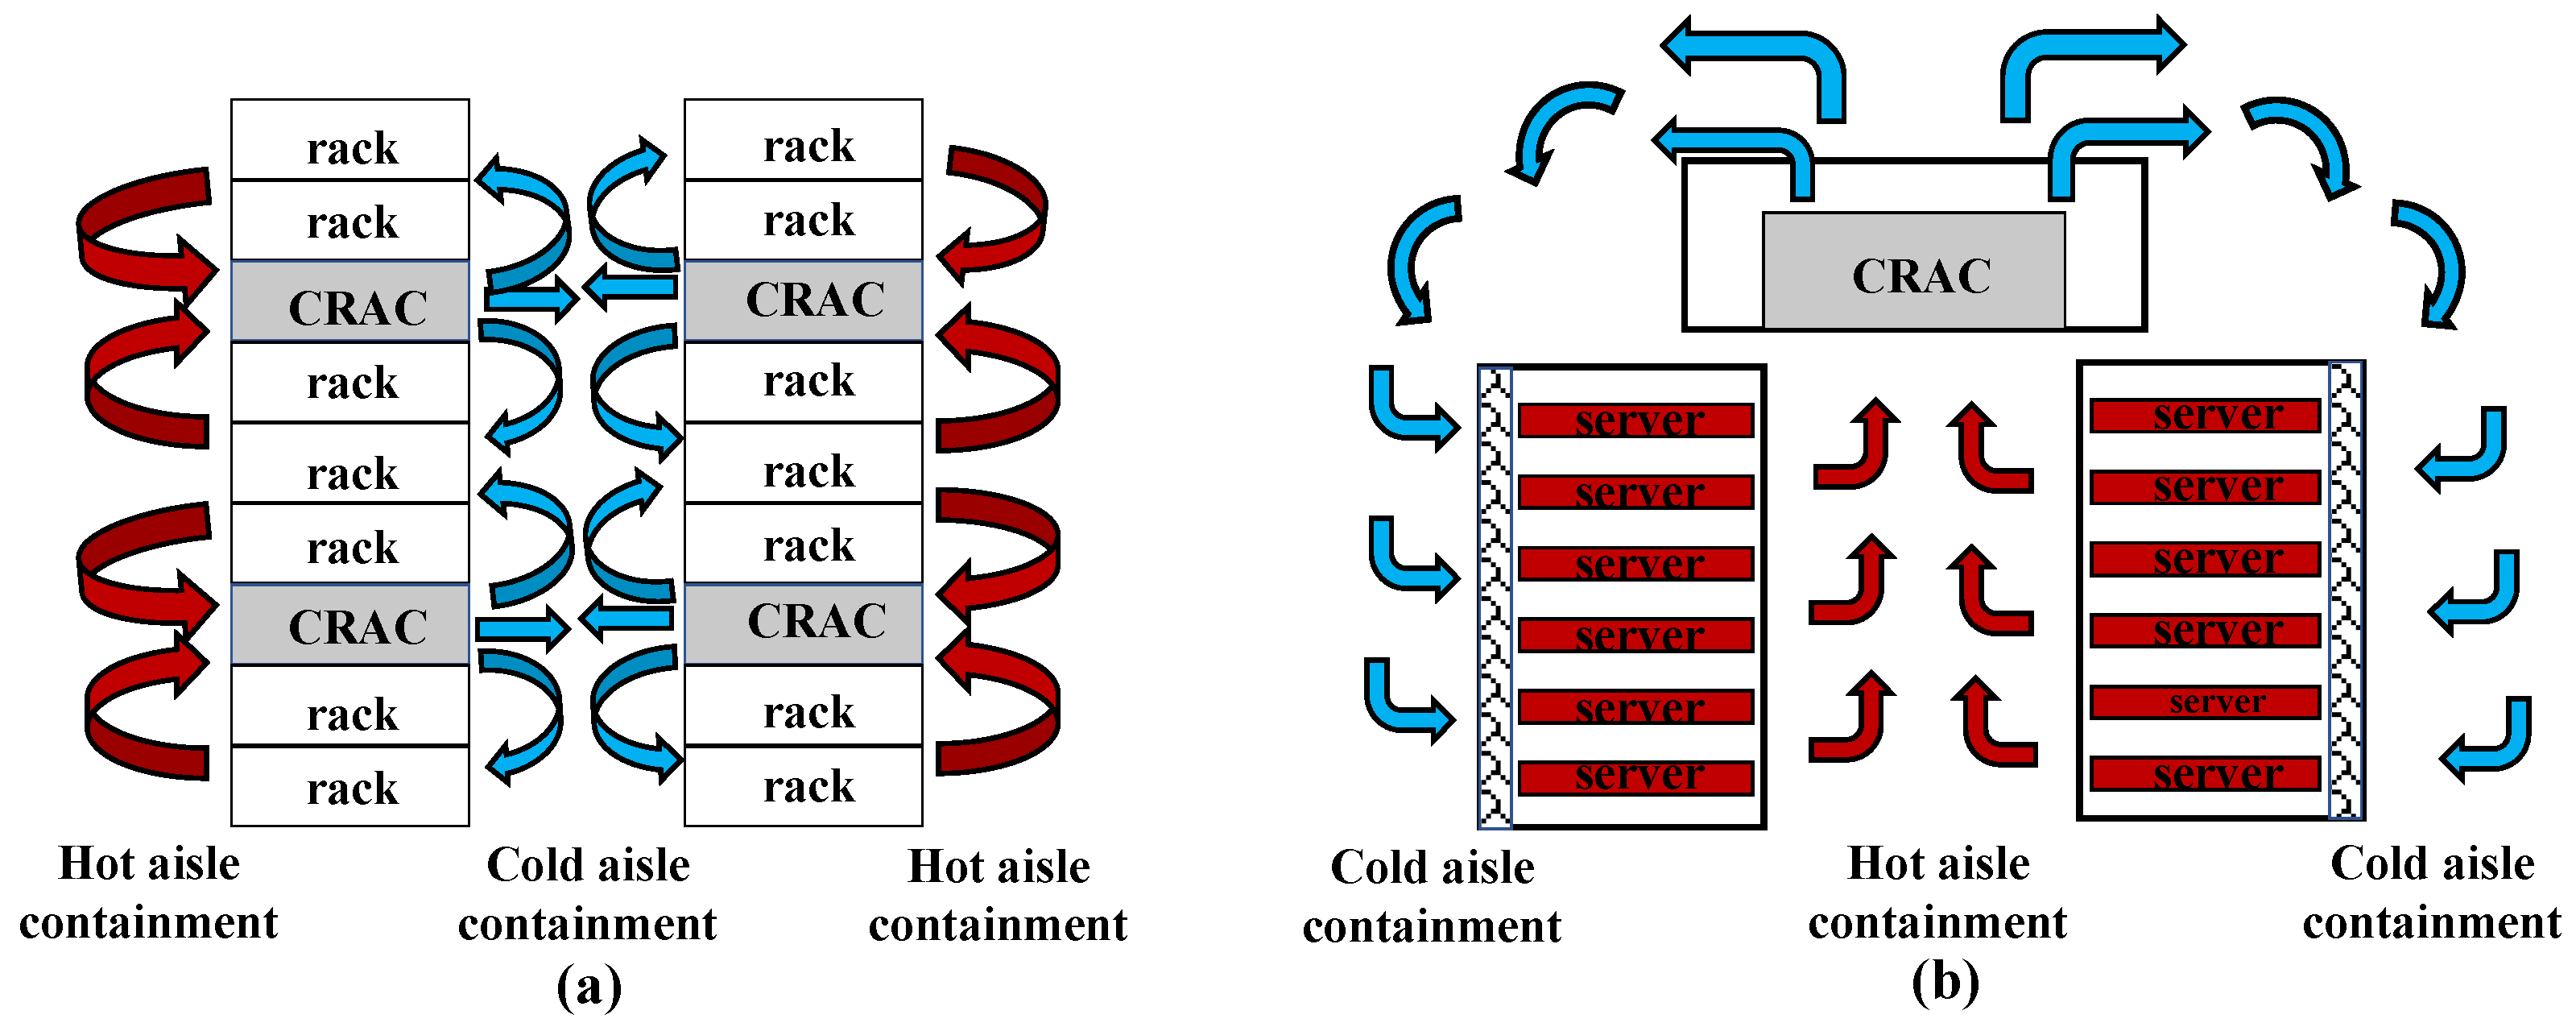
4.2.2. Row-Level Air Cooling

Row-level air cooling has higher cooling efficiency than room-level cooling [50]. The former is more applicable to IDCs with a server heat density higher than 3 kW [31]. As shown in Figure 8, the CRAC is usually dedicated to a rack row. Compared with room-level air cooling, row-level air cooling not only has a shorter airflow path but also has a cooling efficiency. For example, [51] SHI and RHI of the row-level air cooling can be improved by 37.1% and 20%, respectively. Meanwhile, RTI and β can be improved by 73.2% and 44.3%, respectively. Additionally, the cooling system with row-level can reduce electricity consumption by more than 110,000 kWh per year [31], compared with room-level cooling. Nevertheless, it is easy to cause vortex airflow, resulting in uneven air supply temperature and thermal stratification. Moreover, the interaction among different CRAC modules also has a certain impact on cooling. Above all, for row-level air cooling applications, the formation mechanism of thermal environment cooling must be further studied [52].

4.2.3. Rack-Level Air Cooling

Rack-level air cooling applies to large IDCs with heat density higher than 50 kW [53]. As shown in Figure 9, the cooling unit is directly installed inside the rack. Namely, the airflow heated by the server does not discharge from the back of the rack but rather returns to the cooling unit directly to complete the heat exchange. The airflow path of rack-level air cooling is shorter, the airflow specialization is more accurate, and the cooling capacity utilization is higher [54]. For example, Ma et al. find that the energy efficiency ratio of the system with rack-level air cooling reaches 29.7 [55]. Jin et al. compared the thermal and energy performance of room-level cooling and row-level cooling to find that SHI improved from 0.79 to 0.31, which saved an annual energy of 16.9% [31]. Moreover, a lot of computer room space can be saved because rack-level cooling does not take up additional space. However, cooling equipment at the rack-level needs to be specially customized, which results in the equipment installation being greatly difficult and high cost for maintenance personnel. For example, failure of the cooling unit can easily lead to server overheating and downtime if that is not dealt with on time. Therefore, rack-level air cooling technology should be jointly applied with other cooling technologies to eliminate local hot spots [3].
Although the terminal of air cooling has improved in multi-level from the rack to the room level, airflow mixing problems, e.g., air leakage, cold bypass, and hot circulation, are still common. It not only easily forms hot spots to threaten the safe operation of IDC but also makes the inefficiency cooling system. At present, most IDCs in China still use traditional cooling technologies. The annual average PUE value is not less than 1.7, which causes a huge energy waste. The traditional cooling technology has been unable to meet the needs of cooling and green development for IDC. In addition, with the development of cloud computing and big data technology, the performance of IT equipment has gradually improved. And the power density of a single rack has continued to increase. Therefore, it is imperative to develop new green and efficient IDC cooling technologies.

5. New Cooling Technologies
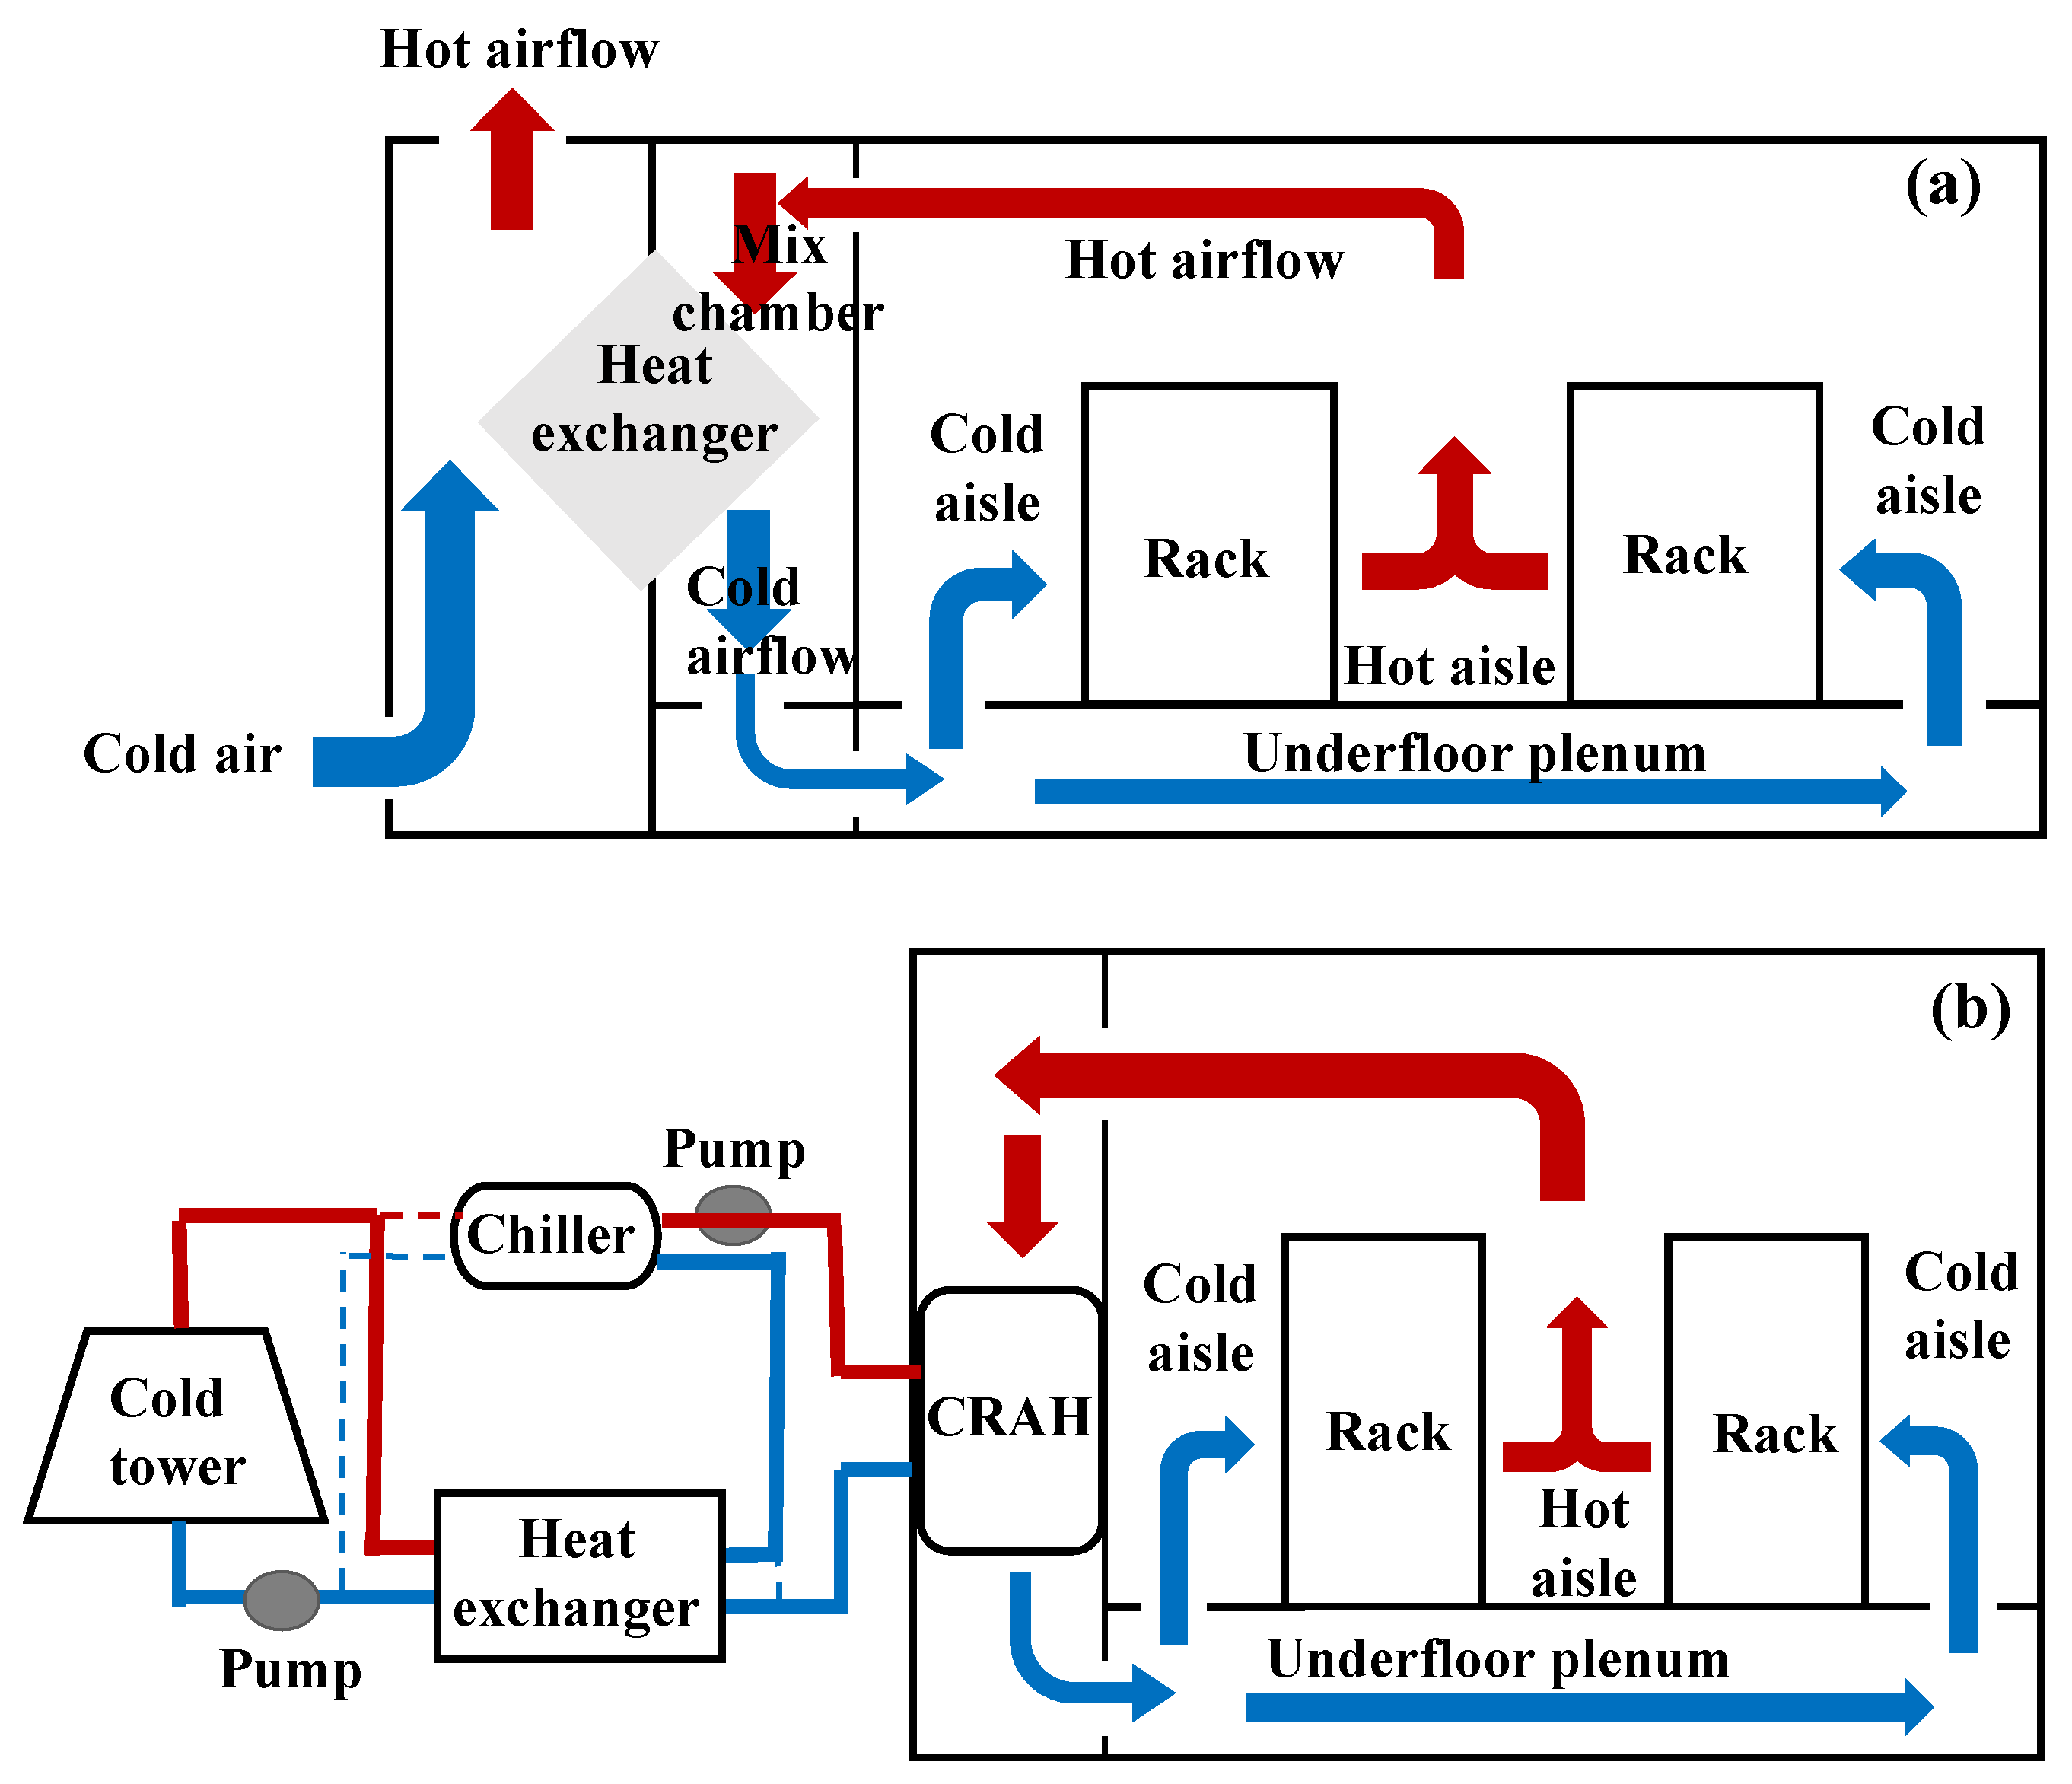
With the development of new energy-conservation cooling technology, the value of PUE for advanced IDC can reach below 1.1. For example, Qiandao Lake Data Center in China [56] uses a new cooling technology to reduce the energy consumption of IDC, achieving the goal with an annual average PUE that can be as low as 1.09. Compared with ordinary IDC, Qiandao Lake Data Center can save 80% of energy by reducing 30,000,000 kWh of electricity consumption annually. And it lowers carbon emissions by nearly 10,000 tons annually. Moreover, BaiduCloud Computing (Yangquan) Center has developed a new cooling unit to obtain an annual average PUE value of 1.08.

5.1. Free Cooling

Free cooling technology, also known as an economizer cycle, is a significant method for saving energy in IDC. It involves utilizing the natural climate to cool the IDC instead of relying solely on a mechanical refrigeration system. This is achieved by outside air or water as a cooling medium or the direct cold source when the outdoor temperature is sufficiently lower than that of the IDC [57]. By leveraging free cooling, the need for continuous operation of energy-intensive equipment like chillers, pumps and cooling towers can be reduced. This results in a decrease in energy consumption and cost, typically by around 20% [58]. There are two main types of free cooling technology, i.e., direct free cooling and indirect free cooling [20]. That is discussed in detail below.

5.1.1. Direct Free Cooling

Direct free cooling is a method that utilizes outdoor low-temperature resources to exchange heat directly with the computer room environment. Since there is no auxiliary cooling system, i.e., chiller and tower, the way of direct free cooling consumes extremely low energy [59]. Direct free cooling can be further divided into two types, i.e., direct airside free cooling and direct waterside free cooling, as shown in Figure 10.
(1)
Direct airside free cooling
Figure 10a shows the principle of direct airside cooling, which utilizes the available outside cool air for cooling IDC space. Sensors are utilized for monitoring the inside and outside air temperature and conditions. When the outside air temperature is within the desired set points, the equipment, such as airside economizers, draws the outside air directly inside a computer room. The direct airside economizer is composed of variable dampers, controllers and fans, which can partly or entirely replace the compressor refrigeration. Then, the low-temperature fresh air is heated by the server to form high-temperature airflow. The high-temperature airflow flows into the mixing room, which is mixed with the newly low-temperature fresh air in a certain proportion [60]. Lastly, the mixing air reenters the computer room after reaching the requirement for temperature and humidity of the air supply.
Direct airside free cooling has an extensive potential for application. Compared with traditional cooling technology, direct airside cooling can improve the energy efficiency [59,61] of IDC by 47.5–67.2%. For example, such companies, i.e., Intel [62], Microsoft [63], and Google [63], save more than 30,000,000 dollars in electricity bills per year by using direct air cooling for IDC cooling. Moreover, most cities in Australia [11] can apply outdoor dry air to cool IDC, and that exceeds 5500 h per year to apply direct air cooling technology. In Europe, 99% of locations can use the A2 allowable range and take advantage of airside free cooling all year. And 75% of North American IDCs can operate airside free cooling for up to 8500 h per year [64]. Nonetheless, direct air cooling technology is not suitable for areas with low dew point temperatures [65] due to incurring substantial humidification costs. Moreover, the cooling method of direct air cooling cannot control the temperature and humidity accurately. Furthermore, it is difficult to avoid air dust and harmful gases harming IT equipment [66], which causes the main concern of IDC operators in using direct airside cooling technology to increase the risk of equipment failure. Many studies indicate that the effect of contamination is not the same in all locations. In China [67], direct airside free cooling can be annually utilized in Shanghai, Kunming and Guangzhou for 3949, 6082 and 4089 h, respectively. But, it is not suitable for IDC in Harbin and Beijing, owing to the high falling dust. Therefore, the application of this method depends on the environmental conditions.
(2)
Direct waterside free cooling
Direct waterside free cooling is a more efficient direct free cooling technology with less pollution risk than direct air cooling. In the direct waterside free cooling system, the cold water is used directly to cool the computer room without any heat exchanger. The heat transfer coefficient is higher than direct air cooling. As shown in Figure 10b, this system directly uses outdoor low-temperature water, such as lake water, seawater, etc., for heat exchange with the computer room environment to save significant power. Indeed, the kinetic energy of water motion is captured for powering the cooling pumps. For example, an IDC located near an ocean is equipped with direct waterside free cooling to save large amounts of energy [68]. Moreover, direct waterside cooling technology is applied to Qiandao Lake Data Center in China [69] to achieve an energy-saving rate of 80%.
Thanks to the large thermal mass of water, a direct waterside cooling system can maintain near-average ambient temperatures for up to 24 h. However, its application is restricted due to its reliance on natural cold water. Furthermore, it should take into account the weather, which can cause damage to the IDC.

5.1.2. Indirect Free Cooling

Due to the potential disruption of the internal environmental conditions of the computer room, indirect free cooling [32] is often used as an alternative to direct free cooling. Generally, indirect free cooling incorporates additional equipment, i.e., a heat exchanger, to facilitate heat transfer and separation of the heat transferring medium. This ensures that the cleanliness requirements of the computer room [1] are maintained so indirect air economizers do not disturb the internal environment of IDC. Indirect free cooling can also be further divided into two types, i.e., indirect airside free cooling and indirect waterside free cooling, as shown in Figure 11.
(1)
Indirect airside free cooling
In Figure 11a, indirect airside free cooling utilizes a heat exchanger to transfer heat from the computer room to the outdoor environment. The heat exchanger acts as a barrier, preventing any contamination or disturbance to the internal environment of IDC. In detail, the outdoor fresh air with low-temperature flows through one side of the heat exchanger; meanwhile, the indoor return airflow with high temperature flows through the opposite side of the heat exchanger. This indirect airside cooling can be utilized in a variety of configurations, each of which can perform a different function depending on local weather conditions.
The indirect free air cooling [70] is applied to replace air conditioning cooling for 5014 h to save energy consumption by 29%. Furthermore, the Kyoto wheel system uses free cooling when available and reverts to conventional cooling as necessary, which results in approximately 8–10 annualized coefficients of performance (COP), higher than that of conventional cooling with a 3.5 value [20]. Moreover, an indirect free cooling system [70] could cool the communication base station instead of air conditioning for about 5014 h per year, which saves 29% of electricity consumption.
However, a large number of impurities will accumulate over time at the heat exchanger, reducing the heat exchange efficiency and increasing the maintenance frequency. Furthermore, the surface area of the exchanger is required to maintain an acceptable pressure drop and heat transfer, so the system has a large footprint. Overall, the application of indirect airside cooling systems is limited, but they can be considered on a situational basis.
(2)
Indirect waterside free cooling
Similarly, indirect waterside free cooling also employs a heat exchanger but uses water as the heat transferring medium. Figure 11b expresses the diagram of indirect free water cooling. There are two water loops, i.e., a cooling (external) water loop and a chilled (internal) water loop. The heat exchanger and the chiller are installed in parallel [71]. Actually, it is possible to adapt the CRAH with a plate heat exchanger so that the chiller bypass can be installed in the external cooling loop, i.e., when the external temperature is lower than the limit value of the cooling temperature, only the cooling tower is used to cool the circulating water. Oppositely, the chiller is turned on to achieve combined free cooling and mechanical cooling. Clearly, the CRAH unit can be replaced by different cooling units located on the computer room floor with the same internal and external cooling loops. Such a system is used extensively in large-scale IDCs, which achieves significant energy savings. For example, the indirect cooling tower was used to cool IDCs in a hot summer and warm winter area [72], and it was found that the annual comprehensive COP value of the IDC increased by 23.7%, and the energy utilization efficiency increased by about 19.2%. In addition, some studies find that waterside free cooling is the most popular cooling method in IDC, while it is more cost effective than airside free cooling.
In the last decades, a cooling system combined with a cooling water source and a plurality of on-floor cooling units has been proposed, which can be switched between free cooling and mechanical cooling [73]. Based on this system, an improved system by placing the air handling units with modular cooling plants was developed [74], which is more energy efficient. Furthermore, indirect waterside free cooling can easily be combined with absorption refrigeration, which can make use of solar energy and waste heat from IDC [75]. At present, absorption solar cooling has been used in free cooling technology [76]. With the improvement of absorption solar cooling performance in recent years, the system is easier to realize and provides a minimized use of chiller to save energy consumption. In short, Increasing the load rate of free cooling can greatly reduce the energy consumption of IDC [33]. In the future, the combination of free cooling and absorption solar refrigeration has a good application potential and more attention.

5.2. Liquid Cooling

With the advent of high-performance microprocessors in servers, these microprocessors will generate more than 100 W/cm2, while the maximum heat dissipation capacity of air cooling is about 37 W/cm2. The air cooling method does not meet the cooling needs of IDC. Thus, it is necessary to find other cooling methods for high-performance IT equipment. Liquid cooling technology is a new type of IDC cooling technology developed in recent years [77]. The liquid medium, as the heat transfer medium contacts with the server, shortens the airflow path to improve energy efficiency. Generally, liquid cooling is mainly divided into four categories, i.e., cold plate cooling, heat pipe cooling, immersion cooling, and spray cooling. The efficient refrigeration of liquid cooling can meet the heat dissipation requirements of a high-power density rack. Meanwhile, it has advantages [78,79] of high space utilization, noise reduction, and great performance of waste heat recovery, etc. Moreover, liquid cooling technology is one of the development trends of future IDC cooling.

5.2.1. Cold Plate Cooling

Cold plate cooling technology is a typical indirect liquid cooling technology [80], which is a heat dissipation process without direct contact between the heat source and the liquid coolant. Compared with traditional cooling, it can save more than 40% of cooling energy consumption [81]. The cooling mechanism of the cold plate is illustrated in Figure 12. The coolant flows into the rack through the closed heat pipe, taking away the heat from the IT element, e.g., CPU, memory, hard disk, and other components. Then, the coolant flows into the heat exchange unit to exchange the heat with primary side cooling water. Finally, the heat is transferred to the outdoors through heat exchange between cooling water and outdoor fresh air [82].
Owing to the superior thermophysical properties and high boiling point of water, water is the most practical coolant among the available refrigerants and dielectric fluids. However, there is low priority and demand for water in liquid cooling because of the risk of fluid leakage [83]. Thus, it is essential to have an appropriate refrigerant. Based on the phase change in the refrigerant, the cooling of a cold plate can be divided into single-phase cold plate cooling [32] and two-phase cold plate cooling [84]. In fact, single-phase cold plate cooling is a circulating coolant sensible heat process without phase change occurring. There are various parameters on which the performance and thermos-flow behavior of a single-phase liquid cooling depend [85,86,87], e.g., the heat sink pressure drops, required pumping power, inlet and outlet temperature, heat transfer coefficient and rate, the coolant volumetric flow rate.
Two-phase cold plate cooling is a latent heat process of the circulating coolant with phase change occurring. In this cooling method, dielectric fluids with low boiling temperatures can be used as suitable coolants. Compared with single-phase cold plate cooling, two-phase cold plate cooling technology has a faster heat transfer rate. The temperature gradient between the coolant and hot surface is smaller to have better heat transfer performance. Nevertheless, there are some unstable behaviors, i.e., flow reversal [88], pressure fluctuation [89], and temperature fluctuations [90], in the two-phase flow process of coolant, which easily cause vibration, thermal fatigue, and even burning of the hot surface [91]. Thus, two-phase cold plate cooling technology has hardly been developed in the IDC industry [92].
A company employs cold plate technology to cool the server so that the CPU temperature of the server with full load operation is not higher than 60 °C. That not only reduces the temperature rise by about 30 °C compared with the traditional cooling technology but also drops the PUE value below 1.2. Moreover, in 2019, Huawei used cold plate cooling to solve the heat dissipation problem of high-power density servers in IDC. A single rack can support a maximum heat dissipation capacity of 65 kW, and the PUE value can reach a minimum of 1.05. Undoubtedly, cold plate cooling technology is gradually advancing to the cloud computing IDC at present, under the long-term experience in supercomputing and simulators. However, the deployment and maintenance costs for the cold plate cooling technology application are high. Moreover, owing to the risk of coolant leakage, which can endanger the safe operation of servers [80], the application of cold plate cooling technology in IDC still faces many challenges.

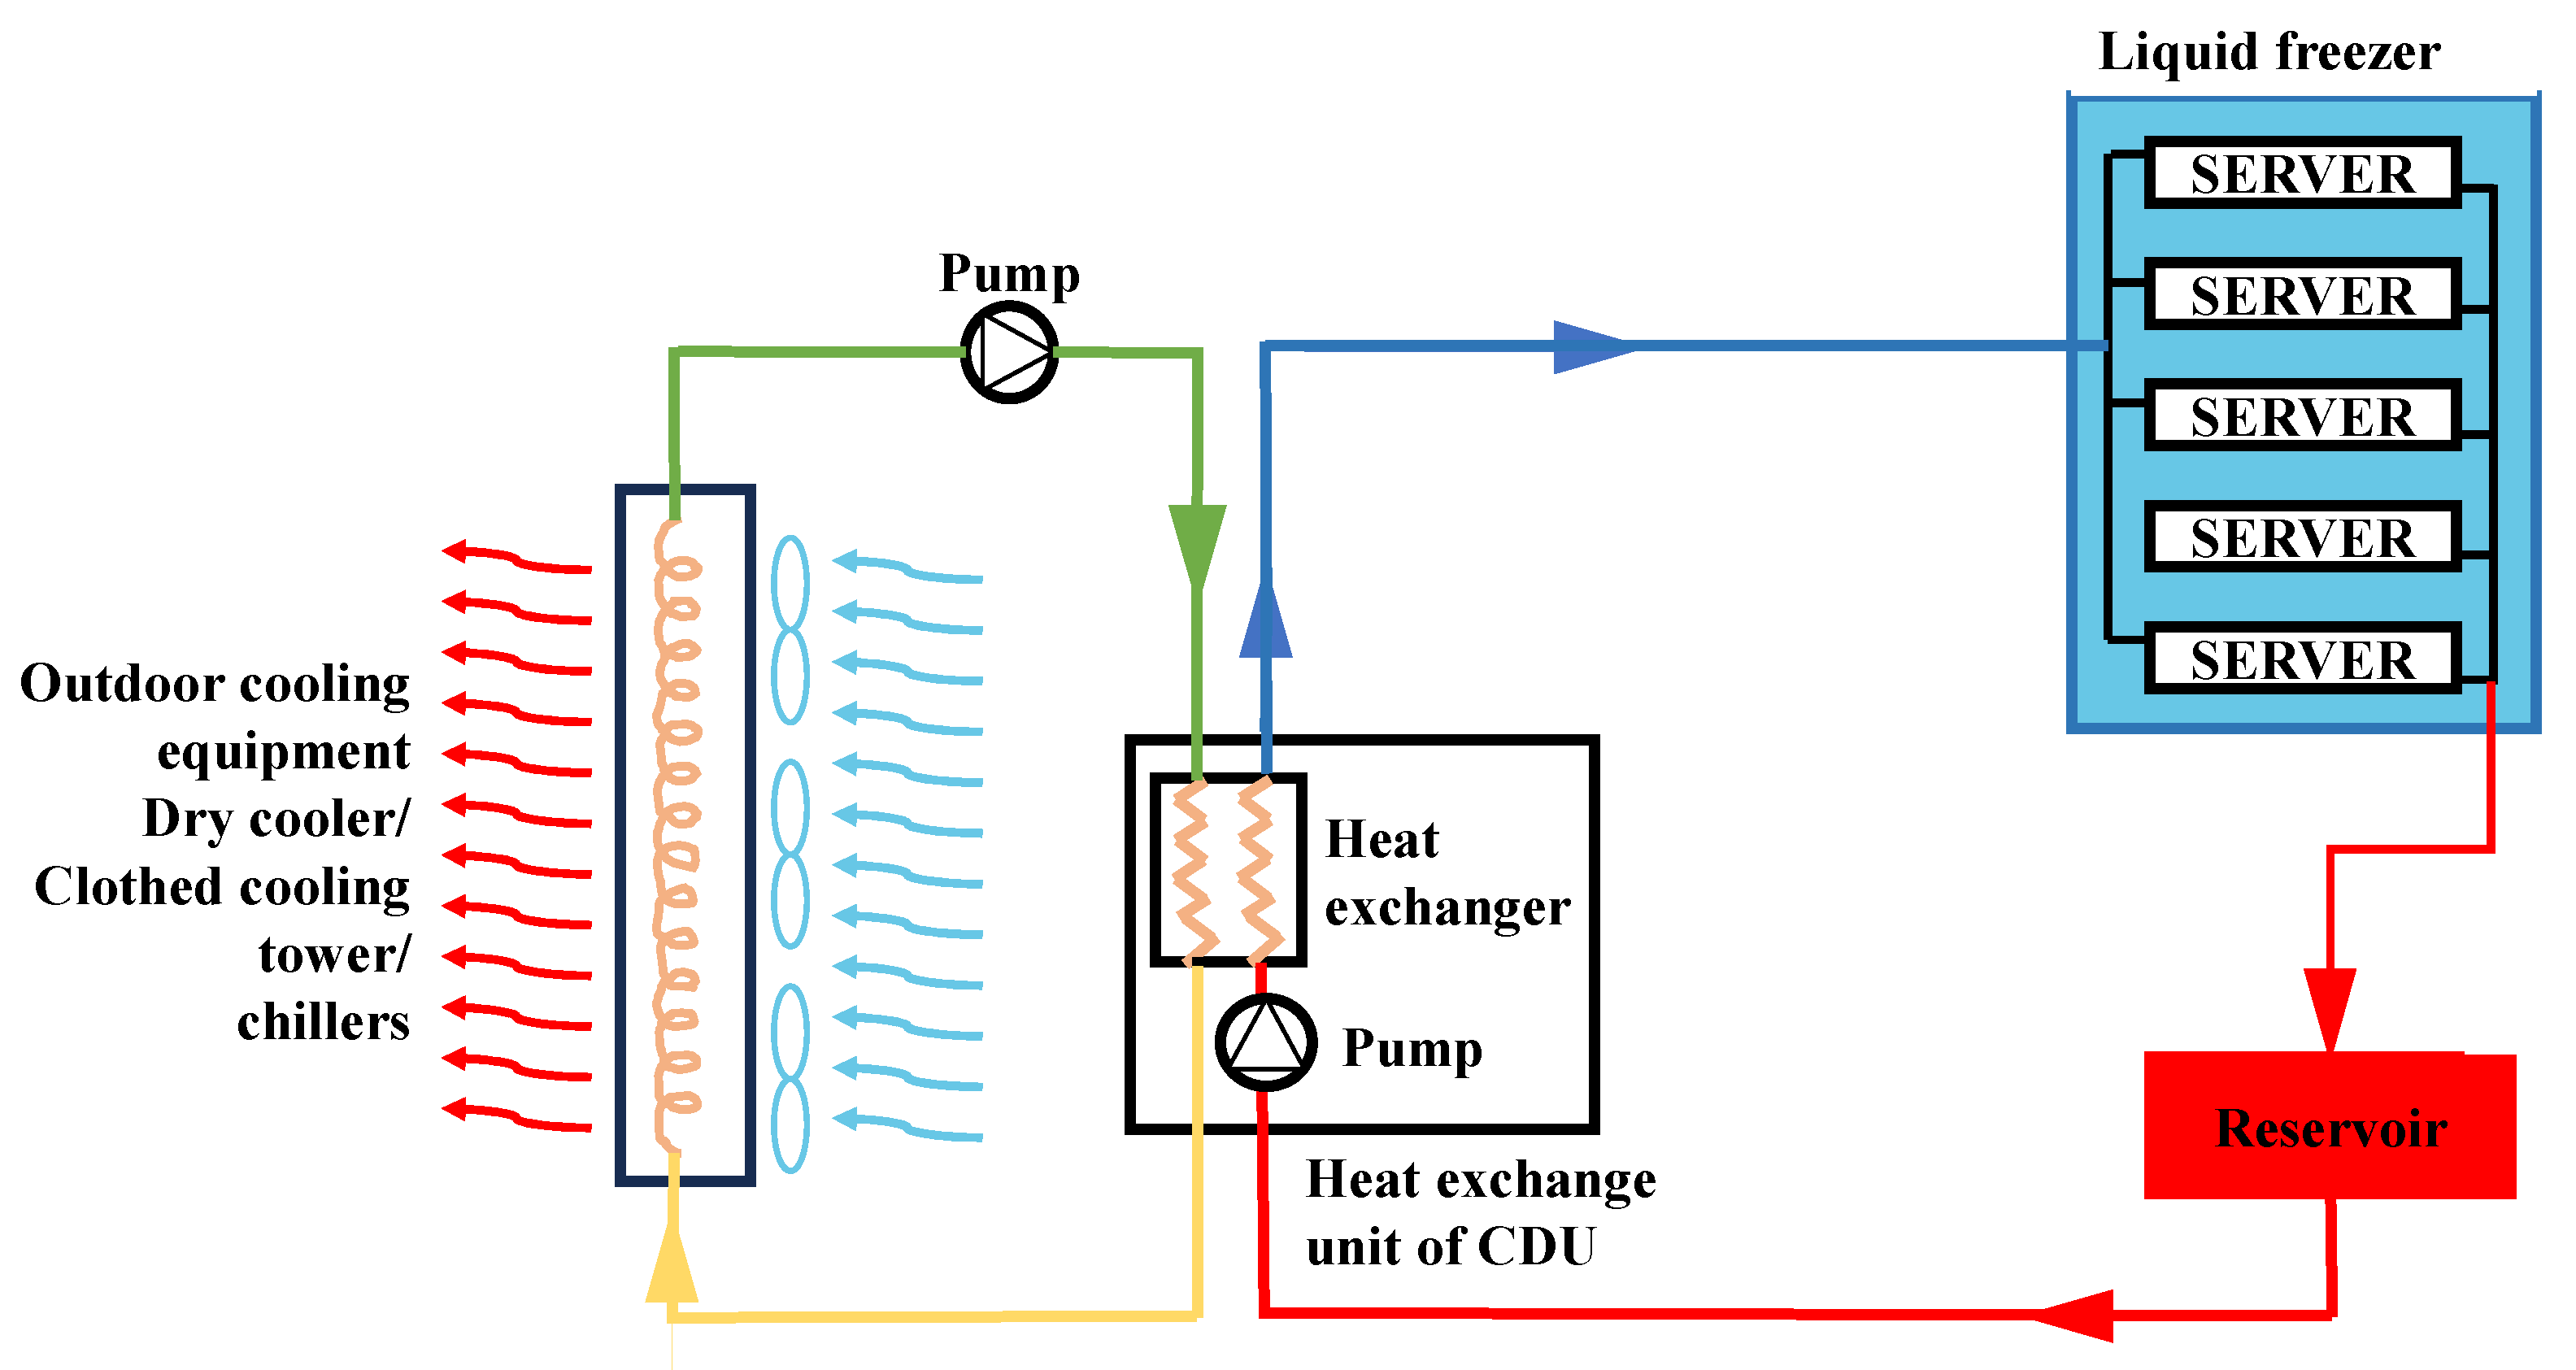
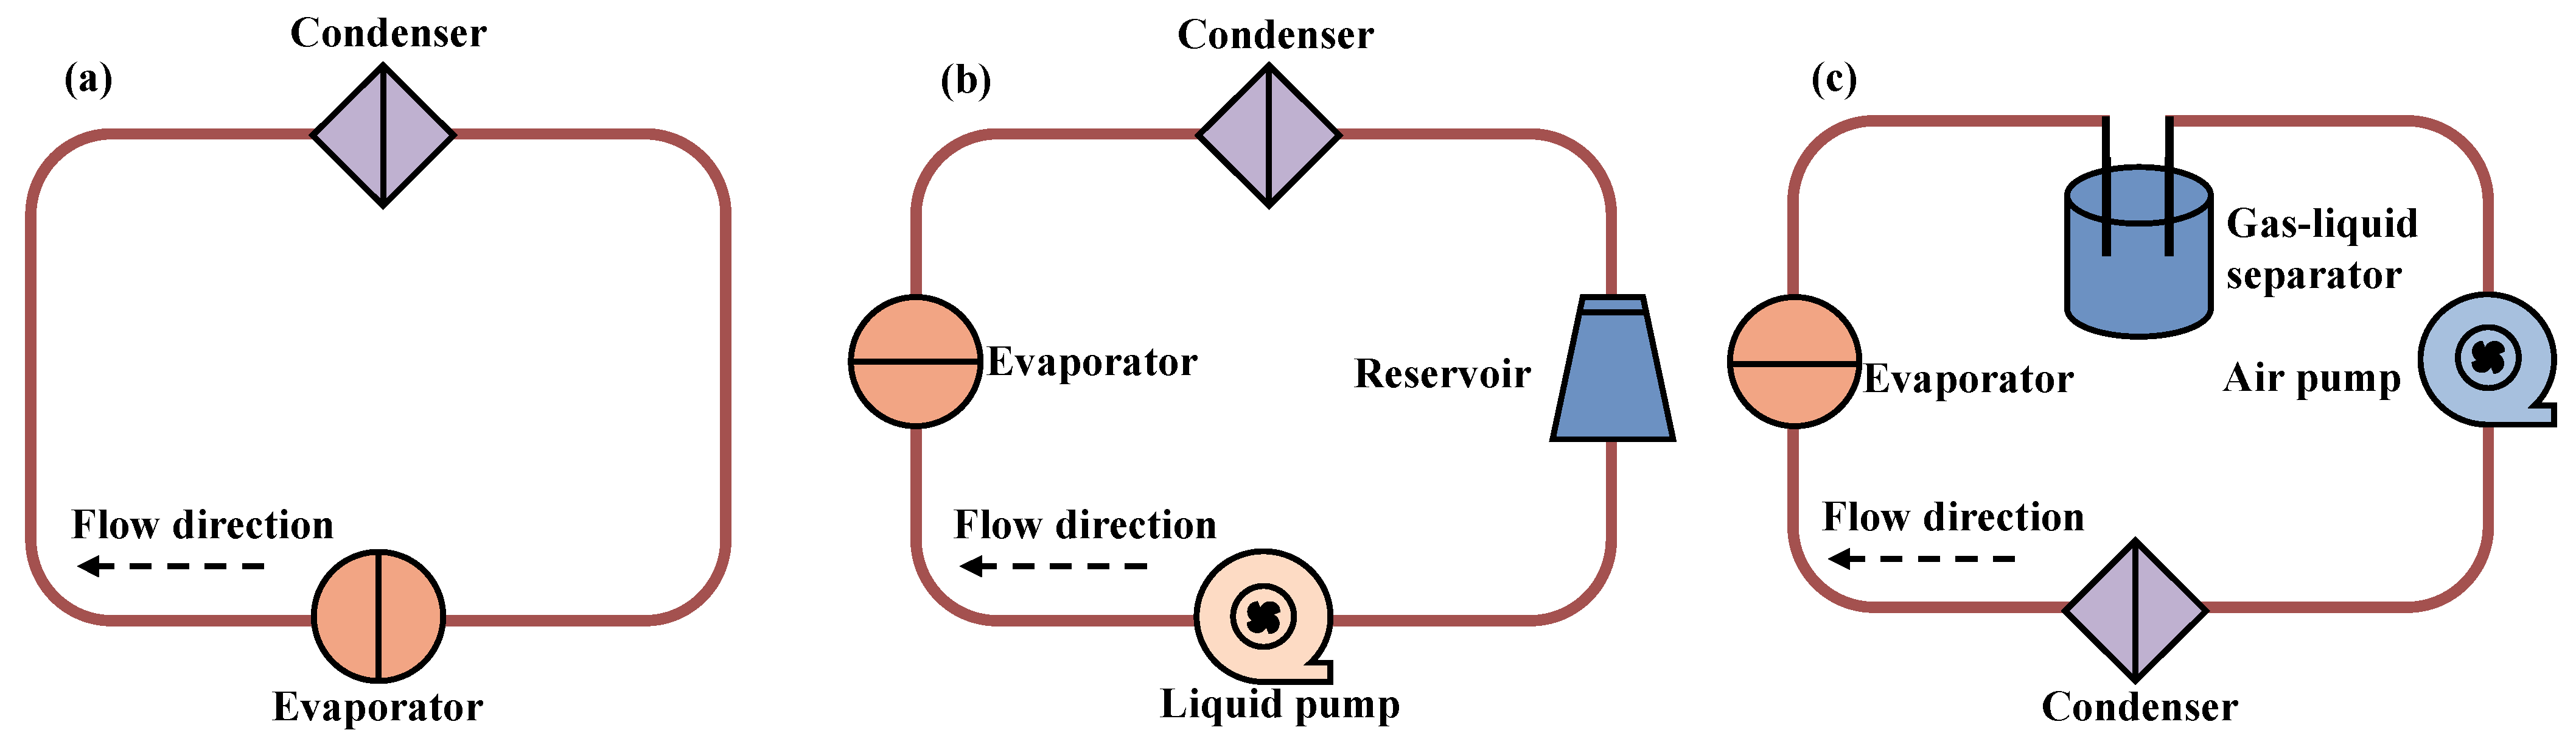
5.2.2. Heat Pipe Cooling

The cooling principle of heat pipe technology is similar to that of cold plate cooling [93]. Clearly, heat transfer of heat pipe cooling is driven by the temperature difference between the heat source and heat sink, which can save nearly 40% of cooling energy [94]. The operating principle [95,96] of heat pipe technology is shown in Figure 13a. First, the refrigerant absorbs heat at the evaporator and turns it into steam. Then, the steam flows into the condenser through the gas pipe and turns back into liquid by the condensation phase change. Finally, the liquid refrigerant flows back to the evaporator, driven by gravity. In practical applications, the refrigerant is often driven by a liquid pump or a gas pump. Figure 13b,c illustrate the schematic of the liquid phase loop heat pipe and gas phase loop heat pipe. In the high heat-density computer room, the heat pipe cooling technology is applied to reduce the temperature of the rack outlet from 30–37 °C to 23–26 °C, which reduces the energy consumption of the cooling system by 18% [42].
The benefit of heat pipe cooling is that the risk of leakage is reduced inside the server. Actually, it is possible for the heat pipe coolant to be water, R141b, Methanol, Ammonia, Acetone, NF or SiO2–H2O, while the condenser coolant to be either air or water [97]. In addition, heat pipe cooling technology can make full use of free cooling sources to achieve efficient heat dissipation [98]. For example, the combination [94] of heat pipe cooling technology and free cooling technology in small IDC has improved the energy efficiency of the cooling system by 25.4%. Furthermore, there is no refrigerant in contact with the chip in heat pipe cooling, so the risk of refrigerant leakage can be effectively reduced to ensure operational reliability [99]. However, the computer room environment could not be cold by heat pipe cooling owing to the limitation of heat pipe construction. Therefore, additional cooling systems [21] need to be added to the cooling computer room in hot seasons, which increases the installation space and maintenance costs of IDC.

5.2.3. Immersion Cooling

Immersion cooling technology immerses the server directly in the coolant. An insulating coolant is the heat transfer medium. Depending on whether the coolant phase changes, immersion cooling technology can be classified into two categories, i.e., single-phase immersion cooling technology [100] and two-phase immersion cooling technology [101], as shown in Figure 14. Figure 14a shows the schematic of single-phase immersion cooling. The coolant directly contacts the servers, and the sensible heat of the coolant temperature rise is used to take away the heat. Then, the heat is transferred to the outdoors through the heat exchanger. Usually, the coolants can be Novec 649, Pf-5060, FC-72 or HFE-7100. Compared with cold plate cooling technology [102], the single-phase immersion cooling technology can enhance the cooling effect by dropping the server temperature by 13 °C while the energy utilization efficiency is higher. Furthermore, open immersion cooling is an adaptable solution as it does not require a server level piping system or fluidic connectors and is hermetically sealed. At present, there are some mature applications of single-phase immersion cooling technology. For example, single-phase immersion cooling technology is applied to heat the server cluster by Renhe IDC of Alibaba Cloud, with a PUE value as low as 1.09.
The method of heat exchange from boiling phase change of coolant is applied to immersion cooling technology. As shown in Figure 14b, the latent heat of evaporation of the coolant is used for heat exchange [104] when the surface temperature of the server exceeds the saturation temperature of the coolant. Then, vapor bubbles rise to the vapor area above the coolant tank, where the refrigerant vapor exchanges heat with the cooling water. At present, the application of surface enhancement techniques to improve the heat transfer rate of pool boiling is the main focus [105]. Some studies find that [103] the thermodynamic performance of two-phase immersion cooling is higher than that of single-phase immersion cooling by 72.2–79.3%, with the condition of server power range of 6.6–15.9 kW. And the maintenance cost is lower [106]. Therefore, two-phase immersion cooling technology can be applied to IT equipment with higher temperature uniformity and heat flow density [107]. Nonetheless, the heat transfer mechanism of two-phase immersion cooling is complex, and the system design is difficult [108]. At present, most of the two-phase immersion cooling technology is still in the stage of machine demonstration and testing [109]. With the development of IDC towards higher power density and larger scale, those aspects, i.e., the selection of coolant, boiling heat transfer optimization, condensing coil design, pressure control scheme, coolant recovery and regeneration of two-phase immersion cooling are the focus for future study [110].

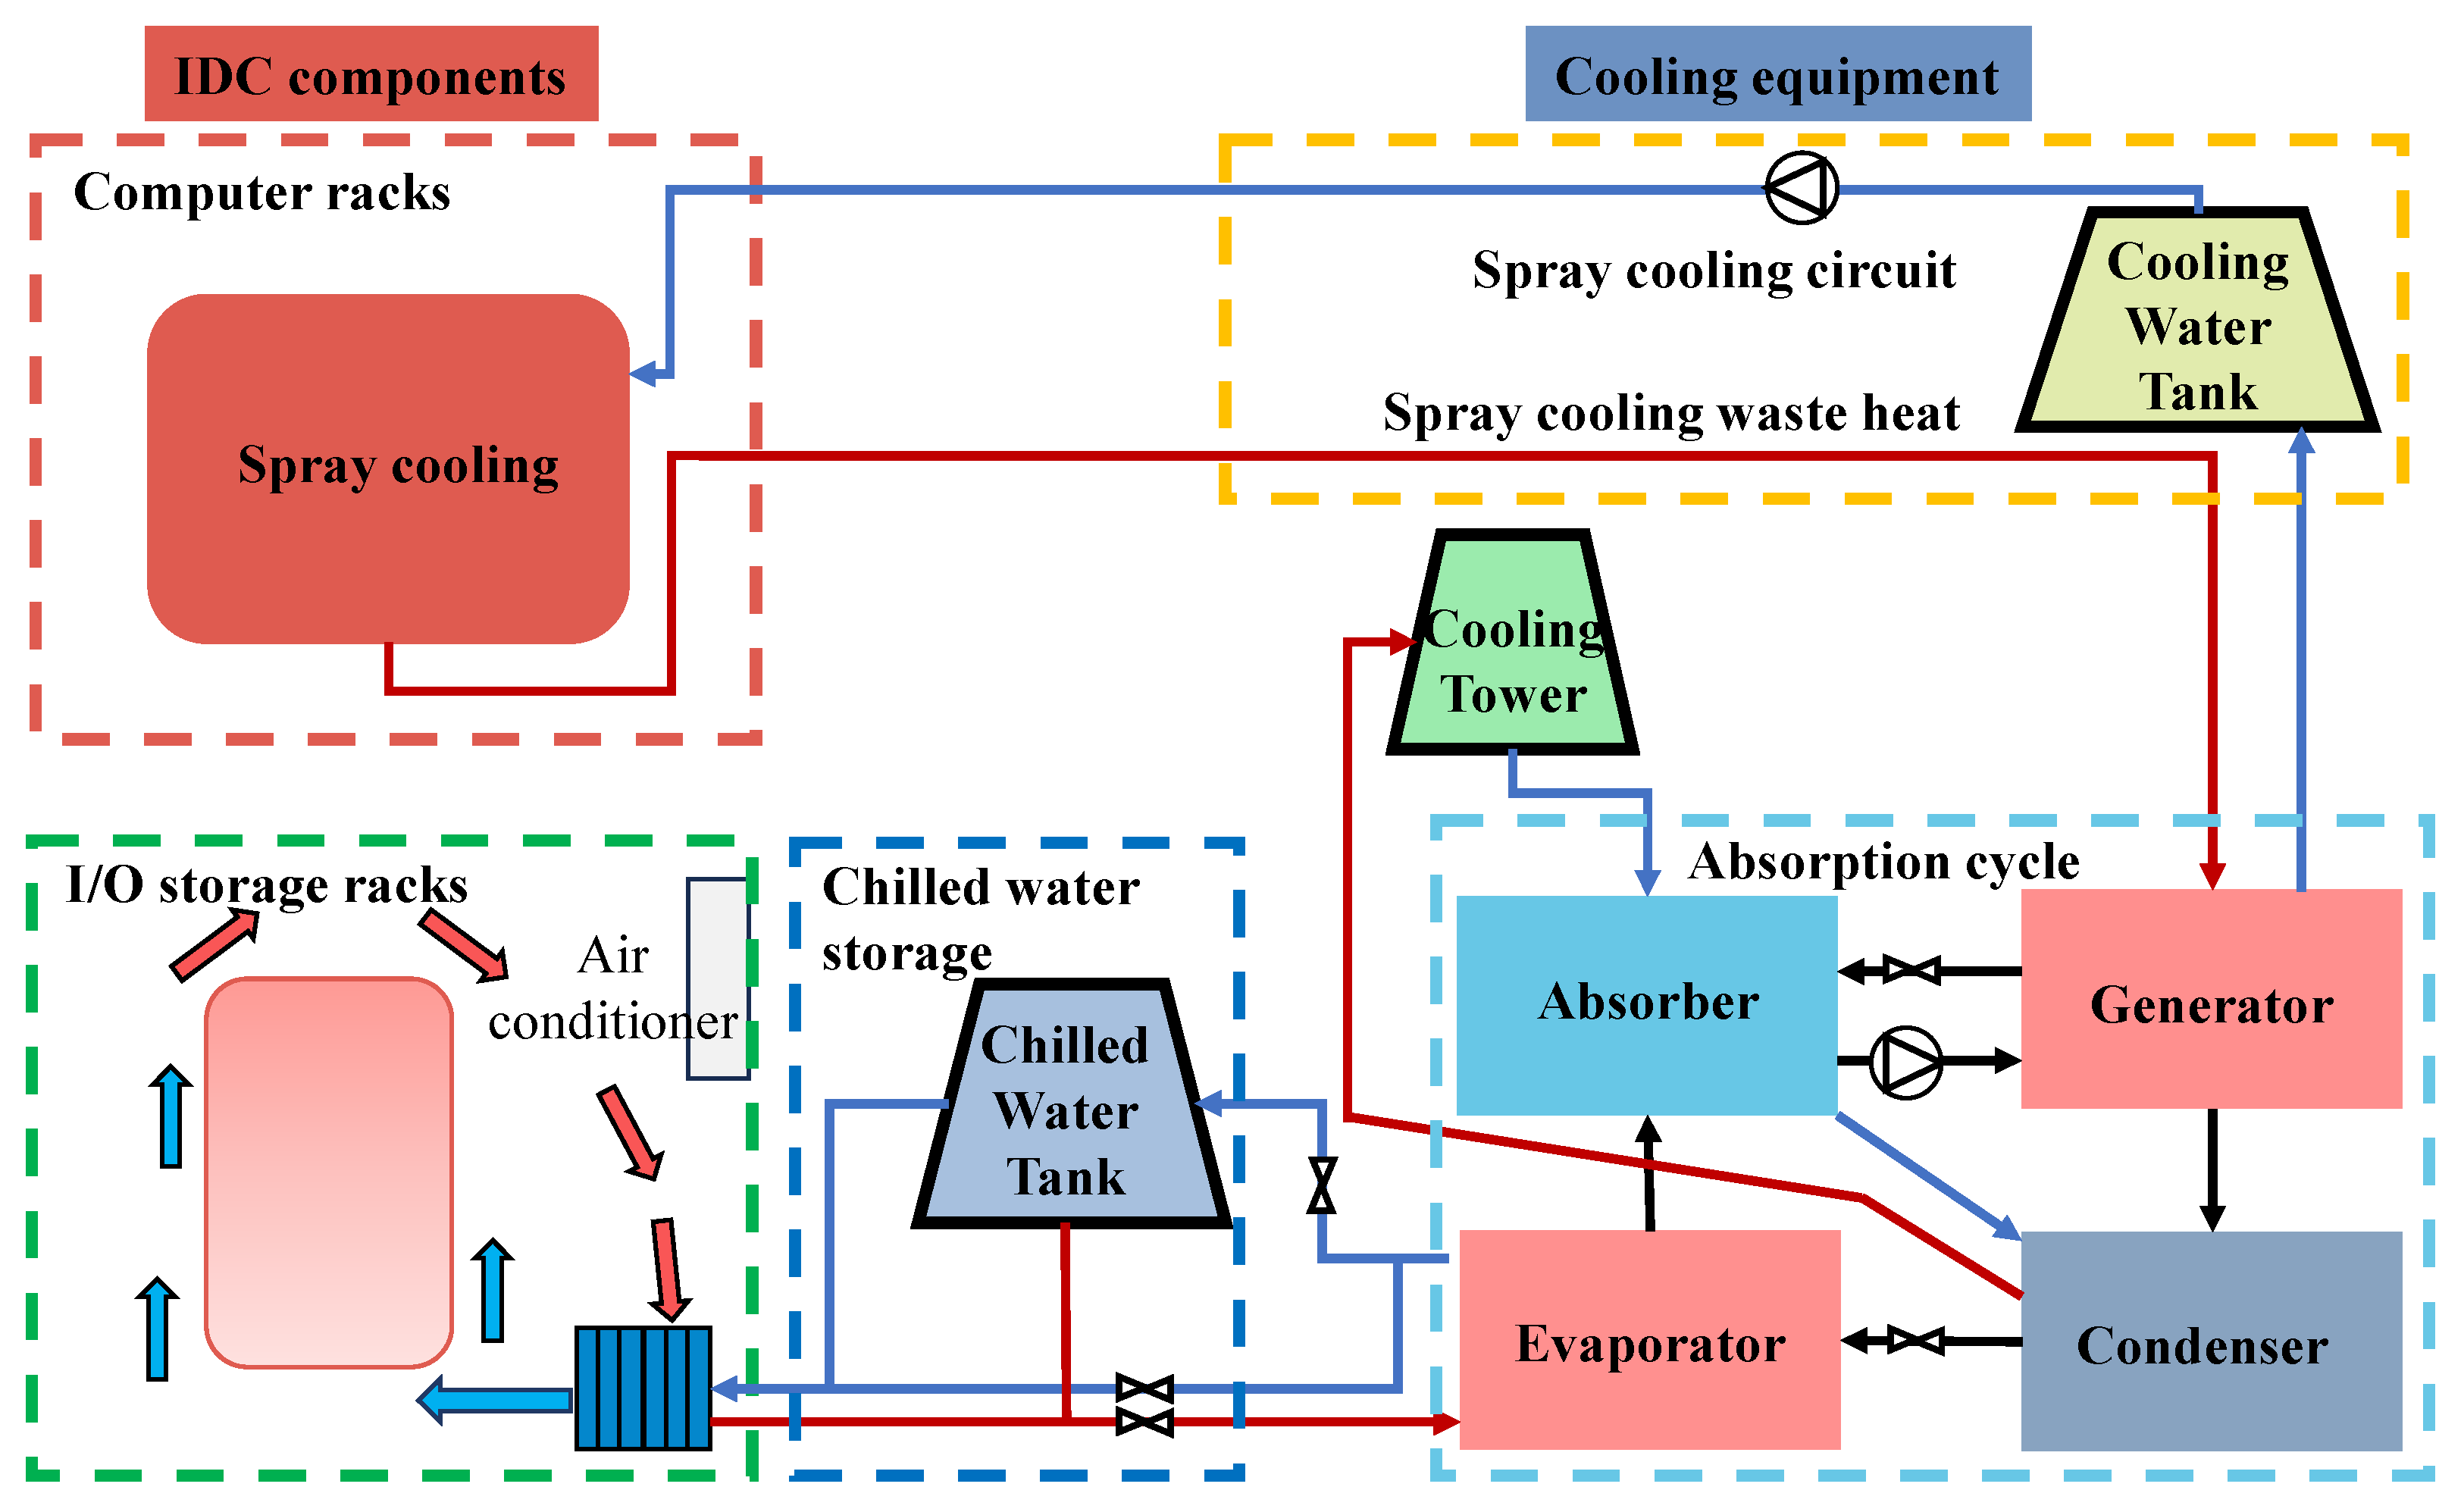
5.2.4. Spray Cooling

Compared with the above three liquid cooling technologies [111], the system design of spray cooling is easier. Furthermore, the coolant filling and the renovation costs are less. During spray cooling, the coolant is accurately sprayed from the nozzle to the surface of the heating parts. The process is mainly implemented via pressure differential generated by nozzle orifices [112]. Then, the sensible heat of the coolant is used to take away the heat [113]. Apparently, the coolants for spray cooling can be R22, PF-5060, R134a or methanol. According to whether the coolant vaporizes on the surface of heating parts [114], it can be divided into a single-phase spray and a two-phase spray [115]. Some studies show that [116] the cooling efficiency of two-phase spray is more than three times that of single-phase spray. Nevertheless, the heat transfer mechanism of spray cooling is complex. Although spray heat transfer mechanisms have been proposed, e.g., film evaporation, single-phase convection, and secondary nucleation, a unified heat transfer model has not yet been formed [117].
A spray cooling system has been proposed by the manufacturer [118], as shown in Figure 15. The cooling process of spray cooling is similar to immersion cooling, but the coolant is sprayed onto the server surface to greatly enhance the convection heat transfer. Furthermore, the cooling efficiency is improved. To cool IDC in tropical areas, a new spray cooling rack [115] has been developed that can be operated stably for more than 4 h in a high-temperature environment (>35 °C), reducing the server surface temperature by a further 7 °C. Surely, spray cooling technology [119] is a recommended cooling method with a huge potential for IDC’s energy conservation. Nonetheless, there are still potential risks [120] with coolant drift and evaporation, thanks to the coolant temperature being high during the spray process. Likewise, maintenance and overhaul are difficult since the nozzle of the spray system is easy to block [121]. Consequently, spray cooling technology has not been widely put into use in IDC.

5.3. Thermal Energy Storage (TES) Based Cooling

There is often a loss in IDC cooling systems due to energy supply–demand mismatches during operation, especially in the efficiency between daytime and night [122]. In recent years, thermal energy storage (TES) based cooling technology has been promoted, which can be used effectively to alleviate the mismatch [123]. Generally, three methods of TES are available: sensible heat storage, latent heat storage and chemical heat storage. For a sensible heat storage system, the energy density is characterized by the specific heat capacity of the heat storage material and its temperature difference, while phase change materials (PCMs) employ latent heat storage for energy conservation, i.e., the heat is absorbed or released when the material changes from solid to liquid state, or vice versa [2]. The technology of PCMs can be classified into two categories, i.e., active and passive. In the active, the PCMs are charged by a cooling system, and then it is discharged to cool the computer room environment during the daytime. In the passive, the differential temperature between diurnal and nocturnal can lead to charging and discharging processes. There is a significant potential for energy saving with PCMs technology. For example, PCMs combined with a natural cold source provide an almost four times higher energy efficiency than the limit for air conditioners [124]. Moreover, a new system combines PCMs with a two-phase liquid cooling, which absorbs heat from the equipment during the hottest part of the day, storing it as latent heat and releasing it to the environment at night, cutting roughly 14 tons of carbon footprint per year [125]. Chemical heat storage is based on utilizing the reaction heat of a reversible chemical reaction. In fact, the commercial viability of chemical heat storage is currently weak.
Generally, TES based cooling technology is combined with other technologies [126]. For example, a heat pipe cooling [127] is combined with a PCMs unit to maximize the use of the outdoor cooling sources, which achieved a 28% energy saving rate and reduced the PUE value to 1.51. Furthermore, waterside free cooling [128] with a TES tank extends the effective cooling time of free cooling, which reduces energy consumption with an energy saving rate of 33.1% and a PUE value of 1.2. In addition, a combination system [129], including a spray cooling system, an absorption chiller, and a chilled water storage tank, is applied to IDC, as shown in Figure 16. During off-peak cooling hours, the cooling capacity is stored by the chilled water tank. Then, the cooling capacity stored in the tank is used during peak hours. That achieves a balance between the supply and demand of cold, with an energy-saving rate of up to 50% compared to traditional cooling technology [129].

5.4. Building Envelope

There is a great deal of focus on the building envelope since it is characterized by low energy consumption and structural simplicity. Particularly, there are two methods to enhance energy conservation by building an envelope. On the one hand, Container Data Center (CDC) is a new concept developed recently, which puts racks into containers. Those containers are equipped with a cooling system to be placed outside or in stores. A direct free cooling CDC has a 20.8% reduction in overall energy consumption for a year [130] compared to the air cooling CDC. On the other hand, building doors and windows usually produces 20–30% cooling capacity loss [131]. Therefore, a series of measures should be taken to effectively block the solar radiation entering the computer room, e.g., minimizing the number of windows, using windows with great airtightness and thermal insulation, applying thermal insulation film or coating treatment to peripheral glass, etc. Meanwhile, the building thermal performance of IDC can be greatly enhanced by using thermal insulation materials, which are suitable for local climate conditions [132]. And green can be planted on the roof to save energy for the improvement of the roof performance.

6. Comparison of Different Cooling Technologies

This paper analyzes traditional cooling technology and four new energy-saving cooling technologies, indicating that the new cooling technologies are effective in improving the cooling energy efficiency in IDC. Table 2 summarizes the application examples of these cooling technologies, featuring energy efficiency indicators according to laboratory scale and commercial scale. Based on the available literature data, the average efficiency of these cooling technologies for different cooling power conditions is summarized as follows. Firstly, the free cooling technology has an average PUE value of not less than 1.3, and the liquid cooling technology has an average PUE value of 1.1–1.2. Furthermore, the method of the building envelope and TES based cooling have a large energy saving rate.
Generally, the difference in PUE between different cooling technologies is determined by two parameters, i.e., heat transfer coefficients and cooling time. For instance, the application of free cooling technology is limited by the outdoor cold environment and water source near the IDC. Meanwhile, the heat transfer coefficient is normally low [133] from 50 to 800 W·m−2·K−1. Consequently, the current PUE of IDC with free cooling is not particularly low. However, liquid cooling technologies are utilized for direct heat transfer between the coolant and the IT equipment at the rack or server, which has a higher heat transfer coefficient [32] from 4000 to 90,000 W·m−2·K−1. Moreover, the liquid cooling technologies with two-phase have a higher heat transfer coefficient [32] than single-phase cooling, so a lower value of PUE is achieved by two-phase liquid cooling technologies, e.g., two-phase cold plate cooling, heat pipe cooling, two-phase immersion cooling, and two-phase spray cooling. In addition, the TES based cooling technologies have varying heat transfer coefficients, which are determined by the heat transfer coefficients of the other integrated cooling technologies. And the energy-saving rate of IDC can be further enhanced by TES based cooling technology, compared to using these cooling technologies alone. In short, the new cooling technology not only reduces the cooling energy consumption effectively but also greatly optimizes the value of PUE. And liquid cooling has lower PUE and higher energy saving rates than other cooling technologies.
The benefits and disadvantages of each cooling technology are summarized in Table 3. Energy saving of free cooling technology can be achieved by using natural resources, i.e., cold air and cold water, for cooling at low cost. However, the discontinuity and relatively low heat transfer coefficients of these natural sources are the main challenges for further refinements [1]. Moreover, free cooling is usually applied well in cold regions and has no obvious effect on improving energy efficiency in regions with high temperatures or humidity. In contrast, the heat transfer coefficient is high for liquid cooling technologies. And the PUE is low for liquid cooling. Nonetheless, the engineering application economy of liquid cooling in different regions is different. At present, there is a lack of large-scale application cases for liquid cooling due to the high cost, unstable safety, and reliability. Better system structural designs and lower-cost refrigerants are called for to meet the challenges of the high-cost drawback. Compared with traditional cooling technology, free cooling and liquid cooling can generate great energy-saving potential, but the initial investment is larger and the payback period is longer. In addition, the TES based cooling technology is used to reduce energy consumption and increase the use of natural cooling sources for peak shaving through the cooling method in combination with other cooling technologies. It has the potential for further energy conservation and effectively reducing costs.

7. Conclusions

With the gradual development of the digital society, the energy consumption potential of IDC will be huge in the future. It is essential to seek efficient cooling solutions, combined with IDC scale, climate conditions, maintenance, investment payback period, etc., suitable for IDC. At present, mature traditional cooling solutions have been formed at multi-scale, i.e., room-level cooling, row-level cooling and rack-level cooling. Nonetheless, it is not suitable for the future needs of IDC with high heat density. Thus, four new cooling technologies are reviewed, i.e., free cooling, liquid cooling, TES based cooling, and building envelop. The following conclusions could be drawn:
(1)
The thermal management and efficiency enhancement of traditional cooling technology for IDC has been developed in multi-level from rack to room. But, it is still inefficient due to the mixing of the cold and hot airflow. At present, most inefficient old IDCs are cold by air cooling technology, so developing a highly efficient solution from the perspective of traditional cooling is currently demanding, considering the complexity of implementation, capital, operational cost, maintenance costs, and payback period;
(2)
Free cooling is the most mature among the new technologies. It is an efficient cooling solution that not only reduces the power consumption of IDC but also promotes the sustainable and renewable development of IDC. Unfortunately, the application of free cooling is highly dependent on the local climate, with a PUE of 1.4–1.6 and an average energy saving rate of 35–40%. However, free cooling can be used in combination with other cooling equipment to improve stability and efficiency, such as water chillers and solar energy;
(3)
Liquid cooling technology, e.g., cold plate cooling, heat pipe cooling, and immersion cooling, provides more efficient cooling for high heat density servers. However, for the utilization of liquid cooling, some characteristic parameters, i.e., hot-swap capability, versatility, reliability, capital expenditures, and operational and maintenance costs, should be further considered. In addition, although the foundational principles and techniques of liquid cooling have been mastered, it is only applied in laboratories and some high-tech companies now. Its operation reliability, investment and maintenance cost are all the key problems that hinder the development of liquid cooling technology;
(4)
TES based cooling provides the ability to utilize natural cooling sources by shaving peaks and valleys. However, TES based cooling must be coupled with other cooling technologies. Moreover, a system operation strategy needs to be developed;
(5)
Building envelope technology involves placing the racks in containers to allow cooling with conventional cooling systems or blocking solar radiation from entering the computer room to reduce the cooling losses from building windows and doors.
In brief, those new technologies are likely to be of particular benefit to IDC operators. They have the potential to minimize the use of mechanical equipment and remove a higher thermal flux.

Author Contributions

X.H.: Conceptualization, Methodology, Investigation, Writing–original draft, Writing—review and editing. J.Y.: Resources, Supervision, Writing—review and editing. X.Z.: Investigation, Conceptualization. Y.W.: Investigation, Conceptualization. S.H.: Investigation, Conceptualization. All authors have read and agreed to the published version of the manuscript.

Funding

This research received no external funding.

Data Availability Statement

The data sets used and analyzed during the current study are available from the corresponding author upon reasonable request.

Conflicts of Interest

The authors declare no conflict of interest.

References

  1. Zhang, Y.; Zhao, Y.; Dai, S.; Nie, B.; Ma, H.; Li, J.; Miao, Q.; Jin, Y.; Tan, L.; Ding, Y. Cooling technologies for data centres and telecommunication base stations—A comprehensive review. J. Clean. Prod. 2022, 334, 130280. [Google Scholar] [CrossRef]
  2. Nadjahi, C.; Louahlia, H.; Lemasson, S. A review of thermal management and innovative cooling strategies for data center. Sustain. Comput. Inform. Syst. 2018, 19, 14–28. [Google Scholar] [CrossRef]
  3. Chu, W.-X.; Wang, C.-C. A review on airflow management in data centers. Appl. Energy 2019, 240, 84–119. [Google Scholar] [CrossRef]
  4. Yonyzhen, W.; Wei, Z.; Jing, W. Data Center Energy Supply under the Energy Internet. Electronic 2020, 5, 61–65. [Google Scholar]
  5. North China Electric Power University. Report for energy consumption and renewable energy potential of data center in China. Wind Energy 2019, 10, 8. [Google Scholar]
  6. Wenliang, L.; Yiyun, G.; Qi, Y.; Chao, M.; Yingru, Z. Overview of Energy-saving Operation of Data Center under “Double Carbon” Target. Distrib. Util. 2021, 38, 49–55. [Google Scholar]
  7. Greenpeace. Decarbonization of China’s Digital Infrastructure: Data Center and 5G Carbon Reduction Potential and Challenges (2020–2035); Ministry of Industry and Information Technology Electronics Fifth Research Institute: Guangzhou, China, 2021. [Google Scholar]
  8. Jiankun, H.; Zhang, L.; Xiliang, Z. Study on long-term low-carbon development strategy and transition path in China. China Popul. Resour. Environ. 2020, 30, 25. [Google Scholar]
  9. Dumitrescu, C.; Plesca, A.; Dumitrescu, L.; Adam, M.; Nituca, C.; Dragomir, A. Assessment of Data Center Energy Efficiency. Methods and Metrics. In Proceedings of the 2018 International Conference and Exposition on Electrical and Power Engineering (EPE), Iasi, Romania, 18–19 October 2018; pp. 487–492. [Google Scholar]
  10. Almoli, A.; Thompson, A.; Kapur, N.; Summers, J.; Thompson, H.; Hannah, G. Computational fluid dynamic investigation of liquid rack cooling in data centres. Appl. Energy 2012, 89, 150–155. [Google Scholar] [CrossRef]
  11. Siriwardana, J.; Jayasekara, S.; Halgamuge, S.K. Potential of air-side economizers for data center cooling: A case study for key Australian cities. Appl. Energy 2013, 104, 207–219. [Google Scholar] [CrossRef]
  12. Cho, J.; Kim, B.S. Evaluation of air management system’s thermal performance for superior cooling efficiency in high-density data centers. Energy Build. 2011, 43, 2145–2155. [Google Scholar] [CrossRef]
  13. Fakhim, B.; Behnia, M.; Armfield, S.W.; Srinarayana, N. Cooling solutions in an operational data centre: A case study. Appl. Therm. Eng. 2011, 31, 2279–2291. [Google Scholar] [CrossRef]
  14. Ding, T.; Chen, X.; Cao, H.; He, Z.; Wang, J.; Li, Z. Principles of loop thermosyphon and its application in data center cooling systems: A review. Renew. Sustain. Energy Rev. 2021, 150, 111389. [Google Scholar] [CrossRef]
  15. Capozzoli, A.; Primiceri, G. Cooling systems in data centers: State of art and emerging technologies. In Proceedings of the 7th International Conference on Sustainability and Energy in Buildings, SEB 2015, Lisbon, Portugal, 1–3 July 2015; pp. 484–493. [Google Scholar]
  16. Daraghmeh, H.M.; Wang, C.-C. A review of current status of free cooling in datacenters. Appl. Therm. Eng. 2017, 114, 1224–1239. [Google Scholar] [CrossRef]
  17. Dai, J.; Das, D.; Pecht, M. Prognostics-based risk mitigation for telecom equipment under free air cooling conditions. Appl. Energy 2012, 99, 423–429. [Google Scholar] [CrossRef]
  18. Li, Z.; Kandlikar, S.G. Current status and future trends in data-center cooling technologies. Heat Transf. Eng. 2015, 36, 523–538. [Google Scholar] [CrossRef]
  19. Yueqin, C.; Yongcheng, N.; Huaqiang, C. Discussions on energy efficiency improvement measure of data center under the background of new infrastructure. Telecommun. Inf. 2020, 10, 11–14. [Google Scholar]
  20. Zhang, H.; Shao, S.; Xu, H.; Zou, H.; Tian, C. Free cooling of data centers: A review. Renew. Sustain. Energy Rev. 2014, 35, 171–182. [Google Scholar] [CrossRef]
  21. Yuan, X.; Zhou, X.; Pan, Y.; Kosonen, R.; Cai, H.; Gao, Y.; Wang, Y. Phase change cooling in data centers: A review. Energy Build. 2021, 236, 110764. [Google Scholar] [CrossRef]
  22. Nall, D.H. Data Centers, Cooling Towers & Thermal Storage. Ashrae J. 2018, 60, 64–70. [Google Scholar]
  23. Quirk, D.V.; Ashrae. Convergence of Telecommunications and Data Centers. In Proceedings of the Ashrae Transactions, Chicago, IL, USA, 25–28 January 2009; pp. 201–210. [Google Scholar]
  24. Lei, N.; Masanet, E. Statistical analysis for predicting location-specific data center PUE and its improvement potential. Energy 2020, 201, 117556. [Google Scholar] [CrossRef]
  25. GB 40879-2021; Maximum Allowable Values of Energy Efficiency and Energy Efficiency Grades for Data Centers. China National Standardization Management Committee: Beijing, China, 2021.
  26. Sharma, R.K.; Bash, C.E.; Patel, C.D. Dimensionless Parameters for Evaluation of Thermal Design and Performance of Large-scale Data Centers. In Proceedings of the 8th ASME/AIAA Joint Thermophysics and Heat Transfer Conference, St. Louis, MO, USA, 24–26 June 2002. [Google Scholar]
  27. Bash, C.; Patel, C.; Sharma, R. Efficient thermal management of data centers mmediate and long term research needs. Int. J. Heat. Vent. Air Cond. Refrig. Res. 2003, 9, 137–152. [Google Scholar]
  28. Herrlin, M.K. Rack cooling effectiveness in data centers and telecom central offices: The Rack Cooling Index (RCI). Ashrae Trans. 2005, 111, 725–731. [Google Scholar]
  29. Herrlin, M.K. Airflow and Cooling Performance of Data Centers: Two Performance Metrics. In Proceedings of the 2008 ASHRAE Annual Meeting, Salt Lake City, UT, USA, 16–21 November 2008; pp. 182–187. [Google Scholar]
  30. Report of Data Center Market in China (2020); Centrum Intelligence (Beijing) Information Technology Research Institute: Beijing, China, 2021.
  31. Jin, C.; Bai, X.; An, Y.N.; Ni, J.; Shen, J. Case study regarding the thermal environment and energy efficiency of raised-floor and row-based cooling. Build. Environ. 2020, 182, 107110. [Google Scholar] [CrossRef]
  32. Habibi Khalaj, A.; Halgamuge, S.K. A Review on efficient thermal management of air- and liquid-cooled data centers: From chip to the cooling system. Appl. Energy 2017, 205, 1165–1188. [Google Scholar] [CrossRef]
  33. Zhang, Q.; Meng, Z.; Hong, X.; Zhan, Y.; Liu, J.; Dong, J.; Bai, T.; Niu, J.; Deen, M.J. A survey on data center cooling systems: Technology, power consumption modeling and control strategy optimization. J. Syst. Archit. 2021, 119, 102253. [Google Scholar] [CrossRef]
  34. Xiao, H.; Yang, Z.; Shi, W.; Wang, B.; Li, B.; Song, Q.; Li, J.; Xu, Z. Comparative analysis of the energy efficiency of air-conditioner and variable refrigerant flow systems in residential buildings in the Yangtze River region. J. Build. Eng. 2022, 55, 104644. [Google Scholar] [CrossRef]
  35. Wan, J.; Gui, X.; Kasahara, S.; Zhang, Y.; Zhang, R. Air Flow Measurement and Management for Improving Cooling and Energy Efficiency in Raised-Floor Data Centers: A Survey. IEEE Access 2018, 6, 48867–48901. [Google Scholar] [CrossRef]
  36. Rahmaninia, R.; Amani, E.; Abbassi, A. Computational optimization of a UFAD system using large eddy simulation. Sci. Iran. 2020, 27, 2871–2888. [Google Scholar] [CrossRef]
  37. Song, P.; Zhang, Z.; Zhu, Y. Numerical and experimental investigation of thermal performance in data center with different deflectors for cold aisle containment. Build. Environ. 2021, 200, 107961. [Google Scholar] [CrossRef]
  38. Lee, Y.; Wen, C.; Shi, Y.; Li, Z.; Yang, A.-S. Numerical and experimental investigations on thermal management for data center with cold aisle containment configuration. Appl. Energy 2022, 307, 118213. [Google Scholar] [CrossRef]
  39. Ahuja, N.; Rego, C.; Ahuja, S.; Warner, M.; Docca, A. Data Center Efficiency with Higher Ambient Temperatures and Optimized Cooling Control. In Proceedings of the 2011 27th Annual IEEE Semiconductor Thermal Measurement and Management Symposium (Semi-Therm), San Jose, CA, USA, 20–24 March 2011; pp. 105–109. [Google Scholar]
  40. Lu, H.; Zhang, Z.; Yang, L. A review on airflow distribution and management in data center. Energy Build. 2018, 179, 264–277. [Google Scholar] [CrossRef]
  41. Sahini, M.; Kumar, E.; Gao, T.; Ingalz, C.; Heydari, A.; Sun, X. Study of Air Flow Energy within Data Center room and sizing of hot aisle Containment for an Active vs. Passive cooling design. In Proceedings of the 2016 15th IEEE Intersociety Conference on Thermal and Thermomechanical Phenomena in Electronic Systems (ITherm), Las Vegas, NV, USA, 31 May–3 June 2016; pp. 1453–1457. [Google Scholar]
  42. Zheng, Y.; Li, Z.; Liu, X.; Tong, Z.; Tu, R. Retrofit of air-conditioning system in data center using separate heat pipe system. In Proceedings of the 8th International Symposium on Heating, Ventilation, and Air Conditioning, ISHVAC 2013, Xi’an, China, 19–21 October 2013; pp. 685–694. [Google Scholar]
  43. Nada, S.A.; Elfeky, K.E.; Attia, A.M.A. Experimental investigations of air conditioning solutions in high power density data centers using a scaled physical model. Int. J. Refrig. 2016, 63, 87–99. [Google Scholar] [CrossRef]
  44. Battaglia, F.; Maheedhara, R.; Krishna, A.; Singer, F.; Ohadi, M.M. Modeled and Experimentally Validated Retrofit of High Consumption Data Centers on an Academic Campus. In Proceedings of the 2018 17th IEEE Intersociety Conference on Thermal and Thermomechanical Phenomena in Electronic Systems (ITherm), San Diego, CA, USA, 29 May–1 June 2018; pp. 726–733. [Google Scholar]
  45. Li, L.; Jin, C.; Bai, X. A determination method on the supply airflow rate with the impact of leakage and bypass airflow of computer room air conditioning. J. Build. Eng. 2022, 59, 105063. [Google Scholar] [CrossRef]
  46. Athavale, J.; Joshi, Y.; Yoda, M. Experimentally Validated Computational Fluid Dynamics Model for Data Center with Active Tiles. J. Electron. Packag. 2018, 140, 010902. [Google Scholar] [CrossRef]
  47. Nada, S.A.; Said, M.A. Effect of CRAC units layout on thermal management of data center. Appl. Therm. Eng. 2017, 118, 339–344. [Google Scholar] [CrossRef]
  48. Nada, S.A.; Said, M.A. Comprehensive study on the effects of plenum depths on air flow and thermal managements in data centers. Int. J. Therm. Sci. 2017, 122, 302–312. [Google Scholar] [CrossRef]
  49. Saiyad, A.; Patel, A.; Fulpagare, Y.; Bhargav, A. Predictive modeling of thermal parameters inside the raised floor plenum data center using Artificial Neural Networks. J. Build. Eng. 2021, 42, 102397. [Google Scholar] [CrossRef]
  50. Nemati, K.; Alissa, H.; Sammakia, B. Performance of temperature controlled perimeter and row-based cooling systems in open and containment environment. In Proceedings of the ASME 2015 International Mechanical Engineering Congress and Exposition, IMECE 2015, Houston, TX, USA, 13–19 November 2015. [Google Scholar]
  51. Jinkyun, C.; Yongdae, J.; Beungyong, P.; Sangmoon, L. Investigation on the energy and air distribution efficiency with improved data centre cooling to support high-density servers. E3S Web Conf. 2019, 111, 03070. [Google Scholar] [CrossRef]
  52. Moazamigoodarzi, H.; Tsai, P.J.; Pal, S.; Ghosh, S.; Puri, I.K. Influence of cooling architecture on data center power consumption. Energy 2019, 183, 525–535. [Google Scholar] [CrossRef]
  53. Moazamigoodarzi, H.; Pal, S.; Down, D.; Esmalifalak, M.; Puri, I.K. Performance of a rack mountable cooling unit in an IT server enclosure. Therm. Sci. Eng. Prog. 2020, 17, 100395. [Google Scholar] [CrossRef]
  54. Huang, Z.; Dong, K.; Sun, Q.; Su, L.; Liu, T. Numerical Simulation and Comparative Analysis of Different Airflow Distributions in Data Centers. Procedia Eng. 2017, 205, 2378–2385. [Google Scholar] [CrossRef]
  55. Sun, X.; Zhang, C.; Han, Z.; Dong, J.; Zhang, Y.; Li, M.; Li, X.; Wang, Q.; Wen, Z.; Zheng, B. Experimental study on a novel pump-driven heat pipe/vapor compression system for rack-level cooling of data centers. Energy 2023, 274, 127335. [Google Scholar] [CrossRef]
  56. Xiaoran, N.; Chunhua, X.; Guoling, S.; Junfu, Z.; Xiaojing, C.; Bin, L. Air conditioning system design with lake water cooling technology of a data center in Qiandao Lak. Heat. Vent. Air Cond. 2016, 46, 14–17. [Google Scholar]
  57. Kwon, T.-D.; Jeong, J.-W. Energy advantage of cold energy recovery system using water- and air-side free cooling technologies in semiconductor fabrication plant in summer. J. Build. Eng. 2023, 69, 106277. [Google Scholar] [CrossRef]
  58. Lv, J.; Wang, T.; Zhao, L.; Wang, J.; Hu, L.; Liu, G.; Zhao, S. Energy Saving Analysis of Data Center Air Conditioning System Based on Application of Natural Cooling Technology. J. Refrig. 2016, 37, 113–118. [Google Scholar]
  59. Deymi-Dashtebayaz, M.; Namanlo, S.V. Potentiometric and economic analysis of using air and water-side economizers for data center cooling based on various weather conditions. Int. J. Refrig. 2019, 99, 213–225. [Google Scholar] [CrossRef]
  60. Jia, L.; Liu, J.; Wei, S.; Xu, J. Study on the performance of two water-side free cooling methods in a semiconductor manufacturing factory. Energy Build. 2021, 243, 110977. [Google Scholar] [CrossRef]
  61. Ham, S.; Kim, M.; Choi, B.; Jeong, J. Energy saving potential of various air-side economizers in a modular data center. Appl. Energy 2015, 138, 258–275. [Google Scholar] [CrossRef]
  62. Atwood, D.; Miner, J.G. Reducing Data Center Cost with an Air Economizer; White Paper; Intel Corporation: Santa Clara, CA, USA, 2008. [Google Scholar]
  63. Google’s Chiller-Less Data Center. Data Center Knowledge. Available online: http://www.datacenterknowledge.com/archives/2009/07/15 (accessed on 15 July 2009).
  64. The Green Grid. Updated Air-Side Free Cooling Maps: The Impact of ASHRAE 2011 Allowable Ranges; White Paper; Lawrence Berkeley National Laboratory: Berkeley, CA, USA, 2012. [Google Scholar]
  65. Lee, K.P.; Chen, H.L. Analysis of energy saving potential of air-side free cooling for data centers in worldwide climate zones. Energy Build. 2013, 64, 103–112. [Google Scholar] [CrossRef]
  66. Rabczak, S.; Nowak, K. Possibilities of Adapting a Free-Cooling System in an Existing Commercial Building. Energies 2022, 15, 3350. [Google Scholar] [CrossRef]
  67. Yin, H.; Zhu, Y.; Wang, Y.L.; Gao, Y. Effects of rapamycin on cell growth and apoptosis of pancreatic carcinoma sw1990 cells. Tumor 2011, 31, 49–52. [Google Scholar]
  68. Clidaras, J.; Stiver, D.W.; Hamburgen, W. Water-Based Data Center. U.S. Patent US7525207B2, 28 April 2009. [Google Scholar]
  69. Weicong, F.; Zhipeng, Z.; Ziru, C.; Shuping, H.; Minhua, W.; Guochang, D.; Jianwen, D. Patterns of Variation in Atmospheric Visibility and Impacting Factors in Qiandao Lake National Forest Park, China. Sci. Silvae Sin. 2018, 54, 22–31. [Google Scholar]
  70. Bao, L.; Wang, J.; Kang, L. The applied effect analysis of heat exchanger installed in a typical communication base station in Beijing of China. Energy Procedia 2012, 14, 620–625. [Google Scholar] [CrossRef]
  71. Song, Z.; Murray, B.T.; Sammakia, B. Parametric analysis for thermal characterization of leakage flow in data centers. In Proceedings of the 14th InterSociety Conference on Thermal and Thermomechanical Phenomena in Electronic Systems, ITherm 2014, Orlando, FL, USA, 27–30 May 2014; pp. 778–785. [Google Scholar]
  72. Dong, K.; Li, P.; Huang, Z.; Su, L.; Sun, Q. Research on Free Cooling of Data Centers by Using Indirect Cooling of Open Cooling Tower. Procedia Eng. 2017, 205, 2831–2838. [Google Scholar] [CrossRef]
  73. Carlson, A.B. Data Center Cooling. U.S. Patent US8113010B2, 14 February 2012. [Google Scholar]
  74. Hamburgen, W.; Clidaras, J.; Carlson, A.B. Changing Data Center Cooling Mode. U.S. Patent US8295047B1, 23 October 2012. [Google Scholar]
  75. Ziegler, F. Sorption heat pumping technologies: Comparisons and challenges. Int. J. Refrig. 2009, 32, 566–576. [Google Scholar] [CrossRef]
  76. Hamann, H.F.; Iyengar, M.K.; Van Kessel, T.G. Cooling Infrastructure Leveraging a Combination of Free and Solar Cooling. U.S. Patent US8020390B2, 20 September 2011. [Google Scholar]
  77. Lai, Y.; Fang, X.; Han, R.; Xuan, Y.; Huang, J. Design and key technology of the energy consumption management system for the liquid cooling data center. Energy Sci. Eng. 2023, 11, 1284–1293. [Google Scholar] [CrossRef]
  78. Zimmermann, S.; Meijer, I.; Tiwari, M.K.; Paredes, S.; Michel, B.; Poulikakos, D. Aquasar: A hot water cooled data center with direct energy reuse. Energy 2012, 43, 237–245. [Google Scholar] [CrossRef]
  79. Moazamigoodarzi, H.; Gupta, R.; Pal, S.; Tsai, P.J.; Ghosh, S.; Puri, I.K. Modeling temperature distribution and power consumption in IT server enclosures with row-based cooling architectures. Appl. Energy 2020, 261, 114355. [Google Scholar] [CrossRef]
  80. Zhang, Y.; Fan, C.; Li, G. Discussions of Cold Plate Liquid Cooling Technology and Its Applications in Data Center Thermal Management. Front. Energy Res. 2022, 10, 954718. [Google Scholar] [CrossRef]
  81. Xiao, X.; Zeng, C.; Kuang, M. Application of direct contacted liquid cooling system in data center. Refrig. Air-Cond. 2018, 18, 67–72. [Google Scholar]
  82. Tsai, Y.; Wang, G.; Jin, Y.; Li, S.; Fang, W.; Chen, G.; Cao, P.; Zhang, J.; Fan, Y.; Xia, Y.; et al. An Advanced Cold Plate Liquid Cooling Rack Design for Hyperscale Data Center. In Proceedings of the 2022 21st IEEE Intersociety Conference on Thermal and Thermomechanical Phenomena in Electronic Systems (iTherm), San Diego, CA, USA, 31 May–3 June 2022; pp. 1–5. [Google Scholar]
  83. Garimella, S.V.; Yeh, L.T.; Persoons, T. Thermal management challenges in telecommunication systems and data centers. IEEE Trans. Compon. Packag. Manuf. Technol. 2012, 2, 1307–1316. [Google Scholar] [CrossRef]
  84. You, X.Y.; Liu, J.H.; Hua, N.; Wang, J.; Xu, R.J.; Yu, G.X.; Wang, H.S. Experimental study on flow boiling of refrigerant R1233zd(E) in microchannels: Heat transfer. Appl. Therm. Eng. 2021, 182, 116083. [Google Scholar] [CrossRef]
  85. Singh, R.; Akbarzadeh, A.; Mochizuki, M. Sintered porous heat sink for cooling of high-powered microprocessors for server applications. Int. J. Heat Mass Transf. 2009, 52, 2289–2299. [Google Scholar] [CrossRef]
  86. Lee, Y.J.; Singh, P.K.; Lee, P.S. Fluid flow and heat transfer investigations on enhanced microchannel heat sink using oblique fins with parametric study. Int. J. Heat Mass Transf. 2015, 81, 325–336. [Google Scholar] [CrossRef]
  87. Dede, E.M.; Liu, Y. Experimental and numerical investigation of a multi-pass branching microchannel heat sink. Appl. Therm. Eng. 2013, 55, 51–60. [Google Scholar] [CrossRef]
  88. Chen, T.; Garimella, S.V. Measurements and high-speed visualizations of flow boiling of a dielectric fluid in a silicon microchannel heat sink. Int. J. Multiph. Flow 2006, 32, 957–971. [Google Scholar] [CrossRef]
  89. Huh, C.; Kim, J.; Kim, M.H. Flow pattern transition instability during flow boiling in a single microchannel. Int. J. Heat Mass Transf. 2007, 50, 1049–1060. [Google Scholar] [CrossRef]
  90. Qu, W.; Mudawar, I. Measurement and prediction of pressure drop in two-phase micro-channel heat sinks. Int. J. Heat Mass Transf. 2003, 46, 2737–2753. [Google Scholar] [CrossRef]
  91. Kadam, S.T.; Kumar, R. Twenty first century cooling solution: Microchannel heat sinks. Int. J. Therm. Sci. 2014, 85, 73–92. [Google Scholar] [CrossRef]
  92. Chethana, G.D.; Sadashive Gowda, B. Thermal management of air and liquid cooled data centres: A review. Mater. Today Proc. 2021, 45, 145–149. [Google Scholar] [CrossRef]
  93. Xue, Z.H.; Ai, B.C.; Qu, W. Data center energy conservation study utilizing loop heat pipes as a chip-level cooling technique and its industrial application. Appl. Therm. Eng. 2023, 220, 119715. [Google Scholar] [CrossRef]
  94. Ding, T.; He, Z.g.; Hao, T.; Li, Z. Application of separated heat pipe system in data center cooling. Appl. Therm. Eng. 2016, 109, 207–216. [Google Scholar] [CrossRef]
  95. Zhang, P.; Li, X.; Shi, W.; Wang, B.; Rong, X. Experimentally comparative study on two-phase natural and pump-driven loop used in HVAC systems. Appl. Therm. Eng. 2018, 142, 321–333. [Google Scholar] [CrossRef]
  96. Zhou, F.; Wei, C.; Ma, G. Development and analysis of a pump-driven loop heat pipe unit for cooling a small data center. Appl. Therm. Eng. 2017, 124, 1169–1175. [Google Scholar] [CrossRef]
  97. Kheirabadi, A.C.; Groulx, D. Cooling of server electronics: A design review of existing technology. Appl. Therm. Eng. 2016, 105, 622–638. [Google Scholar] [CrossRef]
  98. Tian, H.; He, Z.; Li, Z. A combined cooling solution for high heat density data centers using multi-stage heat pipe loops. Energy Build. 2015, 94, 177–188. [Google Scholar] [CrossRef]
  99. Wang, X.; Wen, Q.; Yang, J.; Xiang, J.; Wang, Z.; Weng, C.; Chen, F.; Zheng, S. A review on data centre cooling system using heat pipe technology. Sustain. Comput. Inform. Syst. 2022, 35, 100774. [Google Scholar] [CrossRef]
  100. Kanbur, B.B.; Wu, C.; Fan, S.; Duan, F. System-level experimental investigations of the direct immersion cooling data center units with thermodynamic and thermoeconomic assessments. Energy 2021, 217, 119373. [Google Scholar] [CrossRef]
  101. Muneeshwaran, M.; Lin, Y.-C.; Wang, C.-C. Performance analysis of single-phase immersion cooling system of data center using FC-40 dielectric fluid. Int. Commun. Heat Mass Transf. 2023, 145, 106843. [Google Scholar] [CrossRef]
  102. Zhou, G.; Zhou, J.; Huai, X.; Zhou, F.; Jiang, Y. A two-phase liquid immersion cooling strategy utilizing vapor chamber heat spreader for data center servers. Appl. Therm. Eng. 2022, 210, 118289. [Google Scholar] [CrossRef]
  103. Pambudi, N.A.; Yusuf, A.M.; Sarifudin, A. The Use of Single-Phase Immersion Cooling by Using Two Types of Dielectric Fluid for Data Center Energy Savings. Energy Eng. 2022, 119, 275–286. [Google Scholar] [CrossRef]
  104. Kang, D.; Lee, J.; Chakraborty, A.; Lee, S.; Kim, G.; Yu, C. Recent Advances in Two-Phase Immersion Cooling with Surface Modifications for Thermal Management. Energies 2022, 15, 1214. [Google Scholar] [CrossRef]
  105. Shojaeian, M.; Koşar, A. Pool boiling and flow boiling on micro- and nanostructured surfaces. Exp. Therm. Fluid Sci. 2015, 63, 45–73. [Google Scholar] [CrossRef]
  106. Tuma, P.E. The merits of open bath immersion cooling of datacom equipment. In Proceedings of the 2010 26th Annual IEEE Semiconductor Thermal Measurement and Management Symposium (SEMI-THERM), Santa Clara, CA, USA, 21–25 February 2010. [Google Scholar]
  107. Li, F.; Cao, H. Current Status and Prospects of Two-phase Cooling for Data Centers. J. Refrig. 2022, 43, 28–36. [Google Scholar] [CrossRef]
  108. Liu, C.K.; Chang, T.Y. Thermal Performance of Single-Phase and Two-Phase Immersion Cooling in Data Center. In Proceedings of the 2022 17th International Microsystems, Packaging, Assembly and Circuits Technology Conference (IMPACT), Taipei, Taiwan, 26–28 October 2022; pp. 1–4. [Google Scholar]
  109. Pambudi, N.A.; Sarifudin, A.; Firdaus, R.A.; Ulfa, D.K.; Gandidi, I.M.; Romadhon, R. The immersion cooling technology: Current and future development in energy saving. Alex. Eng. J. 2022, 61, 9509–9527. [Google Scholar] [CrossRef]
  110. Kuncoro, I.W.; Pambudi, N.A.; Biddinika, M.K.; Widiastuti, I.; Hijriawan, M.; Wibowo, K.M. Immersion cooling as the next technology for data center cooling: A review. In Proceedings of the 4th Annual Applied Science and Engineering Conference, Bali, Indonesia, 24 April 2019. [Google Scholar]
  111. Wang, Y.; Zhang, Q.; Sun, C.; Zhuang, Z.; Huang, Z.; Zhai, T. Analysis on the Development of Liquid Cooling Data Center Technology. Electr. Power Inf. Commun. Technol. 2021, 19, 69–74. [Google Scholar] [CrossRef]
  112. Kim, J. Spray cooling heat transfer: The state of the art. Int. J. Heat Fluid Flow 2007, 28, 753–767. [Google Scholar] [CrossRef]
  113. Park, J.E.; Thome, J.R. Critical heat flux in multi-microchannel copper elements with low pressure refrigerants. Int. J. Heat Mass Transf. 2010, 53, 110–122. [Google Scholar] [CrossRef]
  114. Liu, S.; Ruan, L.; Kang, Y. Experimental investigation and numerical analysis of atomization characteristics at the spray cooling axis. Sci. Technol. Eng. 2018, 18, 225–229. [Google Scholar]
  115. Kandasamy, R.; Ho, J.Y.; Liu, P.; Wong, T.N.; Toh, K.C.; Chua, S., Jr. Two-phase spray cooling for high ambient temperature data centers: Evaluation of system performance. Appl. Energy 2022, 305, 117816. [Google Scholar] [CrossRef]
  116. Yang, J.; Chow, L.C.; Pais, M.R. Nucleate Boiling Heat Transfer in Spray Cooling. Heat Transf. 1996, 118, 668–671. [Google Scholar] [CrossRef]
  117. Silk, E.A.; Golliher, E.L.; Selvam, R.P. Spray cooling heat transfer: Technology overview and assessment of future challenges for micro-gravity application. Energy Convers. Manag. 2008, 49, 453–468. [Google Scholar] [CrossRef]
  118. Visaria, M.; Mudawar, I. Application of Two-Phase Spray Cooling for Thermal Management of Electronic Devices. IEEE Trans. Compon. Packag. Technol. 2009, 32, 784–793. [Google Scholar] [CrossRef]
  119. Yin, J.; Wang, S.; Sang, X.; Zhou, Z.; Chen, B.; Thrassos, P.; Romeos, A.; Giannadakis, A. Spray Cooling as a High-Efficient Thermal Management Solution: A Review. Energies 2022, 15, 8547. [Google Scholar] [CrossRef]
  120. Chen, X.; Zhou, L.; Zhang, C.; Wang, S.; Zhang, L.; Chen, J. Research Status and Future Development of Cooling Technologies for Green and Energy-Efficient Data Centers. Strateg. Study CAE 2022, 4, 94–104. [Google Scholar] [CrossRef]
  121. Qiu, L.; Dubey, S.; Choo, F.H.; Duan, F. Recent developments of jet impingement nucleate boiling. Int. J. Heat Mass Transf. 2015, 89, 42–58. [Google Scholar] [CrossRef]
  122. Liu, L.; Zhang, Q.; Zhai, Z.; Yue, C.; Ma, X. State-of-the-art on thermal energy storage technologies in data center. Energy Build. 2020, 226, 110345. [Google Scholar] [CrossRef]
  123. Mustapha, A.N.; Onyeaka, H.; Omoregbe, O.; Ding, Y.; Li, Y. Latent heat thermal energy storage: A bibliometric analysis explicating the paradigm from 2000–2019. J. Energy Storage 2021, 33, 102027. [Google Scholar] [CrossRef]
  124. Sun, X.; Zhang, Q.; Medina, M.A.; Liu, Y.; Liao, S. A study on the use of phase change materials (PCMs) in combination with a natural cold source for space cooling in telecommunications base stations (TBSs) in China. Appl. Energy 2014, 117, 95–103. [Google Scholar] [CrossRef]
  125. Sundaram, A.S.; Seeniraj, R.V.; Velraj, R. An experimental investigation on passive cooling system comprising phase change material and two-phase closed thermosyphon for telecom shelters in tropical and desert regions. Energy Build. 2010, 42, 1726–1735. [Google Scholar] [CrossRef]
  126. Chen, X.; Zhang, Q.; Zhai, Z.J.; Ma, X. Potential of ventilation systems with thermal energy storage using PCMs applied to air conditioned buildings. Renew. Energy 2019, 138, 39–53. [Google Scholar] [CrossRef]
  127. Wang, Z.B.; Xiong, W.; Liu, Y.W.; Jiang, C.Y.; Zhu, C.Y. Energy saving research of heat pipe-cool storage air conditioning system used in internet data center. Refrig. Air-Cond. 2015, 15, 71–74. [Google Scholar]
  128. Ling, L.; Zhang, Q.; Yu, Y.; Ma, X.; Liao, S. Energy saving analysis of the cooling plant using lake water source base on the optimized control strategy with set points change. Appl. Therm. Eng. 2018, 130, 1440–1449. [Google Scholar] [CrossRef]
  129. Chen, H.; Peng, Y.-H.; Wang, Y.-L. Thermodynamic analysis of hybrid cooling system integrated with waste heat reusing and peak load shifting for data center. Energy Convers. Manag. 2019, 183, 427–439. [Google Scholar] [CrossRef]
  130. Endo, H.; Kodama, H.; Fukuda, H.; Sugimoto, T.; Horie, T.; Kondo, M. Effect of climatic conditions on energy consumption in direct fresh-air container data centers. In Proceedings of the 2013 International Green Computing Conference Proceedings, Arlington, VA, USA, 27–29 June 2013; pp. 1–10. [Google Scholar]
  131. Gong, X.; Jia, C. Research Progress and Prospects of Passive Optimization Design of Residential Buildings in China. Build. Energy Effic. 2022, 50, 25–30. [Google Scholar]
  132. Gong, D.; Zhu, H.; Huang, P. Case study on effect of public building envelope. Green Build. 2021, 13, 39–42. [Google Scholar]
  133. He, R.; Rong, G.; Tan, J.; Phoon, K.-k. Analytical and numerical study on heat transfer coefficient between rock fracture walls and flowing fluid. Geothermics 2021, 95, 102122. [Google Scholar] [CrossRef]
  134. Yu, Y.; Wang, L. Solid sorption heat pipe coupled with direct air cooling technology for thermal control of rack level in internet data centers: Design and numerical simulation. Int. J. Heat Mass Transf. 2019, 145, 118714. [Google Scholar] [CrossRef]
  135. Ding, T.; Cao, H.W.; He, Z.G.; Li, Z. Experiment research on influence factors of the separated heat pipe system, especially the filling ratio and Freon types. Appl. Therm. Eng. 2017, 118, 357–364. [Google Scholar] [CrossRef]
  136. Kanbur, B.B.; Wu, C.; Fan, S.; Tong, W.; Duan, F. Two-phase liquid-immersion data center cooling system: Experimental performance and thermoeconomic analysis Système de refroidissement des centres de données par immersion dans un liquide diphasique: Performances expérimentales et analyse thermoéconomique. Int. J. Refrig. 2020, 118, 290–301. [Google Scholar] [CrossRef]
  137. Daraghmeh, H.M.; Sulaiman, M.W.; Yang, K.-S.; Wang, C.-C. Investigation of separated two-phase thermosiphon loop for relieving the air-conditioning loading in datacenter. Energies 2019, 12, 105. [Google Scholar] [CrossRef]
  138. Li, Y.; Zhang, Q.; Sun, X.; Du, Y.; Liao, S. Optimization on performance of the latent heat storage unit (LHSU) in telecommunications base stations (TBSs) in China. Clean Effic. Afford. Energy A Sustain. Future 2015, 75, 2119–2124. [Google Scholar]
  139. Cho, J.; Lim, T.; Kim, B.S. Viability of datacenter cooling systems for energy efficiency in temperate or subtropical regions: Case study. Energy Build. 2012, 55, 189–197. [Google Scholar] [CrossRef]
  140. Sugon. CloudBASE GreenLP Liquid Cooling Server Supporting Infrastructure Solution. Available online: https://www.sugon.com/product/377.html (accessed on 1 March 2020).
  141. Xu, P. Original Warm Water Cooling: Lenovo Data Center’s Secret Weapon. Available online: https://biz.zol.com.cn/658/6582386.html (accessed on 29 September 2017).
  142. Huawei. Fusion Server High Density Dedicated Liquid Cooling System. Available online: https://e.huawei.com/cn/material/datacenter/server/2d194f7330e3403b9ec51160f602fcd6 (accessed on 9 August 2018).
  143. Sun, Y.; Wang, T.; Yang, L.; Hu, L.; Zeng, X. Research of an integrated cooling system consisted of compression refrigeration and pump-driven heat pipe for data centers. Energy Build. 2019, 187, 16–23. [Google Scholar] [CrossRef]
  144. Wylie, W. Schneider and HPE Throw Their Weight behind Data Center Liquid Cooling. Data Center Knowledge. Available online: https://www.datacenterknowledge.com/power-and-cooling/schneider-and-hpe-throw-their-weight-behind-data-center-liquid-cooling (accessed on 14 October 2019).
  145. ZOL. Inspur Launches Submerged Liquid-Cooled Supercomputing. Available online: http://news.zol.com.cn/701/7015103.html (accessed on 23 October 2018).
Figure 1. The energy consumption of IDC and its cooling system. The energy consumption equipment of cooling system includes chiller, terminal cooling units, pumps and towers.
Energies 16 07158 g001
Figure 2. The basic mechanism of the typical cooling system for IDC. A MRSS consists of the heat rejection cycle (HRC) and the heat transfer cycle (HTC).
Energies 16 07158 g002
Figure 3. The general structure of the current work.
Energies 16 07158 g003
Figure 4. Diagram of upper and lower limits of RCI Temperature.
Energies 16 07158 g004
Figure 5. Guidelines and policies on green development of IDC in China.
Energies 16 07158 g005
Figure 6. Diagram of room-level air cooling.
Energies 16 07158 g006
Figure 7. Diagram of cold aisle containment in the computer room.
Energies 16 07158 g007
Figure 8. Diagram of row-level air cooling (a) CRAC is located between the racks. (b) CRAC ceiling installation.
Energies 16 07158 g008
Figure 9. Diagram of rack-level air cooling.
Energies 16 07158 g009
Figure 10. Diagram of direct free cooling (a) airside cooling; (b) waterside cooling.
Energies 16 07158 g010
Figure 11. Diagram of indirect free cooling of (a) airside free cooling; (b) waterside free cooling.
Energies 16 07158 g011
Figure 12. Mechanism of cold plate liquid cooling.
Energies 16 07158 g012
Figure 13. Diagram of heat pipe cooling with different driving modes [95,96], (a) gravity type, (b) liquid phase dynamic type, and (c) gas dynamic type.
Energies 16 07158 g013
Figure 14. Schematic of immersion cooling technology [103], (a) single-phase immersion cooling, (b) two-phase immersion cooling.
Energies 16 07158 g014
Figure 15. Principle of spray cooling.
Energies 16 07158 g015
Figure 16. A hybrid cooling system using chilled water as the storage medium [129].
Energies 16 07158 g016
Table 1. The temperature and humidity for the rack inlet are recommended by ASHRAE.
LevelDry Bulb Temperature (°C)Relative Humidity (%)Application
A115–3220–80Enterprise servers, storage, devices, etc.
A210–3520–80Servers, calculators, workstations, etc.
A35–408–85
A45–458–90
Recommended10–2760
Table 2. Energy efficiency of new cooling technologies in IDC at laboratory and commercial level.
LevelMethodTypeConditionsPUEEnergy Saving RateCompanyModel
LaboratoryFree
cooling
Airside [59]Supply air: 21.5 °C
IT power: 35.1 kW
2.30///
Liquid
cooling
Cold plate [78]Supply air: 15 °C
IT power: 7 kW
1.15///
Cold plate [59]Supply air: 23.8 °C
IT power: 35.1 kW
1.03541.5%//
Cold plate [10]Supply air: 21 °C
IT power: 15 kW
1.30///
Heat pipe [133]Supply liquid: 15–24 °C1.4818.29%//
Heat pipe [134]Supply liquid: 20 °C1.70///
Heat pipe [135]Supply liquid: 28 °C1.20–1.5848.3%//
Immersion [15]Supply liquid: 30 °C1.1488%//
Immersion [136]Supply liquid: 27 °C
IT power: 9.17 kW
1.15///
Spray [137]Supply liquid: 21–25 °C/38.7%//
Building envelopeContainer-based [130]//20.8%//
PDM and free cooling [124]//50%
TESBased free cooling [138]temperature: 20 °C/57.11%//
Based two-phase [127]Temperature: 20.2 °C1.5128%//
CommercialFree
Cooling
Airside [65]Supply air: 27 °C
IT power: 76 kW
1.3833%//
Airside [139]Supply air: 22 °C
IT power: 198 kW
1.6242.2%//
Airside [61]IT power: 220 kW/67.2%//
Airside [72]Supply liquid: 16 °C/19.2%//
Liquid
cooling
Cold plate [140]IT power: 200 kW1.1745%SugonC7000
Cold plate [141]IT power: ~90 kW1.15/LenovoSuperMUC direct water-cooled supercomputing cluster
Cold plate [142]Supply liquid: 5–35 °C
IT power: 49 kW
1.10/HuaweiFusionServer high density dedicated liquid cooling system
Heat pipe [42]Supply liquid: 27.2 °C
IT power: 60 kW
/18%/Retrofit separate heat pipe air-conditioning
Heat pipe [143]Supply liquid: 35 °C
IT power: 200 kW
/46%/HFK-200FH
immersion [144]IT power per rack: 200 kW1.0395%Green Revolution Cooling (GRC)Immersion Cooling System ICEraQ Server
immersion [145]/1.10–1.20/InspurTS4220LC
TESBased free cooling [129]Energy storge temperature: 25 °C/51%//
Based free cooling [128]IT power > 115 kW
Energy storge temperature: 12–18 °C
1.233.1%//
Table 3. Summary of different energy-saving cooling technologies in IDC.
MethodTypeBenefitsDisadvantagesMaintenance & CostApplication
Traditional coolingAir cooling
  • Simple principle
  • high reliability
  • low cooling efficiency
  • Cold pass and hot circulation
  • simple maintenance
  • low operating cost
  • Minor IDC
New coolingFree cooling
Energy saving through natural cooling source
Environmentally dependent
High PUE
Frequent to maintain
Low cost
large and extra-large with low-temperatures and abundant water resources
Liquid cooling
  • High heat transfer performance
  • Lower energy consumption
  • Promising PUE and energy saving rate
  • Not mature
  • Difficult to maintain
  • High cost
  • large and extra-large
TES based cooling
Low running cost
Promising PUE and energy saving rate
Flexible power usage
Difficult to use alone
Based on the actual situation
Possible increase in the initial cost
large and extra-large
Building envelope
  • Simple principle
  • Highly influenced by terrain and climate
  • Easy maintenance
  • Wide
Disclaimer/Publisher’s Note: The statements, opinions and data contained in all publications are solely those of the individual author(s) and contributor(s) and not of MDPI and/or the editor(s). MDPI and/or the editor(s) disclaim responsibility for any injury to people or property resulting from any ideas, methods, instructions or products referred to in the content.

