
Energy Consumption, Energy Analysis, and Solar Energy Integration for Commercial Building Restaurants

 ,
,  ,
,
Abstract
:1. Introduction
- Level 1: This basic type of energy audit, often called a walk-through audit, involves a visual inspection of the building or system to pinpoint evident inefficiencies and areas where energy consumption can be optimized. The process typically includes a review of energy bills, utility rates, and past energy consumption data to establish a baseline for energy usage [4].
- Level 2: Going beyond a walk-through, this audit delves deeper into energy consumption patterns. It includes a detailed inspection of the building’s envelope, lighting systems, HVAC systems, water heating systems, and other energy-intensive equipment [4,6,7]. Its key components are:
- ○
- Thorough data analysis, including energy usage patterns and potential demand-reduction strategies.
- ○
- Evaluation of energy and cost savings for specific ECMs, such as lighting upgrades or insulation improvements.
- ○
- Preliminary financial analysis of the proposed ECMs, including estimates of the payback period and return on investment.
- ○
- A detailed report summarizing findings, proposed ECMs, anticipated energy and cost savings, and an implementation plan [8].
- Level 3: This is the most extensive type of energy audit. It comprises detailed engineering calculations, energy simulation models, and a tailored energy management plan [9,10,11]. Key components include:
- ○
- Comprehensive data collection and analysis, encompassing interval meter data, weather-normalized energy consumption, and benchmarking against comparable buildings.
- ○
- In-depth financial analysis of the suggested ECMs, with evaluations such as life-cycle cost analysis, net present value, and internal rate of return to assess the long-term fiscal advantages [5].
2. Methodology
2.1. Data Collection Procedure
- Electric Kitchen: All equipment operates solely on electrical energy.
- Gas Kitchen: While most equipment runs on electricity, four pieces specifically (as mentioned above) can also operate using LPG.
2.2. Business Operating Hours
2.3. Equipment Operation Hours
2.4. Energy Audit Framework for Restaurants Commercial Building
2.5. Building Energy Index Data and Formulation
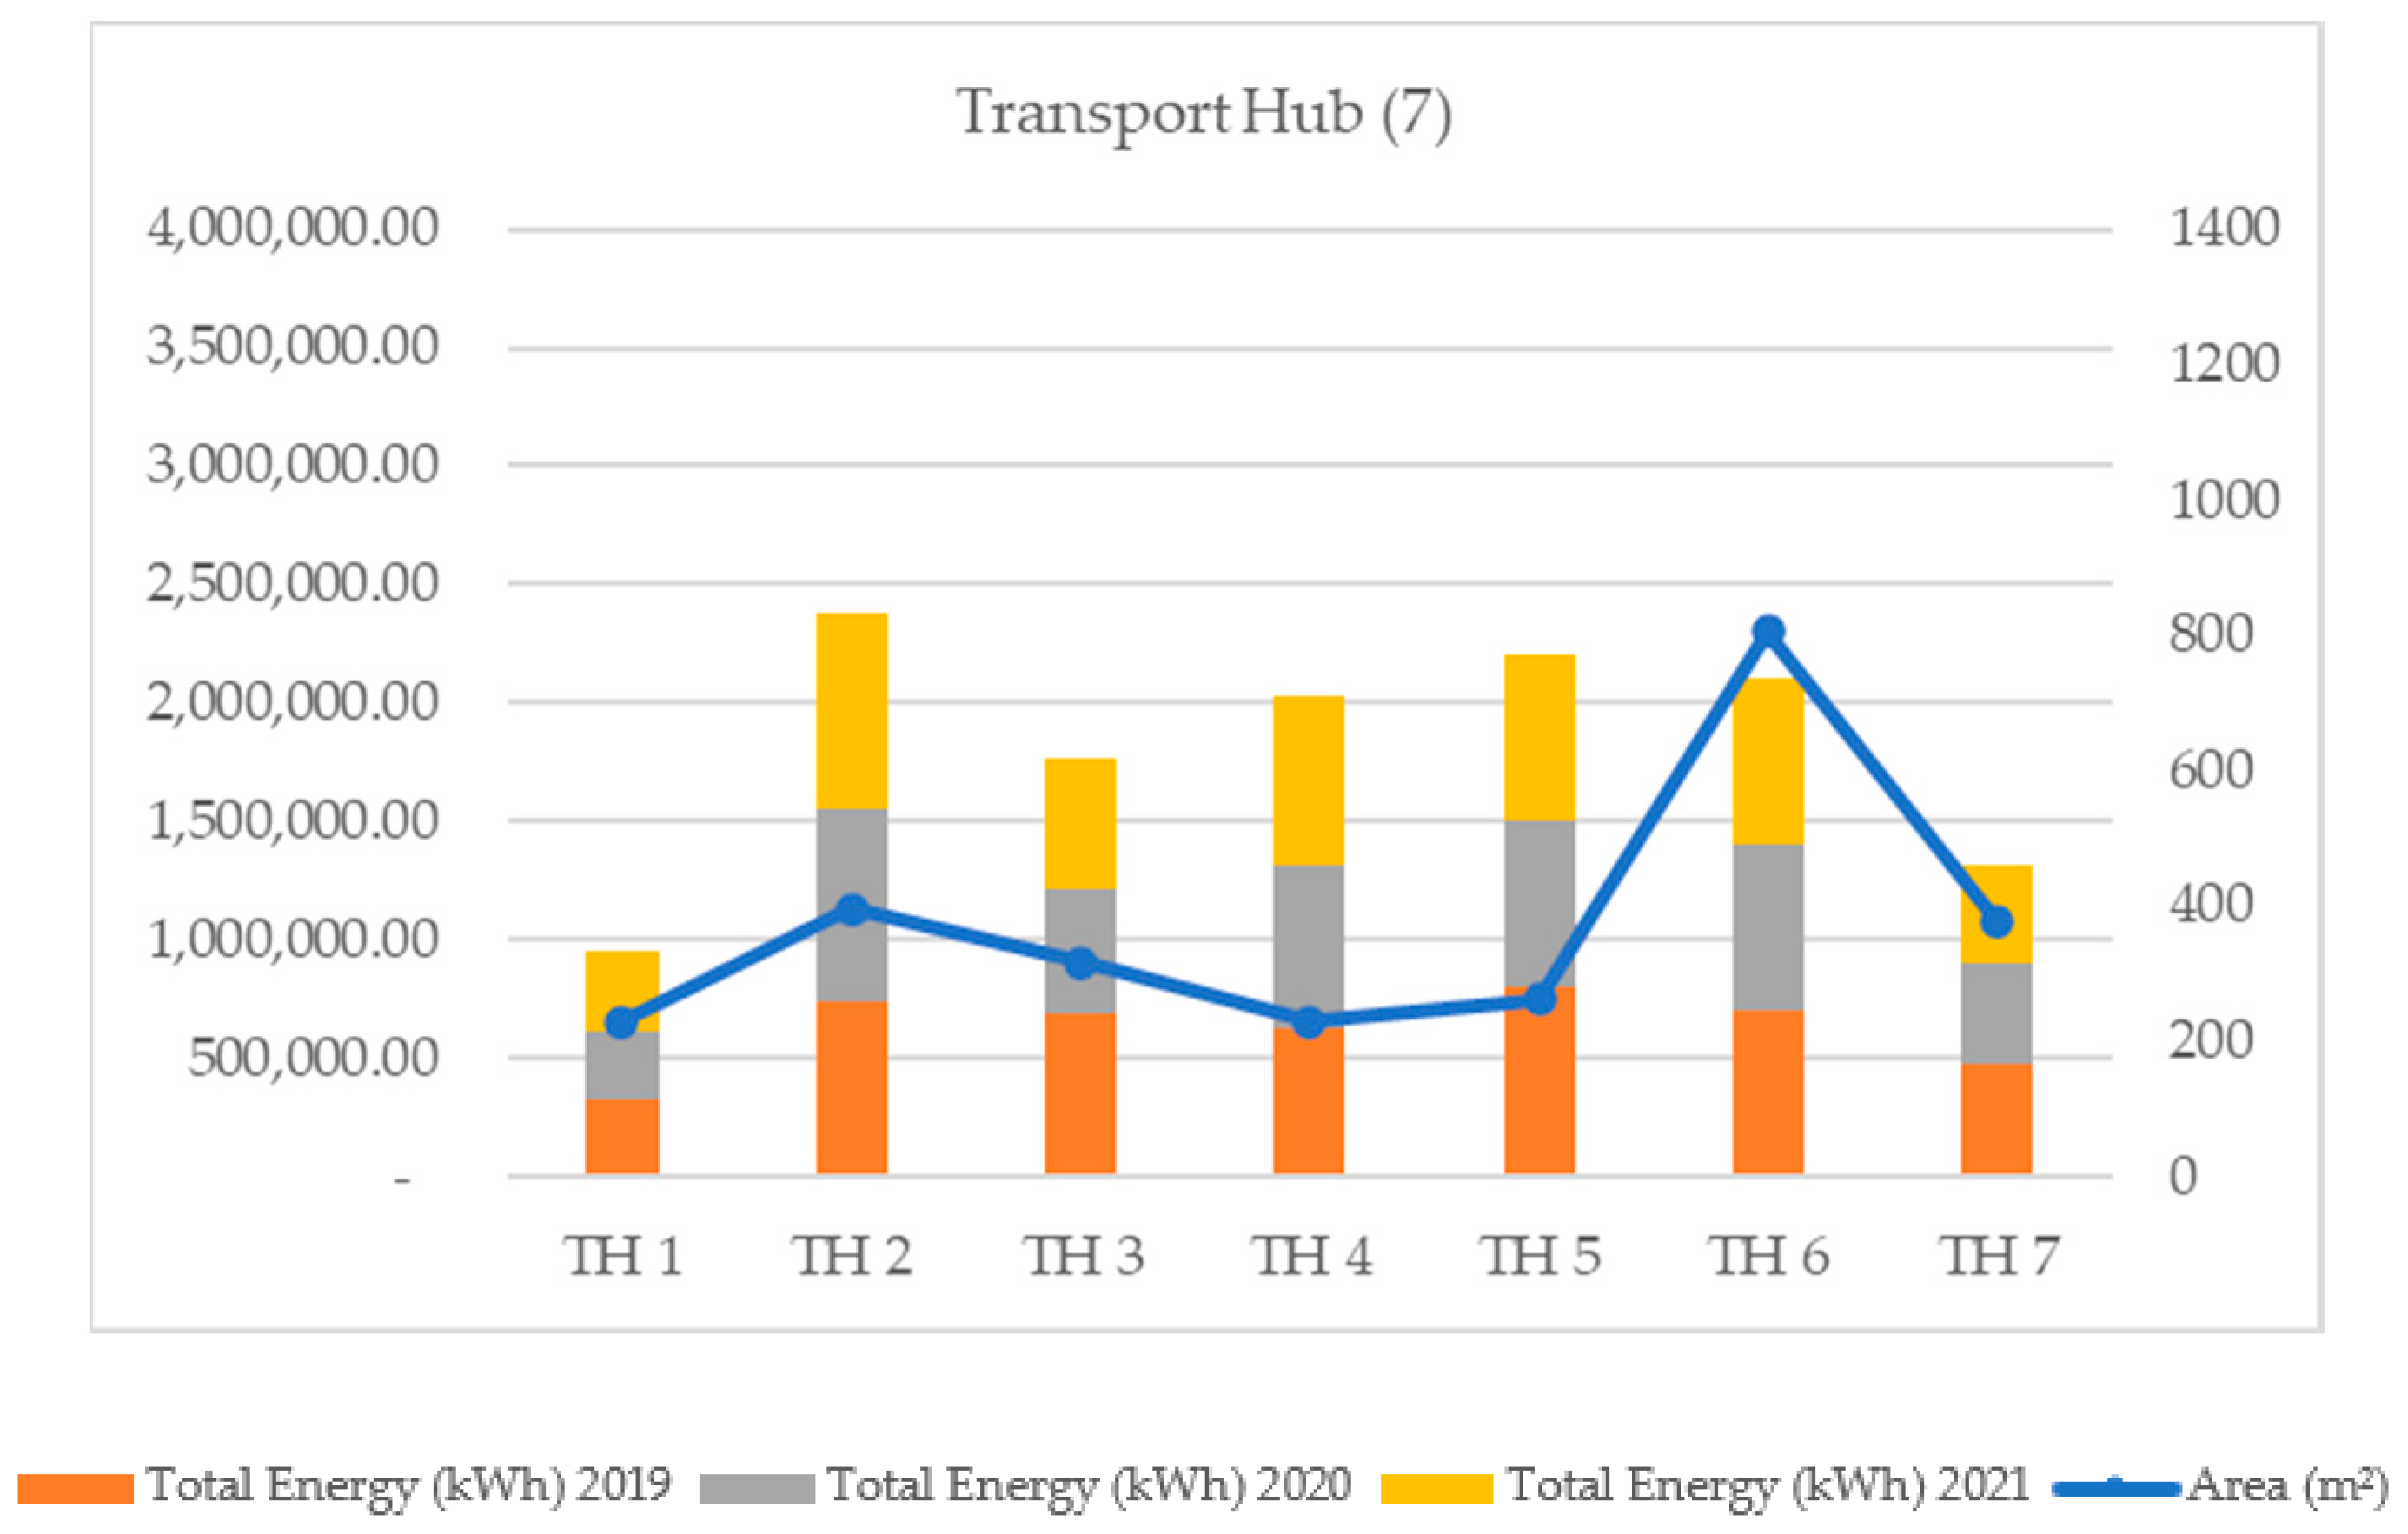
- Transport hub = 7
- Mall = 35
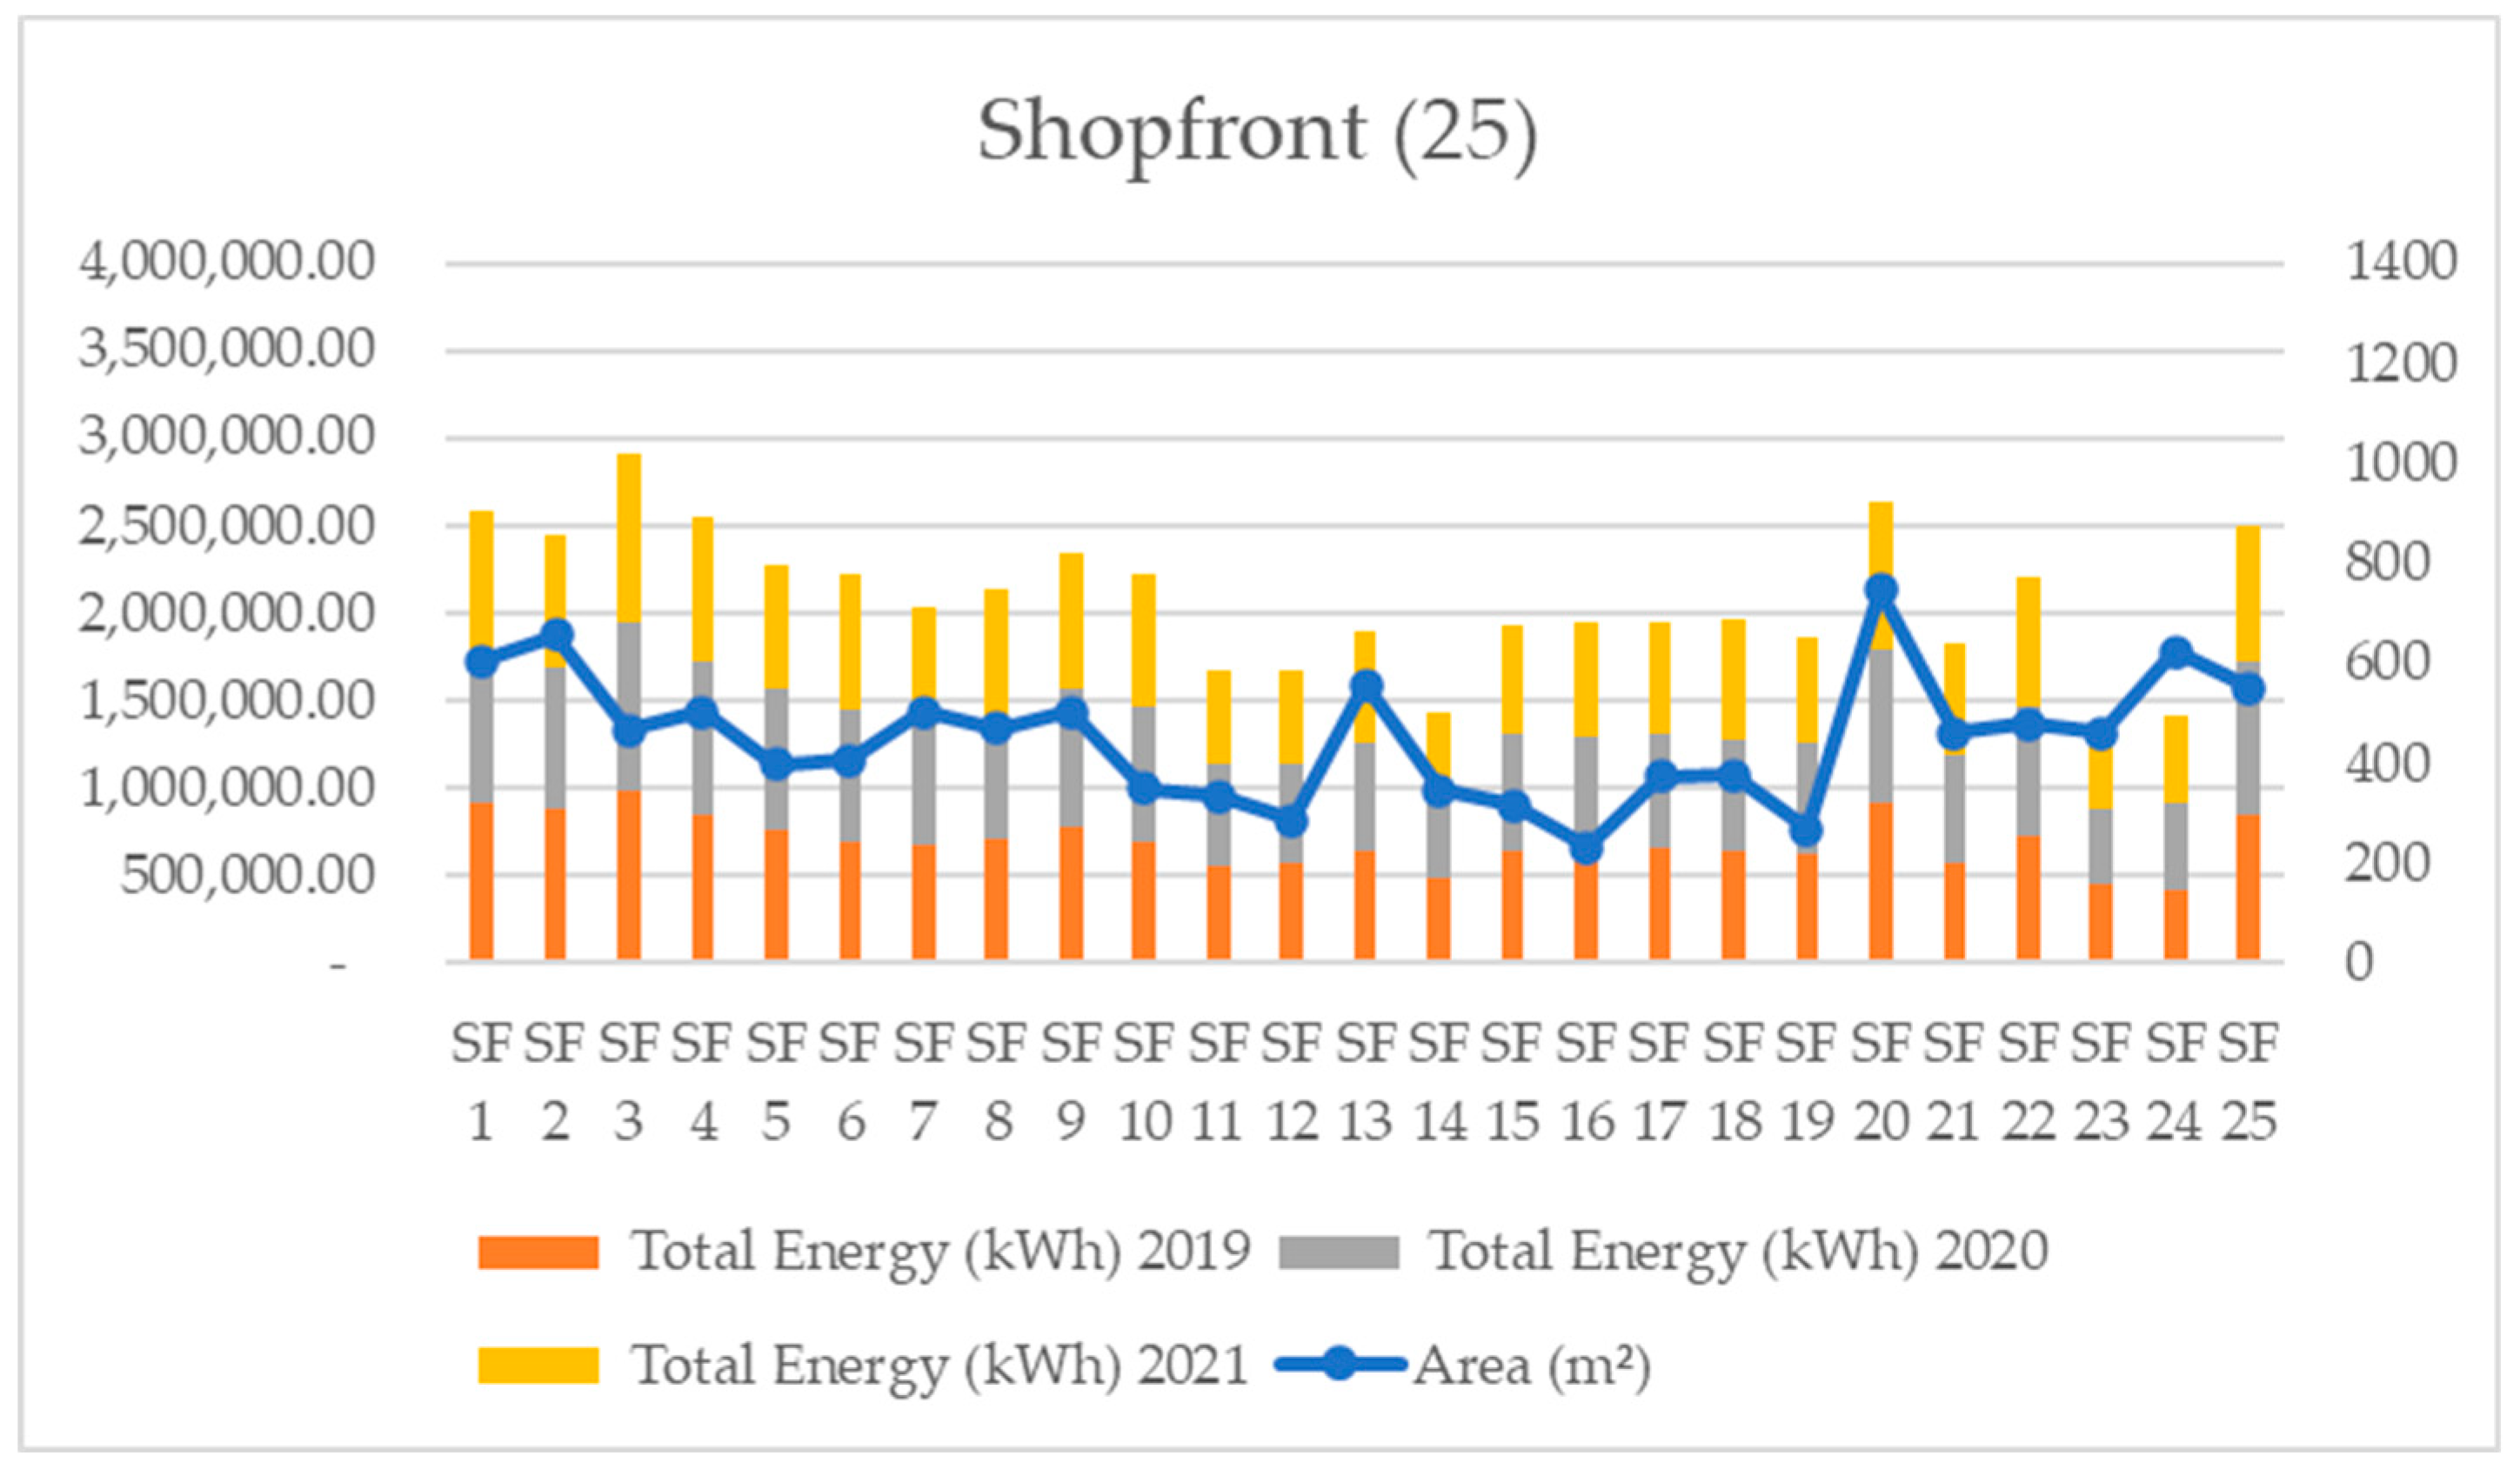
- Shopfront = 25
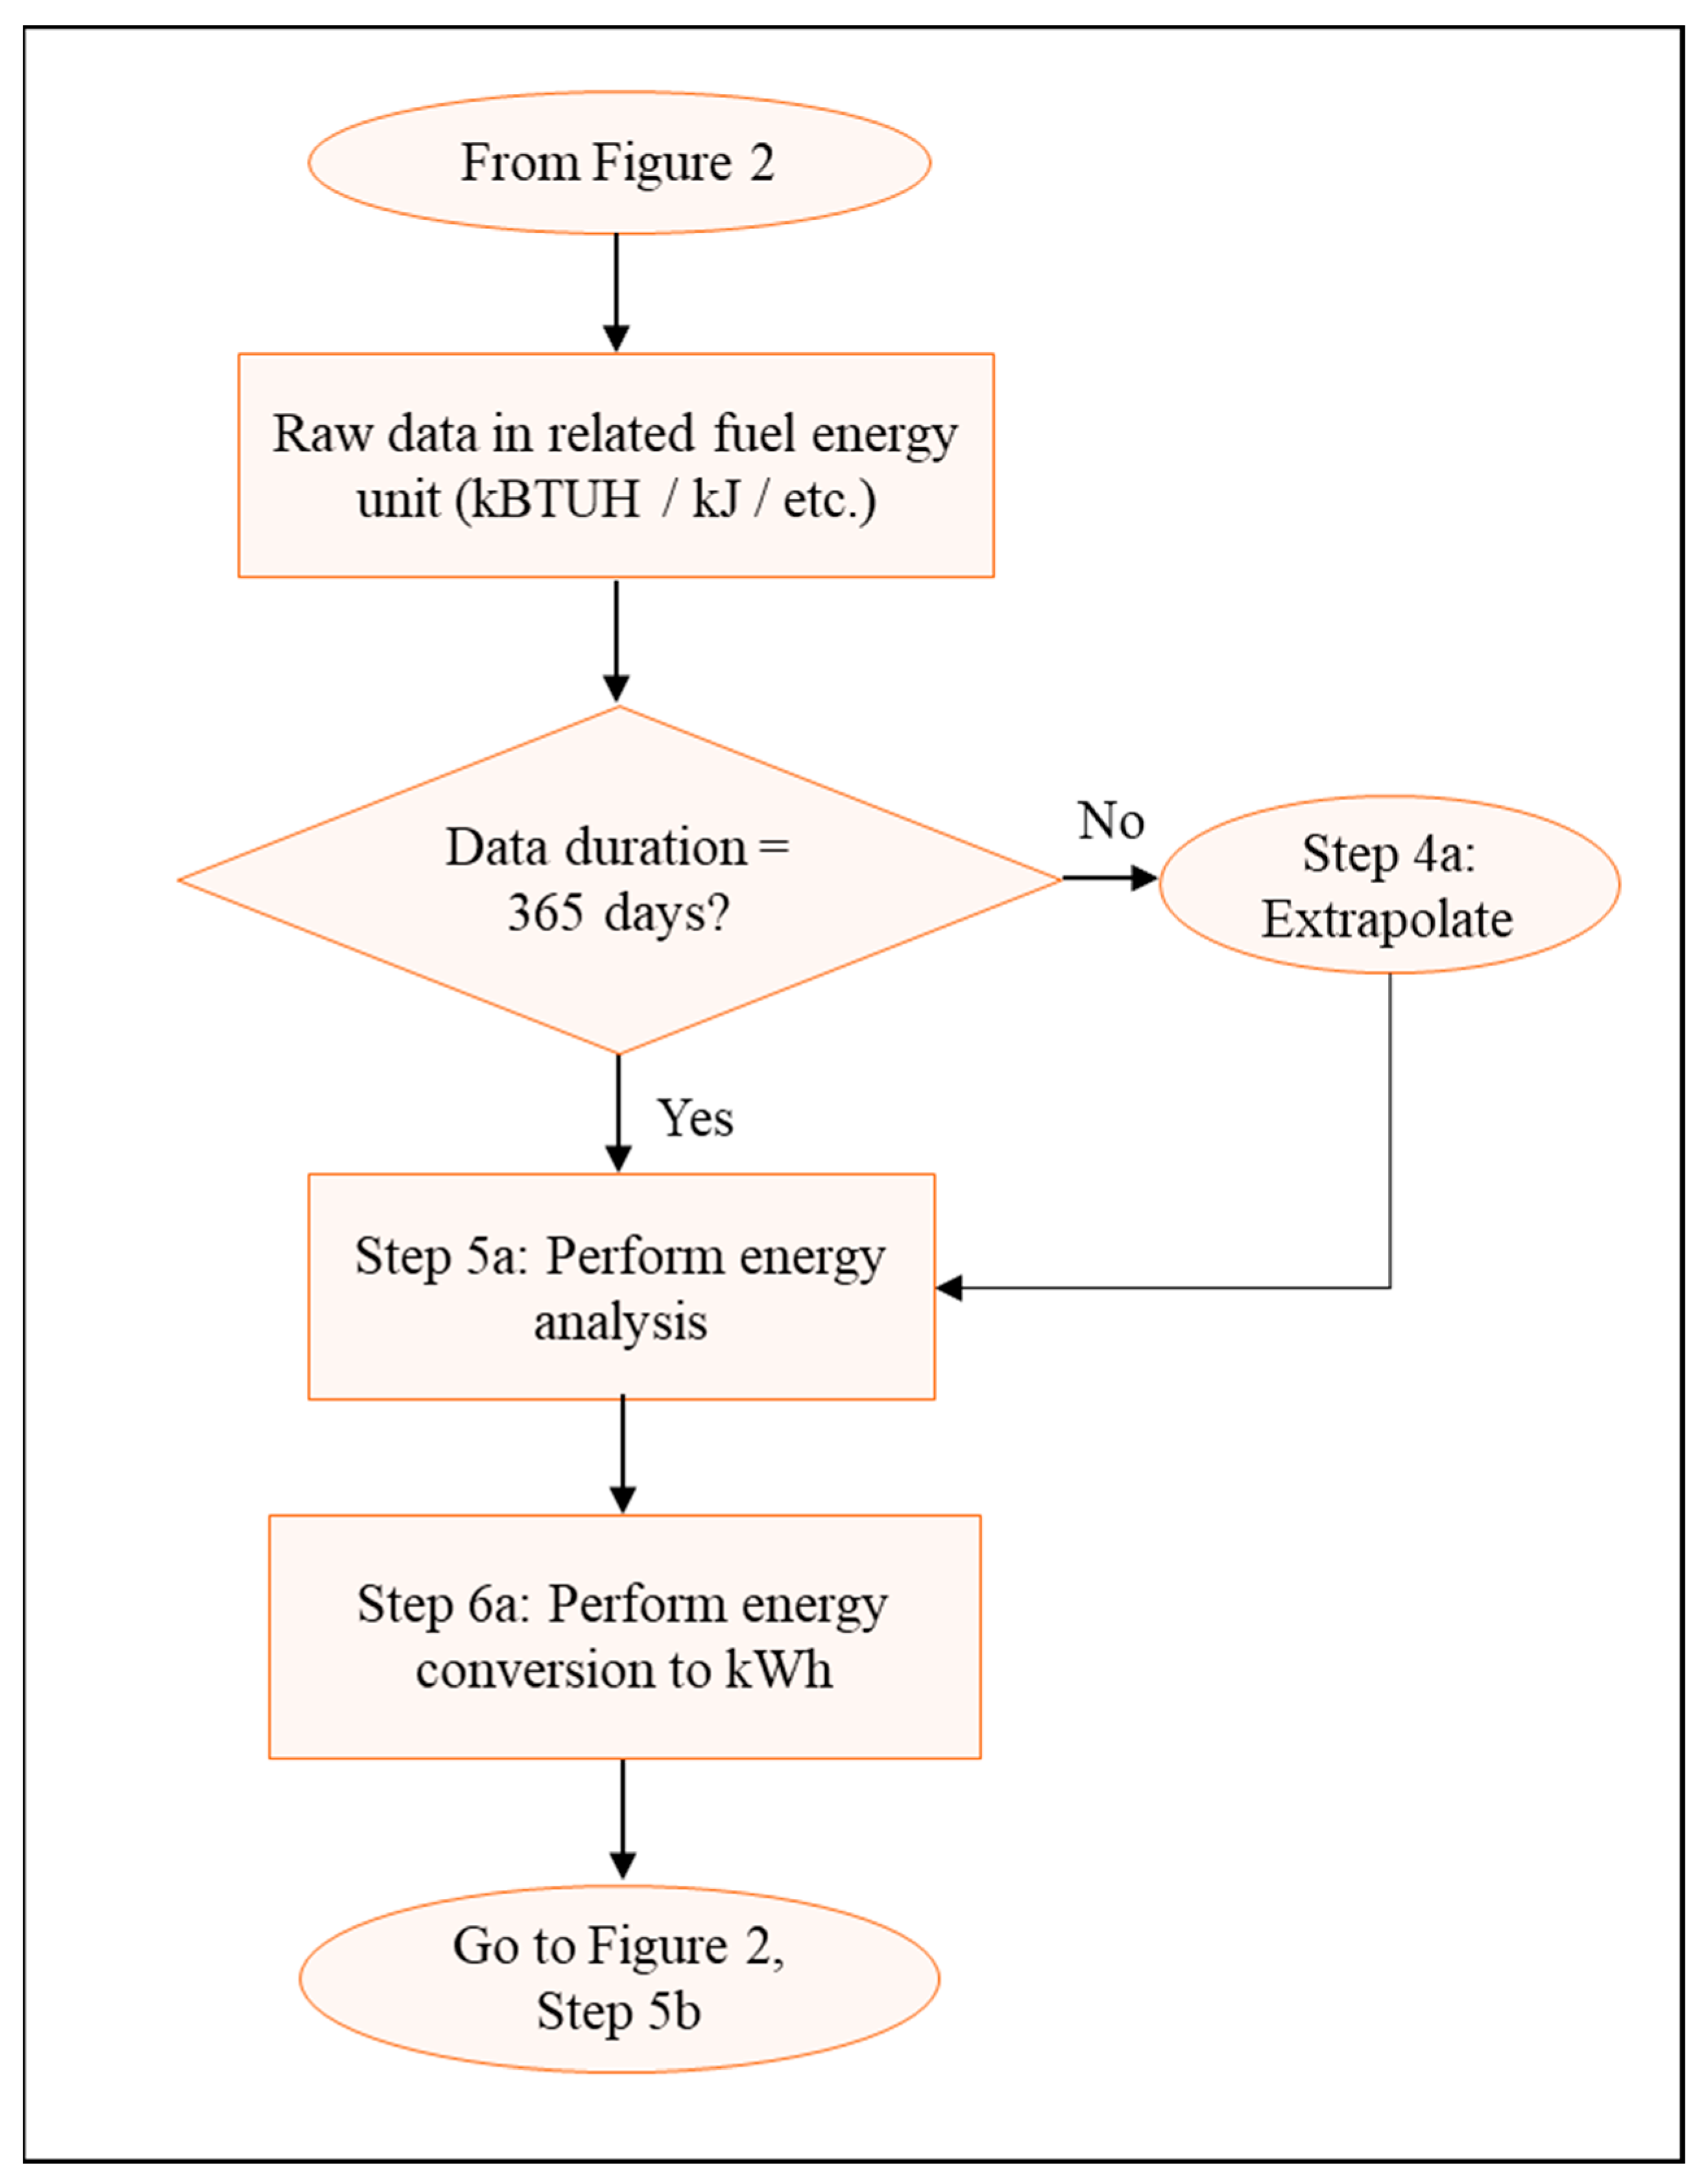
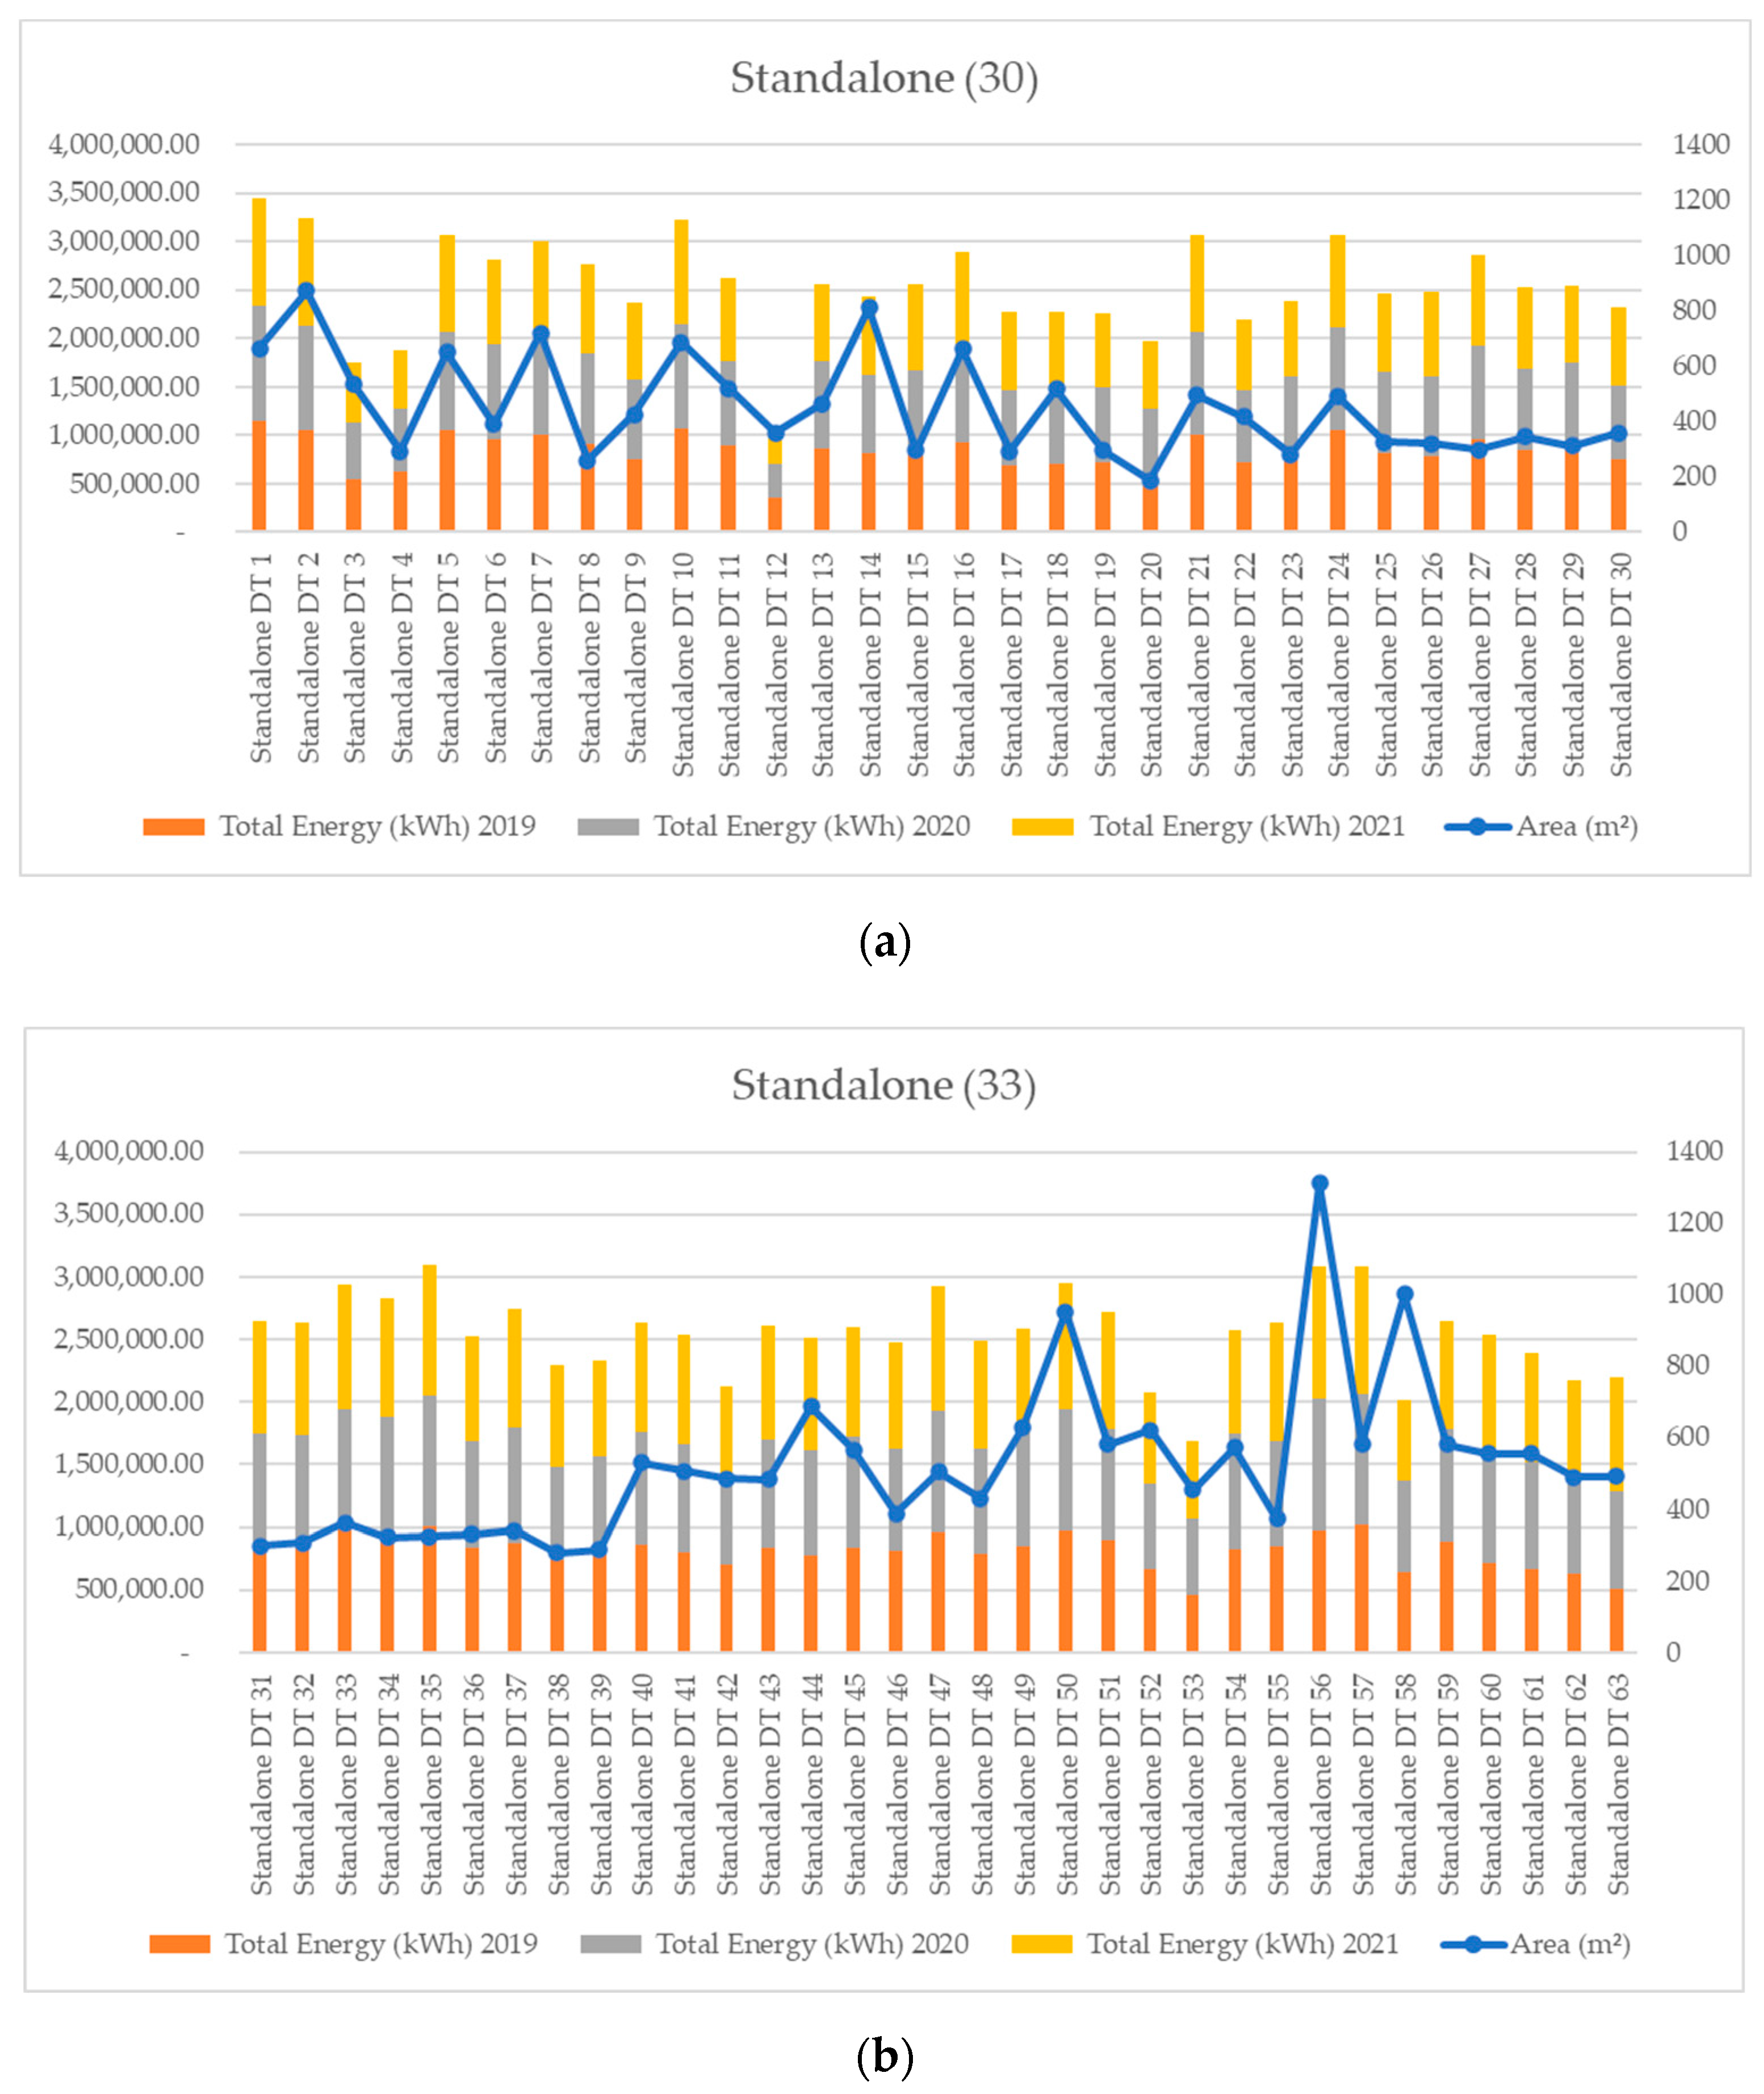
- Standalone entity = 63
- 1 kg LPG: 46,452 BTUH
- 1 kg LPG: 13.6 kWh
- 1 kWh: 0.074 kg LPG
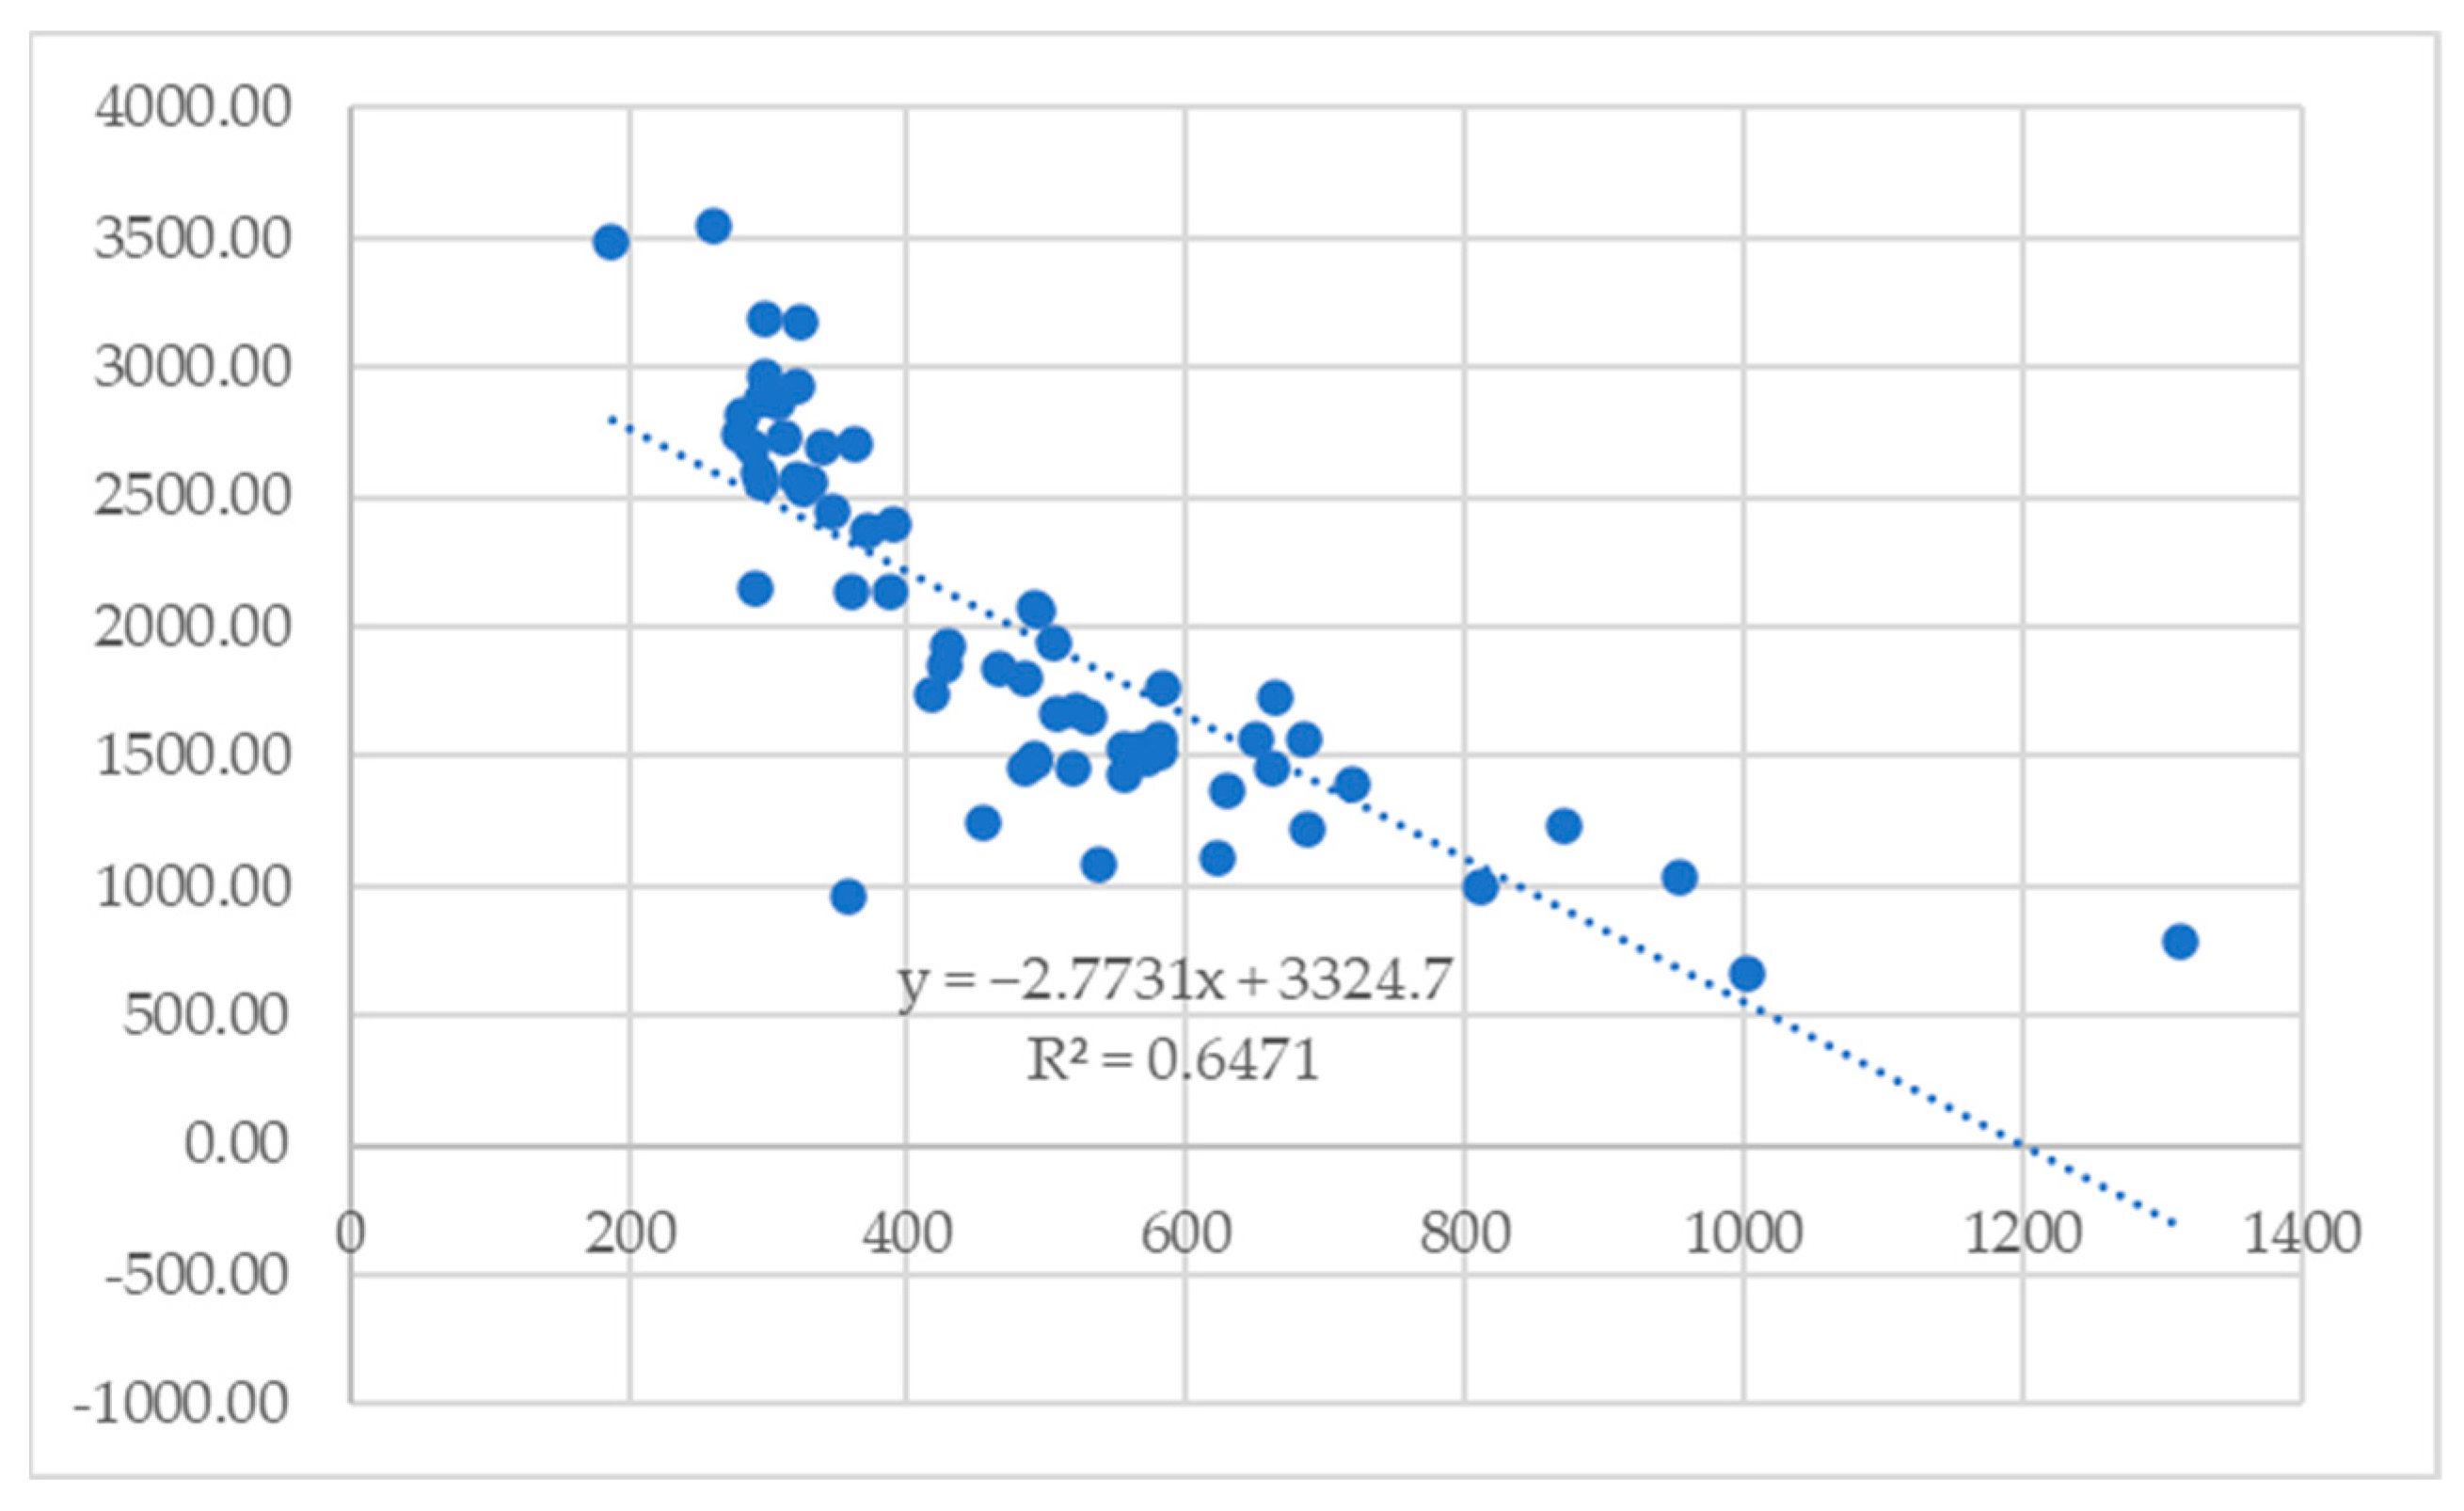
- Interpretability: Linear regression provided clear insights into how the area of a building might influence its BEI through easily interpretable coefficients.
- Efficiency: It was computationally efficient, making it suitable for large datasets.
- Inferential capability: Beyond mere prediction, it allowed for hypothesis testing to determine the statistical significance of the building’s area in predicting its BEI.
2.6. Feasibility of Solar Energy Integration on Restaurant Building
- Restaurants in malls:
- Restaurants in transport hubs:
- Restaurants in shopfronts:
- Restaurants with oil alliances:
- Standalone restaurants:
2.7. Mathematical Formulation
2.7.1. Energy Analysis
2.7.2. Economic Analysis
2.7.3. Environment Analysis

3. Results and Discussion
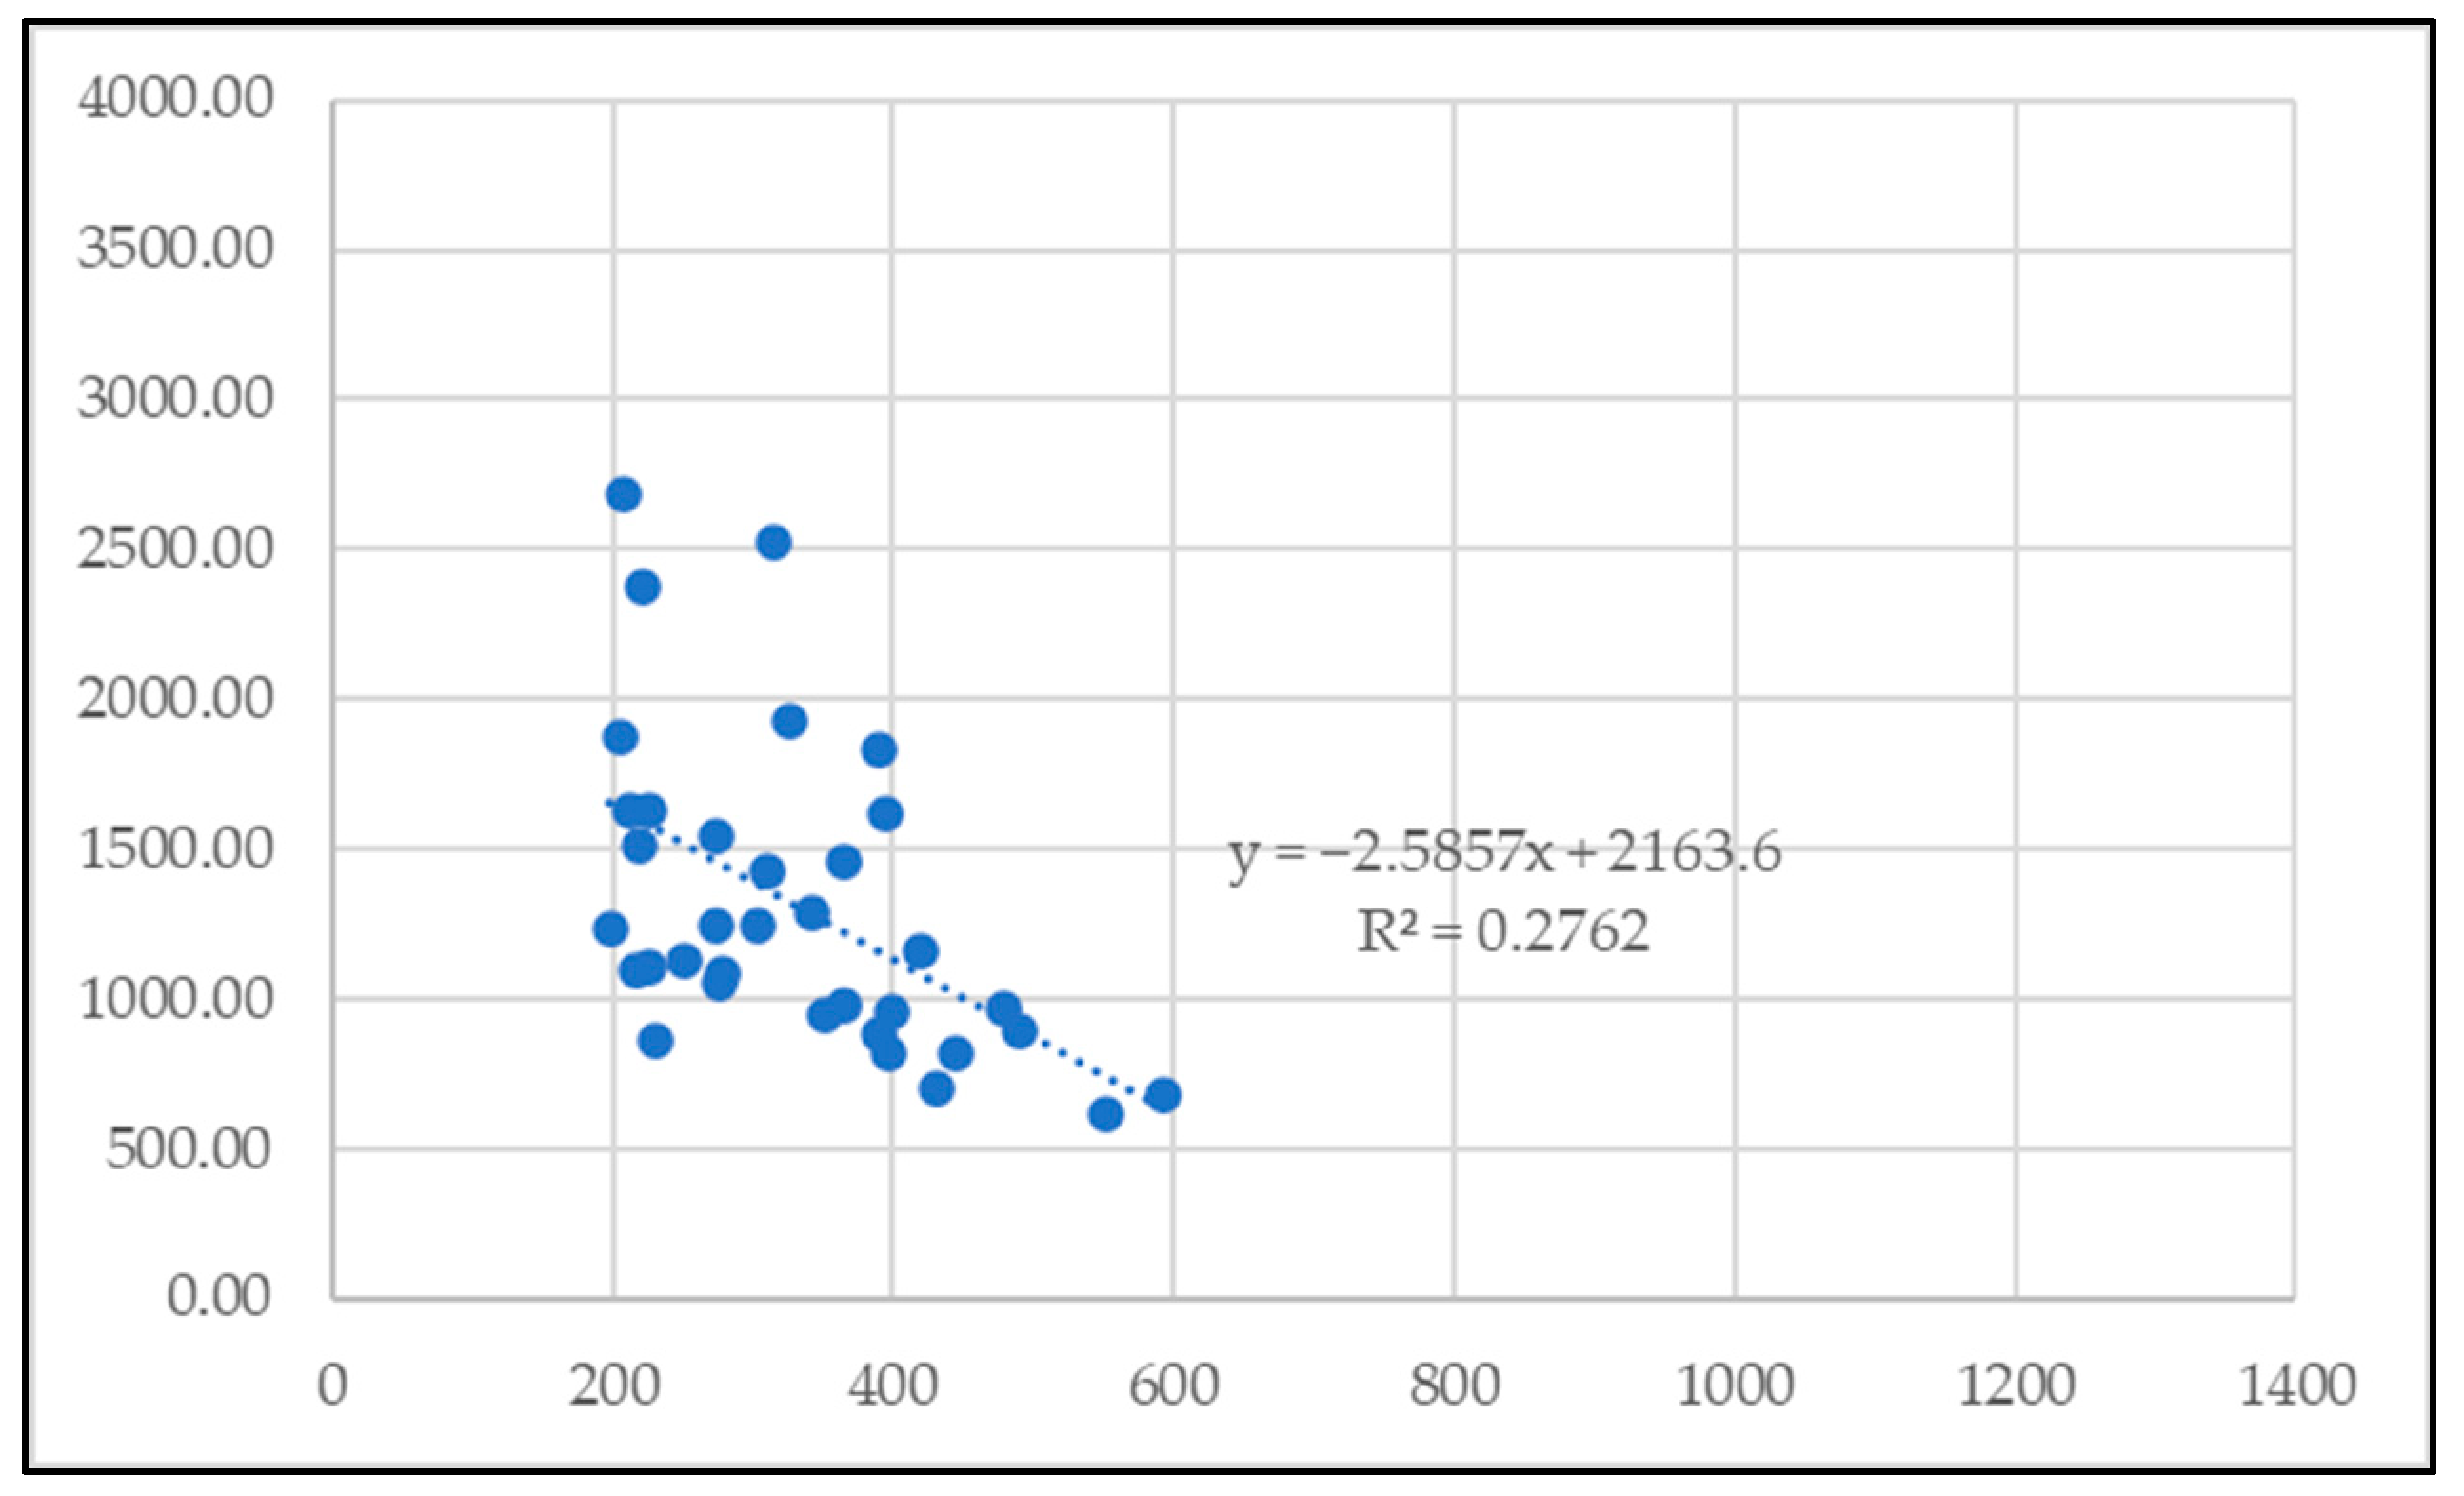
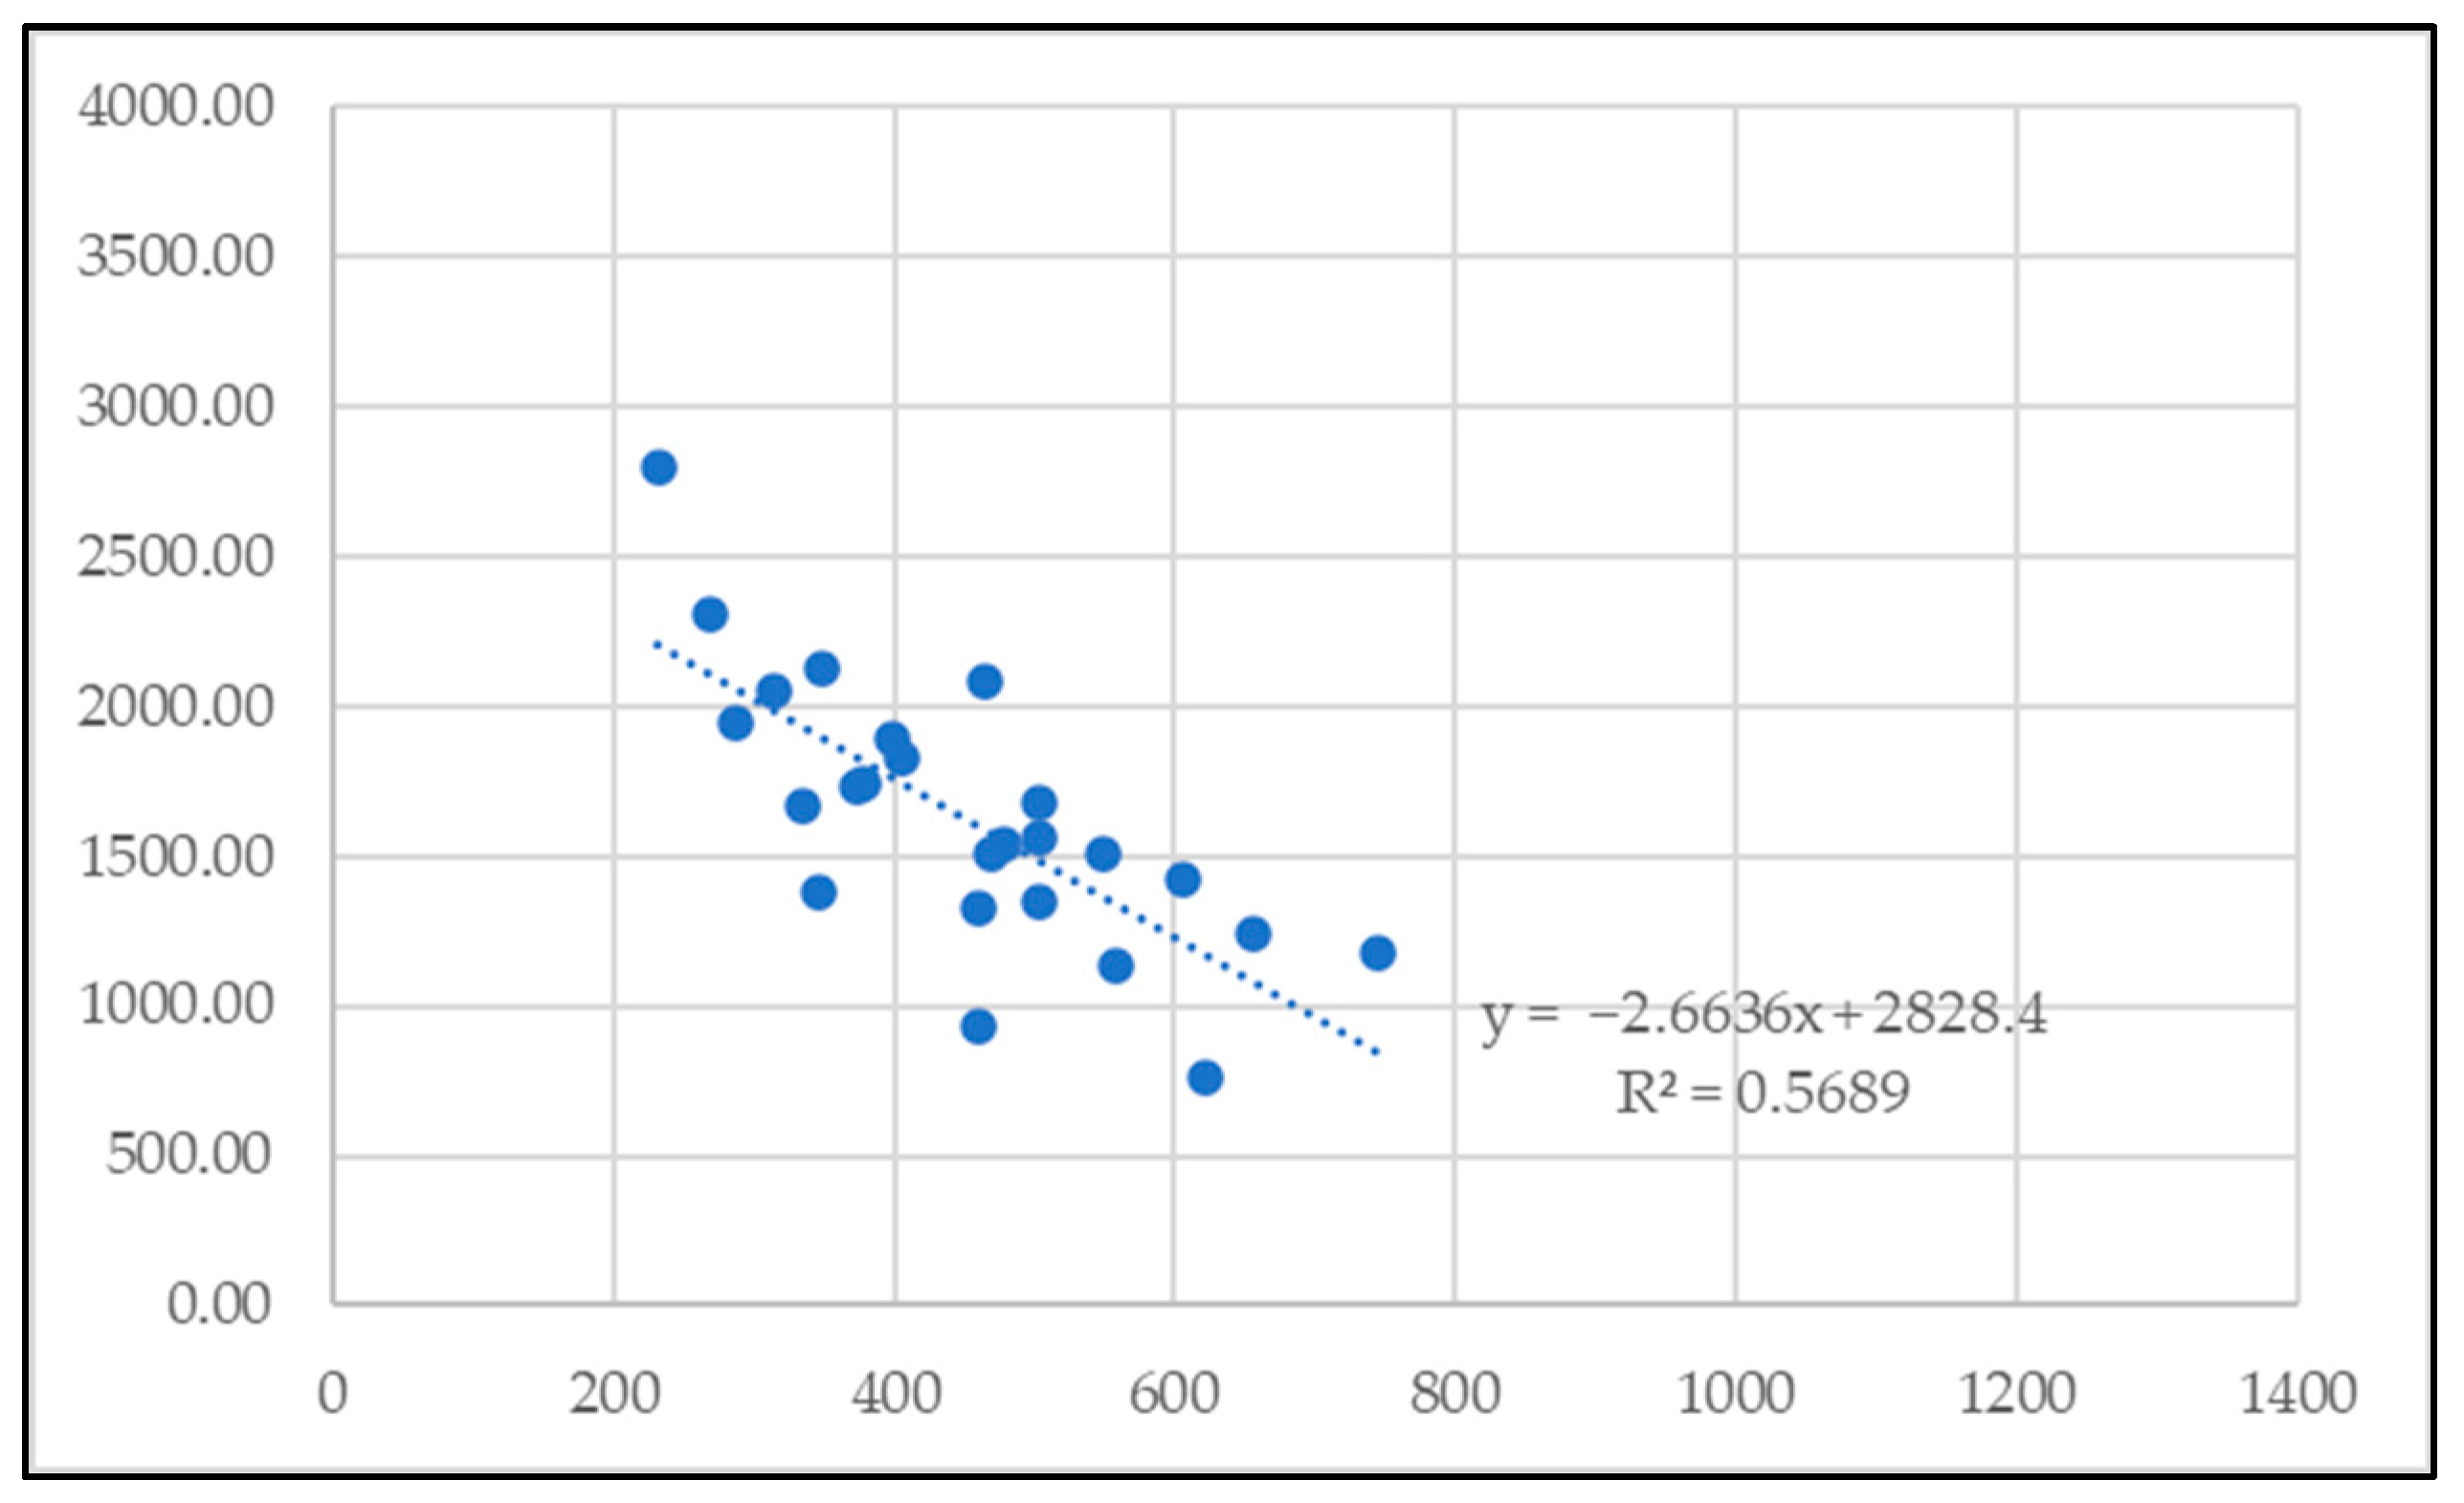
3.1. BEI Analysis
3.2. Energy Analysis
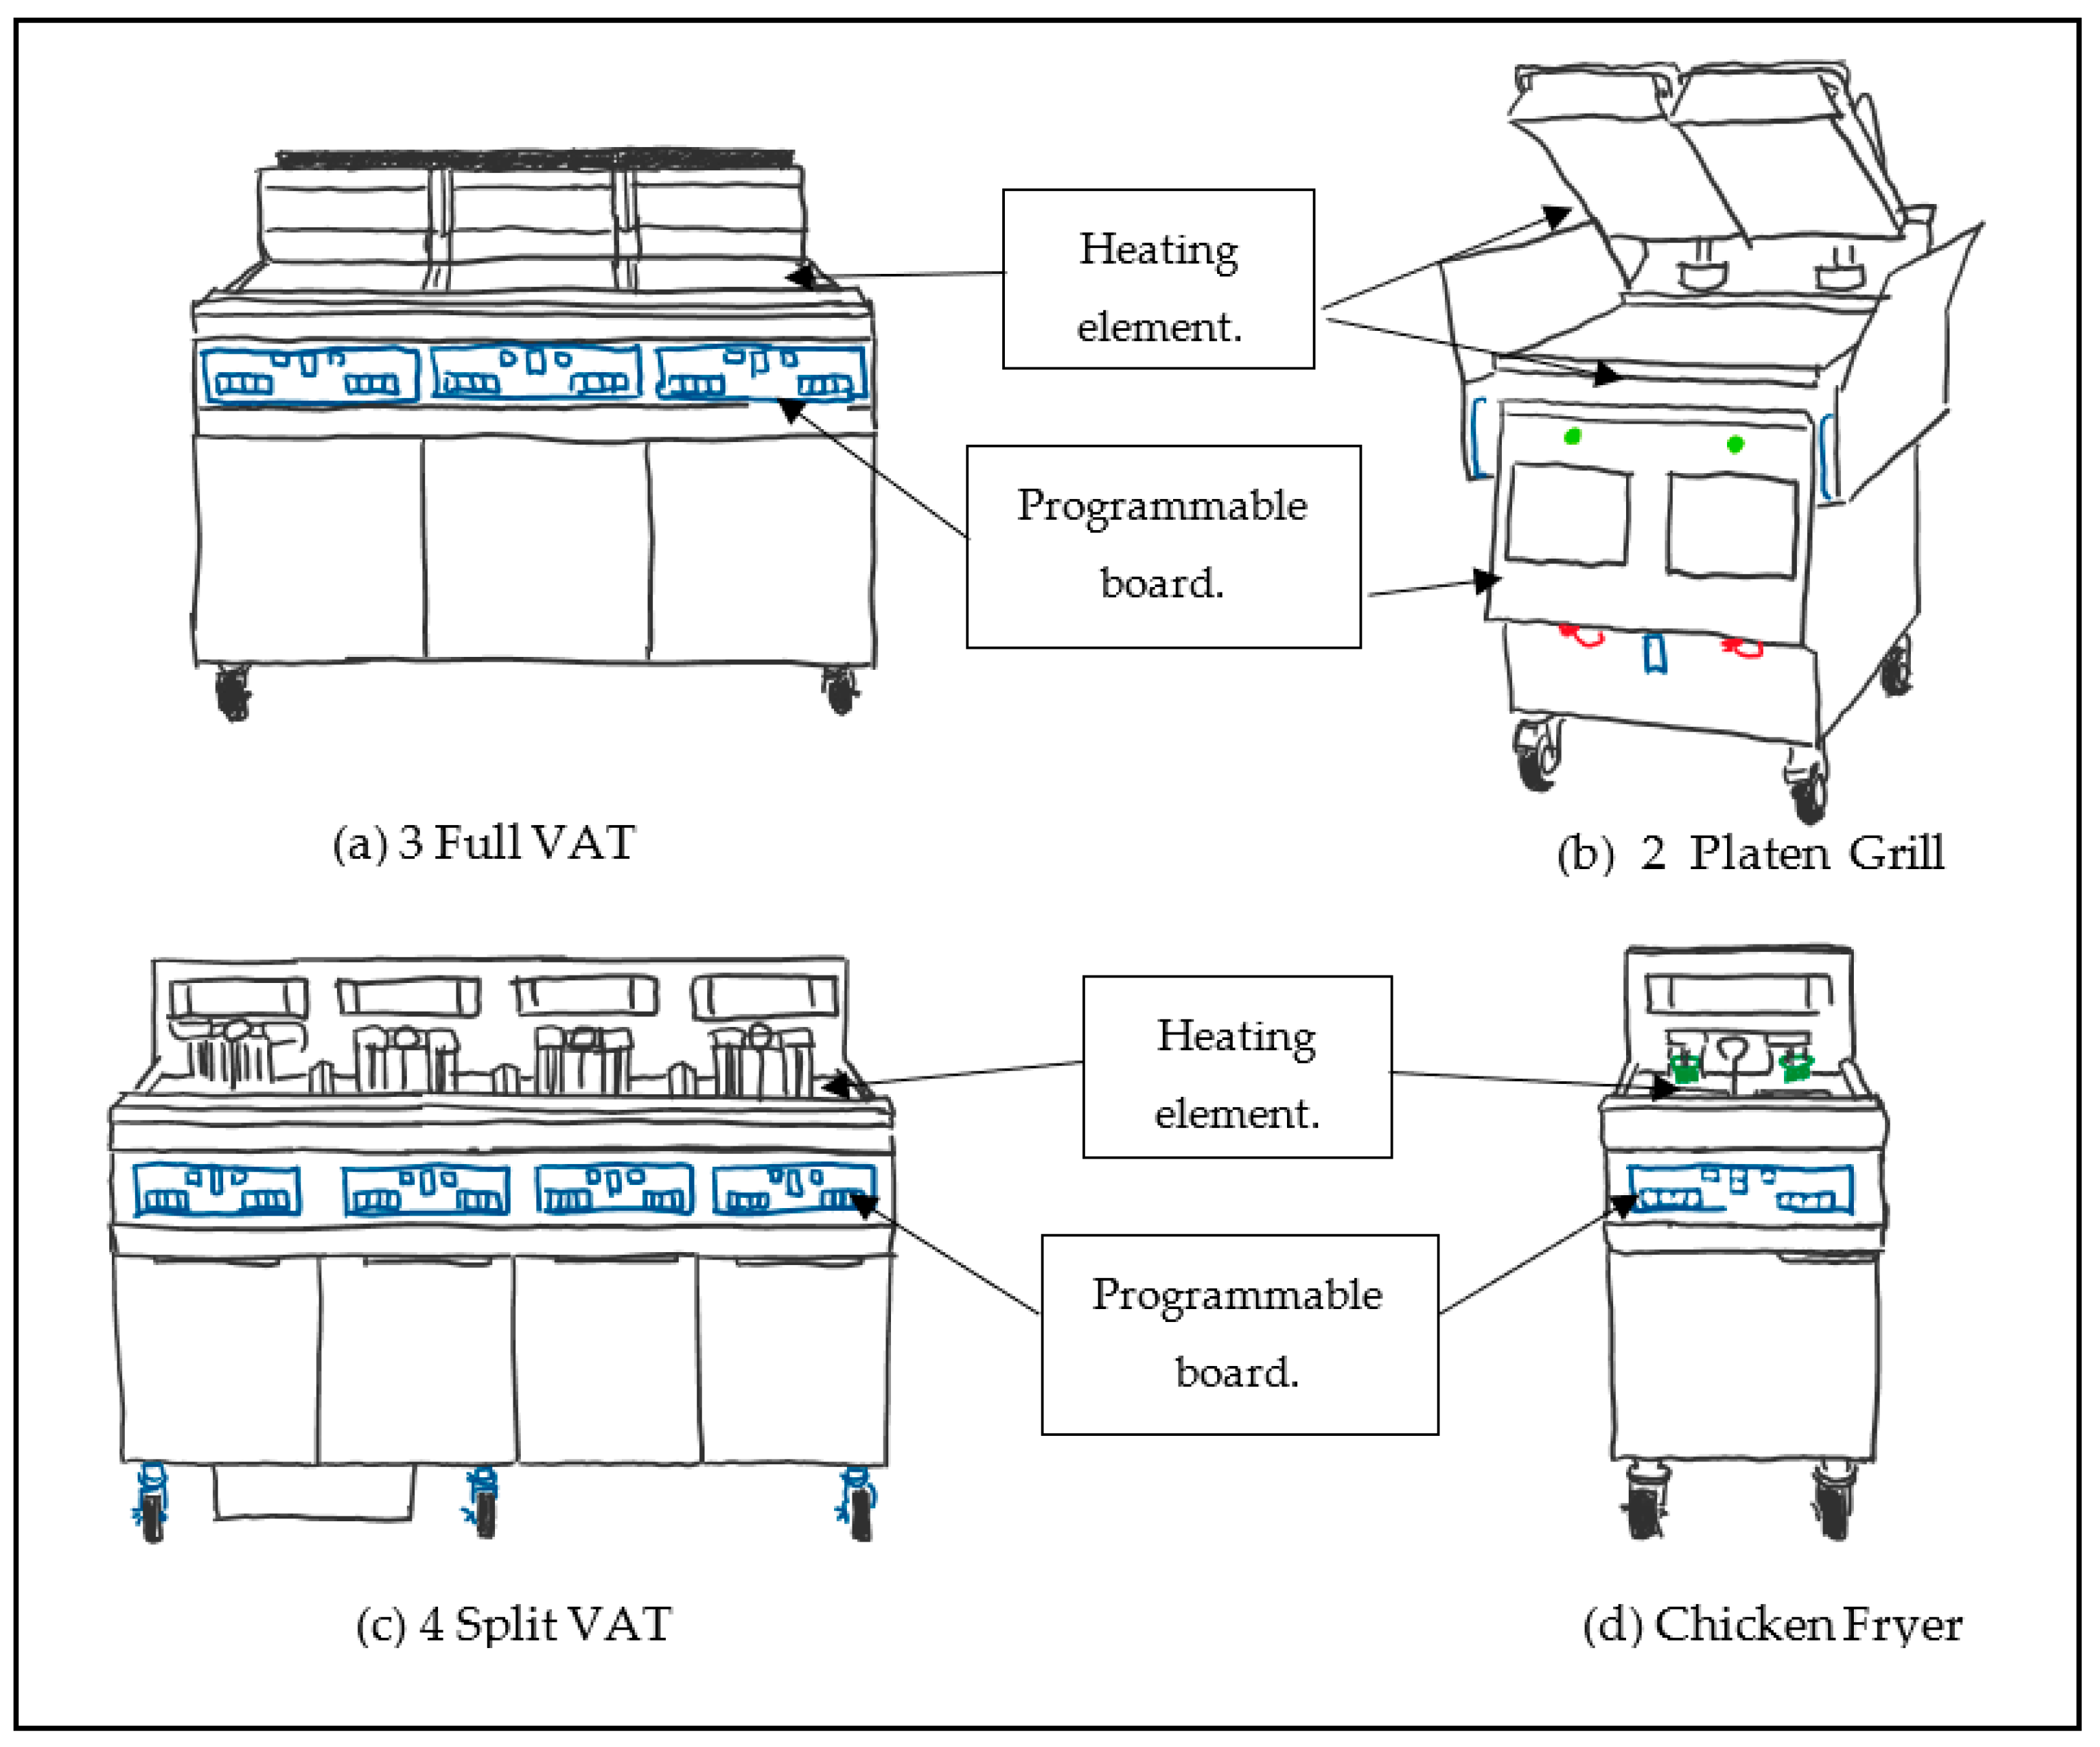
3.2.1. Equipment
- The 4 Split Vat Fryer and Chicken Fryer were the largest energy consumers, registering at 2,145,300 kBTUH/y.
- The 3 Full Vat Fryers consumed 1,608,975 kBTUH/y.
- The grill had a consumption of 572,080 kBTUH/y.
- The 4 Split Vat Fryer topped the list with 400,560 kWh/y.
- The Chicken Fryer followed closely at 364,701 kWh/y.
- The 3 Full Vat was next at 300,342 kWh/y.
- The Grill, comparatively, consumed the least, at 157,322 kWh/y.
- Grill: An LPG grill consumed 34% more energy than its electrical counterpart.
- Chicken Fryer: The disparity was most prominent here, with the LPG chicken fryer consuming 42% more energy than the electrical variant.
- The 3 Full Vat Fryers and 4 Split Vat Fryers: These LPG fryers consumed 37% more energy than the electric versions.
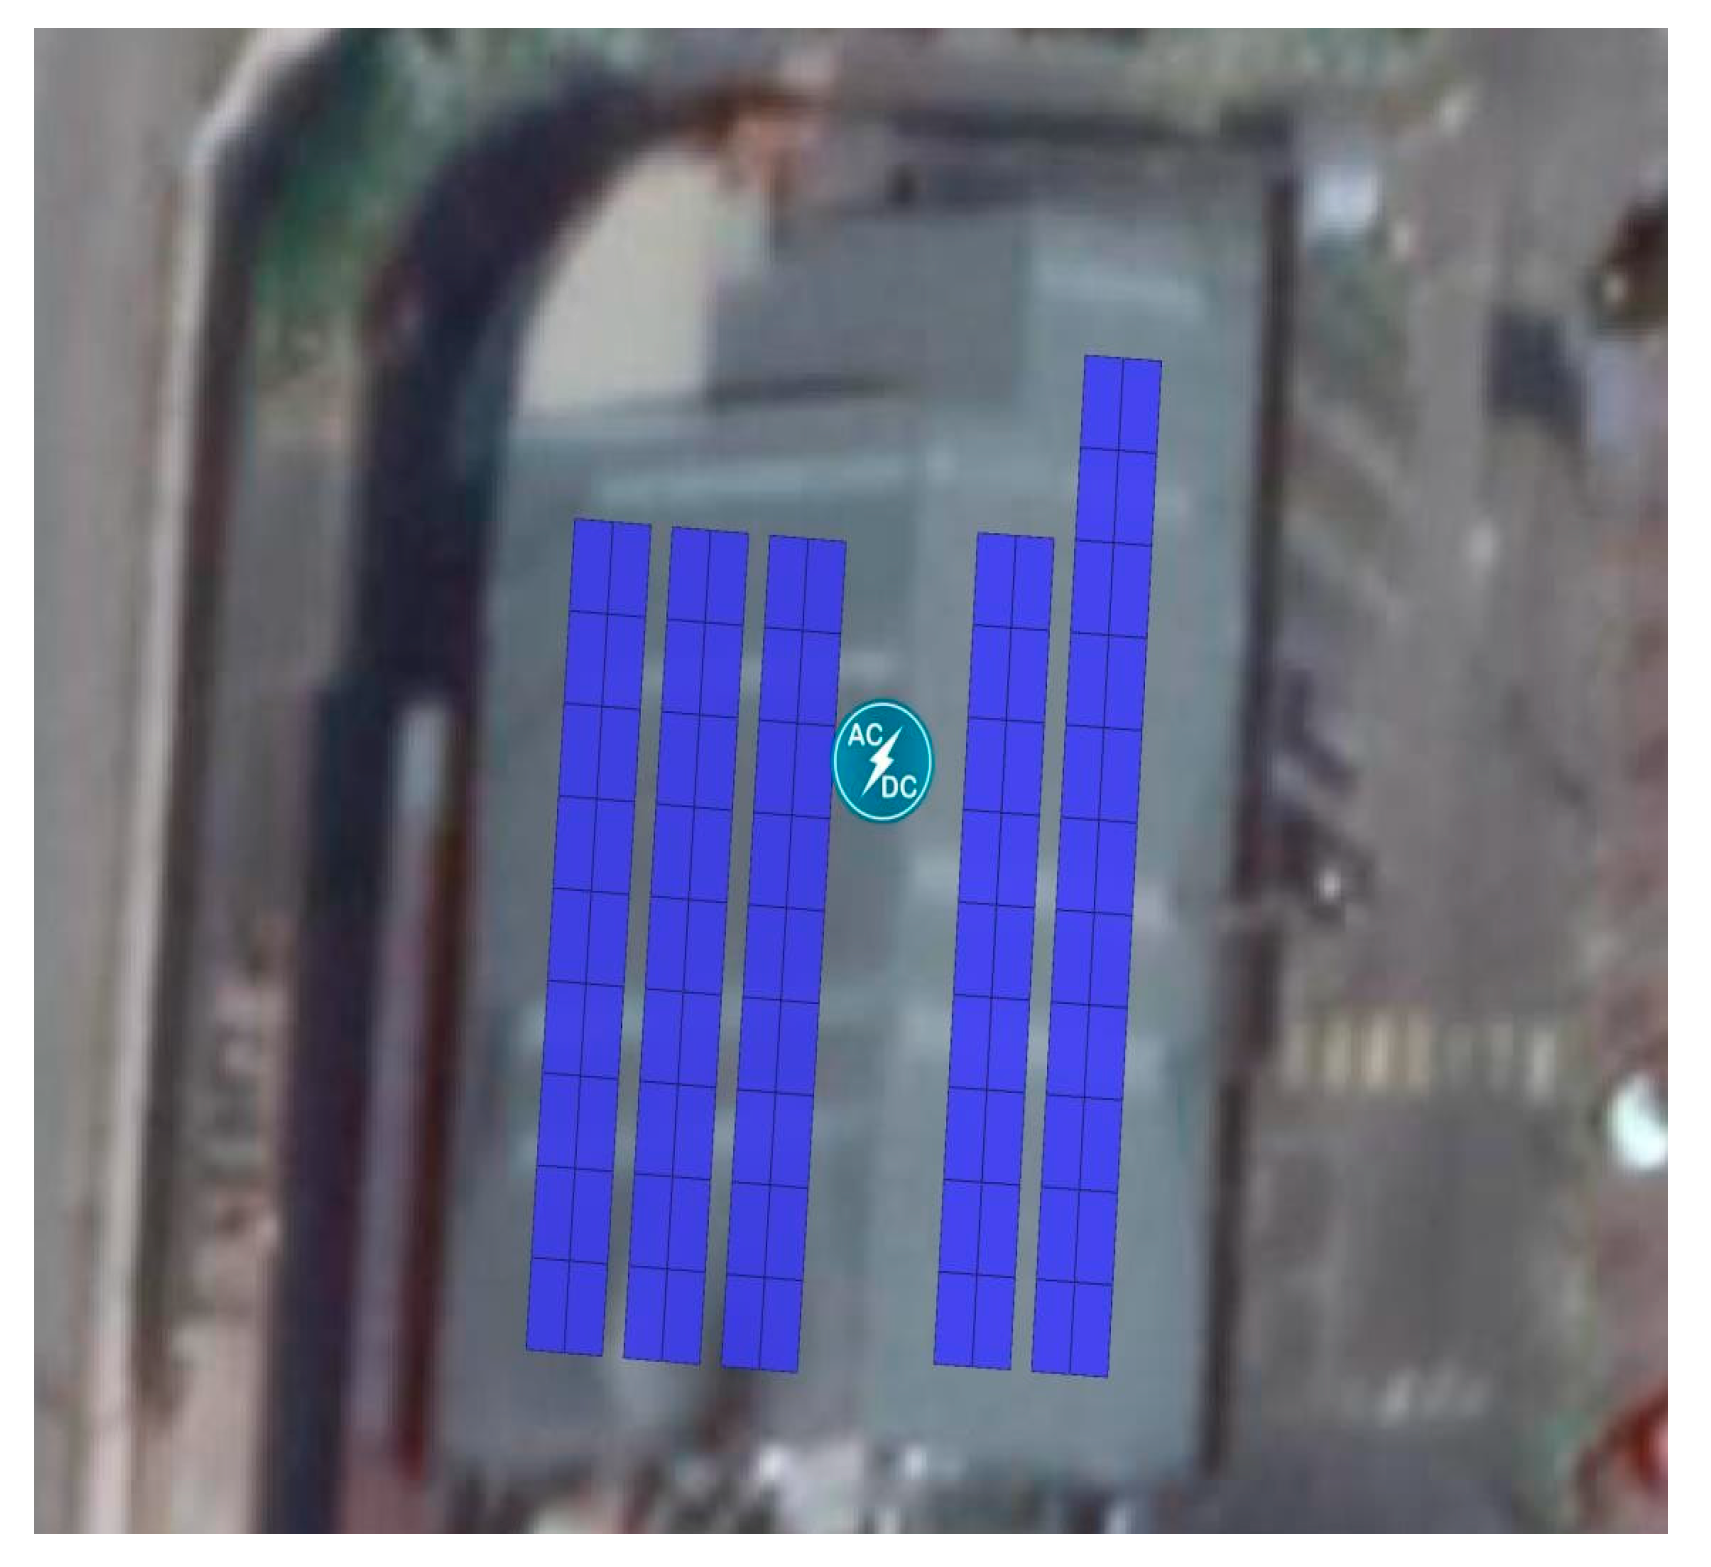
3.2.2. Solar PV Integration
3.3. Economic Analysis
3.3.1. Equipment
3.3.2. Solar PV Integration
3.4. Environmental Assessment
3.4.1. Equipment
3.4.2. Solar PV Integration
3.5. Solar Energy as Cooking Fuel
3.6. Potential Research Extension
- Innovations in Energy Efficiency for Restaurants:
- 2.
- Enhancing Renewable Energy Use in Restaurants:
- 3.
- Understanding Human and Operational Energy Consumption Influences:
4. Conclusions
Author Contributions
Funding
Data Availability Statement
Acknowledgments
Conflicts of Interest
Nomenclature
| AEC | Annual energy consumption (kWh) of equipment a in MWh |
| AGC | Annual LPG consumption of equipment a in kBTUH |
| BEI | Building energy index |
| BTU | British Thermal Unit |
| BTUH | British Thermal Unit per hour |
| Ca | Capacity of equipment a in kW |
| CFL | Compact fluorescent |
| DF | Degradation factor |
| ECM | Energy conservation measure |
| Total emission for the unit of electricity generation (ton) | |
| The electricity production in the year I (kWh) | |
| The fossil fuel emission for a unit of electricity generation of fuel type | |
| GHG | Greenhouse gas |
| HEM | High efficiency motor |
| kg | Kilogram |
| kgCO | Kilogram of carbon monoxide equivalent |
| kgCO2 | Kilogram of carbon dioxide equivalent |
| kgSO2 | Kilogram of sulfur dioxide equivalent |
| kW | Kilo Watt |
| kWh | Kilo Watt hour |
| LED | Light emitting diode |
| LF | Load factor = 1 |
| LPG | Liquified petroleum gas |
| Percentage of electricity generation in the year I of fuel type n | |
| PV | Photovoltaic |
| Qty | Quantity |
| RE | Renewable energy |
| RM | Ringgit Malaysia |
| UHy | Yearly usage hours of equipment a |
| VSD | Variable speed drive |
| Xa | Capacity of equipment a in kBTUH |
References
- Su, Y.; Miao, Z.; Wang, L.; Wang, L. Energy consumption and indoor environment evaluation of large irregular commercial green building in Dalian, China. Energy Build. 2022, 276, 112506. [Google Scholar] [CrossRef]
- Gunasegaran, M.K.; Hasanuzzaman, M.; Tan, C.; Bakar, A.H.A.; Ponniah, V. Energy Analysis, Building Energy Index and Energy Management Strategies for Fast-Food Restaurants in Malaysia. Sustainability 2022, 14, 13515. [Google Scholar] [CrossRef]
- Spudys; Jurelionis, A.; Fokaides, P. Conducting smart energy audits of buildings with the use of building information modelling. Energy Build. 2023, 285, 112884. [Google Scholar] [CrossRef]
- Popescu, D.; Bienert, S.; Schützenhofer, C.; Boazu, R. Impact of energy efficiency measures on the economic value of buildings. Appl. Energy 2012, 89, 454–463. [Google Scholar] [CrossRef]
- Gao, J.; Duan, C.; Song, J.; Ma, L.; Cai, W. PM2.5 can help adjust building’s energy consumption. J. Environ. Manag. 2023, 331, 117235. [Google Scholar] [CrossRef]
- Abdul, M.; Farheen, B. Energy-saving potential and cost-effectiveness of active energy-efficiency measures for residential building in warm-humid climate. Energy Sustain. Dev. 2022, 67, 163–176. [Google Scholar] [CrossRef]
- Calise, F.; Cappiello, F.L.; d’Accadia, M.D.; Vicidomini, M. Energy efficiency in small districts: Dynamic simulation and technoeconomic analysis. Energy Convers. Manag. 2020, 220, 113022. [Google Scholar] [CrossRef]
- Bingham, R.D.; Agelin-Chaab, M.; Rosen, M.A. Whole building optimization of a residential home with PV and battery storage in The Bahamas. Renew. Energy 2019, 132, 1088–1103. [Google Scholar] [CrossRef]
- Al Rashdi, S.A.; Sudhir, C.V.; Basha, J.S.; Saleel, C.A.; Soudagar, M.E.M.; Yusuf, A.A.; El-Shafay, A.S.; Afzal, A. A case study on the electrical energy auditing and saving techniques in an educational institution (IMCO, Sohar, Oman). Case Stud. Therm. Eng. 2022, 31, 101820. [Google Scholar] [CrossRef]
- Shapi, M.K.M.; Ramli, N.A.; Awalin, L.J. Energy consumption prediction by using machine learning for smart building: Case study in Malaysia. Dev. Built Environ. 2021, 5, 100037. [Google Scholar] [CrossRef]
- Al-Saadi, S.N.; Ramaswamy, M.; Al-Rashdi, H.; Al-Mamari, M.; Al-Abri, M. Energy Management Strategies for a Governmental Building in Oman. Energy Procedia 2017, 141, 206–210. [Google Scholar] [CrossRef]
- Saidur, R.; Rahim, N.A.; Ping, H.W.; Jahirul, M.I.; Mekhilef, S.; Masjuki, H.H. Energy and emission analysis for industrial motors in Malaysia. Energy Policy 2009, 37, 3650–3658. [Google Scholar] [CrossRef]
- Saidur, R. Energy consumption, energy savings, and emission analysis in Malaysian office buildings. Energy Policy 2009, 37, 4104–4113. [Google Scholar] [CrossRef]
- Saidur, R.; Hasanuzzaman, M.; Yogeswaran, S.; Mohammed, H.A.; Hossain, M.S. An end-use energy analysis in a Malaysian public hospital. Energy 2010, 35, 4780–4785. [Google Scholar] [CrossRef]
- Saidur, R.; Mekhilef, S. Energy use, energy savings and emission analysis in the Malaysian rubber producing industries. Appl. Energy 2010, 87, 2746–2758. [Google Scholar] [CrossRef]
- Saidur, R.; Hasanuzzaman, M.; Mahlia, T.M.I.; Rahim, N.A.; Mohammed, H.A. Chillers energy consumption, energy savings and emission analysis in an institutional buildings. Energy 2011, 36, 5233–5238. [Google Scholar] [CrossRef]
- Sher, F.; Kawai, A.; Güleç, F.; Sadiq, H. Sustainable energy saving alternatives in small buildings. Sustain. Energy Technol. Assess. 2019, 32, 92–99. [Google Scholar] [CrossRef]
- Ali, S.B.M.; Hasanuzzaman, M.; Rahim, N.A.; Mamun, M.A.A.; Obaidellah, U.H. Analysis of energy consumption and potential energy savings of an institutional building in Malaysia. Alex. Eng. J. 2021, 60, 805–820. [Google Scholar]
- Singh, J.; Velu, V.; Shafeek, M.A.; Nirmal, U. A Review on Building Energy Index (BEI) in Different Green Government Buildings (GGBs) in Malaysia. Malays. J. Sci. Adv. Technol. 2021, 1, 46–56. [Google Scholar] [CrossRef]
- Dahlan, N.Y.; Mohamed, H.; Kamaluddin, K.A.; Abd Rahman, N.M.; Reimann, G.; Chia, J.; Ilham, N.I. Energy Star based benchmarking model for Malaysian Government hospitals—A qualitative and quantitative approach to assess energy performances. J. Build. Eng. 2022, 45, 103460. [Google Scholar] [CrossRef]
- Mustaffa, N.K.; Kudus, S.A. Challenges and way forward towards best practices of energy efficient building in Malaysia. Energy 2022, 259, 124839. [Google Scholar] [CrossRef]
- Energy Commission Malaysia. National Building Energy Intensity (BEI) Labelling for Government Building. 2019 07/02/2019. Available online: https://www.st.gov.my/contents/files/download/97/20190207_Pamphlet_BEI_Labelling2.pdf (accessed on 1 September 2023).
- Nazi, W.I.W.; Wang, Y.D.; Roskilly, T. Methodologies to Reduce Cooling Load using Heat Balance Analysis: A Case Study in an Office Building in a Tropical Country. Energy Procedia 2015, 75, 1269–1274. [Google Scholar] [CrossRef]
- Malaysia Investment Development Authority. Food Industry in Malaysia; Malaysia Investment Development Authority: Kuala Lumpur, Malaysia, 2018; p. 4.
- Economy Malaysia’s F&B Establishments Show Steady Growth. In The Star Online; The Star: Petaling Jaya, Malaysia, 2017.
- Wei-Shen, W. 500 McDonald’s outlets by 2020. In The Star—Business News; The Star Online: Petaling Jaya, Malaysia, 2013. [Google Scholar]
- Ilham, N.I.; Dahlan, N.Y.; Hussin, M.Z.; Sintuya, H.; Setthapun, W. An optimal compensation schemes decision framework for solar PV distributed generation trading: Assessing economic and energy used for prosumers in Malaysia. Energy Rep. 2022, 8, 536–544. [Google Scholar] [CrossRef]
- Hwang, R.-L.; Chen, W.-A. Identifying relative importance of solar design determinants on office building façade for cooling loads and thermal comfort in hot-humid climates. Build. Environ. 2022, 226, 109684. [Google Scholar] [CrossRef]
- Sedaghat, A.; Sabati, M.; Alkhatib, F.; Oloomi, S.A.A.; Sabri, F.; Salem, H.; Zafar, W.J.; Malayer, M.A. Climate change and thermo-solar patterns of office buildings with/without window films in extreme hot-arid climate of Kuwait. Sol. Energy 2021, 217, 354–374. [Google Scholar] [CrossRef]
- Qahtan, A.M. Thermal performance of a double-skin façade exposed to direct solar radiation in the tropical climate of Malaysia: A case study. Case Stud. Therm. Eng. 2019, 14, 100419. [Google Scholar] [CrossRef]
- Gutierrez, L.; Williams, E. Co-alignment of comfort and energy saving objectives for U.S. office buildings and restaurants. Sustain. Cities Soc. 2016, 27, 32–41. [Google Scholar] [CrossRef]
- Malaysia Green Technology Corporation; Sustainable Energy Development Authority. Method to Identify Building Energy Index (BEI), NET BEI, GFA, NFA, ACA; Building Consumption Input System: Shah Alam, Malaysia, 2013; pp. 1–7. [Google Scholar]
- Habib, M.A.; Hasanuzzaman, M.; Hosenuzzaman, M.; Salman, A.; Mehadi, M.R. Energy consumption, energy saving and emission reduction of a garment industrial building in Bangladesh. Energy 2016, 112, 91–100. [Google Scholar] [CrossRef]
- Shavalipour, A.; Hakemzadeh, M.H.; Sopian, K.; Mohamed Haris, S.; Zaidi, S.H. New Formulation for the Estimation of Monthly Average Daily Solar Irradiation for the Tropics: A Case Study of Peninsular Malaysia. Int. J. Photoenergy 2013, 2013, 174671. [Google Scholar] [CrossRef]
- Pitech. 4 Types of Solar System in Malaysia That Actually Work. 2020. Available online: https://pitech.com.my/types-of-solarsystem-in-malaysia/ (accessed on 1 September 2023).
- TNBX. 3 Easy Steps to Estimate Solar Size. 2020. Available online: https://www.tnbx.com.my/post/3-easy-steps-to-estimatesolar-size (accessed on 1 September 2023).
- Energy Commission Malaysia. Electricity Tariff Review in Peninsular Malaysia for Regulatory Period 2 (RP2: 2018–2020) under Incentive-Based Regulation (IBR) Mechanism; Energy Comission Malaysia: Putrajaya, Malaysia, 2018; pp. 1–42.
- KPDNHEP. Annual Report 2021; Kementerian Perdagangan Dalam Negeri dan Hal Ehwal Pengguna Putrajaya: Putrajaya, Malaysia, 2021; p. 151.
- Ruggiero, S.; De Masi, R.F.; Assimakopoulos, M.N.; Vanoli, G.P. Energy saving through building automation systems: Experimental and numerical study of a smart glass with liquid crystal and its control logics in summertime. Energy Build. 2022, 273, 112403. [Google Scholar] [CrossRef]
- Hoang, A.T.; Foley, A.M.; Nižetić, S.; Huang, Z.; Ong, H.C.; Ölçer, A.I.; Nguyen, X.P. Energy-related approach for reduction of CO2 emissions: A critical strategy on the port-to-ship pathway. J. Clean. Prod. 2022, 355, 131772. [Google Scholar] [CrossRef]
- Sandberg, N.H.; Næss, J.S.; Brattebø, H.; Andresen, I.; Gustavsen, A. Large potentials for energy saving and greenhouse gas emission reductions from large-scale deployment of zero emission building technologies in a national building stock. Energy Policy 2021, 152, 112114. [Google Scholar] [CrossRef]
- Hasanuzzaman, M.; Rahim, N.A.; Saidur, R.; Kazi, S.N. Energy savings and emissions reductions for rewinding and replacement of industrial motor. Energy 2011, 36, 233–240. [Google Scholar] [CrossRef]
- Energy Comission Malaysia (Ed.) Malaysia Energy Statistics Handbook 2020; Energy Comission Malaysia: Putrajaya, Malaysia, 2021; pp. 34–35.
- George, A.; Augustine, N. Analysis of the life-cycle costs and environmental impacts of cooking fuels used in Ghana. Appl. Energy 2012, 98, 301–306. [Google Scholar]
- Anozie, A.N.; Bakare, A.R.; Sonibare, J.A.; Oyebisi, T.O. Evaluation of cooking energy cost, efficiency, impact on air pollution and policy in Nigeria. Energy 2007, 32, 1283–1290. [Google Scholar] [CrossRef]
- Zublie, M.F.M.; Hasanuzzaman, M.; Rahim, N.A. Modeling, Energy Performance and Economic Analysis of Rooftop Solar Photovoltaic System for Net Energy Metering Scheme in Malaysia. Energies 2023, 16, 723. [Google Scholar] [CrossRef]
- Vengadesan, E.; Senthil, R. Experimental investigation of the thermal performance of a box type solar cooker using a finned cooking vessel. Renew. Energy 2021, 171, 431–446. [Google Scholar] [CrossRef]
- Singh, H.R.; Sharma, D.; Goyal, R.; Sharma, D.K.; Chadha, S. Study on some aspects of adoption of Solar Cooking System: A review. Mater. Today Proc. 2021, 47, 2994–3000. [Google Scholar] [CrossRef]
- Sagade, A.A.; Samdarshi, S.K.; Lahkar, P.J.; Sagade, N.A. Experimental determination of the thermal performance of a solar box cooker with a modified cooking pot. Renew. Energy 2020, 150, 1001–1009. [Google Scholar] [CrossRef]
- Coccia, G.; Aquilanti, A.; Tomassetti, S.; Comodi, G.; Di Nicola, G. Design, realization, and tests of a portable solar box cooker coupled with an erythritol-based PCM thermal energy storage. Sol. Energy 2020, 201, 530–540. [Google Scholar] [CrossRef]
- Arunachala, U.C.; Kundapur, A. Cost-effective solar cookers: A global review. Sol. Energy 2020, 207, 903–916. [Google Scholar] [CrossRef]
- Onokwai, A.O.; Okonkwo, U.C.; Osueke, C.O.; Okafor, C.E.; Olayanju, T.M.; Samuel, O.D. Design, modelling, energy and exergy analysis of a parabolic cooker. Renew. Energy 2019, 142, 497–510. [Google Scholar] [CrossRef]
- Noman, M.; Wasim, A.; Ali, M.; Jahanzaib, M.; Hussain, S.; Ali, H.M.K.; Ali, H.M. An investigation of a solar cooker with parabolic trough concentrator. Case Stud. Therm. Eng. 2019, 14, 100436. [Google Scholar] [CrossRef]
- Mendoza, J.M.F.; Gallego-Schmid, A.; Rivera, X.C.S.; Rieradevall, J.; Azapagic, A. Sustainability assessment of home-made solar cookers for use in developed countries. Sci. Total Environ. 2019, 648, 184–196. [Google Scholar] [CrossRef]
- Keith, A.; Brown, N.J.; Zhou, J.L. The feasibility of a collapsible parabolic solar cooker incorporating phase change materials. Renew. Energy Focus 2019, 30, 58–70. [Google Scholar] [CrossRef]
- Gupta, P.K.; Misal, A.; Agrawal, S. Development of low cost reflective panel solar cooker. Mater. Today Proc. 2021, 45, 3010–3013. [Google Scholar] [CrossRef]


| Method of Analysis | Reference |
|---|---|
| Energy and emission analysis for industrial motors in Malaysia were analyzed. The number of motors used in 5% of the surveyed industry was audited. The savings obtained by replacing the existing motors with VSD, HEM, payback period, and emission reduction were mathematically analyzed. | [12] |
| Energy consumption, energy savings, and emission analysis in Malaysian office buildings are examined. The energy-saving calculation is performed by application of CFL, temperature adjustment on air conditioning, advanced glazing, and housekeeping. Estimations of energy savings by using HEM and VSD were performed. Emission reduction and payback estimation by using the energy savings were calculated. | [13] |
| End-use energy in a Malaysian public hospital was investigated. It was found that most of the energy consumption was by motors. Estimations of energy savings by using a mathematical approach for HEM, and VSD for motors, were performed. Emission reduction, bill savings, and payback period were also calculated. | [14] |
| Energy use, energy savings, and emission analysis in the Malaysian rubber producing industries were conducted. It was found that the highest percentage of energy usage is by motors. Estimations of energy savings by using a mathematical approach for high-efficiency motors and variable speed drives for motors were performed. Emission reduction, bill savings, and payback period were also calculated. | [15] |
| Chillers’ energy consumption, energy savings, and emission analysis in an institutional building were studied. Estimations of energy savings using the calculation for variable speed drives used for pumps, motors, and chillers were performed. Bill savings and payback period are also calculated and reported. | [16] |
| Energy management strategies for a governmental building in Oman were investigated. The collected data were calibrated and re-simulated to match the real-time energy consumption. The calibrated data were then used to obtain and identify energy-saving opportunities on building envelope, lighting, and air conditioning temperature set point. | [11] |
| Studies on daylight factor and lighting zoning were conducted using a model structure. These studies were specifically to investigate the transitional space used for architecture and the impact on the daylight factor by using natural light. The overall energy savings obtained = 15.7%. | [17] |
| An in-depth energy assessment was carried out to examine the energy usage trends and identify possible energy-saving measures in the Research and Development (R&D) facility at Universiti Malaya. It was categorized into eight distinct equipment types for analysis, and the outcomes were cross-referenced with the building’s utility statements. Switching to LED lighting led to substantial energy and cost reductions, with a return on investment in roughly one year. | [18] |
| Equipment | Qty | Energy | Equipment | Qty | Energy |
|---|---|---|---|---|---|
| Grill (2 Platen) | 2 | Electric/LPG | Rice Cooker | 3 | Electric |
| Chicken Fryers | 3 | Electric/LPG | Portable Chiller | 2 | Electric |
| 4 Split Vat Fryers | 1 | Electric/LPG | Portable Freezer | 2 | Electric |
| 3 Full Vat Fryers | 1 | Electric/LPG | Meat Freezer | 1 | Electric |
| Holding Cabinet | 2 | Electric | Heat Treat Machine | 2 | Electric |
| Freezer | 1 | Electric | APD Machine | 1 | Electric |
| Cooler | 1 | Electric | Pie Counter | 1 | Electric |
| Water Heater | 1 | Electric | Coffee Machine | 1 | Electric |
| Beverage Station | 1 | Electric | Ice Cream Blender | 1 | Electric |
| Bagging Station | 1 | Electric | Juice dispenser | 1 | Electric |
| Ice Machine | 2 | Electric | Bun steamer | 2 | Electric |
| Soda Factory | 1 | Electric | Universal Holding Cabinet | 2 | Electric |
| Preparation Table | 1 | Electric |
| Item. | Project Site | DC Capacity (kWp) |
|---|---|---|
| 1 | Subang | 57.6 |
| 2 | Kota Damansara | 66 |
| 3 | Taman Connaught | 47 |
| 4 | Bandar Baru Bangi | 31.4 |
| 5 | Bandar Seri Putra | 31 |
| 6 | Section 3 Shah Alam | 27.5 |
| 7 | Kajang Perdana | 21 |
| 8 | Giant Jalan Kebun | 23 |
| 9 | Puncak Alam | 25 |
| 10 | Klang Sentral | 11 |
| 11 | Puchong Gateway | 22 |
| 12 | Prima Saujana Kajang | 20 |
| 13 | Caltex Denai Alam | 23 |
| 14 | Kota Emerald | 20 |
| 15 | Persiaran Raja Muda Musa | 28.5 |
| Total | 454 | |
| Equipment | Quantity | Operating Hours (h/y) |
|---|---|---|
| Grill (2 Platen) | 2 | 7151 |
| Chicken Fryers | 3 | 7151 |
| 4 Split Vat Fryers | 1 | 7151 |
| 3 Full Vat Fryers | 1 | 7151 |
| Equipment | Quantity | LPG | Electric Energy | |
|---|---|---|---|---|
| BTU | kW | kW | ||
| Grill (2 Platen) | 2 | 80,000 | 9.8 | 22.0 |
| Chicken Fryers | 3 | 300,000 | 0.4 | 51 |
| 4 Split Vat Fryers | 1 | 300,000 | 0.4 | 56 |
| 3 Full Vat Fryers | 1 | 225,000 | 0.4 | 42 |
| Type of Fuels | Emission Factors (kg/kWh) | ||
|---|---|---|---|
| CO2 | SO2 | CO | |
| Coal | 1.18 | 0.0139 | 0.002 |
| Petroleum | 0.85 | 0.0164 | 0.002 |
| Natural gas | 0.53 | 0.0005 | 0.005 |
| Hydro | 0 | 0 | 0 |
| RE | 0 | 0 | 0 |
| Building Types | BEI (kWh/m2/Year) |
|---|---|
| Transport hub | 1865.14 |
| Mall | 1308.36 |
| Shopfront | 1628.14 |
| Standalone | 1972.74 |
| Building Types | Normalized BEI (kWh/m2/Year) |
|---|---|
| Transport hub | 932.57 |
| Mall | 654.18 |
| Shopfront | 814.07 |
| Standalone | 986.37 |
| Equipment | Quantity | Gas Equipment: LPG and Electric Consumption Per Annum | Electrical Equipment Energy Consumption Per Annum | |
|---|---|---|---|---|
| kBTUH/y | kWh/y | kWh/y | ||
| Grill (2 Platen) | 2 | 572,080 | 70,079.8 | 157,322 |
| Chicken Fryers | 3 | 2,145,300 | 2860.4 | 364,701 |
| 4 Split Vat Fryers | 1 | 2,145,300 | 2860.4 | 400,456 |
| 3 Full Vat Fryers | 1 | 1,608,975 | 2860.4 | 300,342 |
| Total Energy Consumption | 6,471,655 | 78,661 | 1,222,821 | |
| Equipment | Qty | Gas Equipment: LPG and Electric Consumption | Total Energy Consumed by Gas Equipment | Electrical Equipment Energy Consumption | |
|---|---|---|---|---|---|
| kBTUH/y to kWh/y | kWh/y | kWh/y | kWh/y | ||
| Grill (2 Platen) | 2 | 167,491 | 70,079.8 | 237,570.7 | 157,322 |
| Chicken Fryers | 3 | 628,091 | 2860.4 | 630,951.3 | 364,701 |
| 4 Split Vat Fryers | 1 | 628,091 | 2860.4 | 630,951.3 | 400,456 |
| 3 Full Vat Fryers | 1 | 471,068 | 2860.4 | 473,928.6 | 300,342 |
| The total energy in kWh | 1,894,741 | 78,661 | 1,973,402 | 1,222,821 | |
| Year | Solar Generation (kWh Per Annum) | Year | Solar Generation (kWh Per Annum) |
|---|---|---|---|
| 1 | 579,985 | 11 | 551,630 |
| 2 | 577,085 | 12 | 548,871 |
| 3 | 574,200 | 13 | 546,127 |
| 4 | 571,329 | 14 | 543,396 |
| 5 | 568,472 | 15 | 540,679 |
| 6 | 565,630 | 16 | 537,976 |
| 7 | 562,801 | 17 | 535,286 |
| 8 | 559,987 | 18 | 532,610 |
| 9 | 557,188 | 19 | 529,947 |
| 10 | 554,402 | 20 | 527,297 |
| Year | Gas Equipment: LPG and Electric Consumption Per Annum | Gas Equipment: LPG and Electric Energy Cost Per Annum | Total Cost | ||
|---|---|---|---|---|---|
| kBTUH/y (a) | kWh/y (b) | RM (a × Gas Tariff) | RM (b × Electric Tariff) | RM | |
| 2019 | 6,471,655 | 78,661 | 613,030.8 | 40,038.4 | 653,069.3 |
| 2020 | 6,471,655 | 78,661 | 557,300.8 | 40,038.4 | 597,339.2 |
| 2021 | 6,471,655 | 78,661 | 585,165.8 | 40,038.4 | 625,204.2 |
| Year | Solar Generation (kWh/Year) | TNB Tariff | Energy Cost Saved (RM) | Year | Solar Generation (kWh/Year) | TNB Tariff | Energy Cost Saved (RM) |
|---|---|---|---|---|---|---|---|
| 1 | 579,985 | 0.517 | 579,985 | 11 | 551,630 | 0.670 | 369,435 |
| 2 | 577,085 | 0.517 | 577,085 | 12 | 548,871 | 0.670 | 367,588 |
| 3 | 574,200 | 0.517 | 574,200 | 13 | 546,127 | 0.730 | 398,668 |
| 4 | 571,329 | 0.564 | 571,329 | 14 | 543,396 | 0.730 | 396,675 |
| 5 | 568,472 | 0.564 | 568,472 | 15 | 540,679 | 0.730 | 394,691 |
| 6 | 565,630 | 0.564 | 565,630 | 16 | 537,976 | 0.796 | 428,062 |
| 7 | 562,801 | 0.614 | 562,801 | 17 | 535,286 | 0.796 | 425,922 |
| 8 | 559,987 | 0.614 | 559,987 | 18 | 532,610 | 0.796 | 423,792 |
| 9 | 557,188 | 0.614 | 557,188 | 19 | 529,947 | 0.867 | 459,624 |
| 10 | 554,402 | 0.670 | 554,402 | 20 | 527,297 | 0.867 | 457,326 |
| Year | kg CO2 | kg SO2 | kg CO | Year | kg CO2 | kg SO2 | kg CO |
|---|---|---|---|---|---|---|---|
| 1 | 418,952 | 3615 | 1668 | 11 | 351,940 | 3438 | 1586 |
| 2 | 368,180 | 3597 | 1660 | 12 | 350,180 | 3421 | 1579 |
| 3 | 366,339 | 3579 | 1651 | 13 | 348,429 | 3404 | 1571 |
| 4 | 364,508 | 3561 | 1643 | 14 | 346,687 | 3387 | 1563 |
| 5 | 362,685 | 3543 | 1635 | 15 | 344,954 | 3370 | 1555 |
| 6 | 360,872 | 3525 | 1627 | 16 | 343,229 | 3353 | 1547 |
| 7 | 359,067 | 3507 | 1619 | 17 | 341,513 | 3336 | 1539 |
| 8 | 357,272 | 3490 | 1611 | 18 | 339,805 | 3319 | 1532 |
| 9 | 355,486 | 3473 | 1602 | 19 | 338,106 | 3303 | 1524 |
| 10 | 353,708 | 3455 | 1594 | 20 | 336,415 | 3286 | 1517 |
Disclaimer/Publisher’s Note: The statements, opinions and data contained in all publications are solely those of the individual author(s) and contributor(s) and not of MDPI and/or the editor(s). MDPI and/or the editor(s) disclaim responsibility for any injury to people or property resulting from any ideas, methods, instructions or products referred to in the content. |
© 2023 by the authors. Licensee MDPI, Basel, Switzerland. This article is an open access article distributed under the terms and conditions of the Creative Commons Attribution (CC BY) license (https://creativecommons.org/licenses/by/4.0/).
Share and Cite
Gunasegaran, M.K.; Hasanuzzaman, M.; Tan, C.; Bakar, A.H.A.; Ponniah, V. Energy Consumption, Energy Analysis, and Solar Energy Integration for Commercial Building Restaurants. Energies 2023, 16, 7145. https://doi.org/10.3390/en16207145
Gunasegaran MK, Hasanuzzaman M, Tan C, Bakar AHA, Ponniah V. Energy Consumption, Energy Analysis, and Solar Energy Integration for Commercial Building Restaurants. Energies. 2023; 16(20):7145. https://doi.org/10.3390/en16207145
Chicago/Turabian StyleGunasegaran, Muthu Kumaran, Md Hasanuzzaman, ChiaKwang Tan, Ab Halim Abu Bakar, and Vignes Ponniah. 2023. "Energy Consumption, Energy Analysis, and Solar Energy Integration for Commercial Building Restaurants" Energies 16, no. 20: 7145. https://doi.org/10.3390/en16207145
APA StyleGunasegaran, M. K., Hasanuzzaman, M., Tan, C., Bakar, A. H. A., & Ponniah, V. (2023). Energy Consumption, Energy Analysis, and Solar Energy Integration for Commercial Building Restaurants. Energies, 16(20), 7145. https://doi.org/10.3390/en16207145