Abstract
In this paper, we investigate the optimization of an oxygen removal system for water electrolysis plants because high oxygen concentrations can be dangerous and compromise the quality of the hydrogen produced. The design of an oxygen removal system was investigated using numerical analysis. The results showed that the diameter of the chamber had a significant effect on the oxygen removal efficiency, and a diameter twice the size of the gas inlet was found to be optimal. The porosity of the catalyst layer also played a crucial role in the efficiency, with a lower porosity resulting in higher removal rates. Additionally, the optimal chamber length was found to be 76.8 D to achieve an oxygen mole fraction of 2.4 ppm after the chamber, which satisfied the safety criterion of 4.0 ppm. These results can aid in the design of oxygen removal systems for water electrolysis plants, providing a more efficient and safer operation.
1. Introduction
Water electrolysis is a promising technology for producing hydrogen as a clean and renewable energy source [1,2]. In recent years, there has been growing interest in the development of efficient and cost-effective water electrolysis systems that can be used to produce hydrogen on a large scale, and so research on systems that manage oxygen on a large scale is needed [3,4]. To commercialize water electrolysis systems, many researchers have been researching catalysts inside water electrolysis stacks to produce hydrogen through water decomposition due to the slow speed of the cathode hydrogen evolution reaction (HER) and anode oxygen evolution reaction (OER) during water electrolysis [5]. To address this slow reaction, high-cost noble metal catalysts such as Pt-based and RuO2/IrO2 catalysts have been used, which has limited the commercialization of such systems. Currently, a lot of research is being conducted with various transition metal oxides, layered double hydroxides, phosphides, sulfides, and selenides to develop effective but non-precious electrocatalysts.
Another challenge in water electrolysis is the presence of oxygen in the hydrogen gas produced during the process [6,7,8]. This process involves passing an electric current through water to break it down into hydrogen and oxygen. The presence of oxygen can cause safety hazards and reduce the efficiency of fuel cell systems that use the hydrogen gas [9,10]. Therefore, to generate hydrogen, it is also necessary to manage the oxygen generated at the same time. To address this issue, an oxygen removal system using a H2 and O2 recombination reaction is used to remove oxygen from the hydrogen gas produced during electrolysis.
Several types of oxygen removal methods have been studied for removing oxygen from water electrolysis systems. Schug et al. [11] investigated the use of a high-pressure water electrolysis system to produce hydrogen gas with a high efficiency. The impacts of factors such as temperature, pressure, and current density were discussed in relation to the performance of the system. In addition, the effect of gas purging on the performance of the system was investigated, and they found that gas purging improved the efficiency of the system. Yasnev et al. [12] conducted a study on the recombination of the hydrogen and oxygen generated in the process of water electrolysis into water using a radioactive gas recombination device. The experimental results demonstrated the performances of the cellular ceramics used as catalyst supports in radioactive gas recombination devices, showing that the use of cellular ceramics can increase the efficiency of the recombination process and improve device stability and durability. Ge et al. [13] determined that the use of different gas distributors can significantly affect the efficiency of the recombination process and the distribution of hydrogen and oxygen in the reactor. The results of the study demonstrated the importance of considering gas distribution in the design and operation of fluidized bed reactors for the recombination of hydrogen and oxygen. Ligen et al. [14] conducted a study that used an electrode-based method for removing impurities, such as water vapor and oxygen, from hydrogen. The oxygen removal was designed to be energy-efficient, with low energy consumption compared to traditional methods in alkaline water electrolysis systems. Through their experiments, they showed the effectiveness of the system in removing impurities and improving the quality of the hydrogen. Using membrane for oxygen removal, Haug et al. [15] studied the influence of process conditions on gas purity in alkaline water electrolysis. The higher current densities and lower temperatures led to higher gas purity, and the system was sensitive to changes in the electrolyte concentrations. This study provided insights into the optimization of process conditions for alkaline water electrolysis for achieving high gas purity. Each of these methods had its own advantages and disadvantages, and the choice of method depends on the specific requirements of the system, including the desired product, safety concerns, and cost.
Among various oxygen removal methods, the following research has been conducted regarding the H2 and O2 recombination method. Lalik et al. [16] investigated the effect of humidity on the deactivation of Al2O3- and SiO2-supported Pd, Pt, and Pd-Pt catalysts in hydrogen and oxygen recombination reactions. Humidity significantly reduced the catalytic activities of the catalysts, and this was attributed to the formation of water on the surfaces of the catalysts, which hindered the adsorption of reactants. In addition, using density functional theory (DFT) calculations, they investigated the effect of water adsorption on catalytic activity and provided insights into the reaction mechanism. Kim et al. [17] investigated the role of Pt and Pd in a Pt-Pd/TiO2 bimetallic catalyst for H2 oxidation at room temperature. Their research suggested that the Pt-Pd/TiO2 catalyst had higher activity for H2 oxidation compared to monometallic catalysts, and Pt played a more important role than Pd in the catalytic activity. Fan et al. [18] conducted a study that fabricated small, uniform, dense, and well-dispersed Pd catalysts into nanostructures in graphene through phosphomolybdic-acid-mediated self-assembly. The Pd catalyst manufactured using phosphomolybdic-acid-modified graphene as a support showed significantly improved catalytic activity and durability compared to commercial Pd/C. Yang et al. [19] showed that Pd nanoparticles can be prepared through the dynamic self-assembly of adenine on graphene, and they investigated the mechanism of the dynamic synthesis strategy of adenine. They showed that the prepared Pd nanoparticles had significantly improved catalytic activity and CO durability compared to the Pd nanoparticles grown using conventional graphene and commercial Pd/C.
Most of the previous research on oxygen removal methods using H2 and O2 recombination reactions has mainly focused on improving the catalyst’s performance. There is a lack of research on oxygen removal chambers for installation in water electrolysis systems using a catalyst. In this paper, we investigate the optimal design of an oxygen removal chamber in a water electrolysis system to achieve effective oxygen removal from the hydrogen gas and satisfy stability in a water electrolysis system. As for the type of dioxo chamber, a catalytic method applicable to a large-capacity system was selected among dioxo applied to existing electrolysis systems. To optimize the shape design of the oxygen removal chamber, a test and process analysis (Aspen Plus V11) of a PEM water electrolysis system was used to identify the requirements for the deoxygenation chamber of the water electrolysis system, such as the oxygen content and flow rate of hydrogen gas. In addition, the operating conditions necessary for the optimal design of the dioxo chamber, such as the type of catalyst, temperature and pressure of gas, and flow rate, were determined. The oxygen concentration of the oxygen removal chamber according to each shape was calculated through computational fluid dynamics (CFD) analysis by applying the derived operating conditions of the chamber.
2. Numerical Condition and Methods
2.1. Process Analysis of the Electrolysis System
The process flow diagram of the Proton Exchange Membrane (PEM) water electrolysis system is illustrated in Figure 1a,b. To analyze the process, Aspen Plus software was employed [20]. The PEM water electrolysis stack was modeled as depicted in Figure 1a, taking into account the energy requirements for water decomposition, electrochemical reactions, and physical phenomena losses. The system configuration comprises an electrolysis stack and the associated Balance of Plants (BOPs) for producing hydrogen, including a pump, heat exchanger, and water separator, as shown in Figure 1b.

Figure 1.
Process flow diagram of the (a) PEM stack and (b) PEM water electrolysis system.
Process analysis was performed under the same conditions as the stack performance test. The initial deionized water temperature was set at 23 °C, and it was supplied to the stack via a pump and heat exchanger. The stack operating pressure is 8 bar, the operating temperature is 60 °C, and water supplied through the pump is decomposed to generate hydrogen and oxygen. Hydrogen generated in the stack is separated into water and gas through a gas–liquid separator. The gas goes to the oxygen removal chamber for removing oxygen in the gas stream. All BOPs were subjected to process analysis by applying the actual operating load, temperature, and pressure of the water electrolysis system.
2.2. Physical Models and Numerical Methods
2.2.1. Governing Equation
In this study, the governing equations for mass, momentum, species, and energy were solved using the three-dimensional Reynolds-Averaged Navier–Stokes (RANS) equations for an incompressible, unsteady, and turbulent flow. Specifically, the incompressible Navier–Stokes equation [21,22] was utilized for the flow analysis. The continuity equation, which expresses mass conservation, is given by:
where ρ is density of fluid and is velocity to i direction. The law of conservation of momentum can be expressed as follows:
In the momentum conservation equation, p is static pressure, τ is the stress tensor, g is the gravitational acceleration, and F is an externally generated force. F is a user defined source and includes the force that the software user must apply depending on the interpretation situation. The stress tensor is expressed as follows:
where μ is the kinematic viscosity, I is the unit tensor, and vT is the transition vector for velocity v. The second term in the equation on the right represents the effect of volume change. For numerical analysis of turbulent flow model, the k–ε model was used to investigate the flow characteristics inside the oxygen removal chamber. The governing equations applied to the simulation are:
where k is turbulence kinetic energy, σk is turbulent Prandtl number for k, and ε is turbulence dissipation rate. The turbulence dissipation rate (ε) is given as,
The generation of turbulent kinetic energy (Gk) of the mean velocity gradient is given as follows:
The turbulent viscosity (μi) used in the standard k–ε turbulent model is given as,
In Equations (5)–(7), the coefficients C1ε, C2ε, Cμ, σk, and σε are 1.44, 1.92, 0.09, 1.0, and 1.3, respectively. The standard k–ε model assumes that the flow is perfectly turbulent, and that the molecular viscosity is negligible.
To simulate the hydrogen and oxygen recombination reaction on the Pd catalyst’s surface, a species transport equation was applied to generate water from hydrogen and oxygen. Through the analysis of convection and diffusion for the ith species, the mass fraction of a chemical species (Y) is predicted. The conservation equation is expressed as follows:
where Ji is the production rate by the chemical reaction and Si is the production rate.
2.2.2. Catalyst Reaction
Chapman et al. [23] reported on the recombination reaction of hydrogen and oxygen when utilizing a Pd catalyst. It has been almost a century since this publication and the first reports of the water electrolysis technique. The recombination reaction of hydrogen and oxygen is the reverse of that of water electrolysis and is a highly exothermic and catalytic reaction, expressed as Equation (9).
0.5O2 + H2 → H2O ΔH = −242 kJ/mol
The choice of catalyst used can theoretically maintain a 0% concentration of oxygen in the H2 stream at room temperature without the need for an external power supply. The main catalyst materials used for oxygen removal from the hydrogen stream are Pd and Pt metals with high H2-O coupling reaction activities [17]. In this study, Pd was utilized as the catalyst. Due to its almost nonexistent activation energy barrier for the dissociative adsorption of H2 molecules, Pd can adsorb a large amount of hydrogen even at room temperature and atmospheric pressure [24]. Furthermore, owing to its strong affinity for oxygen, Pd adsorbs onto the surface of oxygen molecules, leading to dissociation and ionization even at low temperatures. The sequential combination of ions chemically adsorbed onto the Pd surface forms water, as expressed in the equations below [25,26].
Oads + Hads = OHads
OHads + Hads = H2Oads (H2Ogas)
In this study, the reaction rates, experimentally presented in previous studies [22], were applied to predict the oxygen concentration, as shown in Equations (10) and (11). Each reaction rate was modeled following a simple Arrhenius kinetic equation:
where ki represents the rate of reaction i, Ai denotes the pre-exponential factor, Ei represents the activation energy, R is the gas constant, and T is the temperature. The reactions of hydrogen and oxygen on a palladium catalyst and their corresponding rate expressions are presented in Table 1. All pre-exponential factors A were chosen to be independent of temperature.

Table 1.
Oxygen removal reaction on Pd catalyst (unit A [cm2 (mol s)−1], E [kJ mol−1]).
2.2.3. Geometric of the Oxygen Removal Chamber and Boundary Condition
The geometry of the oxygen removal chamber is presented in Figure 2a,b, and the inlet gas conditions and the conditions for each oxygen removal chamber utilized in the analysis are listed in Table 2. The diameter and length values employed in the oxygen removal chamber were dimensionless using the inlet and outlet pipe sizes (D). Numerical analysis was conducted with chamber diameters of 1.5 D, 2.0 D, 2.5 D, and 3.0 D, and chamber lengths of 60.0 D, 70.0 D, 76.8 D, and 80.0 D. The catalyst bed in the oxygen removal chamber was assumed to be a porous zone, as depicted in Figure 2b.
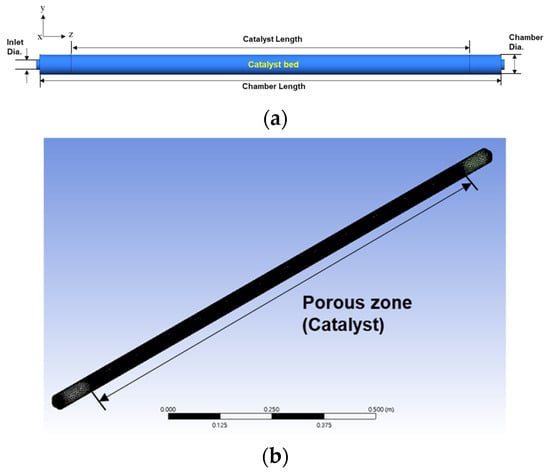
Figure 2.
(a) Geometry of the oxygen removal chamber for y-z plane and (b) 3D geometry of the oxygen removal chamber with grid system.

Table 2.
Dimension of the oxygen removal chamber and the inlet gas conditions utilized for numerical analysis.
Figure 3 shows the geometry according to the contact structure of the catalyst utilized in this study. Figure 3a presents a model assuming that four perfectly spherical Pd catalysts constitute a cell in a bundle, with each cell completely filled in the catalyst bed of the chamber. When the model is applied, the porosity of the catalyst layer is calculated as 0.476. Figure 3b presents a model assuming that five spherical catalysts make up one cell, with each cell fully occupying the catalyst bed. In the case of Figure 3b, the porosity of the catalyst bed is 0.397. The oxygen removal chamber was composed of a hexahedral lattice, which was interpreted as consisting of more than 1.5 million lattices. At the start of the reaction, the number of moles of gas within the catalyst bed was set to zero.
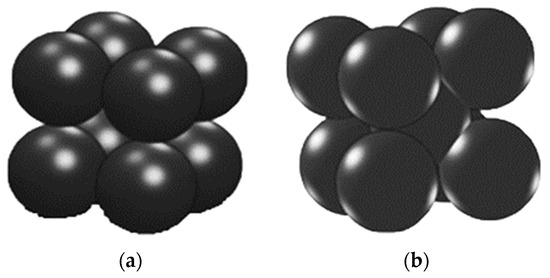
Figure 3.
3D model of the contact structure of the catalyst bed in the oxygen removal chamber. (a) A cell consisting of four catalysts, and (b) a cell consisting of five catalysts.
3. Results and Discussion
3.1. Process Analysis of the Water Electrolysis System Using PEM
Table 3 displays the process analysis results of the water electrolysis system utilized in this study. The results demonstrate that at 100% load of the water electrolysis stack, the stack outlet mole flow is 2.384 kmol h−1, and the hydrogen mole flow produced is 0.493 kmol h−1. The oxygen concentrations produced by the stack were observed to be approximately 200 ppm in the stream. Water that did not participate in the reaction is recovered via the water-drain and gas–liquid separator and subsequently recycled to the water tank. The oxygen concentration in the stream increases to 960 ppm following the water separation process in the water separator.

Table 3.
Process analysis results of the water electrolysis system.
3.2. Effect of Geometry on the Oxygen Mole Fraction
The oxygen supplied to the oxygen removal chamber is a mole fraction of 960 ppm, as determined through process analysis. In addition, the oxygen removal rate of catalytic recombination is assumed to be 99.5%, as determined through lab-scale experimentation, which is similar to the recovery rates reported in previous studies, ranging from 99.2% to 99.4%.
According to the variation in porosity, Figure 4 shows the oxygen mole fraction in the longitudinal direction (z-axis) of the chamber and the oxygen distribution in the cross section. The porosity was calculated using the largest value of 0.476 and the smallest value of 0.397, considering Figure 3a,b. Figure 4 demonstrates that the lower the porosity of the catalyst layer, the higher the oxygen removal rate. This is attributed to the increase in the catalyst’s surface area exposed to oxygen and the improved utilization efficiency of the catalyst due to the uniform distribution of oxygen. Furthermore, the pressure drops in the chamber, increased from 138 Pa to 228 Pa when the porosity decreased from 0.476 to 0.397. This indicates that the residence time of the reaction gas increases at a lower porosity, leading to a lower oxygen concentration. Therefore, to account for the more severe condition, a porosity of 0.476 was chosen for the CFD analysis. This ensures a more conservative estimate of the oxygen removal efficiency and allows for a safer operation of the system’s performance under various operating conditions.
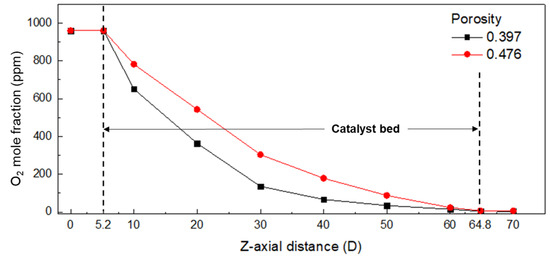
Figure 4.
Oxygen mole fraction in the longitudinal direction (z-axis) of the chamber (chamber length 70.0 D).
The numerical analysis was conducted to observe the change in the diameter of the chamber, and Figure 5 presents the velocity contour of the y-z plane section of the chamber when the inlet flow velocity is constant (1.25 kg h−1). The high velocity region is observed to be distributed near the center of the chamber for the four diameter conditions (1.5 D, 2.0 D, 2.5 D, and 3.0 D). For the diameter of 1.5 D, the central region continues to have a high velocity region as the distance in the z-axis direction increases in the catalyst layer. This high velocity region results in a reduced contact time with the catalyst, leading to a decrease in the oxygen removal efficiency. In addition, the velocity gradient in the cross-section of the catalyst layer becomes large, and the hydrogen and oxygen recombination reaction does not occur uniformly. Under the condition of a diameter of 2.0 D, as the distance in the z-axis direction increases, the velocity in the central region gradually decreases, and the velocity gradient in the cross-section decreases. For the diameters of 2.5 D and 3.0 D, the velocity at the center gradually decreases as the distance in the z-axis direction increases, but as the diameter increases, the point of uniformity moves away from the inlet. Furthermore, it can be observed that the gas velocity decreases toward the chamber wall, and the area gradually increases as the diameter increases. From the results of the numerical analysis, it can be concluded that when the inlet diameter is the same, the region that does not participate in the catalytic reaction gradually increases over a certain diameter (2.0 D). Under the condition of a 3.0 D diameter, a recirculation zone occurs in front of the catalyst bed, which may affect the stability of the system by increasing the oxygen concentration locally. Therefore, considering the inlet gas flow rate of 1.25 kg h−1, it can be seen that the chamber diameter twice the inlet pipe D is most suitable.
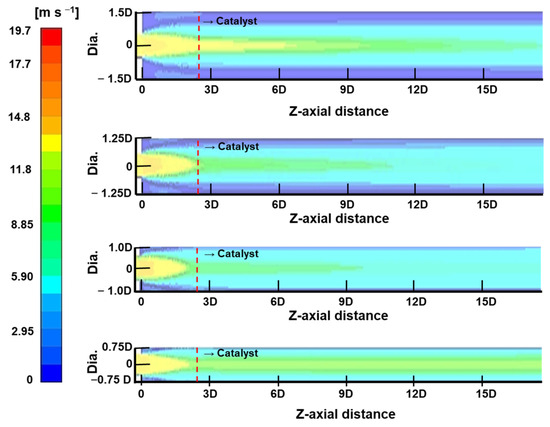
Figure 5.
Contour of the stream velocity with change of oxygen removal chamber diameter.
Figure 6 shows the oxygen concentration in the z-axis direction for each diameter condition. It is observed that the oxygen mole fraction in the catalyst bed is significantly different under the condition of 1.5 D diameter compared to the 2.0 D, 2.5 D, and 3.0 D diameters. The high velocity in the center of the chamber, as shown in Figure 5, results in a poor recombination reaction between oxygen and hydrogen. As the diameter increases from 2.0 D to 3.0 D, the oxygen mole fraction decreases to 4.8 ppm at 2.0 D, 4.0 ppm at 2.5 D and 3.4 ppm at 3.0 D, but the difference is not significant or substantial. This is because the catalysts activated by the recombination reaction are small in the low velocity region on the chamber wall side, as shown at 2.5 D and 3.0 D in Figure 5. Considering the cost of the expensive catalyst, the diameter of the chamber is suggested to be twice the diameter of the gas inlet based on the result of the oxygen concentration. Combining the velocity distribution in Figure 5 and the oxygen concentration in the z-axis direction in Figure 6, it is concluded that twice the diameter of the gas inlet is suitable as the diameter of the chamber.
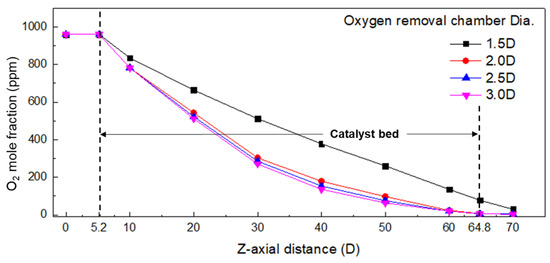
Figure 6.
Oxygen mole fraction in the longitudinal direction (z-axis) according to oxygen removal chamber diameter (chamber length 70.0 D).
In Figure 7, the oxygen mole fraction along the length of the oxygen removal chamber is shown in the longitudinal (z-axis) direction. It was found that at a chamber length of 2.0 D and 70.0 D, the oxygen concentration at the rear end of the chamber exceeded the safety criterion of 4.0 ppm. To meet the safety criterion, numerical analysis was performed by increasing the length of the oxygen removal chamber. At a chamber length of 80.0 D, the oxygen mole fraction at the rear end was found to be 1.2 ppm. To optimize the design, analysis was performed for the chamber length between 70.0 D and 80.0 D. Finally, it was determined that when the chamber length is 76.8 D, the oxygen mole fraction at the rear end of the chamber is 2.4 ppm, which satisfies the safety criterion of 4.0 ppm or less with a safety factor of 1.5 times taken into consideration.
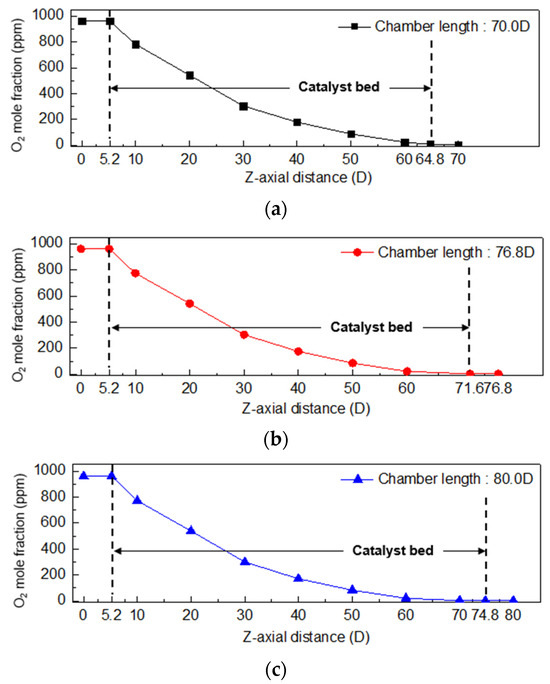
Figure 7.
Oxygen mole fraction in the longitudinal direction (z-axis) according to oxygen removal chamber length (a) 70.0 D, (b) 76.8 D, and (c) 80.0 D (chamber diameter 2.0 D).
3.3. Verification of the Oxygen Removal Chamber Performance
To validate the numerical analysis results of the oxygen removal chamber, an experiment was conducted using the water electrolysis system shown in Figure 8 [27]. The experiment was performed under conditions of a stack pressure of 8 bar and a temperature of 60 °C, and an oxygen removal chamber pressure of 6.5 bar and a temperature of 60 °C. The catalyst used in the oxygen removal chamber contained 0.3 wt.% of Pd and reacted with hydrogen to remove oxygen. The temperature before and after the chamber was measured, and it was found that the mixed gas supplied to the chamber at 100% load of the water electrolysis system was about 60 °C, while the discharged gas temperature was between 68 °C to 73 °C after the oxygen removal reaction. This increase in temperature was due to the exothermic nature of the recombination reaction that occurs on the catalyst. Subsequently, additional cooling and a dryer were required to remove the generated water from the system. The oxygen mole fraction was measured downstream of the dryer, and the measurement results were used to verify the numerical analysis results of the chamber.
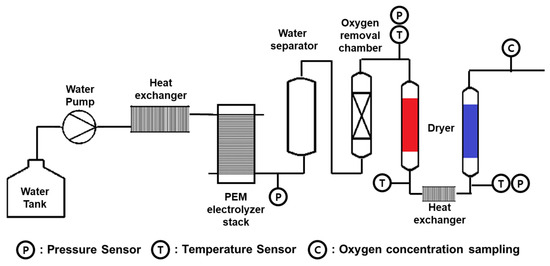
Figure 8.
Experimental schematic for verification of oxygen concentration in water electrolysis system [27]. (The red dryer is in the regeneration stage, and the blue dryer is in the adsorption stage).
To verify the effectiveness of the numerical analysis results of the oxygen removal chamber, an experiment was conducted using a water electrolysis system, and the oxygen mole fraction was measured at the downstream of the dryer. To monitor the oxygen content, an oxygen delivery device was used, and the results were shown in Figure 9. The oxygen content gradually decreased over time and reached a level of 4 ppm after 2000 s. Subsequently, the oxygen concentration at the rear end of the oxygen removal chamber was maintained between 0.8 ppm and 2.6 ppm. These results confirm the accuracy of the numerical analysis results, which indicated that the oxygen removal rate was affected by the diameter and length of the chamber as well as the porosity of the catalyst layer. In addition, it was found that a chamber diameter of twice the diameter of the gas inlet and a chamber length of 76.8 D were optimal for achieving an oxygen concentration of 4 ppm or less.
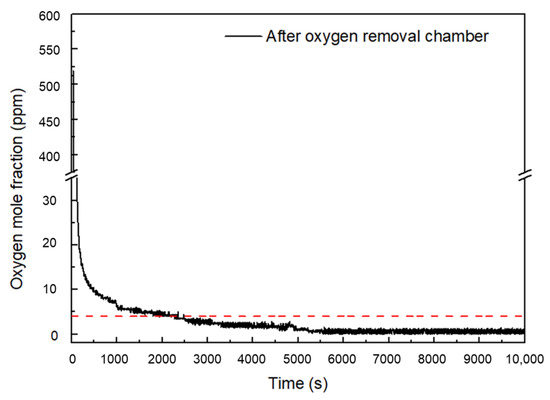
Figure 9.
Experimental results of oxygen mole fraction after oxygen removal chamber in water electrolysis system. (The red dotted line is the lower explosive limit).
4. Conclusions
In this research, the design of an oxygen removal system for a water electrolysis plant was investigated using numerical analysis. The porosity of the catalyst layer also played a crucial role in the efficiency, with a lower porosity resulting in higher removal rates. The results showed that the diameter of the chamber had a significant effect on the oxygen removal efficiency. The oxygen mole fraction in the catalyst bed is significantly different when the diameter of the chamber is 1.5 D compared to 2.0 D, 2.5 D, and 3.0 D, due to the high velocity in the center of the chamber. As the diameter increases from 2.0 D to 3.0 D, the oxygen mole fraction decreases, but not significantly. Moreover, the catalysts activated by the recombination reaction are small in the low flow region on the chamber wall side. Considering the oxygen removal performance and the price of the expensive catalyst, the diameter of the chamber be twice the diameter of the gas inlet. In addition, it was found that a chamber diameter of twice the diameter of the gas inlet and a chamber length of 76.8 D were optimal for achieving an oxygen concentration of 4 ppm or less. These findings will contribute to the development of a safer and more efficient water electrolysis system.
Author Contributions
Conceptualization, S.K., S.E. and G.C.; methodology, S.E.; software, S.E.; validation, S.K. and S.E.; formal analysis, S.E. and G.C.; investigation, S.K., S.E. and G.C.; resources, S.K., S.E. and G.C.; data curation, S.K., S.E. and G.C.; writing—original draft preparation, S.K. and S.E.; writing—review and editing, S.K. and S.E.; visualization, S.E.; supervision, G.C.; project administration, S.K. and G.C.; funding acquisition, S.K. and G.C. All authors have read and agreed to the published version of the manuscript.
Funding
This research was funded by the Korea Government (MOTIE) grant number 20223030040050.
Data Availability Statement
The data presented in this study are available in insert article.
Acknowledgments
This research was supported by the Korea Government(MOTIE) grant number 20223030040050 and 2023 Regional Industry-linked University Open-Lab Development Support Program through the Commercializations Promotion Agency for R&D Outcomes (COMPA) funded by Ministry of Science and ICT (2023openlab(RnD)_02).
Conflicts of Interest
The authors declare no conflict of interest.
References
- Schmidt, O.; Gambhir, A.; Staffell, I.; Hawkes, A.; Nelson, J.; Few, S. Future cost and performance of water electrolysis: An expert elicitation study. Int. J. Hydrogen Energy 2017, 42, 30470–30492. [Google Scholar] [CrossRef]
- Carmo, M.; Fritz, D.L.; Mergel, J.; Stolt, D. A comprehensive review on PEM water electrolysis. Int. J. Hydrogen Energy 2013, 38, 4901–4934. [Google Scholar] [CrossRef]
- Lee, H.; Lee, B.; Byun, M.; Lim, H. Economic and environmental analysis for PEM water electrolysis based on replacement moment and renewable electricity resources. Energy Conver. Manag. 2020, 224, 113477. [Google Scholar] [CrossRef]
- Nikolaidis, P.; Poullikkas, A. A comparative overview of hydrogen production processes. Renew. Sustain. Energy Rev. 2017, 67, 597–611. [Google Scholar] [CrossRef]
- Zhang, L.C.; Chen, H.; Hou, G.R.; Zhang, L.Z.; Li, Q.L.; Wu, Y.K.; Xu, M.; Bao, S.J. Puzzle-inspired carbon dots coupled with cobalt phosphide for constructing a highly-effective overall water splitting interface. Chem. Commun. 2020, 56, 257–260. [Google Scholar] [CrossRef]
- Du, Z.; Liu, C.; Zhai, J.; Guo, X.; Xiong, Y.; Su, W. A review of hydrogen purification technologies for fuel cell vehicles. Catalysts. 2021, 11, 393. [Google Scholar] [CrossRef]
- Clarke, R.E.; Giddey, S.; Badwal, S.P.S. Stand-alone PEM water electrolysis system for fail safe operation with a renewable energy source. Int. J. Hydrogen Energy 2010, 35, 928–935. [Google Scholar] [CrossRef]
- Gahleitner, G. Hydrogen from renewable electricity: An international review of power-to-gas pilot plants for stationary applications. Int. J. Hydrogen Energy 2013, 38, 2039–2061. [Google Scholar] [CrossRef]
- Ogunbode, C.A.; Doran, R.; Böhm, G. Exposure to the IPCC special report on 1.5 °C global warming is linked to perceived threat and increased concern about climate change. Clim. Chang. 2020, 158, 361–375. [Google Scholar] [CrossRef]
- Schröder, V.; Emonts, B.; Janßen, H.; Schulze, H.P. Explosion Limits of Hydrogen/Oxygen Mixtures at Initial Pressures up to 200 bar. Chem. Eng. Technol. 2004, 27, 847–851. [Google Scholar] [CrossRef]
- Schug, C.A. Operational characteristics of high-pressure, high-efficiency water-hydrogen-electrolysis. Int. J. Hydrogen Energy 1998, 23, 1113–1120. [Google Scholar] [CrossRef]
- Yasnev, I.M.; Mel’nichenko, A.N.; Gurskii, V.S. A cellular ceramic as a catalyst support for radiolytic gas recombination devices. Russ. J. Appl. Chem. 2020, 93, 927–932. [Google Scholar] [CrossRef]
- Ge, S.; Xinchun, L.; Weizhong, Q.; Wei, C.; Congyu, S.; Yongjun, S. Recombination of hydrogen and oxygen in fluidized bed reactor with different gas distributors. Energy Proc. 2012, 29, 552–558. [Google Scholar] [CrossRef]
- Ligen, Y.; Vrubel, H.; Girault, H. Energy efficient hydrogen drying and purification for fuel cell vehicles. Int. J. Hydrogen Energy 2020, 45, 10639–10647. [Google Scholar] [CrossRef]
- Haug, P.; Koj, M.; Turek, T. Influence of process conditions on gas purity in alkaline water electrolysis. Int. J. Hydrogen Energy 2017, 42, 9406–9418. [Google Scholar] [CrossRef]
- Lalik, E.; Kosydar, R.; Tokarz-Sobieraj, R.; Witko, M.; Szumełda, T.; Kołodziej, M. Humidity induced deactivation of Al2O3 and SiO2 supported Pd, Pt, Pd-Pt catalysts in H2 + O2 recombination reaction: The catalytic, microcalorimetric and DFT studies. Appl. Catal. A-Gen. 2015, 501, 27–40. [Google Scholar] [CrossRef]
- Kim, G.J.; Shin, J.H.; Chang, H.S. Study on the role of Pt and Pd in Pt-Pd/TiO2 bimetallic catalyst for H2 oxidation at room temperature. Int. J. Hydrogen Energy 2020, 45, 17276–17286. [Google Scholar] [CrossRef]
- Fan, X.; Yuan, W.; Zhang, D.H.; Li, C.M. Heteropolyacid-mediated self-assembly of heteropolyacid-modified pristine graphene supported Pd nanoflowers for superior catalytic performance toward formic acid oxidation. ACS Appl. Energy Mater. 2018, 1, 411–420. [Google Scholar] [CrossRef]
- Yang, Q.; Lin, H.; Wang, X.; Zhang, L.Y.; Jing, M.; Yuan, W.; Li, C.M. Dynamically self-assembled adenine-mediated synthesis of pristine graphene-supported clean Pd nanoparticles with superior electrocatalytic performance toward formic acid oxidation. J. Colloid. Interface Sci. 2022, 613, 515–523. [Google Scholar] [CrossRef]
- Kwon, S.; Eom, S.; Choi, G. Effects of Operating Conditions on the Oxygen Removal Performance of the Deoxo Chamber in the Water Electrolysis System. Energies 2023, 16, 6685. [Google Scholar] [CrossRef]
- Park, T.; Sung, Y.; Kim, T.; Lee, I.; Choi, G.; Kim, D. Effect of static mixer geometry on flow mixing and pressure drop in marine SCR applications. Int. J. Nav. Archit. 2014, 6, 27–38. [Google Scholar] [CrossRef]
- Sung, Y.; Choi, M.; Park, T.; Choi, C.; Park, Y.; Choi, G. Synergistic effect of mixer and mixing chamber on flow mixing and NOx reduction in a marine urea-SCR system. Chem. Eng. Process. Process Intensif. 2020, 150, 107888. [Google Scholar] [CrossRef]
- Chapman, D.L.; Gregory, G. The catalysis by palladium of the union of hydrogen and oxygen. Proc. R. Soc. Lond. A 1934, 147, 68–75. [Google Scholar]
- Adams, B.D.; Chen, A. The role of palladium in a hydrogen economy. Mater. Today 2011, 14, 282–289. [Google Scholar] [CrossRef]
- Völkening, S.; Bedürftig, K.; Jacobi, K.; Wintterlin, J.; Ertl, G. Dual-Path mechanism for catalytic oxidation of hydrogen on platinum surfaces. Phys. Rev. Lett. 1999, 83, 2672–2675. [Google Scholar] [CrossRef]
- Kramer, J.F.; Reihani, S.S.; Jackson, G.S. Low-temperature combustion of hydrogen on supported Pd catalysts. Proc. Combust. Inst. 2002, 29, 989–996. [Google Scholar] [CrossRef]
- Kwon, S.; Eom, S.; Yang, J.; Choi, G. Development of an In-House Code for Dry Tower of Heat Transfer Analysis in Hydrogen Purification System. Energies 2023, 16, 5090. [Google Scholar] [CrossRef]
Disclaimer/Publisher’s Note: The statements, opinions and data contained in all publications are solely those of the individual author(s) and contributor(s) and not of MDPI and/or the editor(s). MDPI and/or the editor(s) disclaim responsibility for any injury to people or property resulting from any ideas, methods, instructions or products referred to in the content. |
© 2023 by the authors. Licensee MDPI, Basel, Switzerland. This article is an open access article distributed under the terms and conditions of the Creative Commons Attribution (CC BY) license (https://creativecommons.org/licenses/by/4.0/).