Abstract
In the quest to scientifically develop power systems increasingly reliant on renewable energy sources, the potential and temporal complementarity of wind and solar power in China’s northwestern provinces necessitated a systematic assessment. Using ERA5 reanalysis data for wind speed and solar irradiance, an evaluation was carried out to determine the potential and spatial distribution of wind and solar power across these provinces. Land use types and terrestrial surface slopes were considered in gauging this potential. Theoretical wind and solar power outputs were then compared to understand their complementarity on annual, monthly, and hourly temporal scales. This exploration utilized methodologies including rank correlation coefficients, crossover frequency analysis, and standard deviation complementarity rates. Areas such as the Tarim Basin, Jungar Basin, and the northeastern part of Xinjiang, northwestern Qinghai, and northern Gansu were identified as having significant wind and solar power potential, with wind power densities reaching as high as 600 W/m2 and solar irradiance surpassing 2000 kWh/m2. In these energy-rich areas, the distinct complementarity between theoretical wind and solar outputs was discerned. On an annual scale, the complementarity appeared weakest, with only 7.48% of the combined provinces’ area showing medium-level complementarity. On a monthly scale, conversely, a pronounced complementarity was displayed, especially during the March–May and October–November periods. When evaluated on an hourly basis, an impressive 63.63% of the total output duration exhibited complementary characteristics.
1. Introduction
From the mid-20th century to 2020, global energy consumption was observed to increase nearly fivefold [1]. This upsurge, primarily driven by fossil fuel usage, heightened concerns regarding the greenhouse effect and ensuing climate change [2,3,4,5]. In light of these concerns, strategic targets were established by China to achieve peak carbon emissions by 2030 and aim for carbon neutrality by 2060 [6,7]. Such initiatives underscored the urgency to shift from traditional energy paradigms to systems predominantly reliant on renewable energies. Within the Chinese context, wind and solar power resources, heralded as scalable clean energy alternatives, are estimated to possess an annual power generation potential exceeding 95 trillion kWh [8], indicating a robust capacity to meet primary energy demands. However, inherent challenges such as the unpredictability, variability, and intermittency of these power sources have been recognized. The seamless integration of such renewables into the power grid might exert pressure on peak power demand and load-following capabilities, potentially culminating in significant energy losses and endangering grid stability [9,10,11]. Concurrently, as China undergoes rapid development accompanied by soaring energy demand, an over-reliance on fossil fuels could undermine its commitment to sustainable development and environmental conservation. Therefore, comprehending the wind and solar power generation potential, along with their temporal complementarity, is pivotal in forming the bedrock of an efficient renewable energy infrastructure.
Literature and regional renewable energy atlases produced by energy bodies have documented substantial variances in wind and solar power potential across diverse regions [12,13,14]. Wind power potential in various Pakistani provinces was analyzed by Asghar et al., and a significant potential for large-scale wind power generation development was identified [15]. JRA-55 reanalysis data were employed by Wen et al. to examine the spatiotemporal variation in wind power potential in the South China Sea, drawing on long-term wind speed shifts and wave conditions. The outcomes revealed ample wind power potential in southern China and southeastern coastal regions [16]. Martins et al. turned to satellite remote sensing and climate data to evaluate Brazil’s solar power potential using the Radiative Transfer Model (BRASIL-SR), revealing the highest solar power potential in the southern territories of Brazil [17]. Furthermore, an extensive evaluation of China’s terrestrial solar power potential was undertaken by Ke et al. [18] through the three aspects of resource abundance, stability, and security, emphasizing regions such as the Qinghai–Tibet Plateau and central-western Inner Mongolia as prime candidates for expansive solar implementations. In contemporary research, the advent of GISs offers innovative methods to discern areas conducive for solar and wind power generation. For instance, Blankenhorn et al. [19] employed a GIS alongside various scenarios to project potential areas for wind power generation, revealing a prospective decrease of 3% to 8% over two decades. Meanwhile, a GIS-centric multi-criteria method was developed by Miller et al. [20] to earmark areas for wind energy expansion in northeastern Nebraska, successfully identifying locations optimally suited for wind farm projects.
Furthermore, to gain a scientific understanding of the complementary patterns in wind and solar power output and to promote a high proportion of clean energy consumption, Viviescas et al. [21] utilized statistical methods such as slope indices and correlation coefficients to evaluate the complementarity of wind and solar power output in certain regions of the Americas (Brazil, Los Angeles). They also predicted the potential changes in the complementarity of wind and solar power generation under climate warming scenarios. Henao et al. [22] uncovered the degree of complementarity among solar power output, wind power output, and hydropower in Colombia across seasons and years. Ren et al. [23] conducted a comprehensive evaluation of the complementarity between wind power and photovoltaics in China, based on the MERRA-2 reanalysis dataset developed by NASA.
Beyond merely focusing on regional evaluations, considerable research has been dedicated to refining methods of complementarity assessment. The current metrics employed in evaluating renewable energy complementarity predominantly fall into two categories: correlation-based and fluctuation-based methods [24,25]. The Spearman correlation coefficient method was adopted by Mohammed et al. [26] to analyze daily wind–solar power complementarity in Annaba Province, Algeria. In a distinct study, the Kendall correlation coefficient was employed by Xu et al. [27] to quantify complementarity and investigate spatial distribution patterns in China. Complementarity in water–wind–solar hybrid systems was also examined by Zhu et al. [28] using correlation coefficients. As for fluctuation-based methods, a novel evaluation metric encompassing standard deviation and rotation angle was proposed by Wang et al. [29], leveraging a multidimensional approach to assess wind–solar power complementarity. Zhang et al. [30] introduced a complementary evaluation model built upon sequence slope and synergy coefficient, while other metrics, such as the standard deviation [31], volatility [32], and ramp rate [24,33], have also found application in this domain.
Notably, the potential of wind and solar power generation is often influenced by a myriad of factors, such as land use type, terrestrial surface slope, conservation policies, and technological advancements in power generation [34,35,36]. It is hypothesized that particularly steep mountainous terrains and densely populated urban areas might significantly impede the potential of wind and solar power generation. Ecologically significant zones, including lakes, forests, and farmlands, are typically subjected to stringent restrictions against renewable energy developments. Despite these postulates, however, related studies quantifying the influence of landform and slope on renewable energy are still absent. Similarly, there also exists a gap in comprehensively evaluating the complementarity of wind and solar power generation across broader time frames such as annual, monthly, and hourly scales, which could provide pivotal information for refined renewable energy dispatching.
To address these limitations, the objectives of the present study include (1) the calculation of the potential and theoretical output of wind and solar power generation from 1950 to 2021 in Northwestern China at an approximate resolution of 10 km, considering influential factors such as land use type and terrestrial surface slope; and (2) the elucidation of spatial and temporal complementarity patterns of wind and solar power generation across various scales, aiming to guide the evolution of predominantly renewable, low-carbon power systems.
The study is structured as follows: Section 2 introduces the study region and data sets utilized. The methodologies for computing potential and theoretical outputs, along with multi-scale complementarity, are detailed in Section 3. Section 4 delves into the results, discussing case studies extensively. The reliability of the outcomes and potential avenues for future research are addressed in Section 5. Finally, the conclusions are encapsulated in Section 6.
2. Study Region and Dataset Description
2.1. Study Region
The geographical boundaries of the study region—encompassing the northwestern provinces of China, specifically Shaanxi, Ningxia, Qinghai, Gansu, and Xinjiang—are illustrated in Figure 1. Located inland, the elevated central expanse of these provinces gradually transitions to lower terrain on the eastern and western peripheries. Here, the mean altitude has been recorded as exceeding 2300 m. As delineated in Figure 2, the predominant land use type as of 2021, in conjunction with the terrestrial surface slope, is represented. Given the heightened altitude, a reduction in the absorption and reflection of atmospheric radiation has been observed. Consequently, a significant proportion of radiation is allowed to penetrate the terrestrial surface. Due to these factors, the region has been identified as a leading solar radiation receptor within China’s borders. Furthermore, the pronounced influence of winter monsoons, vast land formations, and scarce ground-level vegetation—resulting in reduced roughness—have culminated in an enrichment of the wind power resources available. Such conditions denote considerable developmental potential. By the end of 2022, it was revealed that plans had been laid out by the National Energy Administration of China for the establishment of three expansive clean energy bases in this area. An anticipated cumulative installed capacity of wind and solar power resources reaching 132 GW has been projected [37].
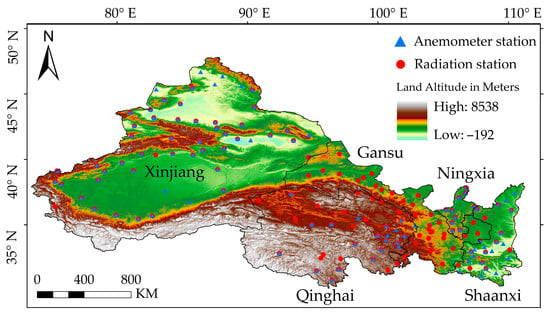
Figure 1.
The five northwestern provinces of China.

Figure 2.
(a) Land use types in the five northwestern provinces of China; (b) terrestrial surface slope.
2.2. Datasets
For this study, an array of datasets was employed, including ERA5 reanalysis meteorological variables, remote sensing records detailing land utilization classifications and terrestrial surface slope, and ground-based observations. The sources, chronological extent, and spatiotemporal resolution of these datasets are systematically cataloged in Table 1.

Table 1.
Overview of utilized data sources.
Wind speed data were sourced from the Daily Meteorological Data in China. Daily observations were derived by averaging readings taken at 2:00 a.m., 8:00 a.m., 2:00 p.m., and 8:00 p.m. It should be noted that variances in the types of sensors, attributed to different stations, were present. However, consistency was maintained by measuring all wind speeds at a height of 10 m. The daily average radiation data were deduced from daily observation metrics such as temperature, humidity, air pressure, and sunshine hours, processed through both the ANN model and the Yang mixture model [38,39].
3. Methodological Framework
3.1. Procedural Design
As delineated in Figure 3, a systematic approach was employed for the study. Wind speed reanalysis data at 10 m, sourced from ERA5, were initially subjected to wind shear for extrapolation to a height of 100 m. Thereafter, the wind speed data acquired at this elevation, when paired with ERA5 solar radiation data, allowed for the computation of wind and solar power potential and their corresponding theoretical power output. The subsequent phase focused on the analysis of complementarity between wind and solar power outputs across varied temporal dimensions, encompassing annual, monthly, and hourly intervals.
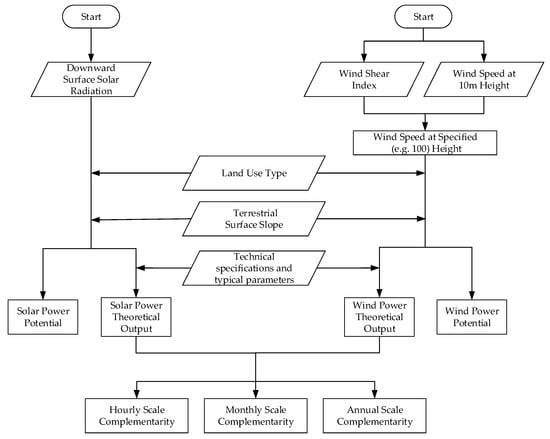
Figure 3.
Flowchart depicting the assessment of solar–wind potential and complementarity.
3.2. Assessing the Reliability of ERA5 Reanalysis Data
Produced by the European Centre for Medium-Range Weather Forecasts (ECMWF), the ERA5-land dataset represents the fifth generation of global atmospheric climate reanalysis datasets. Characterized by a spatiotemporal resolution of 0.1° (approximately 10 km) and 1 h, this dataset integrates 240 surface variables, including parameters such as temperature, pressure, wind speed, and radiation. In distinct areas within China, such as Anhui [40] and the southeastern coast [41], the efficacy of the ERA5-land dataset in mimicking observations had been previously confirmed, particularly in its capacity to reflect wind speed and radiation spatiotemporal distribution dynamics. However, the validation of this dataset had yet to be executed for the northwestern provinces under examination. Hence, a rigorous evaluation was imperative. Grid data associated with wind speed and radiation observations from the ERA5-land dataset were extracted via Python procedures. The succeeding step was characterized by the computation of the Kendall rank correlation coefficient, a metric employed to quantify the accuracy of the ERA5-land dataset’s reflection of observed data.
3.3. Evaluation of Wind Power Potential and Theoretical Output
3.3.1. Evaluation of Wind Power Potential
Predicated on methodologies delineated in preceding research [42], wind power density indicators were adopted to gauge the wind power potential in the examined region. Wind power density, denoted by Dwp, is characterized as the power per unit area perpendicular to the wind’s trajectory and is expressed in W/m2. In line with the established literature regarding wind speed frequency distributions [43,44], the equation for ascertaining wind power density was formulated as follows:
where ρ indicates air density, which is interpreted as the annual mean value. This value is deduced as per Equation (2). The parameter c stands for the wind speed proportion parameter, procured using the standard deviation technique depicted in Equation (3). The Γ() represents the gamma function. The shape parameter, k, is associated with the wind speed’s probability distribution function. For a Rayleigh distribution of wind speed, k is conventionally set to 2.
where P, R, T, and v indicate the annual average atmospheric pressure (in Pa), the gas constant (287 J/kg·K), the annual mean air temperature (in K), and the mean wind speed over a designated span, respectively.
It was observed that the prevalent wind turbines recently commissioned predominantly ascend to a height of 100 m. Consequently, for the purpose of wind power density estimation, the wind shear law formula was invoked to infer wind speed metrics at this altitude, as portrayed in Equation (4).
where v indicates the wind speed at height z (m/s), whereas v0 denotes the velocity at height z0 (m/s). The term α embodies the wind shear index, which is influenced by factors including surface roughness, topography, and temperature. The values for α were sourced from previous studies and technical benchmarks [45,46]. Table 2 shows the values of the wind shear index in diverse land use types:

Table 2.
Wind shear index considering land use type.
Decisions concerning the exact location and turbine configuration within wind farms are typically influenced by a myriad of factors, including geography, ecological regulations, logistical challenges, and regional planning directives. For example, the establishment of electrical infrastructures is precluded in ecologically sensitive zones, such as wetlands and certain agricultural lands safeguarded by national mandates. In a similar vein, landscapes characterized by stark ruggedness or significant inclines are considered ill-suited for wind turbine deployments. Given these constraints, it becomes imperative to consider the intricacies of geographical variances, recent technological advancements in wind resource exploitation, and other limiting factors when evaluating the wind power potential [47]. Utilizing Quantum Geographic Information System (QGIS 3.32.3) tools, the areas deemed unsuitable for large-scale wind power projects were identified and omitted. Wind power utilization rates, informed by the aforementioned determinants, were then calculated, thereby establishing a foundational structure for the in-depth appraisal of wind power potential in this investigation. Previous research contributions [47,48] detailing wind power utilization rates across distinct land use types and diverse terrestrial surface slopes are documented in Table 3 and Table 4.

Table 3.
Wind power utilization rates considering land use type.

Table 4.
Wind power utilization rates at terrestrial surface slope.
Upon factoring in land use types and terrestrial surface slopes, the wind power density equation underwent refinement, as articulated in
The parameters m and n, respectively, represent the distinct land use classifications and terrestrial surface slope categorizations, while SLm and SSn depict the area covered by different land use types and slope gradients within the computational grid. S signifies the total area of the grid under evaluation.
For the taxonomy of wind power potential in earlier research [45,49,50], the multi-annual mean wind power density was sectioned into five discrete tiers, as demonstrated in Table 5, providing a foundational criterion for appraising wind power potential at 100 m.

Table 5.
Wind power potential classification based on Dwp at 100 m.
3.3.2. Calculation of Theoretical Wind Power Output
While the multi-year average of the wind power density indicator was employed during the wind power potential assessment, the study focusing on multi-temporal complementarity necessitated values formulated across hourly, monthly, and annual durations. This ensured synchrony between the dimensions of wind and solar sequences. As such, the theoretical power output of both wind and solar generation on an hourly scale was derived to bolster this aspect of the study.
Theoretical wind power output is not merely a function of wind speed variations. It is tied to factors including the underlying surface characteristics, wind turbine conversion efficiency, dimensional attributes, installation density, and hub altitude as well. Therefore, based on the salient parameters of wind turbines, their spatial density, and the impact of underlying surface characteristics on wind power utilization rates, an augmented formula for theoretical wind power output was crafted as follows:
Within this formulation, n characterizes the spatial density of wind turbine installations; η is indicative of the conversion efficiency inherent to the turbine units; R represents the outer radius of the wind wheel, while ρ and v stand for air density and wind speed at the hub’s elevation, respectively.
Details concerning the installation density and prototypical parameters of the chosen wind turbines are elucidated in Table 6 [51].

Table 6.
Technical specifications and typical wind turbine parameters.
3.4. Evaluation of Solar Power Potential and Theoretical Output
3.4.1. Evaluation of Solar Power Potential
The solar power potential was gauged based on various levels of annual solar total radiation irradiance [52]. The term “irradiance” is described as the cumulative amount of solar radiation received on a unit area within a specific time frame, represented as GHR in units of kWh/m2. Notably, evaluations commonly employ multi-year average irradiance, with the associated classification standards delineated in Table 7.

Table 7.
Solar power potential classification based on annual GHR.
Considerations pertinent to underlying surface characteristics impose restrictions on the optimal locations for solar power stations and the deployment of power generation infrastructure. Therefore, during the evaluation of the exploitable solar power potential, the influences of land use types and terrestrial surface slopes were integrated. It was observed that forests, wetlands, and regions dominated by glaciers or persistent snow accumulations are considered inappropriate for solar power resource exploitation. Furthermore, areas with slopes exceeding 30° are deemed unsuitable for mounting solar power generation devices. In this context, the solar power utilization rates across varied land use types and terrestrial surface slopes are encapsulated in Table 8 and Table 9, respectively.

Table 8.
Solar power utilization rate considering land use type.

Table 9.
Solar power utilization rate considering terrestrial surface slope.
For the calculation of the exploitable annual radiation irradiance within a distinct grid, the formula delineated in Equation (7) was adopted:
where m represents the number of land use type classifications; SLm denotes the area occupied by different land use types within the grid; n signifies the number of slope classifications; SSn is the area occupied by different slopes within the grid; and S refers to the total area of the calculation grid.
3.4.2. Calculation of Theoretical Solar Power Output
Solar power output is influenced not solely by the intensity of solar radiation but also by external factors such as environmental temperature and specific parameters of the photovoltaic panel. Accordingly, the solar power output formula is articulated as follows:
where PS represents the theoretical solar power output; HS represents the solar irradiance; HSTC represents the solar irradiance under standard test conditions; PSr represents the photovoltaic panel rated power; c1 represents the derating factor; c2 represents the power temperature coefficient; TSTC represents the panel temperature under standard test conditions; Ta represents the environmental temperature; TS,TETC represents the panel temperature under estimated test conditions; TaTETC represents the ambient temperature under estimated test conditions; and HTETC represents the solar irradiance under estimated test conditions.
For the configuration of representative photovoltaic panels, data from the research indicated in the study [21] were utilized, with the detailed specification presented in Table 10.

Table 10.
Technical specifications of typical photovoltaic panels.
Upon the integration of variables such as land use type, terrestrial surface slopes, and photovoltaic panel conversion efficacy, a refined expression dedicated to the calculation of theoretical solar power output was derived:
Within this expression, the symbols η and P are indicative of the theoretical conversion efficiency of the photovoltaic panel and the solar power output, respectively.
3.5. Multi-Scale Complementary Evaluation Indices
The complementarity between wind and solar power generation is defined by the synergistic capacity of both sources to enhance electricity outputs and augment their reliability [53]. Several indices have been introduced to assess the complementarity of wind and solar power generation across diverse temporal scales. On the annual and monthly scales, the rank correlation coefficient is adopted as the primary complementary evaluation metric for wind and solar power outputs. For evaluations on the hourly scale, the focus is shifted toward the crossover frequency and the standard deviation complementarity rate as representative metrics.
3.5.1. Kendall Rank Correlation Coefficient
For the annual or monthly cumulative theoretical power outputs of wind and solar, the Kendall rank correlation coefficient is computed. This coefficient plays a crucial role in evaluating the complementarity between wind and solar theoretical power outputs on annual and monthly scales, with its values ranging between [−1, 1].
When the coefficient gravitates towards −1, a divergence in the wind and solar power outputs is observed, wherein wind output ascends while solar output declines, or vice versa. This divergence effectively reduces the combined output’s variability, denoting enhanced complementarity. Conversely, as the coefficient approaches 1, coincident surges or declines in both the wind and solar power outputs become apparent. This concurrent behavior exacerbates the combined output’s variability, indicating diminished complementarity. An inherent advantage of employing the Kendall rank correlation coefficient in this context is its independence from the distributional form of the power output series for both energy sources. Additionally, it has been observed that the coefficient remains relatively unaffected by outlier outputs, such as unusually strong wind events or limited radiation intervals.
For a clearer perspective, the complementarity classifications based on the Kendall rank correlation coefficient are articulated as Table 11:

Table 11.
Complementarity grading based on the rank correlation coefficient.
3.5.2. Crossover Frequency
To assess complementarity on an hourly scale, the crossover frequency (PR) was introduced. This metric represents the number of instances wherein the output of both wind and solar power showcase contrasting trends in consecutive time frames (as expressed in Equation (10)). Subsequently, the proportion of such a crossover was computed (detailed in Equation (11)), with possible values oscillating between [0, 1]. A proportion gravitates towards 1, meaning the fluctuation in the adjacent periods of wind and solar output is more easily offset, further denoting a heightened complementarity between wind and solar power output on this hourly scale. In mathematical terms, given a condition where (xt+1 − xt)(yt+1 − yt) < 0, it can be inferred that the theoretical power output of wind and solar during successive time frames exhibit crossover, elucidating a complementary nature.
where xt and yt are, separately, the theoretical output of wind and solar power at time t, and T is the total number of time intervals under investigation. Ri stands for a logical variable denoting the occurrence of crossover. When (xt+1 − xt)(yt+1 − yt) < 0, Ri is equal to 1. PR represents the crossover frequency. For a comprehensive understanding, the complementarity levels derived from the crossover frequency proportion have been cataloged as Table 12:

Table 12.
Complementarity grading based on the crossover frequency proportion.
3.5.3. Standard Deviation Complementarity Rate
The standard deviation complementarity rate has been utilized to depict the volatility inherent in the total theoretical output of wind and solar power [54]. For an accurate calculation of this rate and to ensure the results are not distorted by magnitude discrepancies, the theoretical output for both wind and solar power are initially normalized, as demonstrated in Equation (12).
where Pt stands for the theoretical power output at a specific time, t, with Pmax and Pmin representing the respective maximum and minimum values within the power output sequence.
Following this normalization, the total output series, denoted by J, is calculated as per Equation (13).
The expression for the standard deviation complementarity rate is subsequently constructed and presented in Equation (14).
Upon examination of this equation, it becomes evident that the ceiling value of the standard deviation complementarity rate rests at 1. A value surpassing 0 insinuates that the consolidated volatility of the total power output falls below the volatility observed in an individual output, alluding to the existence of complementarity. As this value gravitates closer to 1, stronger complementarity is inferred. On the other hand, values at or below 0 suggest an amplification in the total output volatility, denoting an absence of complementarity. The grading standards for complementarity, based on the standard deviation complementarity rate, have been tabulated as Table 13.

Table 13.
Complementarity grading based on the standard deviation complementarity rate.
4. Results and Analysis
4.1. Verification of Data Reliability
Within the delimited study area, encompassing five northwestern provinces of China, a total of 127 meteorological stations were designated for the purpose of ascertaining the reliability of ERA5 reanalysis data. The spatial demarcations of these stations are illustrated in Figure 1. The summarized assessment results pertaining to the reliability of the ERA5 radiation and wind speed datasets are encapsulated in Table 14. For the wind speed, its Spearman correlation coefficient, RMSE, and Scatter Index were also computed, with their respective results collated in Table 15. The temporal delineations for the wind speed are visualized in Figure 4.

Table 14.
Correlation coefficients between ERA5 data and observational metrics.

Table 15.
Spearman correlation coefficient, RMSE, and Scatter Index between ERA5 data and observational data.
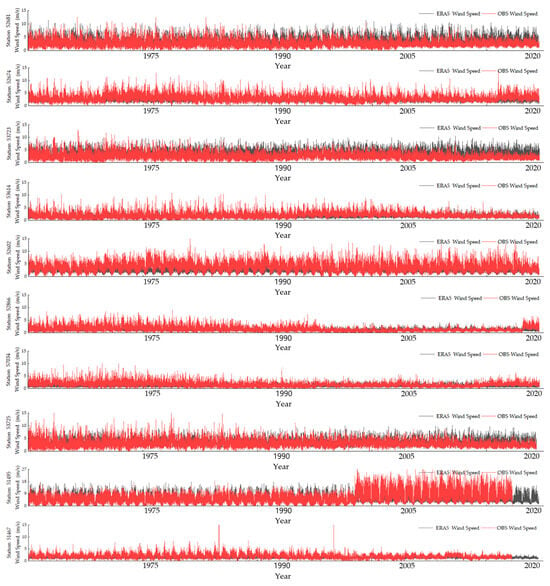
Figure 4.
The time graphs of the ERA5 wind speed and in situ observations at stations 51467, 51495, 52602, 52674, 52681, 52866, 53614, 53723, 53725, 57034.
The observations presented in Figure 4 were generated by meteorological gauges affiliated with the China Meteorological Administration (CMA). According to an assessment report published by the CMA, the data quality was firmly controlled before the release. Some abrupt shifts in wind speed were witnessed in Figure 4, which are typically assumed to be related to the impact of human activities (changes in sensors and gauging location, for instance) and natural variability. For example, at Station 53614 (Yinchuan), a wind speed shift in 1993 was documented by earlier studies [55,56] and closely associated with the natural variability in wind speed. As for the impact of human activities, the relocation of gauging sites has resulted in a significant decrease in wind speed at Station 52866 (Xining) since 1995 [57] and an abrupt escalation at Station 51495 (Shisanjianfang) since 1999 [58]. In addition, the deployment of new sensors or instruments led to an observable variation at Station 52866 (Xining) after 2017.
In spite of the diverse interference aforementioned, an average correlation coefficient exceeding 0.5 was discerned between the ERA5 reanalysis data and terrestrial observations. Additionally, the RMSE associated with wind speed remained within an acceptable range. The congruence in the overarching trend between the ERA5 and observational wind speed data, as evinced in Figure 4, reaffirms the reliability of the data. Such findings hint at a noteworthy alignment between the ERA5 downward ground radiation, wind speed datasets, and observational metrics derived from the stations. It is salient to underscore the exceptional reliability exhibited by the radiation data, characterized by an average correlation coefficient surpassing 0.88. Consequently, the dataset has been posited as potentially apt for evaluating wind and solar power resources across the study region.
4.2. Wind and Solar Power Resource Potential in the Five Northwestern Provinces of China
4.2.1. Potential of Wind Power Generation
The wind power potential, demarcated by wind power density values, has been categorized into five distinct tiers. Without consideration for the influences posed by land use types and terrestrial surface slopes on wind power generation viability, the multi-year mean wind power density and its corresponding grade distribution across the five provinces in Northwestern China are depicted in Figure 5a,c. In these representations, a pronounced spatial gradient is evident, indicating a tapering of the wind power potential from the central–northern intersection outward. An abundance of wind power potential was identified, with regions suitable for wind power generation constituting 39.3% of the area.
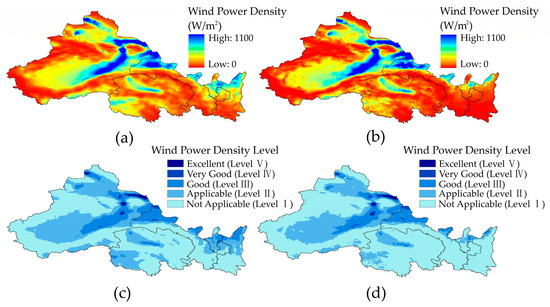
Figure 5.
Multi-year average wind power density and grading: (a) wind power density distribution and (c) wind power density levels without considering the underlying surface characteristics and (b) wind power density distribution and (d) the wind power density levels considering the underlying surface characteristics.
Specifically, in areas that envelop the northern sectors of the research domain—encompassing Tarim Basin, Jungar Basin, and the northeastern part of Xinjiang, as well as the northern regions of Shaanxi, Gansu, and Ningxia—the wind power densities were found to consistently surpass 100 W/m2, reaching Level II gradation. In contrast, the southern parts of the research domain presented a more tempered wind power potential, except for certain pockets of the Qinghai–Tibet plateau. The primary concentration of areas abundant in wind power potential is pinpointed at the junction of Xinjiang, Qinghai, and Gansu. In these locales, the wind power density at 100 m regularly exceeded 250 W/m2. Particularly in regions such as the Turpan Basin and the Hexi Corridor, the wind power densities were observed to soar beyond 600 W/m2, culminating in Level V gradation and signaling an exceptional reservoir of wind power potential.
Upon incorporating the constraints presented by land use types and terrestrial surface slopes into the assessment, alterations in the wind power potential landscape were discerned, as highlighted in Figure 5b,d. The fraction of areas deemed feasible for wind power resource utilization was reduced by 10.1%. Marked variations were especially evident in territories such as Ningxia, northern Shaanxi, and the southwestern sector of Qinghai. In Ningxia and northern Shaanxi, the deviations in wind power potential were largely attributed to factors such as urban population density, agricultural landscapes, pastoral regions, and forest expanses. Conversely, southwestern Qinghai, located at the eastern edge of the Qinghai–Tibet plateau, displayed pronounced topographical variations and steep inclinations. These geographical impediments hinder the installation of wind turbines, thereby constraining the potential for wind power resource exploitation. Comparable challenges were noted in proximity to towering elevations such as the Bayan Har Range.
4.2.2. Potential of Solar Power Generation
The solar power potential, distinguished by total irradiation values, is divided into four categories: most abundant, very abundant, abundant, and average. When disregarding the effects posed by land use types and terrestrial surface slopes, the spatial distribution of the multi-year mean annual solar irradiation and its accompanying gradations across the five northwestern provinces is depicted in Figure 6a,c. These visual representations in Figure 6a,c reveal a considerable solar power potential within the region. It was noted that the annual irradiation values consistently exceeded 1050 kWh/m2, reaching Level C or even higher. Strikingly, regions within Xinjiang, Gansu, and Qinghai that achieved Level A gradation comprised 77.9% of the northwestern provinces. The northwestern segment of Qinghai was found to possess the zenith of irradiation levels, approaching 2000 kWh/m2. However, a comparatively modest solar power potential was discerned in Shaanxi and the northern boundary of Xinjiang. The solar irradiation presented discernible variations in annual patterns between the eastern and western regions. In the west, a decrease in annual solar irradiation was observed with increasing latitude, revealing a south-to-north gradient. Conversely, the eastern parts exhibited a gradual solar irradiation reduction from north to south. Such spatial differences in the eastern region were ascertained to be intricately linked to the precipitation variations, driven by subtropical monsoon patterns and geographical barriers, including the Qinling Mountains and the Loess Plateau. As precipitation levels rose from northwest to southeast in the eastern domain, previous studies [59,60] identified an inverse relationship between solar irradiation duration and precipitation trajectories, elucidating the observed patterns in the annual mean irradiation.
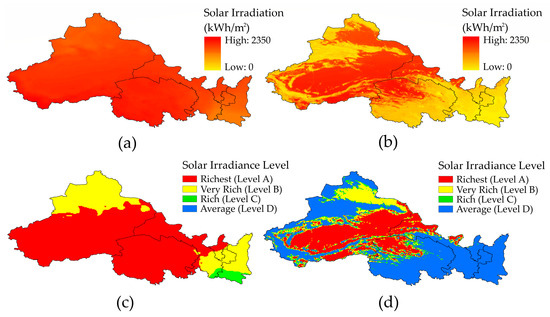
Figure 6.
Multi-year average solar irradiation and grading: (a) solar irradiation distribution and (c) solar irradiation levels without considering the underlying surface characteristics and (b) solar irradiation distribution and (d) solar irradiation levels considering underlying surface characteristics.
Incorporating the impacts of underlying surface characteristics on solar power potential, a transformation in the annual solar irradiation and grade classifications across the northwestern provinces was witnessed, as portrayed in Figure 6b,d. A decline in the solar power generation potential was observed, with notable reductions evident in areas such as northwestern and southwestern Xinjiang, the southern parts of Qinghai and Gansu, Ningxia, and Shaanxi. Upon evaluation against the land use types and terrestrial surface slope schematics (Figure 2), the primary constraints were deduced to include high urban densities, expansive agricultural landscapes, vast forested regions in eastern Shaanxi and Ningxia, and challenging mountainous inclines, all of which impede optimal solar power harnessing. Xinjiang, shaped by the geophysical contours of the Tianshan and Kunlun mountain ranges, presents geographical challenges due to its undulating landscape and precipitous slopes. In contrast, regions such as Qinghai, northern Gansu, and vast sections of Xinjiang, typified by plateaus, basins, and deserts largely dominated by barren terrains, were determined to harbor significant solar utilization propensities, suggesting a profound potential for solar power generation.
4.3. Complementarity of Theoretical Wind and Solar Power Output across Multiple Time Scales
4.3.1. Annual Scale Complementarity
To understand the complementarity between wind and solar power outputs on an annual scale, the Kendall rank correlation coefficient of the annual total theoretical power output sequence was computed. The distribution map of this coefficient is portrayed in Figure 7. As illustrated by Figure 7, high complementarity areas, characterized by yellow to red shades, were predominantly located in the southeastern perimeter of Xinjiang, northern Gansu, southern Qinghai, and sections of southern Shaanxi. Pixels with a rank correlation coefficient below 0.1, indicating weak complementarity or above, encompass 45.65% of the entire investigated area. Contrastingly, areas manifesting intermediate or higher levels of complementarity constituted only 7.48% of the study domain.
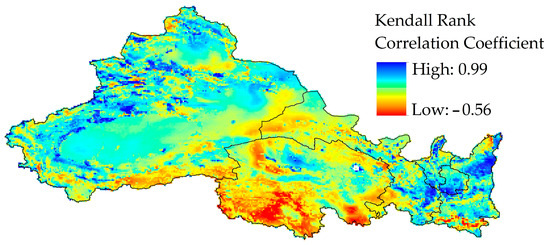
Figure 7.
Annual scale spatial pattern of wind–solar complementarity.
4.3.2. Monthly Scale Complementarity
For an insight into monthly complementarity, the Kendall rank correlation coefficient for the daily theoretical output sequence of wind and solar power within each month was derived and illustrated in Figure 8. The results demonstrated varied complementarity between wind and solar power outputs across different months, primarily reflected in the evolving spatial patterns of complementarity intensities. High monthly scale complementarity was predominantly observed in the Qaidam Basin, the southwestern region of Qinghai, and the Tarim and Jungar Basins of Xinjiang. This high complementarity was most prominent from March to September. Specifically, northeastern Xinjiang exhibited up to nine months of significant complementarity.
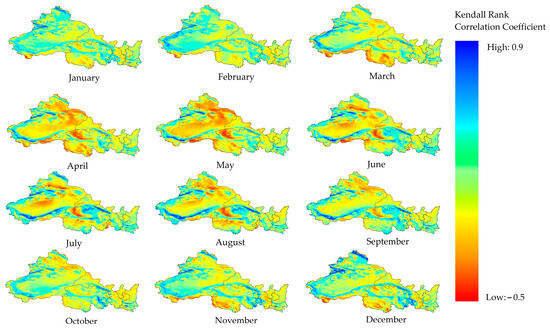
Figure 8.
Monthly wind–solar complementarity spatial pattern.
Further comparative evaluations of the distinct complementarity levels for each month (as shown in Figure 9) revealed that the periods from March to May and October to November were characterized by heightened wind–solar complementarity. During these intervals, regions displaying wind–solar complementarity spanned over 70% of the total study domain, with zones where complementarity achieved a moderate level accounting for roughly 3% of the entire area. Conversely, the months from June to September exhibited reduced complementarity, and a larger proportion of areas showcased minimal complementarity. Notably, variations in complementarity intensity were prominent in regions such as northeastern Xinjiang and certain parts of southern Qinghai.
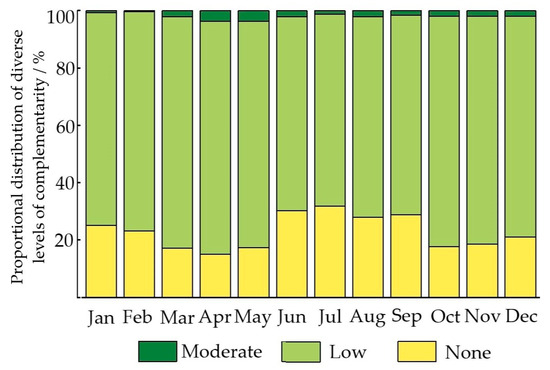
Figure 9.
Proportional distribution of diverse levels of complementarity in individual months.
4.3.3. Complementarity on an Hourly Scale
In order to evaluate the complementarity on an hourly scale, both crossover frequencies and the standard deviation complementarity rate were determined. As demonstrated in Figure 10, a notable hourly wind–solar complementarity was observed within the region of the five northwestern provinces, with most areas sustaining at least a moderate complementarity level. A geographical analysis indicated a clearer complementarity in the northern regions compared to their southern counterparts. Specifically, enhanced hourly complementarity was identified in areas such as the Tarim Basin, Jungar Basin, and the eastern portion of Xinjiang, and the northwestern sector of Qinghai (within the Qaidam Basin). These regions were found to have complementary periods spanning 63.63% of the 1950–2021 timeframe.
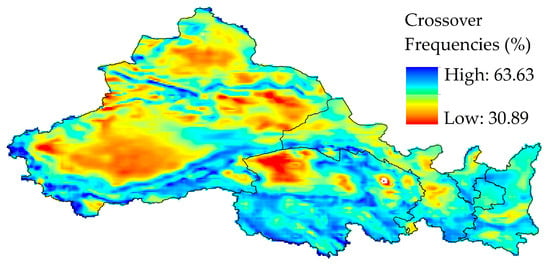
Figure 10.
Spatial pattern of hourly crossover frequencies.
Figure 11 illustrates a distinct transition zone of the hourly complementarity in the southern study domain, characterized by prominent features such as the Kunlun Mountains, Altun Mountains, Qilian Mountains, and Min Mountains. This boundary, as portrayed in Figure 10, coincides with the climatic demarcation between the plateau mountain climate and temperate continental climate. An enhanced complementarity was identified north of this boundary, whereas diminished complementarity was discerned in the southern territories. Such a distinction is primarily attributed to the temperate continental climate prevailing in the northern region. Furthermore, the interactions between wind and solar power outputs in Qinghai’s Qaidam area were found to exhibit pronounced high-complementarity, which is believed to be influenced by its unique geographical positioning.
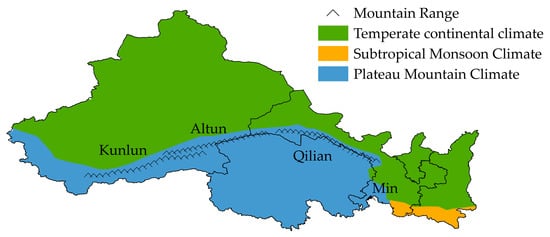
Figure 11.
Climatic zones and mountain ranges.
As depicted in Figure 12, an assessment using the standard deviation complementarity rate further elucidated the hourly complementarity. Within the investigated region, an overwhelmingly positive standard deviation complementarity rate was observed, indicating that the combined output of wind and solar power experienced reduced fluctuations compared to outputs from singular sources. Only 0.1% of the studied area was found to exhibit greater volatility in the total output than in individual resources. Moreover, in 97% of the region, a standard deviation complementarity rate exceeding 0.25 was noted, signifying a high complementarity level. Such findings emphasize the potential of combined wind–solar power output in mitigating the volatility intrinsic to singular-resource theoretical power outputs. Geographical analyses pinpointed the vast expanses of Xinjiang, both eastern and western segments of Qinghai, and sections of Shaanxi as regions displaying significant hourly complementarity.
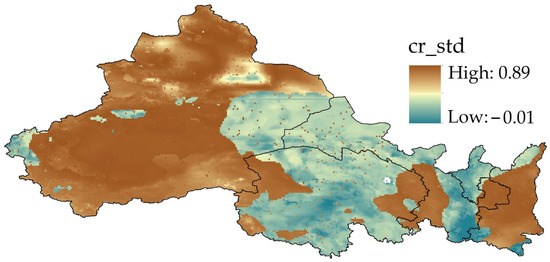
Figure 12.
Geographical distribution of the standard deviation complementarity rate.
5. Discussion
Previous studies focus on assessing the annual-scale wind–solar power complementarity, and the assessment of wind and solar power potential is usually carried out at a low resolution [27,61,62,63,64,65]. A refined analysis of wind–solar power complementarity and potential has been conspicuously absent in earlier studies. Moreover, potential and theoretical power outputs in preceding studies did not factor in restraining elements [66]. In this analysis, a detailed exploration of the potential and multi-scale complementarity of wind and solar power generation was undertaken, considering the influence of land use type and terrestrial surface slope in the five northwestern provinces of China, using ERA5 reanalysis data. Concurrently, high-resolution atlases delineating the potential and complementary spatial distributions of wind and solar power generation were derived.
The regions with significant potential and strong complementarity in wind and solar power generation are considered to be suitable for the application of renewable and clean energy. Based on the results from Section 4.2 and Section 4.3, it was discerned that areas such as the Tarim Basin, Jungar Basin, northeastern Xinjiang, and northwestern Qinghai possess considerable potential for wind and solar power generation. Moreover, a high complementarity between wind and solar power generation was observed in northeastern Xinjiang and northwestern Qinghai. Taking these findings into account, it can be postulated that the northeastern Xinjiang and northwestern Qinghai regions are primed for renewable and clean energy development.
The outcomes of this analysis align generally with the spatial distribution patterns of wind and solar power potential presented in references [27,61,64,65], with numerical values adhering to the same order of magnitude. Notably, a significant improvement in spatial resolution was achieved in this study. Although the results exhibited resemblances to prior studies on wind–solar power complementarity [23,27,54], localized disparities were identified. Various uncertainties inherent to the research processes might account for these differences. For example, the uncertainty of the data quality is a significant factor affecting research reliability. The observation data are spatially limited and lack high-density coverage, while climate model data, such as ERA5, NCEP-CFSR, and JRA-55, may not consistently replicate the meteorological conditions. Thereby, data uncertainties can be largely responsible for variations in the results. In addition, the uncertainty of the methods leads to disparities in results. The methods in this study are based on established mathematical formulas. However, these methods tend to be more theoretical and lack a description of the uncertainty of wind and solar power generation. These inevitable uncertainties necessitate some fundamental assumptions in this study, for instance, wind speed variability is assumed to follow a Rayleigh distribution in Equation (3). Similarly, the values of α and utilization rates based on land-use types and terrestrial surface slopes in Equation (4) are empirically assigned values derived from substantial research, assuming they have identical values in the same classification.
To bolster this study’s comprehensiveness and minimize uncertainty-induced errors, there appears to be a ripe avenue for future research integrating multivariate data sources and diverse methodologies. Future endeavors might also pivot towards amalgamating multiple clean energy sources such as hydropower with wind and solar. Such a multidimensional approach is poised to facilitate peak shaving and valley filling and enhance the absorption of renewable energy [67]. Exploring complementarity through additional metrics, such as extreme value difference complementarity and slope complementarity, is necessary. While there remains room for improvement and refinement, the intrinsic value of this study in providing a foundational theoretical scaffold for renewable energy source planning remains undiminished.
6. Conclusions
In this investigation, an evaluation was conducted on the wind and solar power potential across the five northwestern provinces of China, factoring in influences from surface characteristics, including land use type and terrestrial surface slope. Furthermore, the complementarity of theoretical wind and solar power outputs was examined over three temporal scales—annual, monthly, and hourly—employing methodologies such as rank correlation coefficients, crossover frequency analysis, and standard deviation complementarity rates. The primary findings from this analysis are elucidated below:
- (1)
- The study region was found to be endowed with a wealth of wind and solar power potential. Distinct spatial heterogeneity was observed, manifesting as a heightened potential in the west and a tapering potential towards the east. Regions including the Tarim Basin, Jungar Basin, northeastern Xinjiang, western Qinghai, and northern Gansu were identified as particularly affluent in both wind and solar power resources. The peak values of the average annual wind power density and irradiance were recorded at 1100 W/m2 and 2300 kWh/m2, respectively, highlighting the substantial potential for harnessing renewable power generation.
- (2)
- Across Northwestern China, a perceptible complementarity between the theoretical outputs of wind and solar power generation was detected. This spatial delineation of complementarity paralleled the distribution patterns of wind and solar potentials. Regions rich in wind and solar power potential demonstrated elevated complementarity levels, while areas with less power potential displayed attenuated complementarity. Concentrations of strong complementarity were discerned in regions such as the Tarim Basin, Jungar Basin, eastern Xinjiang, Qinghai Province, and northern Gansu. In contrast, areas such as Shaanxi and Ningxia revealed diminished complementarity, correlating with a spatial pattern of escalating complementarity in the west and its attenuation in the east.
- (3)
- The investigation revealed distinct complementarities at varying temporal scales. The annual scale manifested the least pronounced complementarity, attributed to the relative steadiness of individual wind and solar power outputs; a mere 7.48% of the total area exhibited medium complementarity on this scale. On the monthly scale, increased complementarity was discerned between March-May and October-November, while the period from June to September showcased reduced levels. Throughout the year, zones of medium-level complementarity encompassed about 3% of the total, whereas areas demonstrating any form of complementarity spanned 70% of the entire region. The hourly scale, however, unveiled the most conspicuous complementarity, with complementary periods accounting for 30% to 60% of the total output duration. Moreover, fluctuations from singular resources were effectively mitigated when wind and solar power output were combined at this temporal scale.
Author Contributions
Conceptualization, W.F., C.Y. and D.L.; methodology, C.Y. and B.M.; software, C.Y., L.W. and J.S.; validation, G.F. and L.W.; formal analysis, W.F. and C.Y.; investigation, L.W., D.L. and L.C.; resources, L.C. and Q.H.; data curation, G.F., L.W. and J.S.; writing—original draft preparation, C.Y. and L.C.; writing—review and editing, W.F., B.M. and D.L.; visualization, C.Y., G.F. and J.S.; supervision, Q.H.; project administration, Q.H. and B.M.; funding acquisition, W.F., Q.H. and D.L. All authors have read and agreed to the published version of the manuscript.
Funding
This research was funded by the National Natural Science Foundation of China (grant No. 52009100 and U2243216), the China Postdoctoral Science Foundation (grant number 2021M692602), the Yinshanbeilu Grassland Eco-hydrology National Observation and Research Station, and the Institute of Water Resources and Hydropower Research (grant number YSS2022006).
Data Availability Statement
Data used in this study can be obtained from the publicly accessible websites described in Section 2.
Acknowledgments
We want to sincerely thank the editors and anonymous reviewers for their valuable comments and suggestions.
Conflicts of Interest
The authors declare no conflict of interest.
References
- BP. BP Statistical Review of World Energy 2021; BP Plc: London, UK, 2022. [Google Scholar]
- Shen, M.; Huang, W.; Chen, M.; Song, B.; Zeng, G.; Zhang, Y. (Micro) plastic crisis: Un-ignorable contribution to global greenhouse gas emissions and climate change. J. Clean. Prod. 2020, 254, 120138. [Google Scholar] [CrossRef]
- Okokpujie, I.P.; Okokpujie, K.; Omidiora, O.; Oyewole, H.O.; Ikumapayi, O.M.; Emuowhochere, T.O. Benchmarking and multi-criteria decision analysis towards developing a sustainable policy of just in time production of biogas in Nigeria. Int. J. Sustain. Dev. Plan. 2021, 17, 433–440. [Google Scholar] [CrossRef]
- Toró, G. Production of Electricity at the European Union Level vs. Romania. J. Green Econ. Low-Carbon Dev. 2023, 2, 11–18. [Google Scholar] [CrossRef]
- Aimon, H.; Kurniadi, A.P.; Amar, S. Analysis of fuel oil consumption, green economic growth and environmental degradation in 6 Asia Pacific countries. Int. J. Sustain. Dev. Plan. 2021, 16, 925–933. [Google Scholar] [CrossRef]
- Li, M.; Patiño-Echeverri, D.; Zhang, J.J. Policies to promote energy efficiency and air emissions reductions in China’s electric power generation sector during the 11th and 12th five-year plan periods: Achievements, remaining challenges, and opportunities. Energy Policy 2019, 125, 429–444. [Google Scholar] [CrossRef]
- Zhao, X.; Ma, X.; Chen, B.; Shang, Y.; Song, M. Challenges toward carbon neutrality in China: Strategies and countermeasures. Resour. Conserv. Recycl. 2022, 176, 105959. [Google Scholar] [CrossRef]
- Wang, Y.; Chao, Q.; Zhao, L.; Chang, R. Assessment of wind and photovoltaic power potential in China. Carbon Neutrality 2022, 1, 15. [Google Scholar] [CrossRef]
- Li, Z.; Zheng, Y.; Wang, W.; Fan, Z. Optimal Scheduling of Multi-Source Combined System with Pumped Storage Based on Improved Black Hole Algorithm. J. Nanoelectron. Optoelectron. 2022, 17, 1569–1576. [Google Scholar] [CrossRef]
- Xie, M.; Cheng, X.; Cai, H.; Wang, J.; Liu, S.; Chen, Q.; Liu, X. A hydropower scheduling model to analyze the impacts from integrated wind and solar powers. Sustain. Energy Grids Netw. 2021, 27, 100499. [Google Scholar] [CrossRef]
- Fang, W.; Huang, Q.; Huang, S.; Yang, J.; Meng, E.; Li, Y. Optimal sizing of utility-scale photovoltaic power generation complementarily operating with hydropower: A case study of the world’s largest hydro-photovoltaic plant. Energy Convers. Manag. 2017, 136, 161–172. [Google Scholar] [CrossRef]
- Liu, L.; Wang, Y.; Wang, Z.; Li, S.; Li, J.; He, G.; Li, Y.; Liu, Y.; Piao, S.; Gao, Z. Potential contributions of wind and solar power to China’s carbon neutrality. Resour. Conserv. Recycl. 2022, 180, 106155. [Google Scholar] [CrossRef]
- Arctic Renewable Energy Atlas. AREA Interactive Map & Data System. Available online: https://arcticrenewableenergy.org/event-map/ (accessed on 15 September 2023).
- Energy Sector Management Assistance Program. Global Photovoltaic Power Potential by Country; World Bank: Washington, DC, USA, 2020. [Google Scholar]
- Asghar, R.; Ullah, Z.; Azeem, B.; Aslam, S.; Hashmi, M.H.; Rasool, E.; Shaker, B.; Anwar, M.J.; Mustafa, K. Wind Energy Potential in Pakistan: A Feasibility Study in Sindh Province. Energies 2022, 15, 8333. [Google Scholar] [CrossRef]
- Wen, Y.; Kamranzad, B.; Lin, P. Assessment of long-term offshore wind energy potential in the south and southeast coasts of China based on a 55-year dataset. Energy 2021, 224, 120225. [Google Scholar] [CrossRef]
- Martins, F.; Pereira, E.; Silva, S.; Abreu, S.; Colle, S. Solar energy scenarios in Brazil, Part one: Resource assessment. Energy Policy 2008, 36, 2853–2864. [Google Scholar] [CrossRef]
- Ke, L.; Fanneng, H. Analysis on Mainland China’s Solar Energy Distribution and Potential to Utilize Solar Energy as an Alternative Energy Source. Prog. Geogr. 2010, 29, 1049–1054. [Google Scholar]
- Blankenhorn, V.; Resch, B. Determination of Suitable Areas for the Generation of Wind Energy in Germany: Potential Areas of the Present and Future. ISPRS Int. J. Geo-Inf. 2014, 3, 942–967. [Google Scholar] [CrossRef]
- Miller, A.; Li, R. A Geospatial Approach for Prioritizing Wind Farm Development in Northeast Nebraska, USA. ISPRS Int. J. Geo-Inf. 2014, 3, 968–979. [Google Scholar] [CrossRef]
- Viviescas, C.; Lima, L.; Diuana, F.A.; Vasquez, E.; Ludovique, C.; Silva, G.N.; Huback, V.; Magalar, L.; Szklo, A.; Lucena, A.F. Contribution of Variable Renewable Energy to increase energy security in Latin America: Complementarity and climate change impacts on wind and solar resources. Renew. Sustain. Energy Rev. 2019, 113, 109232. [Google Scholar] [CrossRef]
- Henao, F.; Viteri, J.P.; Rodríguez, Y.; Gómez, J.; Dyner, I. Annual and interannual complementarities of renewable energy sources in Colombia. Renew. Sustain. Energy Rev. 2020, 134, 110318. [Google Scholar] [CrossRef]
- Ren, G.; Wan, J.; Liu, J.; Yu, D. Spatial and temporal assessments of complementarity for renewable energy resources in China. Energy 2019, 177, 262–275. [Google Scholar] [CrossRef]
- Han, S.; Zhang, L.-N.; Liu, Y.-Q.; Zhang, H.; Yan, J.; Li, L.; Lei, X.-h.; Wang, X. Quantitative evaluation method for the complementarity of wind–solar–hydro power and optimization of wind–solar ratio. Appl. Energy 2019, 236, 973–984. [Google Scholar] [CrossRef]
- Ilyushin, Y.V.; Kapostey, E.I. Developing a Comprehensive Mathematical Model for Aluminium Production in a Soderberg Electrolyser. Energies 2023, 16, 6313. [Google Scholar] [CrossRef]
- Guezgouz, M.; Jurasz, J.; Chouai, M.; Bloomfield, H.; Bekkouche, B. Assessment of solar and wind energy complementarity in Algeria. Energy Convers. Manag. 2021, 238, 114170. [Google Scholar] [CrossRef]
- Xu, L.; Wang, Z.; Liu, Y. The spatial and temporal variation features of wind-sun complementarity in China. Energy Convers. Manag. 2017, 154, 138–148. [Google Scholar] [CrossRef]
- Zhu, Y.; Chen, S.; Huang, W.; Wang, L.; Ma, G. Complementary operational research for a hydro-wind-solar hybrid power system on the upper Jinsha River. J. Renew. Sustain. Energy 2018, 10, 043309. [Google Scholar] [CrossRef]
- Wang, X.; Mei, Y.; Cai, H.; Cong, X. A New Fluctuation Index: Characteristics and Application to Hydro-Wind Systems. Energies 2016, 9, 114. [Google Scholar] [CrossRef]
- Zhang, H.; Cao, Y.; Zhang, Y.; Terzija, V. Quantitative synergy assessment of regional wind-solar energy resources based on MERRA reanalysis data. Appl. Energy 2018, 216, 172–182. [Google Scholar] [CrossRef]
- Sorapipatana, C. An assessment of solar energy potential in Kampuchea. Renew. Sustain. Energy Rev. 2010, 14, 2174–2178. [Google Scholar] [CrossRef]
- Shaker, H.; Zareipour, H.; Wood, D. Impacts of large-scale wind and solar power integration on California’s net electrical load. Renew. Sustain. Energy Rev. 2016, 58, 761–774. [Google Scholar] [CrossRef]
- Ikegami, T.; Urabe, C.T.; Saitou, T.; Ogimoto, K. Numerical definitions of wind power output fluctuations for power system operations. Renew. Energy 2018, 115, 6–15. [Google Scholar] [CrossRef]
- Li, Q.; Han, Y.; Liu, X.; Ansari, U.; Cheng, Y.; Yan, C. Hydrate as a by-product in CO2 leakage during the long-term sub-seabed sequestration and its role in preventing further leakage. Environ. Sci. Pollut. Res. 2022, 29, 77737–77754. [Google Scholar] [CrossRef]
- Li, Q.; Wang, F.; Wang, Y.; Forson, K.; Cao, L.; Zhang, C.; Zhou, C.; Zhao, B.; Chen, J. Experimental investigation on the high-pressure sand suspension and adsorption capacity of guar gum fracturing fluid in low-permeability shale reservoirs: Factor analysis and mechanism disclosure. Environ. Sci. Pollut. Res. 2022, 29, 53050–53062. [Google Scholar] [CrossRef]
- Wang, F.; Xiao, Z.; Liu, X.; Ren, J.; Xing, T.; Li, Z.; Li, X.; Chen, Y. Strategic design of cellulose nanofibers@ zeolitic imidazolate frameworks derived mesoporous carbon-supported nanoscale CoFe2O4/CoFe hybrid composition as trifunctional electrocatalyst for Zn-air battery and self-powered overall water-splitting. J. Power Sources 2022, 521, 230925. [Google Scholar] [CrossRef]
- Construction and Operation of Photovoltaic Power Generation in 2022. Available online: http://www.nea.gov.cn/2023-02/17/c_1310698128.htm (accessed on 17 February 2023).
- Wenjun, T. Daily Average Solar Radiation Dataset of 716 Weather Stations in China (1961–2010); National Tibetan Plateau/Third Pole Environment Data Center: Tibetan Plateau, China, 2019. [Google Scholar] [CrossRef]
- National Meteorological Information Centre. Daily Meteorological Dataset of Basic Meteorological Elements of China National Surface Weather Station (V3.0) (1951–2010); National Meteorological Information Centre: Beijing, China, 2020.
- Deng, X.; He, D.; Zhang, G.; Zhu, S.; Dai, R.; Jin, X.; Fu, W.; Shen, W.; Chen, J.; Fan, Y. Comparison of horizontal wind observed by wind profiler radars with ERA5 reanalysis data in Anhui, China. Theor. Appl. Climatol. 2022, 150, 1745–1760. (In Chinese) [Google Scholar] [CrossRef]
- Zhai, R.; Huang, C.; Yang, W.; Tang, L.; Zhang, W. Applicability evaluation of ERA5 wind and wave reanalysis data in the South China Sea. J. Oceanol. Limnol. 2023, 41, 495–517. [Google Scholar] [CrossRef]
- Ulazia, A.; Sáenz, J.; Ibarra-Berastegi, G.; González-Rojí, S.J.; Carreno-Madinabeitia, S. Global estimations of wind energy potential considering seasonal air density changes. Energy 2019, 187, 115938. [Google Scholar] [CrossRef]
- Fyrippis, I.; Axaopoulos, P.J.; Panayiotou, G. Wind energy potential assessment in Naxos Island, Greece. Appl. Energy 2010, 87, 577–586. [Google Scholar] [CrossRef]
- Ohunakin, O.S. Assessment of wind energy resources for electricity generation using WECS in North-Central region, Nigeria. Renew. Sustain. Energy Rev. 2011, 15, 1968–1976. [Google Scholar] [CrossRef]
- Licong, L. Wind Resource Assessment and Wind Farm Micro-Siting Key Model Based GIS. Master’s Thesis, China University of Mining and Technology, Beijing, China, 2014. (In Chinese). [Google Scholar]
- Min, L.; Jie, S.; Hongqing, Y. The study on wind speed change with height under different terrain conditions in Hubei province. Meteorol. Mon. 2010, 36, 63–67. (In Chinese) [Google Scholar]
- Shahbaz, M.; Topcu, B.A.; Sarıgül, S.S.; Vo, X.V. The effect of financial development on renewable energy demand: The case of developing countries. Renew. Energy 2021, 178, 1370–1380. [Google Scholar] [CrossRef]
- Minjie, M. Temporal and Spatial Distribution Characteristics and Development Potential of Global Wind Energy Resource. Master’s Thesis, University of Electronic Science and Technology of China, Chengdu, China, 2018. (In Chinese). [Google Scholar]
- Li, C.; Liu, Y.; Li, G.; Li, J.; Zhu, D.; Jia, W.; Li, G.; Zhi, Y.; Zhai, X. Evaluation of wind energy resource and wind turbine characteristics at two locations in China. Technol. Soc. 2016, 47, 121–128. [Google Scholar] [CrossRef]
- Liu, W.; Lund, H.; Mathiesen, B.V.; Zhang, X. Potential of renewable energy systems in China. Appl. Energy 2011, 88, 518–525. [Google Scholar] [CrossRef]
- Spyridonidou, S.; Vagiona, D.G. Systematic review of site-selection processes in onshore and offshore wind energy research. Energies 2020, 13, 5906. [Google Scholar] [CrossRef]
- Liu, L.; Wang, Z.; Wang, Y.; Wang, J.; Chang, R.; He, G.; Tang, W.; Gao, Z.; Li, J.; Liu, C. Optimizing wind/solar combinations at finer scales to mitigate renewable energy variability in China. Renew. Sustain. Energy Rev. 2020, 132, 110151. [Google Scholar] [CrossRef]
- Sachit, M.S.; Shafri, H.Z.M.; Abdullah, A.F.; Rafie, A.S.M. Combining Re-Analyzed Climate Data and Landcover Products to Assess the Temporal Complementarity of Wind and Solar Resources in Iraq. Sustainability 2021, 14, 388. [Google Scholar] [CrossRef]
- Guo, Y.; Ming, B.; Huang, Q.; Yang, Z.; Kong, Y.; Wang, X. Variation-based complementarity assessment between wind and solar resources in China. Energy Convers. Manag. 2023, 278, 116726. [Google Scholar] [CrossRef]
- Yang, Q. Analysis on the Characteristics of Time Cycle Changes of Meteorological Elements in Ningxia. In Proceedings of the 2006 Annual Meeting of the Chinese Meteorological Society, Sichuan, China, 25–27 October 2006. (In Chinese). [Google Scholar]
- Li, Q.; Yang, J.; Ding, J.; Cai, J. Analyses on variation characteristics of atmospheric visibility and meteorological factors in Ningxia during 1981–2010. Ningxia Eng. Technol. 2018, 17, 102–108. (In Chinese) [Google Scholar]
- Du, J.; Shu, J.; Zhang, L.; Guo, Y. Responses of vegetation to climate change in the headwaters of China’s Yellow River Basin based on zoning of dry and wet climate. Chin. J. Plant Ecol. 2011, 35, 1192. (In Chinese) [Google Scholar] [CrossRef]
- Miao, Y.; Zhuo, S.; Cai, Y.; Cao, X. A comparative analysis of wind data before and after relocation of 13 rooms. Bimon. Xinjiang Meteorol. 2018, 12, 32–39. (In Chinese) [Google Scholar]
- Bett, P.E.; Thornton, H.E. The climatological relationships between wind and solar energy supply in Britain. Renew. Energy 2016, 87, 96–110. [Google Scholar] [CrossRef]
- dos Anjos, P.S.; da Silva, A.S.A.; Stošić, B.; Stošić, T. Long-term correlations and cross-correlations in wind speed and solar radiation temporal series from Fernando de Noronha Island, Brazil. Phys. A Stat. Mech. Its Appl. 2015, 424, 90–96. [Google Scholar] [CrossRef]
- Feng, Y.; Que, L.; Feng, J. Spatiotemporal characteristics of wind energy resources from 1960 to 2016 over China. Atmos. Ocean. Sci. Lett. 2020, 13, 136–145. [Google Scholar] [CrossRef]
- Lv, A.; Li, T.; Zhang, W.; Liu, Y. Spatiotemporal Distribution and Complementarity of Wind and Solar Energy in China. Energies 2022, 15, 7365. [Google Scholar] [CrossRef]
- Sun, Y.; Li, Y.; Wang, R.; Ma, R. Assessing the national synergy potential of onshore and offshore renewable energy from the perspective of resources dynamic and complementarity. Energy 2023, 279, 128106. [Google Scholar] [CrossRef]
- Zhao, D.; Luo, Y.; Gao, G.; Zhu, C. Essential characteristics of solar direct radiation over recent 50 years in China. Acta Energiae Solaris Sin. 2009, 30, 946–952. (In Chinese) [Google Scholar]
- Zhu, R.; Wang, Y.; Xiang, Y.; Sun, C.; Chang, R.; Hu, G.; Gao, Z. Study on climate characteristics and development potential of wind energy resources in China. Acta Energiae Solaris Sin. 2021, 42, 409–418. (In Chinese) [Google Scholar]
- Janke, J.R. Multicriteria GIS modeling of wind and solar farms in Colorado. Renew. Energy 2010, 35, 2228–2234. [Google Scholar] [CrossRef]
- Yu, G. Analysis of the Development Status and Prospect of Multi-energy Complementary Technology. In Proceedings of the IOP Conference Series: Earth and Environmental Science, Jinan, China, 19–21 June 2020; IOP Publishing: Bristol, UK, 2020; p. 022047. [Google Scholar] [CrossRef]
Disclaimer/Publisher’s Note: The statements, opinions and data contained in all publications are solely those of the individual author(s) and contributor(s) and not of MDPI and/or the editor(s). MDPI and/or the editor(s) disclaim responsibility for any injury to people or property resulting from any ideas, methods, instructions or products referred to in the content. |
© 2023 by the authors. Licensee MDPI, Basel, Switzerland. This article is an open access article distributed under the terms and conditions of the Creative Commons Attribution (CC BY) license (https://creativecommons.org/licenses/by/4.0/).