Abstract
A micro gas turbine (MGT) is an advanced technology with a simple structure and fast load response. It represents a good choice for the next generation of distributed power systems, where fossil fuels are going to be largely replaced by biofuels and renewable sources. In this context, this work aims to investigate and compare the performance of gradually more complex energy systems integrating a micro gas turbine plant: simple cogenerating asset, integrating a solar field, presence of a gasifier, and the addition of a bottoming ORC. In all cases, a thermo-economic analysis has been carried out for an application in the agricultural sector. Agricultural waste can be used to create a syngas as fuel for MGT through a gasifier, promoting the utilization of carbon-neutral alternative fuels to reduce harmful emissions. The authors considered the electrical and thermal needs of a hypothetical agri-food company to build the electrical and thermal load curves. The new and more complex cogeneration plant, designed by using the Thermoflex 30 software, leads to an increase in electrical power, recovered thermal power, overall electrical efficiency, carbon neutrality, and cogeneration indexes. In particular, the presence of the solar field promotes a reduction in fuel consumption as well as greater heat input to the thermal unit. The addition of a bottoming ORC system increases the electrical power by 36.4%, without significantly penalizing the thermal unit. Moreover, thanks to the gasifier that offsets the fuel reduction costs, through an economic analysis of the entire plant, a payback time of the investment of less than 4 years is obtained.
1. Introduction
The latest years have witnessed important changes that have affected several aspects of the life on our planet. The National Oceanic and Atmospheric Administration (NOAA) published data reveal that the CO2 concentration in the atmosphere reached 421 parts per million (ppm), 50% more than in the pre-industrial era [1]. The cause of this rapid increase can be found in human activities, including the burning of fossil fuels such as coal to produce energy [2]. Companies represent the largest users of the energy market; therefore, it is necessary to find a solution to deal with both the increase in CO2 concentrations in the atmosphere and the enormous increase in energy costs. To this end, the installation of cogenerating systems capable of producing electrical and thermal energy by efficiently exploiting the energetic content of fuels, allow for companies to autonomously, partially, or almost totally, satisfy their energy needs [3,4].
In this context, the present work describes a combined heat and power (CHP) energy system with a micro gas turbine (MGT), installed in an Italian farm. Starting from the basic MGT plant, various systems are gradually added: a solar field promotes the production of thermal energy for the heat unit, a gasifier capable of exploiting agricultural residues to self-produce a CO2 neutral fuel, and an organic Rankine cycle (ORC) bottoming system to obtain additional mechanical power, and, therefore, electrical energy. The thermodynamic analysis carried out for the several intermediate plants identified the improvements of each inserted subsystem. Furthermore, an economic analysis of the complete “hybrid” plant was performed to verify its feasibility, using the same methodology of ref. [5].
The idea of using a micro gas turbine comes from several papers reported in the scientific literature. Indeed, the increasing demand of highly efficient decentralized power generation with low CO2 emissions finds in this system a very popular means to be able to use alternative fuels as a renewable source of energy [6,7,8,9].
De Robbio widely illustrated in the review [10] the potentiality of MGTs, reporting the latest implementations of this technology and evidencing the flexibility of this power system. As matter of fact, this characteristic makes it possible to use the supply of fuels with chemical and physical properties usually different from those of the standard fuel that is natural gas (NG). Micro gas turbines can operate with liquid fuels as well. The possibility to utilize alternative fuels also allows for the integration of this plant with other different low environmental impact systems [10].
Concentrating solar power (CSP) technology is considered as a promising and viable solution to the fossil fuel replacement in regions characterized by high solar radiation. The maximum temperature achieved by these plants is consistent with those of a MGT. Hence, those studied have been conducted on optimal integration between these two power plants, considering for the solar field: a tower [11], a parabolic dish [12], or parabolic trough collectors [13]. The research is moving towards solutions that aim to associate MGT with CSP to increase the maximum operating temperature of the receiver and consequently increase the conversion efficiency of the thermodynamic cycle. The advantage of this technology is also related to the rapid start/stop of the MGT, good compactness, possibility of using compatible fuels (biogas, methanol), and low water consumption, which is particularly favorable for applications in normally arid environments, with scarcity of water but with a high solar resource.
In this scenario, thermodynamic and economic evaluations are mandatory. Ghavami et al. [14] analyzed a MGT totally powered by concentrated solar power to generate electricity in the range of 5–30 kWe; the levelized cost of energy (LCOE) lowers in the areas with higher annual insolation. In the study [15], a plant integrating a microturbine with a thermodynamic solar system was proposed in order to supply the housing unit with electricity, cooling (during summer), heating, and production of domestic hot water. First, the researchers obtained the load profile of the building and the solar irradiation and after the simulations of the cycle under different scenarios were carried out. To evaluate each plant from an economic point of view, the LCOE was calculated, which verified that the LCOE was lower respect to PV system, but higher than the electricity purchase rates from the grid. Papers [16,17] considered a system characterized by a solar tower integrated with a MGT capable of producing 100/200 kWe for small-scale grids. The central tower system uses many heliostats, which rotate in the direction of solar radiation. The heliostats reflect solar radiation to a receiver located at the top of the tower. The air, after being compressed and preheated by the regenerator (also called “recuperator”), receives additional heat from the radiation reflected on the receiver. This means that the subsequent combustion process is not always necessary in order to reach high temperatures upstream of the expander. The results of these studies demonstrate that, compared to a traditional system, performance improves while reducing CO2 emissions. Furthermore, in [17] the plant was evaluated from an economic point of view, considering the LCOE index, and was revealed to be quite favorable but could be further improved if the plant was associated with a bottoming plant ORC.
In [18], the researchers hypothesized a solar-MGT system combined with steam injection whereas ORC was proposed to improve efficiency and flexibility. The presence of steam injection and ORC results in an increase of up to 30.37 kW added to the 100 kW of MGT. In fact, the combination of microturbines with ORCs enhances the overall fuel efficiency and power output, although increasing the capital cost. Based on these considerations, in [19] the authors showed how a 100 kW microturbine with a relatively low efficiency, if coupled with an ORC, can improve the electrical efficiency going from 30% to 35%. Also, ref. [19] covers the thermo-economic design and optimization of such a bottoming cycle in different seasons of the year, i.e., the performance varies considerably. The developed thermodynamic model analyzed the effects of environmental conditions on the system performance, demonstrating that the cycle outlet power was estimated from 3.70 kW in winter to 9.87 kW in summer, while the lowest and the highest cycle efficiencies were 19.44% and 35.07%, respectively, considering sunny days.
The correct integration of different energy systems is one of the most effective strategies to obtain greater efficiency and reduce polluting emissions. Another key driver toward a totally efficient energy conversion is represented by the development of biomass conversion technologies characterized by limited impact in terms of CO2 emissions. To this end, a study is presented in ref. [20], in which a MGT powered by gas produced by gasification is provided with injections of steam. In the proposed integrated system, a heat recovery steam generator (HRSG) produces steam for both the gasification process and the steam injection. Roy et al. [21] show that the heating value of the producer gas and the bio-energy generation rate in the gasification process would change with the variation in the gasifier fuel. In [22], the authors analyze a biomass gasification CHP plant integrated with either a pre-combustion adsorptive capture process or a conventional post-combustion amine process to achieve carbon-negative power and heat generation. In [23], a study on the microturbine performance using blends of natural gas and syngas from the air gasification of rice hulls was conducted. The microturbine tests show that the efficiency dropped when the fuel changed from pure natural gas to 50% NG/50% syngas blends. The paper [24] aimed to model and simulate a small-scale combined heat and power plant fueled with olive industry wastes, incorporating a downdraft gasifier, gas cleaning and cooling subsystem, and a microturbine as the power generation unit. As matter of fact, the integration of biomass gasification into small CHP plants has been the subject of many recent studies. In ref. [25], the layout of the hybrid solar/microturbine plant powered by biomass from agricultural products (olive pits) was modelled. The gasifier was dedicated to the biomass conversion and the micro gas turbine was optimized for operation with syngas. In particular, the MGT plant was integrated with a solar tower array capable of providing partial or total fuel heating replacement depending on the amount of solar radiation supplied to the working fluid reaching the turbine inlet. The results of this study indicate that the response of the syngas plant can be considered satisfactory in terms of the net power obtained to the detriment of the overall efficiency referred to as the input biomass, due to losses in the gasification process. Furthermore, the characteristics of syngas are very different from natural gas with a smaller LHV value, which leads to an increase in fuel flow rates by shifting the working point of the dynamic machines without inducing critical situations in different operating conditions of the plant.
The previous authors’ works aimed at the study of the Capstone C30 MGT under variable conditions, mainly relying on a CFD methodology. The MGT behavior was analyzed when it was supplied with different fuels from the standard one (NG), like syngas [26] or hydrogen [27], and when a solar tower was added upstream of the combustor [11] which completely changed its operating point and demonstrating a high level of flexibility. Indeed, all these changes alter the air to fuel ratio and consequently affect the MGT combustion development. Instead, in paper [28], the best turbine design was analyzed for the bottoming ORC plant. The whole implant performance was then investigated demonstrating the feasibility and the improvements achievable with the addition of the ORC.
At this point, the target of this work is to put together all these findings and evaluate a more complex power plant in which all the sub-systems can be integrated with the MGT. Therefore, as already stated, starting from the basic configuration with the sole MGT, different plant configurations are thermodynamically studied with the gradual addition of a solar field, a gasifier, and an ORC system. An economic analysis has been performed for the complete implant to evaluate its feasibility.
2. Description of the Examined Plants
The thermodynamic analysis was carried out for a CHP plant based on a 30 kW MGT, starting from its base configuration, and gradually inserting new systems, i.e., a solar field, a biomass gasifier, and an ORC system; the thermodynamic effects of their addition were evaluated. The four plant configurations considered are listed below:
- Case#1: a base cogeneration plant with MGT only;
- Case#2: a solar field is added to Case#1 plant;
- Case#3: a gasifier for the production of syngas from biomass is added to Case#2 plant;
- Case#4: an ORC system is added to enhance the electric output of the Case#3 plant.
In Figure 1 a scheme of the added components in the test cases is reported.
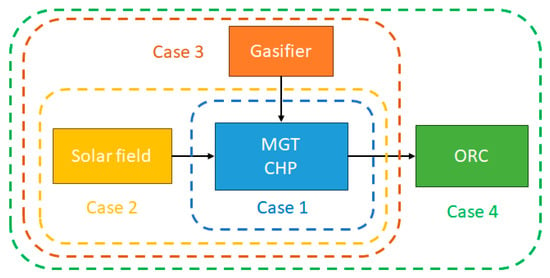
Figure 1.
Schematic diagram of the test cases.
The last case study was further investigated by means of an off-design thermodynamic analysis on a daily and annual basis. The thermodynamic calculations were performed with the Thermoflex code [29].
Before examining the systems taken into consideration for this thermo-economic study, the electrical and thermal load curves had to be identified. These curves were assumed based on the references of a typical Italian agri-food industry [30,31,32].
3. Electric and Thermal Loads
The load was built assuming the following hypotheses:
- The company is closed for 4 days a month for 11 months and 16 days in August. That is for a total of 1440 h/year;
- In the other 305 days, the company works 24 h a day. Then, the total working hours are 7320 h/year;
- The company requires an electrical power of 40 kW for 30% of the operating hours or 2196 h/year;
- The company requires an electrical power of 38 kW for 40% of the operating hours or 2928 h/year;
- The company requires an electrical power of 32 kW for 15% of the operating hours or 1098 h/year;
- The company requires an electrical power of 25 kW for 15% of the operating hours or 1098 h/year.
In Table 1 the annual electrical request of the farm is listed, considering as usual a decreasing order of electrical power demand.

Table 1.
Electric load.
Hence, the electrical total energy required by the company is calculated as:
To build the thermal load curve it is necessary to identify the utilities:
- Hot water at 85 °C for space heating and greenhouses.
- Hot water at 50 °C to supply sanitary users.
The space heating is calculated assuming an area of 100 m2 and a height of 3 m:
where K is the thermal coefficient in kcal/(h·m2) that ranges between 30 and 40 depending on the heat dispersion factors [33].
Two greenhouses are present at the farm that require heat during winter. The heating system is of the “radiant body” type, consisting of steel or high-density polyethylene pipes, arranged at the top, along the side walls, or on the ground of the greenhouse, into which the fluid enters at 80–85 °C. To calculate the heat requirement of greenhouses it is necessary to account for their size, shape, and lining material. The “A-frame” type of greenhouse was chosen [34].
The total area of the greenhouse is assumed equal to: .
For a greenhouse covered with a single layer of glass the global heat exchange coefficient is:
In the greenhouse, the air temperature must be 25–26 °C to ensure the growth of plants and vegetables. Considering an average ambient temperature of 11 °C during winter, the thermal power required for each greenhouse is calculated as:
For two greenhouses: .
Furthermore, the domestic hot water at 50 °C for six sinks foresees a mass flow of hot water of about 6 L/min, equal to: .
Considering that half of the users demands hot water at the same time (3 sinks), the required water flow rate is equal to 0.3 kg/s.
Then, the thermal power required for sanitary users is equal to:
To create the thermal load curve, the year is divided by three periods, considering separately cold and warm months, except for October, because depending on the ambient temperature some utilities can be disabled.
- Period 1: November, December, January, February, March
- Period 2: April, May, June, July, August, September
- Period 3: October
“Period 1” consists of 151 days. Recalling that the company is stopped 4 days per month (480 h), in these hours only the greenhouses need heating, therefore, the thermal load is equal to 30 kW. In the remaining 131 days (3144 h), the company needs to heat the offices, greenhouses, and domestic hot water. So, the required thermal power is calculated as:
“Period 2” consists of 183 days. Again, for each month, except August, the company is stopped for 4 days, which correspond to 480 h. During August the activity is interrupted for 16 days (384); therefore, for 864 h (480 + 384 h) no thermal load is required. For the remaining 147 days (3528 h) the thermal load is lower due to the sole hot water demand:
Finally, “Period 3” consists of only 1 month (31 days). For 4 days (96 h) the company is not operative and only the greenhouses need heating (30 kW). In the remaining 27 days (648 h) of October, it is assumed that the thermal load is due to greenhouses and to the hot water production:
Table 2 summarizes the thermal energy demanded in the different periods and for the different utilities.

Table 2.
Thermal load.
The total thermal energy is:
In Figure 2 and Figure 3 the electrical and thermal loads are displayed, respectively. As already mentioned, the former curve is usually organized in descending order, whereas the thermal load is contemporary to the electrical one.
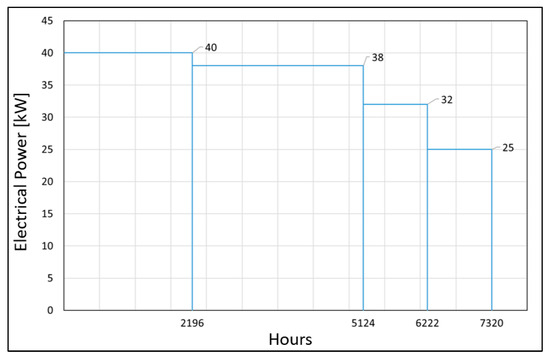
Figure 2.
Annual electrical load.
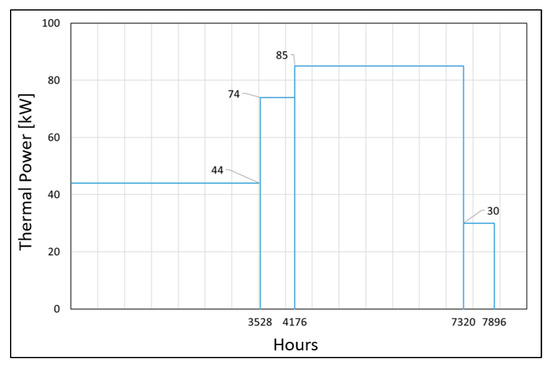
Figure 3.
Annual thermal load.
4. Test Cases
4.1. Case 1: MGT Baseline Configuration
The first examined case was the base CHP with the Capstone C30 MGT fueled by natural gas. The scheme realized with the Thermoflex 30 software is shown in Figure 4. The simulation was performed, setting the operating conditions of the MGT provided by the manufacturer (Table 3).
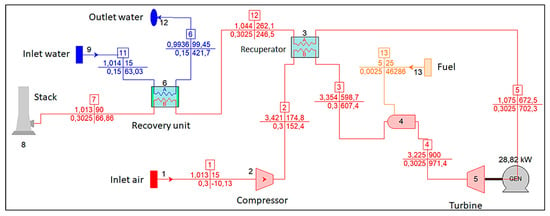
Figure 4.
Case 1 plant scheme (red: air and burned gas, blue: water, yellow: fuel).

Table 3.
C30 micro gas turbine datasheet [35].
In the baseline configuration, the MGT exhaust gas, still at high temperature at the recuperator outlet, releases the additional residual thermal energy in the heat recovery unit (HRU) to obtain hot water during the whole year and heating in the winter months. Water enters the exchanger with a mass flow rate of 0.15 kg/s and a temperature of 15 °C and exits at a temperature of 85 °C. The stack temperature was fixed at 90 °C. In Table 4 the results of the simulation are reported at nominal point.

Table 4.
Case 1 simulation results.
In this phase, the MGT was considered to work constantly at the nominal point throughout the whole year. Therefore, in Figure 5 the electrical (a) and thermal (b) loads are again reported with the addition of a red dashed line to identify the electrical and heat power that the MGT can satisfy.
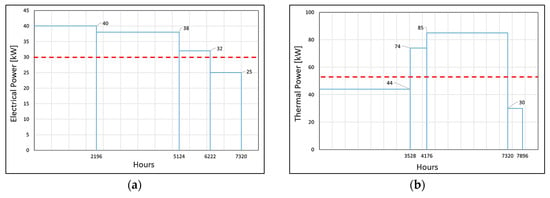
Figure 5.
Required and supplied annual electrical (a) and thermal (b) loads.
The system works for 7320 h per year (h), and it can supply 28.8 kW and 53.8 kW of electrical and thermal power, respectively. The electrical energy is calculated following Equation (1):
For the thermal energy, only the effectively consumed must be considered. Therefore, with reference to Figure 5b, only two blocks below the red line are considered and by using Equation (5):
The amount of thermal energy released by the combustion in a year is obtained as:
The fuel energy utilization factor (FEUF), fuel saving coefficient (FS), and the primary energy saving (PES) are calculated as:
where ηel,ref and ηth,ref are the reference values for the separate electrical and thermal power production, that from the Italian regulations are assumed as 0.46 and 0.9, respectively. The positive cogeneration index values imply the access to statal incentives. Nevertheless, this powerplant configuration should be analyzed in off-design conditions as well, to account for the ambient temperature variations over the year that affect the compressor operation.
4.2. Case 2: MGT/Solar Field Configuration
In this section, the new system features a solar field to obtain better performance. The goal was to preheat the air before it enters the regenerator with the thermal energy captured by the parabolic trough to improve efficiency and emissions compared to the base case. The system diagram is represented in Figure 6. The solar field also includes a storage system with a hot and a cold tank. In this way, it is possible to store excess thermal energy to be able to reuse it in the periods with lower radiation. The air preheating level is a consequence of the solar field dimensioning. The higher the radiation captured by the parabolic trough and receiver is, the higher the temperature achieved by the air before entering the combustion chamber is. However, some assumptions must be made for a realistic choice of the number of mirrors: considering that the next implant foresees the addition of a gasifier that provides fuel from the agricultural residues that means without costs, the solar field was designed to minimize the investment cost, which is strictly linked to the size. Furthermore, a larger solar field could reduce the area used for the cultivation that, on the contrary in this kind of company, must have priority.
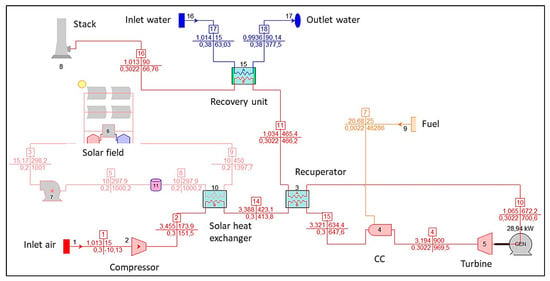
Figure 6.
Case #2 plant scheme (red: air and gas, blue: water, yellow: fuel, pink: diathermic oil).
The smallest implant was obtained by fixing the maximum solar radiation as the maximum over the year, which was achieved on the 21 June 2022 at 12:00.
To achieve a good heat exchange, the efficiency of the solar heat exchanger at 90% was fixed. In this configuration, the air enters the combustion chamber at a higher temperature (634.4 °C) than Case#1 (598.7 °C). Unlike the previous case, the water mass flow rate increased from 0.15 kg/s to 0.38 kg/s, with a consequent greater heat power (110.3 kW), much higher than that required by the user as shown in Figure 7. The temperature trends in solar heat exchange are reported in Figure 8 and, as evident, the curves are quite close to each other, meaning that the heat exchange was taking place without excessive exergy destruction.
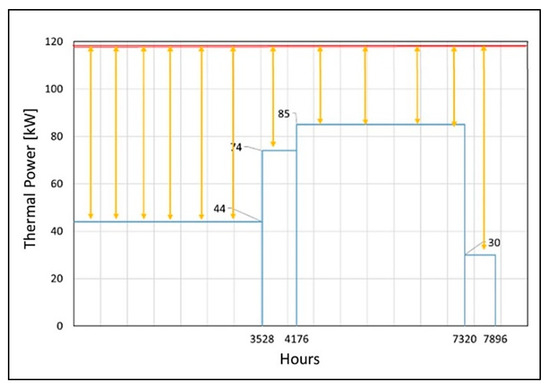
Figure 7.
Heat load.
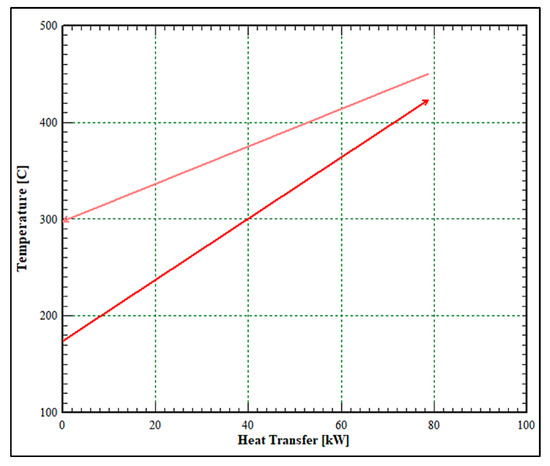
Figure 8.
Solar exchanger heat exchange diagram (red: gas, pink: diathermic oil).
Table 5 shows the results of the simulation compared with those of the Case#1.

Table 5.
Case#2 results.
Thanks to the presence of the solar field with a reflective area of 400.4 m2, an additional thermal power of 79.35 kW was provided to the fluid entering the recuperator. This leads to several advantages:
- ○
- Less fuel was supplied to the MGT;
- ○
- Higher electrical efficiency;
- ○
- Better heat exchange inside regenerator;
- ○
- Higher temperature of the exhaust gases leaving the regenerator and therefore higher thermal power recovered;
- ○
- Lower emissions of pollutants (CO2, SOx).
However, some disadvantages must be accounted for as well: higher auxiliary losses due to an oil circulation pump in the solar field and higher exergy destruction in the heat exchange that takes place in the heat recovery unit.
It must be pointed out that the heat produced by the plant was not fully exploited by the heat unit; therefore, it has further potential to provide additional mechanical work, as it will be seen in Case#4.
4.3. Case 3: MGT/Solar Field/Gasifier Configuration
This section describes the same plant as Case#2 but is characterized by the presence of a gasifier, able to produce a syngas from wood waste from pruning, to feed the MGT. The gasifier chosen was a “one stage-slurry” with two exchangers for cooling the syngas down to 150 °C (Figure 9).
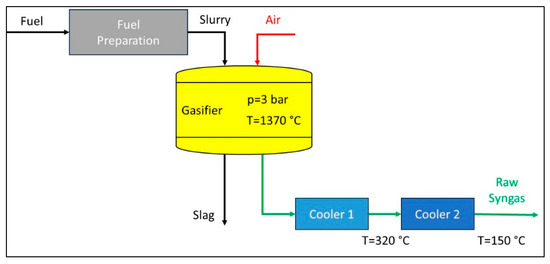
Figure 9.
Gasifier scheme.
Table 6 lists the composition and LHV of the biomass introduced in the gasifier. Once the mass percentages of the species are known, it was possible to calculate the stoichiometric ratio necessary to evaluate the quantity of air to be introduced into the gasifier. The oxidation reactions are reported in (9)–(11).

Table 6.
Properties of the biomass.
The stoichiometric ratio (α) of the I species can be obtained as follows:
It was also necessary to calculate the air/fuel equivalence ratio (λ) to evaluate the quantity of air to be introduced into the gasifier. As known, the air/fuel equivalence ratio and the temperature influence both the gasification process and the calorific value of the syngas produced [36].
For the gasification of a biomass, the typical value varies from 0.2 to 0.4 [37]. Assuming an ER equal to 0.2, the air/fuel ratio is: .
In these conditions, the gasifier works at a pressure of 4.815 bar and at a temperature of 612.8 °C with an efficiency of 87.28%. The syngas leaves the first syngas cooling exchanger at 320 °C and the second one at 150 °C (Figure 9), with a LHV of 7476.5 kJ/kg. The molar composition of the syngas is shown in Table 7.

Table 7.
Syngas molar composition.
An additional syngas cooling exchanger (Figure 10) was inserted to lower the temperature at approximately 28 °C, so that the downstream syngas purification system was able to reduce the H2S content. In fact, the desulfurization system works by cold absorption of H2S.
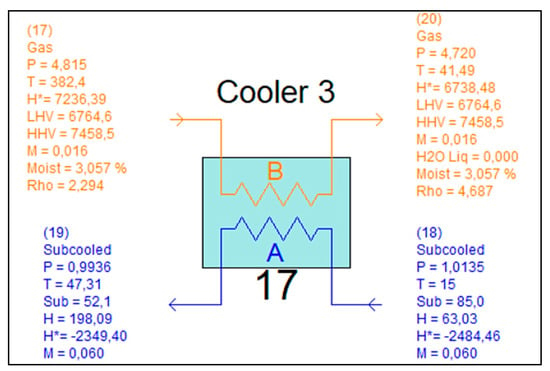
Figure 10.
Syngas cooler.
These impurities, whose concentration in the raw syngas depends on the gasification technology and the biomass used, must be removed to avoid both the emission of pollutants into the atmosphere and the damage of the equipment crossed by the synthesis gas. A syngas purifier was chosen from the Thermoflex library characterized by a H2S removal efficiency value equal to 99%. Finally, downstream of the purification process, a “CO2 capture system” was installed in the plant to capture the CO2 via the utilization of sorbents before the combustion process takes place. In this way, the concentration of CO2 greatly decreases while the concentration of hydrogen, carbon monoxide, and methane consequently increase, leading to an increase in the LHV up to 9141 kJ/kg. The new complete plant is displayed in Figure 11.
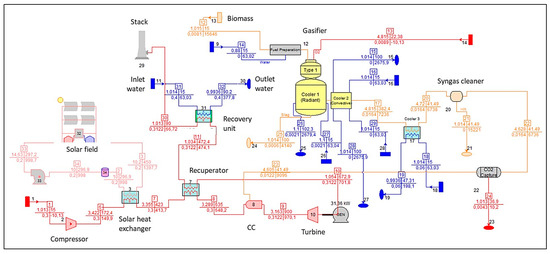
Figure 11.
Case#3 plant scheme (red: air and gas, blue: water, yellow: fuels, pink: diathermic oil).
Table 8 shows the simulation outcomes of this third plant compared with those of the Case#2 ones. As can be seen in the table, due to the reduced lower calorific value of the syngas with respect to the NG, the plant needs a higher fuel flow rate to reach the TIT of 900 °C since the gas flow was changed and consequently the operating conditions of all the other components changed. In particular, the thermal power released by the combustion and the heat retrieved from the recovery unit are increased as well.

Table 8.
Case#3 results.
Although the plant was equipped with a pre-combustion CO2 capture system, the carbon dioxide emissions are higher than in the previous case. This enhancement occurs because the molar concentration of CO2 in the syngas was about 2% compared to the 0.34% contained in the natural gas used in Case#2; however, the energy obtained from biomass was deemed as “carbon neutral”. Instead, the emissions of SOx are lower than the previous case due to the desulphurization process.
From this analysis the advantages of the gasifier are evident:
- Greater electrical and thermal power.
- Lower emissions of pollutants and “carbon neutrality”.
Also, it should be considered that no or less natural gas purchase was needed since the syngas was obtained through the gasification of biomass obtained from agricultural waste from the same farm with relative lower operating costs.
On the other hand, the electrical efficiency decreases due to the higher losses of the auxiliaries. Finally, a decrease in all cogeneration indexes was noted with respect to Case#2, mainly due to an increase in the already mentioned primary energy input. Also, as already observed in the Case#2, the amount of thermal energy was much higher than the heat request (Figure 7) and it could be exploited to obtain additional electricity, as previously mentioned.
4.4. Case 4: MGT/Solar Field/Gasifier/ORC Configuration
Based on the results obtained so far, a fourth plant was created by adding an ORC plant downstream of the microturbine to obtain further electrical power, even at the expense of heat power. This was possible due to the still high temperature of the hot gases leaving the regenerator of the microturbine. The choice of a bottoming ORC plant was due to its capability of exploiting medium–low temperature heat sources. This was possible because the working fluid is an organic fluid characterized by a high molecular weight, a low boiling point, a low latent heat of evaporation, and a high density compared to water. The new scheme built in Thermoflex is illustrated in Figure 12.
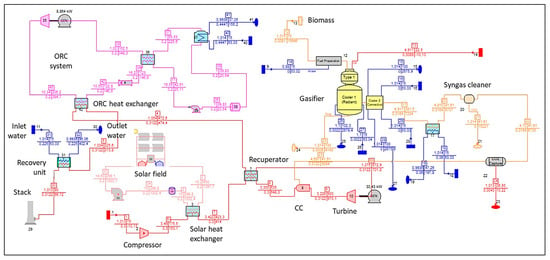
Figure 12.
Case #4 plant scheme (red: air and gas, blue: water, yellow: fuels, pink: diathermic oil).
The hot gases coming from the microturbine recuperator enter the ORC exchanger where they transfer thermal power to the working fluid of the ORC plant. In the Thermoflex library, several working fluids for the ORC system are available; for this analysis, the R365mfc was chosen. The characteristics of such fluid, listed in Table 9, can be obtained from the Thermoflex library and from the scientific literature [38,39].

Table 9.
R365mfc characteristics.
In Figure 13, the ORC system is highlighted: the exhaust hot gases enter the ORC boiler at a temperature of 472.6 °C and exit at a temperature of 325.6 °C. The R365 organic fluid preheated in the recuperator enters the ORC exchanger at a temperature of 122.8 °C and exits at 206.2 °C. The mass flow rate of R365 circulating in the ORC system and vaporizing in the ORC exchanger was equal to 0.2 kg/s. A heat exchange efficiency of 90% was set for the exchanger. The amount of thermal power exchanged was equal to 49.61 kW. Table 10 summarizes the working conditions of the ORC plant.
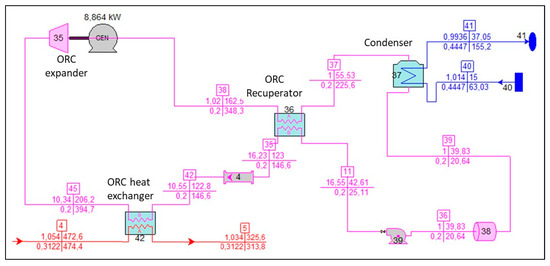
Figure 13.
ORC system of Case#4 plant (red: gas, pink: diathermic oil, blue: water).

Table 10.
ORC system working conditions.
Table 11 shows the numerical results of this plant compared with those of the Case#3. The FEUF remains almost constant since, although the electricity produced increases compared to the previous case as expected, the amount of heat available for the thermal utilities decreases. The hybrid system with ORC favors the production of the electrical power rather than thermal power. The FS and the PES indexes significantly increase compared to the previous case, because the same fuel energy input was more efficiently converted.

Table 11.
Case#4 results.
5. Off-Design Thermodynamic Analysis
A thermodynamic analysis of the plant in off-design conditions was carried out only for Case#4 during the 24 h, considering a day of the year (21 June 2022). In Figure 14 the ambient temperature trend for this day is reported [40]. During the 24 h, both the ambient temperature and solar radiation vary but, to ensure a high efficiency level of the MGT, the TIT was fixed at 900 °C (1173 K). In Figure 15, the thermal power obtained from the solar field is plotted. During the night hours, when there was no solar radiation, the oil temperature could maintain a temperature of at least 400 °C thanks to the storage. Figure 16 and Figure 17 represent the power and the efficiency during the day.
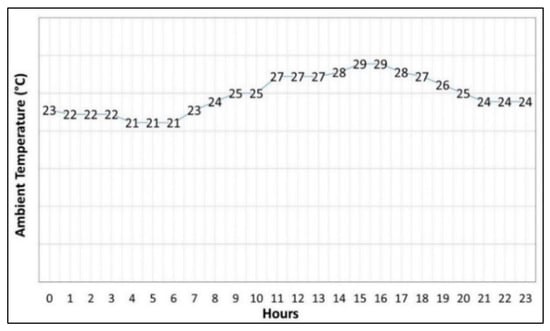
Figure 14.
Ambient temperature during the day.
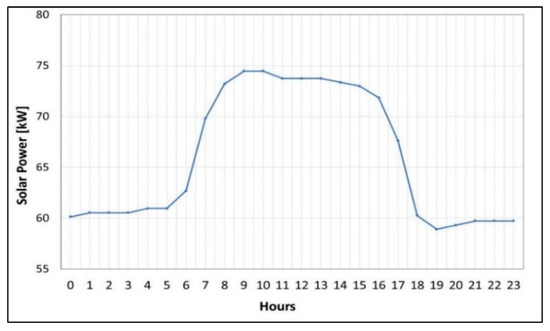
Figure 15.
Thermal power in the solar exchanger during the day.
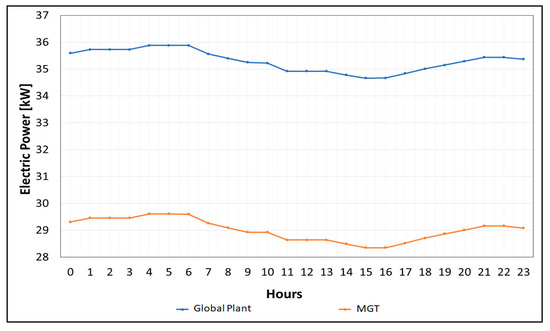
Figure 16.
Total power and MGT power during the day.
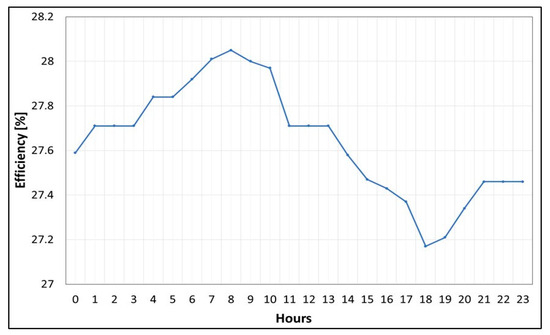
Figure 17.
Efficiency during the day.
As a next step, the thermodynamic analysis was widened to the whole year, considering for each month four hours of the day: midnight, 6 a.m., midday, and 6 p.m. (18:00). Such times were characterized by different radiation conditions and ambient temperatures (Figure 18); hence, the performance of the implant was expected to vary. Indeed, the total electric power in Figure 19 points out a direct dependence on the ambient temperature.
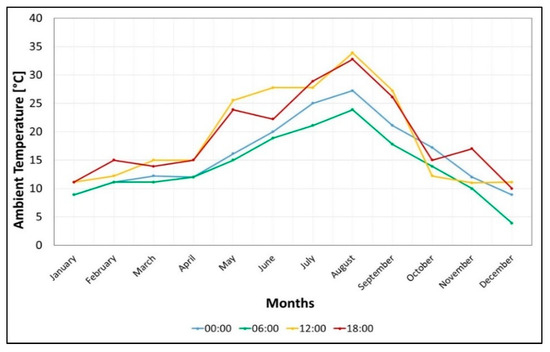
Figure 18.
Ambient temperature during the year.
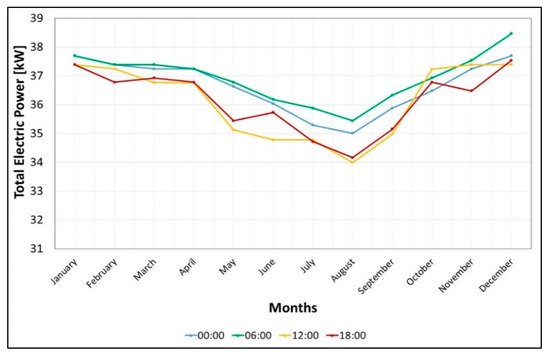
Figure 19.
Total electric power.
During the winter months, the electric power was higher because of the lower ambient temperature which implies a higher density of the air entering the MGT.
The efficiency trends reported in Figure 20 demonstrate that, for almost every month, a performance reduction occurs in the late afternoon (6 p.m.) due to the poor solar radiation and high air temperature (Figure 18). Indeed, the minimum value (26.33%) occurs precisely during the hottest month, August, while the highest efficiency (29.94%) was reached during the coldest month, December, at 6 a.m. when the radiation was not at its maximum level. This means that the ambient temperature has a major impact on performance.
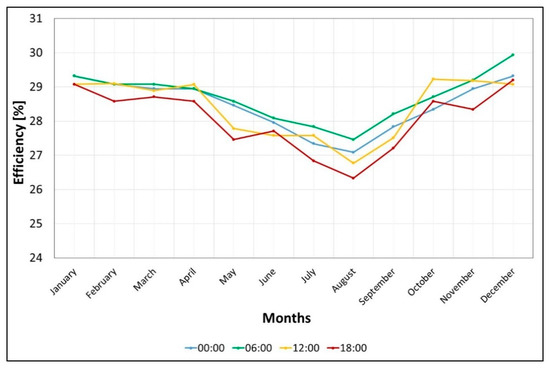
Figure 20.
Overall electrical efficiency.
From the annual analysis it is possible to obtain the average values of both electrical and thermal power that the system delivers during each month; the outcomes are displayed in Table 12. From these values it possible to calculate the average levels of electric and thermal power that it was assumed the MGT/solar field/gasifier/ORC global plant provides over the whole year. These parameters, represented by the red dotted lines in Figure 21a,b, are compared with the electrical and thermal loads reported in the same Figure 21 for the economic analysis of the cogeneration plant.

Table 12.
Average electrical and thermal power for each month and the overall year.
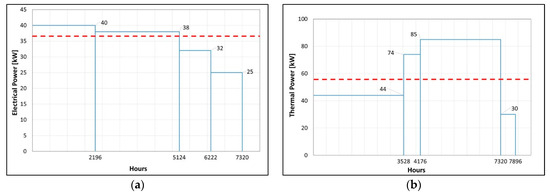
Figure 21.
Average annual electrical (a) and thermal (b) powers delivered by the plant#4.
6. Economic Analysis
The economic analysis of the cogeneration system described in Case#4 is necessary to evaluate the feasibility of plant. The analysis is performed considering Case#1 as the base case. Therefore, only the investment costs and the cashflows obtained with the addition of the solar field, gasifier, and ORC were estimated.
6.1. Investment Costs
The total investment cost was obtained by the sum of the costs for the purchase of the different components of the implant.
As already explained, the cost of the Capstone C30 (of about EUR 18,000 [41]) was not considered in this calculation since it was assumed that the agriculture company is already supplied by the MGT.
The heat recovery unit is a counterflow heat exchanger that must be able to exchange a maximum value of thermal power of 66.81 kW; for a HRU of such size the cost was evaluated at EUR 2600 [42].
The gasification system cost ranges from EUR 5570 to 6545 per kW of mechanical power of the engine that it feeds [43]. Therefore, assuming an average cost of EUR 6000/kW and recalling that the Capstone C30 provides about 30 kW of mechanical power, the cost of the gasifier is EUR 180,000.
The cost of the solar field depends on its area, and it varies from EUR 75 to 120/m2 [44]. Considering the highest value to account for the presence of the two storage tanks, the cost is equal to EUR 120/m2 × 400.4 m2 = EUR 48,048.
For the ORC system the highest cost of EUR 2000 per electric kW delivered was assumed [45] to also account for the presence of auxiliaries. As reported in Table 8, the ORC provides 8.864 kWel and the total cost is equal to EUR 17,728.
Finally, an additional 35 kW boiler at high efficiency must be considered for two reasons: the first is because the CHP plant works for 7320 h, but looking at Figure 21b it is possible to observe that the company requires 30 kW of heat for 7896 − 7320 = 576 h. The second reason is to integrate the peaks of thermal power between 7320 and 3528 h (3792 h), considering the difference between the maximum value of 85 kW and the average value of 56.4 kW that is 28.6 kW, a boiler size of 35 kW is a correct choice. Hence, an additional cost of EUR 2200 was assumed.
In Table 13 the cost of each component and the total value are listed.

Table 13.
Summary of the investment costs.
6.2. Operating Costs
As reported in Table 10, the average electrical power value provided by the system is 36.5 kW; therefore, the amount of electricity produced and self-consumed in a year is calculated as in Equation (1):
The electricity to integrate from the national grid is calculated as:
The surplus electricity to be sold to the national grid is calculated as:
Hence, the company produces and self-consumes 95.4% of the electricity required in a year, while the remaining 4.6% of the electricity is purchased from the national electricity grid. However, the total annual cost of electricity in Italy with reference to 2022 is calculated by adding the energy costs, the grid services costs, and the taxes [46], and it is equal to EUR 4408/year.
Following the same approach, it is possible to calculate the heat produced and self-consumed in the 7320 h in which the system is working:
As already mentioned, a certain amount of heat must be integrated in the hours in which the demand is higher than thermal power provided by the system to supply the greenhouses when the system is not operating. As such, total amount is calculated as follows:
Therefore, the company produces and self-consumes 75.7% of the thermal energy required in a year. The remaining 24.3% of the thermal energy is assumed to be provided by an additional 35 kW high-efficiency (ηboiler = 95%) gas boiler, which is fueled with natural gas. To evaluate the company’s annual fuel cost, it is necessary to know the quantity of gas used each year to power the boiler. Consequently, it is necessary to know the primary energy which can be obtained as:
The total annual cost of the primary fuel (NG) from the gas network is EUR 16,999/year. Again, this value is obtained by accounting for the price of the gas, the grid services cost, and the taxes [46].
Finally, a maintenance cost equal to 5% of the total investment cost must be included: EUR 13,429/year.
The total operating cost of the company will therefore be equal to:
4408 + 16,999 + 13,429 = EUR 34,835/year.
6.3. Economic Results
Before assessing the economic feasibility of the implant, it is necessary to calculate the cogenerating indexes by applying Equations (6)–(8) with reference to the average values in off-design conditions, as reported in Table 14.

Table 14.
Cogenerating indexes.
Since the PES value is much higher than unity, such an implant is recognized as a “high-efficiency system” and can access the statal incentives (white certificate—WC) which attest the achievement of the energy saving. The number of WCs is calculated as follows:
where the coefficient “K” is equal to 1.4 for plants with power up to 1 MWel. In the July of 2022, the price of a WC was equal to EUR 258.08 [47].
Consequently, the incentives that the company could gain are: 258.08 × 8.67 = EUR 2237.55/year. The validity of these incentives is 10 years.
Furthermore, as already seen, the company can sell the surplus of electrical energy produced by the CHP (Eel,plus = 17,568 kWh/year). The price is fixed by the Energy Market to EUR 405.13/MWh [48]. Also, EUR 36.5 must be deducted for the management costs. Hence, the revenue from the sale of the electrical energy is equal to 17,568 × 0.405 − 36.5 = EUR 7078.5/year.
Finally, an avoided cost of the fuel to produce electricity due to the presence of the gasifier must be considered, which is equal to EUR 95,116/year.
At this point, it is possible to calculate the net present value (NPV) and discounted payback period (DPP). The first parameter indicates the profitability of the investment over a long period of time, and it is estimated as follows:
where:
- t = reference year;
- k = weighted average cost of capital;
- n = number of years;
- Ct = cash flows;
The DPP quantifies the number of years after which the total initial investments (I0) return, and depends on NV, as:
Considering the cash flows:
- Incomes due to the surplus of electricity sale (+EUR 7078.5/year);
- Incentives, not considered for the year 0, (+EUR 2237.55/year);
- Avoided cost (+EUR 95,116/year);
- Operating costs, (−EUR 34,835/year).
The resulting discounted payback period is equal to 3 years and 11 months, demonstrating the feasibility of this power plant.
7. Conclusions
This work aimed to illustrate the improvements of a CHP MGT power plant of a farm progressively widened with the introduction of new components, i.e., a solar field, a gasifier, and an ORC system in terms of energy efficiency, cogeneration indexes, reduction in pollutants, and economic convenience.
The thermodynamic analysis in the design conditions demonstrated that the first addition of the solar field enhanced all the cogeneration indexes (FEUF, FS, and PES), while the second addition of the gasifier led to a reduction in these parameters. However, the gasifier was introduced to exploit the wastes of the farm itself allowing for the production of free syngas, that is considered carbon-neutral, to feed the MGT. At least, the presence of the ORC downstream in the MGT enabled the attainment of further mechanical power with a more efficient conversion of the primary energy fuel. Indeed, this perfectly integrated system presented positive cogenerating factors.
Finally, the thermodynamic analysis, on a daily and yearly basis, allowed for calculation of the electrical and thermal energy levels necessary for a feasibility study of the implant.
The net present value and discounted payback period were calculated with reference to the year 2022. The initial investment consisted of the costs of each component except the MGT; the cashflows included the yearly revenue of the sale of the extra electrical power produced, the incentives earned thanks to the cogenerating asset, the avoided costs due to the free production of the syngas, and the price of the electrical and thermal energy that must be integrated during the surplus of demand.
From the thermo-economic analysis carried out for the complete system, the investment is favorable not only for energetic and environmental aspects of the agri-food company, but from an economic point of view as well. In this way, the company manages to recover the invested capital in only 3 years and 11 months.
Author Contributions
Conceptualization, M.C.C.; software, S.A.; validation, M.C.C. and R.D.R.; formal analysis, R.D.R.; investigation, S.A.; resources, M.C.C.; data curation, R.D.R.; writing—original draft preparation, M.C.C. and S.A.; writing—review and editing, R.D.R.; visualization, R.D.R. and S.A. All authors have read and agreed to the published version of the manuscript.
Funding
This research received no external funding.
Data Availability Statement
Not applicable.
Acknowledgments
The plant simulations were performed by the THERMOFLEX 30 software, licensed from Thermoflow Inc. (Jacksonville, FL, USA).
Conflicts of Interest
The authors declare no conflict of interest.
Abbreviations
| CFD | Computational Fluid Dynamics |
| CHP | Combined Heat and Power |
| CSP | Concentrating Solar Power |
| DPP | Discounted Payback Period |
| HRSG | Heat Recovery Steam Generator |
| HRU | Heat Recovery Unit |
| LCOE | Levelized Cost of Energy |
| MGT | Micro Gas Turbine |
| NG | Natural Gas |
| NOAA | National Oceanic and Atmospheric Administration |
| NPV | Net Present Value |
| ORC | Organic Rankine Cycle |
| TIT | Turbine Inlet Temperature |
| WC | White Certificate |
References
- Available online: https://www.noaa.gov/ (accessed on 22 January 2023).
- Hewicker, C.; Hogan, M.; Mogren, A. Power Perspective 2030. 2011. Available online: http://www.roadmap2050.eu/attachments/files/PowerPerspectives2030_FullReport.pdf (accessed on 22 January 2023).
- McDonald, C. Recuperator considerations for future higher efficiency microturbines. Appl. Therm. Eng. 2013, 23, 1463–1487. [Google Scholar] [CrossRef]
- Balli, O.; Caliskan, H. Various thermoeconomic assessments of a heat and power system with a micro gas turbine engine used for industry. Energy Convers. Manag. 2022, 252, 114984. [Google Scholar] [CrossRef]
- Cameretti, M.; De Robbio, R.; Pirone, E.; Tuccillo, R. Thermo-Economic Analysis of a Hybrid Solar Micro Gas Turbine Power Plant. Energy Procedia 2017, 126, 667–674. [Google Scholar] [CrossRef]
- Gholamian, E.; Mehr, A.; Yari, M.; Carton, G. Dynamic simulation and techno-economic assessment of hydrogen utilization in dual fuel (Hydrogen/biogas) micro gas turbine systems for a wastewater treatment plant. Process Saf. Environ. Prot. 2021, 169, 220–237. [Google Scholar] [CrossRef]
- Escamilla, A.; Sanchez, D.; Garcıa-Rodrıguez, L. Assessment of power-to-power renewable energy storage based on the smart integration of hydrogen and micro gas turbine technologies. Int. J. Hydrogen Energy 2022, 47, 17505–17525. [Google Scholar] [CrossRef]
- Ibrahim, I.; Enagi, K.; Al-attab, Z.; Zainal, B.; Teoh, Y.H. Palm biodiesel spray and combustion characteristics in a new micro gas turbine combustion chamber design. Energy 2022, 254, 124335. [Google Scholar] [CrossRef]
- Ayaz, S.; Altuntas, O.; Caliskan, H. Enhanced life cycle modelling of a micro gas turbine fuelled with various fuels for sustainable electricity production. Renew. Sustain. Energy Rev. 2021, 149, 111323. [Google Scholar] [CrossRef]
- De Robbio, R. Micro Gas Turbine Role in Distributed Generation with Renewable Energy Sources. Energies 2023, 16, 704. [Google Scholar] [CrossRef]
- Abagnale, C.; Cameretti, M.C.; De Robbio, R.; Tuccillo, R. Thermal Cycle and Combustion Analysis of a Solar-Assisted Micro Gas Turbine. Energies 2017, 10, 773. [Google Scholar] [CrossRef]
- Giostri, A.; Binotti, M.; Sterpos, C.; Lozza, G. Small scale solar tower coupled with micro gas turbine. Renew. Energy 2020, 147, 570–583. [Google Scholar] [CrossRef]
- Cameretti, M.; Cappiello, A.; De Robbio, R.; Tuccillo, R. Comparison between Hydrogen and Syngas Fuels in an Integrated Micro Gas Turbine/Solar Field with Storage. Energies 2020, 13, 4764. [Google Scholar] [CrossRef]
- Ghavami, M.; Al-Zaili, J.; Sayma, A. A methodology for techno-economic and operation strategy optimisation of micro gas turbine-based solar powered dish-engine systems. Energy 2022, 251, 123873. [Google Scholar] [CrossRef]
- Chahartaghi, M.; Baghaee, A. Technical and economic analyses of a combined cooling, heating and power system based on a hybrid microturbine (solar-gas) for a residential building. Energy Build. 2020, 217, 110005. [Google Scholar] [CrossRef]
- Cameretti, M.; Langella, G.; Sabino, S.; Tuccillo, R. Modeling of a hybrid solar micro gas-turbine power plant. Energy Procedia 2015, 82, 833–840. [Google Scholar] [CrossRef]
- Rovense, F.; Amelio, M.; Scornaienchi, N.; Ferraro, V. Performance analysis of a solar-only gas micro turbine, with mass flow control. Energy Procedia 2017, 126, 675–682. [Google Scholar] [CrossRef]
- Xiao, G.; Chen, J.; Ni, M.; Cen, K. A solar micro gas turbine system combined with steam injection and ORC bottoming cycle. Energy Convers. Manag. 2021, 243, 114032. [Google Scholar] [CrossRef]
- Delavar, M.; Wang, J. Simulation of a hybrid system of solar-microturbines in cold climate regions. Appl. Therm. Eng. 2021, 182, 116080. [Google Scholar] [CrossRef]
- Moradi, R.; Marcantonio, V.; Cioccolanti, L.; Bocci, E. Integrating biomass gasification with a steam-injected micro gas turbine and an Organic Rankine Cycle unit for combined heat and power production. Energy Convers. Manag. 2020, 205, 112464. [Google Scholar] [CrossRef]
- Roy, P.; Datta, A.; Chakraborty, N. An assessment of different biomass feedstocks in a downdraft gasifier for engine application. Fuel 2013, 106, 864–868. [Google Scholar] [CrossRef]
- Oreggioni, G.; Brandani, S.; Luberti, M.; Baykan, Y.; Friedrich, D.; Ahn, H. CO2 capture from syngas by an adsorption process at a biomass gasification CHP plant: Its comparison with amine-based CO2 capture. Int. J. Greenh. Gas Control 2015, 35, 71–81. [Google Scholar] [CrossRef]
- Corrêa, P.P.; Zhang, J.; Lora, E.E.S.; Andrade, R.V.; de Mello e Pinto, L.; Ratner, A. Experimental study on applying biomass-derived syngas in a microturbine. Appl. Therm. Eng. 2019, 146, 328–337. [Google Scholar] [CrossRef]
- Vera, D.; Jurado, F.; Panopoulos, K.; Grammelis, P. Modelling of biomass gasifier and microturbine for the olive oil industry. Int. J. Energy Res. 2012, 36, 355–367. [Google Scholar] [CrossRef]
- Cameretti, M. Modelling of a Hybrid Solar Micro-Gas Turbine fuelled by biomass from agriculture product. Energy Rep. 2020, 6, 105–116. [Google Scholar] [CrossRef]
- Abagnale, C.; Cameretti, M.; De Robbio, R.; Tuccillo, R. CFD Study of a MGT Combustor Supplied with Syngas. Energy Procedia 2016, 101, 933–940. [Google Scholar] [CrossRef]
- Cameretti, M.; De Robbio, R.; Tuccillo, R. CFD Study of a Micro-Combustor under Variable Operating Conditions. In Proceedings of the ASME Turbo Expo 2017: Turbomachinery Technical Conference and Exposition, GT2017-63661, Charlotte, NC, USA, 26–30 June 2017. [Google Scholar] [CrossRef]
- Cameretti, M.; Cappiello, A.; De Robbio, R.; Tuccillo, R. Solar-assisted micro gas turbine with humid air or steam-injected option. Energy 2023, 270, 126783. [Google Scholar] [CrossRef]
- Thermoflow Inc. Available online: http://www.thermoflow.com (accessed on 30 January 2023).
- Available online: http://www.climaesostenibilita.it/Progetti/MODERNO/allegato4.pdf (accessed on 30 January 2023).
- Available online: http://www.crbnet.it/File/Pubblicazioni/pdf/1185.pdf (accessed on 30 January 2023).
- Available online: https://www.enea.it/it/Ricerca_sviluppo/documenti/ricerca-di-sistema-elettrico/risparmio-energia-settore-civile/2014/rds-par2014-046.pdf (accessed on 30 January 2023).
- Available online: https://pasianpellets.it/il-fabbisogno-termico-di-una-casa#:~:text=Il%20fabbisogno%20termico%20in%20Kilocalorie,abitazione%20e%20della%20zona%20climatica (accessed on 30 January 2023).
- Available online: https://www.purdue.edu/hla/sites/cea/article/calculating-greenhouse-heating-requirements/ (accessed on 30 January 2023).
- Available online: https://www.pureworldenergy.com/technology/capstone-products/c30-capstone-microturbine (accessed on 30 January 2023).
- Damartzis, T.; Michailos, S.; Zabaniotou, A. Energetic assessment of a combined heat and power integrated biomass gasification–internal combustion engine system by using aspen plus®. Fuel Process. Technol. 2012, 95, 37–44. [Google Scholar] [CrossRef]
- Žandeckis, A.; Kirsanovs, V.; Blumberga, D.; Veidenbergs, I. The influence of process temperature, equivalence ratio and fuel moisture content on gasification process: A review. In Proceedings of the 27th International Conference on Efficiency, Cost, Optimization, Simulation and Environmental Impact of Energy Systems (ECOS 2014), Turku, Finland, 15–19 June 2014. [Google Scholar]
- Shu, G.; Liu, P.; Tian, H.; Wang, X.; Jing, D. Operational profile based thermal-economic analysis on an Organic Rankine cycle using for harvesting marine engine’s exhaust waste heat. Energy Convers. Manag. 2017, 146, 107–123. [Google Scholar] [CrossRef]
- Köse, Ö.; Koç, Y.; Yağlı, H. Performance improvement of the bottoming steam Rankine cycle (SRC) and organic Rankine cycle (ORC) systems for a triple combined system using gas turbine (GT) as topping cycle. Energy Convers. Manag. 2020, 211, 112745. [Google Scholar] [CrossRef]
- Available online: https://www.wunderground.com (accessed on 20 February 2023).
- Available online: https://www.build-a-biogas-plant.com/PDF/Micro_Turbine_Power.pdf (accessed on 20 February 2023).
- Available online: https://www.ato.com/plate-heat-exchanger-250-300-plate (accessed on 20 February 2023).
- Available online: https://www.irena.org/-/media/Files/IRENA/Agency/Publication/2012/RE_Technologies_Cost_Analysis-BIOMASS.pdf (accessed on 20 February 2023).
- Available online: https://www.rinnovabili.it/energia/termodinamico/costi-solare-a-concentrazione/#:~:text=Costi%20del%20solare%20termodinamico%20tagliati,80%20dollari%20al%20metro%20quadrato%E2%80%9D (accessed on 20 February 2023).
- Leibowitz, H.; Smith, I.; Stosic, N. Cost Effective Small Scale ORC Systems for Power Recovery from Low Grade Heat Sources. In Proceedings of the ASME 2006 International Mechanical Engineering Congress and Exposition, Chicago, IL, USA, 5–10 November 2006. [Google Scholar] [CrossRef]
- Available online: https://www.gse.it (accessed on 28 February 2023).
- Available online: https://www.ri-esco.it/aggiornamento-valore-certificati-bianchi-tee/#:~:text=Nella%20prima%20sessione%20di%20mercato,per%20approfondire%20il%20nuovo%20decreto) (accessed on 28 February 2023).
- Available online: https://www.mercatoelettrico.org/It/WebServerDataStore/MGP_ReportGiornaliero/20220718MGPReportGiornaliero.pdf (accessed on 20 February 2023).
Disclaimer/Publisher’s Note: The statements, opinions and data contained in all publications are solely those of the individual author(s) and contributor(s) and not of MDPI and/or the editor(s). MDPI and/or the editor(s) disclaim responsibility for any injury to people or property resulting from any ideas, methods, instructions or products referred to in the content. |
© 2023 by the authors. Licensee MDPI, Basel, Switzerland. This article is an open access article distributed under the terms and conditions of the Creative Commons Attribution (CC BY) license (https://creativecommons.org/licenses/by/4.0/).