Abstract
Wireless Sensor Networks (WSN) play a major role in various applications, yet maintaining energy efficiency remains a critical challenge due to their limited energy availability. Network lifetime is one of the primary parameters for analyzing the performance of a WSN. This proposed work aims to improve the network lifetime of a WSN by enhancing its energy utilization through the Enhanced Monkey Search Algorithm (E-MSA). The E-MSA provides an optimum solution for this issue by finding a better routing decision by analyzing the available energy on the nodes and the distance between the source and destination. Additionally, a Class Topper Optimization (CTO) algorithm is also included in the work for determining an efficient node to be the cluster head and lead cluster head. In this technique, the data packets are collected by the lead cluster head from the other cluster heads for sending the information in a sequential manner to the base station for reducing data loss. A simulation model is implemented in the NS2 platform with 700 nodes in a 300 × 300 square meter area with 0.5 J of energy to each node for finding the efficiency of the proposed E-MSA with CTO algorithm over the traditional On-Demand Distance Vector (ODV) and Destination-Sequenced Distance Vector (DSDV) approaches. The experimental outcome indicates that the proposed work can reach a maximum lifetime of 1579 s which is comparatively better than the ODV and DSDV approaches by 212 and 358 s, respectively. Similarly, a packet delivery ratio of 79% is achieved with a throughput of 0.85 Mbps along with a delay of 0.48 s for the operation of all 700 nodes.
1. Introduction
Wireless Sensor Networks (WSNs) are self-configured and infrastructure-less wireless networks for collecting various physical and environmental conditions such as temperature, humidity, motion, light and more. The information collected from the sensing region is transferred wirelessly to the base station for observation and analysis. The base station or sink acts like an intermediate medium for the user to access the information from the sensing region. Basically, WSNs are structured with thousands of sensors equipped with transceivers for sharing information between them. Along with that, the power components and computing devices are attached for supplying energy and internal computation [1,2,3]. However, the sensor nodes have high resource constraint and are structured with limited memory, limited energy and limited processing ability. Figure 1 indicates an architectural overview of a general WSN.
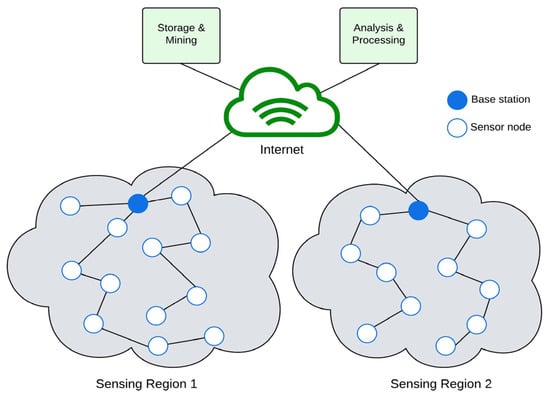
Figure 1.
Components of WSNs.
The sensor nodes are responsible for making a self-organizing network layer on the sensing region based on their resource availability. Therefore, the sensor nodes are initiated to collect the information from their respective sensing regions based on the query received from the control site. The control site is a special device that is used to communicate the information from a user to the sensor node or the base station. It can be used as a control device for operating the sensor nodes for some specific period of time or in a particular sensing region. Similarly, the position or location of the sensor nodes are monitored from a Global Positioning System (GPS) of a Local Positioning Algorithm (LPA). In general, WSNs are classified based on their communication protocol, architecture, application domains and more. Some of the WSN models are classified in Table 1 based on these factors.

Table 1.
Classification of WSNs.
1.1. Motivation of the Work
Energy efficiency is one of the primary considerations for designing a successful WSN. Selection of hardware components, utilization of communication protocols and implementation of energy enhancement strategies play a major role in improving energy efficiency. The proposed work is structured with an energy enhancement strategy through the optimization of a routing path in a WSN. The highlights of the proposed strategy are as follows:
- The cluster head selection process is implemented in the work by the help of the Class Topper Optimization (CTO) algorithm. Cluster head selection is the process of selecting a better node from the group by analyzing its parametric values. The CTO algorithm suits well for this work because it performs continuous analysis that mimics the class test process on finding a topper student.
- The routing path is selected in the work based on the fitness function of an Enhanced Monkey Search (E-MSA) algorithm. WSN routing is the process of delivering a packet from a source to a destination in a shorter way. The E-MSA predicts the shortest path by mimicking the prey search process of a monkey and the process is enhanced by operating it with a novel fitness function for making it suitable to the WSN problem.
From the above two strategies, the following network factors are expected to be improved:
- Network lifetime: Efficient routing saves a lot of energy in every individual node and it is attained in the proposed method by utilizing the E-MSA methodology.
- Uninterrupted monitoring: The CTO algorithm is equipped in the proposed work for providing an uninterrupted communication by selecting an optimum node as a cluster head and lead cluster head.
- Scalability: As a result of improved network lifetime and uninterrupted communication, the proposed work increases the scalability of the network by having a greater number of active sensor nodes that can be used for monitoring a large coverage area.
1.2. Manuscript Outline
The rest of this manuscript outlines the literature survey in Section 2. Most of the methodologies explored in the literature section belong to 2023 and 2022 research publications. Section 3 describes the concepts involved in the proposed method along with their novel customization. The proposed methodology utilizes two novel algorithms for cluster head selection and the routing process. Section 4 indicates the parametric settings on the simulation platform for the verification of the proposed method. The simulation outcome of the proposed work is explored in Section 5 along with a discussion and Section 6 concludes the work.
2. Literature Survey
A hybrid genetic algorithm based on greedy strategy was proposed to improve the network lifetime of an IoT-enabled heterogeneous WSN architecture. A weighted fitness function was calculated in this method by observing distance parameter, node density, average energy and residual energy on the available sensor nodes. The experimental work gave a better network lifespan of 1.59% over the optimized genetic algorithm performed with multiple sink methodology [4]. An optimized cluster head selection-based routing algorithm was developed using the dragonfly algorithm for finding the loop-free routings in the WSNs, where the decision was taken based on the fitness function created from local and global search optimization. It considered the distance between the sensor node and base station, the node density and the residual energy for cluster head selection. The simulation result indicated a better energy consumption rate over the existing clustering and routing methodologies [5]. An optimal routing algorithm was structured using the Hidden Markow Model (HMM) where the energy utilization was limited along with an improvement in optimal data transmission in the WSNs. The experimental work indicated an improvement of 19.05% of network lifetime over the existing algorithms [6].
An aquila optimizer algorithm was introduced to improve the energy efficiency of the WSNs by selecting an optimal cluster head for transferring the packets from one node group to the other groups. The simulation result indicated an improvement in terms of energy availability and the number of nodes active in the connected space over the traditional LEACH and genetic algorithms [7]. A Q deep learning algorithm was developed to localize the position of the sensor nodes in three different symmetries. The algorithm also estimated the distance between the anchor nodes and the destination nodes for making an efficient decision on data transmission. The proposed model was simulated in NS3.30 software where the energy utilization was improved along with the throughput and computational speed [8]. A metaheuristic algorithm was designed by imagining the functions of the digestive system in ruminant animals. The primary motive of this algorithm was to improve the coverage ratio of the sensor nodes, but it also increased the available residual energy on the sensor nodes [9].
The Advanced Efficient—LEACH algorithm was developed to find an optimal sensor node for acting as a cluster head in the network region. The distance between the base station and the sensor nodes and the residual energy level were considered in the work for determining the cluster heads. A particle filter algorithm was also equipped in this work for predicting the target trajectory between each node. The experimental work attained a significant decrease on the Gini index by 78.38% and 85.92% in K-means and the regular LEACH algorithms [10]. An enhanced mobile sink-based coverage optimization and link-stability estimation approach was designed to address the limitation of the routing process in WSNs. The methodology was the combination of the link-stability estimation for routing problems and grid-based red deer simulated annealing for cluster head selection. The proposed work was evaluated in MATLAB simulation where it attained a network lifetime improvement of 99.61% over the previous techniques [11]. An ant colony optimization-based routing algorithm was structured to improve the energy efficiency in WSNs in forest fire detection applications. The simulation network represented an outcome of 30.55% improvement in network lifetime and 14.71% of improvement in network response speed [12].
The traditional LEACH algorithm was incorporated with the dragonfly algorithm for improving the energy optimization in WSNs on IoT applications. The LEACH algorithm was utilized for selecting an optimal node to form the cluster behavior and the dragonfly algorithm was implemented to improve the routing process between the source and destination. The experimental study indicated a better outcome over the existing models in terms of packet transmission ratio and the number of active nodes in the network [13]. An improved sparrow search algorithm was incorporated with a differential evolution algorithm for finding a cluster head in the WSN for improving the energy efficiency. The experimental study indicated an improvement in throughput, residual energy and number of active nodes from different positions of base stations over the traditional LEACH and other optimization algorithms [14]. An improved gray wolf optimization algorithm was proposed to find a cluster head in a WSN for enhancing its energy efficiency. The cluster head balancing factor, sink distance, average intra-cluster head distance and residual energy level were considered in the work for estimating the cluster heads. The proposed work attained a maximum network stability of 333.51% over the fitness value-based improved gray wolf optimization algorithm [15].
A hybrid mayfly–aquila optimization algorithm was employed to identify a better cluster head from the group of nodes. The experimental work indicated an improvement in last node and half node dead time, and also a better energy consumption of 11.26% was achieved over the existing approach [16]. An enhanced graph routing algorithm was developed to find an optimal solution for sensor node communication, and along with that, a covariance matrix adaption evolution strategy was utilized to improve the residual energy rate on the active nodes. The proposed methodology was verified in MATLAB 2020b simulation and indicated an improvement of 87.53% in balanced energy consumption over the existing graph routing with evolution strategy [17]. A hybrid algorithm was designed to make a cluster head selection model for WSNs using artificial bee colony and firefly algorithms. The firefly algorithm was utilized to find the new position for the moving sensor nodes and the artificial bee colony algorithm was used for detecting the cluster heads. The simulation work indicated an improvement in network lifetime and energy stability by 23.21% and 19.84% and it also reduced the network latency by 22.88% [18].
A dragonfly algorithm was proposed to make a loop-free routing in WSNs. The work was also equipped with local and global search optimization techniques for making decisions on the routing space. Therefore, the work performed the optimal cluster head selection process as well as the efficient routing process for improving the energy efficiency. The distance between the source and destination, residual energy and node density were considered in the work for the analysis. The simulation work indicated an improvement in packet delivery ratio, number of alive nodes and average energy consumption over the previous methods [5]. An electrostatic discharge algorithm was designed to find the cluster head and shortest routing in WSNs in multihop environments. The simulated result indicated a reduction in the number of dead nodes by 25.8% and increased the network latency and packet delivery rate by 66.46% and 32.28% over the regular LEACH algorithm [19]. A unique fitness function was proposed to implement in the genetic algorithm for optimizing the energy consumption in WSNs. The experimental study presented a 50% decrease in energy consumption over the generic algorithm proposed with the regular fitness function [20]. An adaptive hierarchical-clustering-based routing protocol was implemented in energy-harvesting-based WSNs to ensure uninterrupted coverage of the sensing region. It was achieved by distributing the adjustment of data transmission and controlling the number of nodes in energy-harvesting mode [21].
It has been observed from the literature study that routing enhancement and clustering are the most widely used methodologies for improving the energy efficiency in WSNs [22,23,24]. However, data compression and topology control are some of the methods utilized in some of the WSN models. Table 2 represents the concepts of certain approaches rather than the clustering and routing techniques.

Table 2.
Concept of energy-saving methodologies in WSNs.
Apart from the optimization-based routing and clustering models, certain hardware-based methodologies like renewable energy generation are also included for improving the energy utilization in WSNs. Similarly, the outcome of the renewable energy generation is also optimized through the Adaptive Neuro-Fuzzy Inference System (ANFIS), Teaching–Learning-Based Optimization (TLBO) and Fuzzy algorithms. An adaptive energy management strategy was introduced for energy-constrained WSN nodes, employing a hybrid energy system with a photovoltaic device, Li battery and supercapacitor. By analyzing irradiation intensity, load consumption and battery/supercapacitor charge states, the strategy estimates energy shortages due to future wake-up pulses and adjusts Li battery power accordingly. Simulations confirm significantly reduced battery capacity loss and extended WSN node lifespan [25]. The challenge of limited energy supply in WSNs for IoT applications is addressed through a novel approach by harnessing ambient solar energy for recharging WSN node batteries. Simulation results demonstrate a substantial increase in network lifespan from 5.75 days when operating at a 25% duty cycle, accompanied by improved network throughput from 100K bits/s to 160K bits/s [26]. However, the security attacks play a major role in draining the energy availability in the sensor nodes by injecting malicious information, which results in poor operational outcomes [27,28].
It has been observed from the literature that the environmental conditions and energy source availability are some of the natural factors that affect the energy performance of a WSN. Similarly, inefficient hardware, complex optimization algorithms, continuous data transmission, data prioritization, security and lack of network management are some of the artificial factors that reduce the energy performance in WSNs. The proposed work aims to address the artificial factors that affect the performances of WSNs by making a customized energy-aware routing algorithm for reducing its complexity. At the same time, a new combination of cluster head selection algorithms is included in the work ensuring its continuous data transmission in an efficient manner. The following section explores the architectural view of the proposed method.
3. Proposed Method
The energy enhancement methodology used for a WSN is decided based on the nature of the application and its resource accessibility. The proposed work aims to design an optimal energy enhancement technique that can be implemented universally on any WSN application. The proposed work utilizes the Class Topper Optimization [29] for cluster head and lead cluster head formation and it is structured with the Enhanced Monkey Search Algorithm (E-MSA) for routing between the cluster heads or with a lead cluster head. Figure 2 indicates the architectural overview of the proposed method, where the cluster heads are identified based on the energy-aware method and the cluster nodes are grouped through the density-based method. The communication between the cluster heads and the base station is organized in this approach through a lead cluster node for reducing packet drop on long-distance communication. The lead cluster head is the cluster head node of a cluster that is positioned very close to the base station with good energy availability. The cluster heads are also allowed in the methodology to reach the lead cluster head by the help of their neighbor cluster head to ensure minimum energy utilization and packet drop.
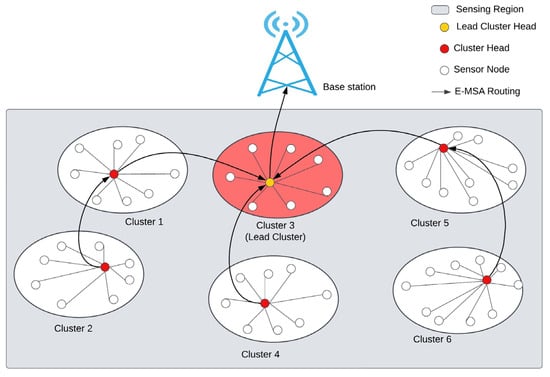
Figure 2.
An E-MSA routed wireless sensor network.
3.1. Cluster Head and Lead Cluster Head Formation with Class Topper Optimization (CTO)
The CTO is a population-based metaheuristic method that mimics the learning behavior of students in a group. A class topper is elected by analyzing the performance of all the students, and in the same way, the proposed method identifies a cluster head by evaluating the energy level, location and distance towards the base station of each node. By considering these factors, the CTO provides a global optimal solution for predicting the cluster heads and the lead cluster head. Figure 3 represents the graphical overview of the CTO algorithm. Here, a class is considered as the sensing region of the WSN. Each section is represented as a cluster and the section topper is considered as the cluster head. Similarly, the class topper is considered as the lead cluster head. The courses given to the section students are the factors or information about the sensor nodes and the PI represents the performance index of each sensor node by evaluating their energy, location and distance factors.
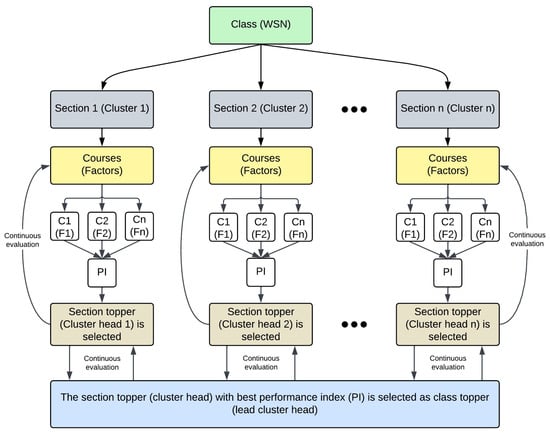
Figure 3.
Architectural view of the Class Topper Optimization algorithm.
In general, the students obtain knowledge and guidance from the section topper and the class topper gives guidance to the section toppers. In the same way, the nodes in the cluster receive packet transmission assistance from their respective cluster heads. However, if the performance of the cluster head degrades, then the next top PI node will become activated as a cluster head by the continuous evaluation process with respect to time . Similarly, the continuous evaluation process is also implemented on the class topper/lead cluster head selection process for making the next PI high cluster head node to become activated as the lead cluster head. Mathematically, the packet transmission process can be expressed as follows:
where the following applies:
- P = Packets with data
- N = Node
- F = Summation of factors F1, F2 … Fn
- CH = Cluster head
- PI = Performance index
- CN = Next top node to the CH
Similarly, the mathematical representation of packet transmission from the cluster head to the lead cluster node is represented as follows:
where the following applies:
- LCH = Lead cluster head
- LCN = Next top cluster head to the LCH
3.2. Routing with Enhanced Monkey Search Algorithm (E-MSA)
The E-MSA is utilized in the work to provide an optimal solution for the routing problem in WSNs. An efficient routing is ensured in this approach based on the position and energy availability of the cluster heads in the sensing region. It also considers the shortest path for transferring the data packets from the source to the destination. Figure 4 represents the routing strategy of the E-MSA where four clusters of sensor nodes are placed in the sensing region with different energy levels ‘E’ and data packets ‘DP’. The proposed E-MSA estimates the distance between each cluster along with its energy availability for selecting an optimized route to transfer the data packets to the destination.
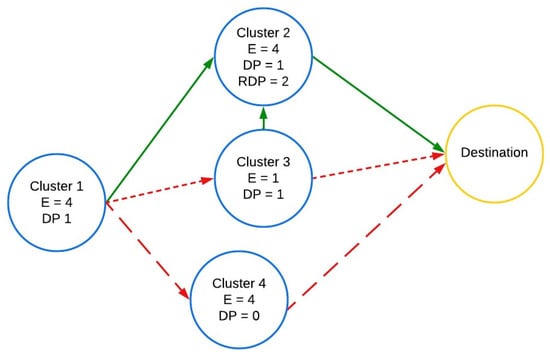
Figure 4.
E-MSA routing strategy.
In Figure 4, cluster 1, cluster 2 and cluster 3 are organized with a DP value of 1. Similarly, an E value of 4 is given to cluster 1, 2 and 4. Cluster 3 is placed with an E value of 1. Hence the E-MSA assists cluster 1 to transfer its DP to the destination through cluster 2 as the E level of cluster 3 is very low even though its distance is very short. This reduces the data loss presence due to poor energy availability inn the cluster heads. RDP indicates the number of data packets received by a cluster head from its neighbor cluster heads. Cluster 3 transfers its DP to cluster 2 as its E level is very low which cannot be sufficient to transfer the DP to the destination directly. The proposed E-MSA attains an optimum route by analyzing the local leader position and the global leader position. The architectural flow of the E-MSA is presented in Figure 5. The traditional Monkey Search Algorithm (MSA) is structured to be operated as a single monkey path planning algorithm for its prey. Search space, randomness, iteration time and fitness criteria are the variables of a general MSA model. In the Enhanced-MSA the action of a monkey is considered as a sensor node and the monkey prey searching process is considered as the sensor nodes’ action in routing the data packets to the destination. In the proposed work, the MSA algorithm is enhanced by customizing the search space with respect to the number of clusters connected in the clustering region and the iteration time is the same as of the time given to the CTO for its continuous evaluation. The proposed E-MSA model is also equipped with a fitness function that regulates the route-searching process to meet a better string with minimum iterations.
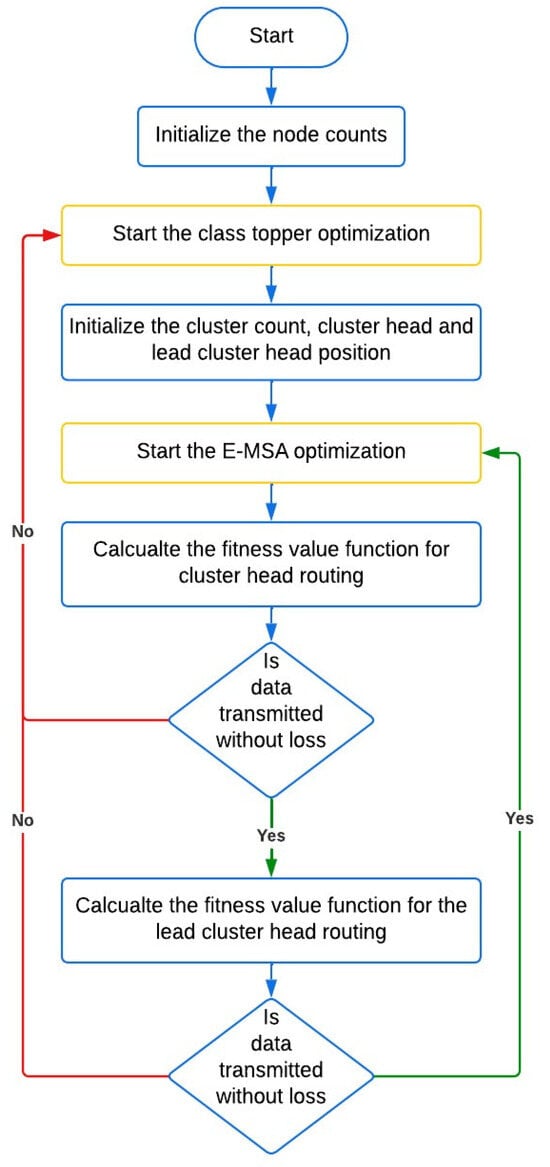
Figure 5.
Workflow of the proposed E-MSA with CTO algorithm.
3.2.1. Initialization
The E-MSA is initialized with N cluster nodes and each cluster node mimics the activity of a monkey for moving its position towards its prey or the destination. Each monkey is initialized by as per the following equation where j represents its direction:
where the following applies:
- and = boundaries of in th direction
- = uniform distributed random number
3.2.2. Local Leader Position and Learning Phase
In the local leader position phase, each node in the cluster transfers its data packets towards its cluster head irrespective of distance and energy availability. The performance of the cluster head is evaluated by the data transmission experience of the cluster nodes and a new cluster head will be introduced when there is a lag in the cluster head communication. The position of a cluster head is analyzed by the following fitness function:
where the following applies:
- = local optimal individual of a cluster head at th cluster in th direction
- = updated node of in th direction
The cluster head position is updated when its fitness value extracted from Equation (6) is higher than the fitness value analyzed by the next node in the cluster.
3.2.3. Global Leader Position and Learning Phase
Global leader position refers to the position of the present lead cluster head and the position of the present lead cluster head is updated with respect to the communication experience of the present lead cluster head and the other cluster heads. The fitness function for estimating the position of the lead cluster is expressed as follows:
where the following applies:
- = local cluster head position in the jth direction
The lead cluster head position is estimated from Equation (7) and the same node will also act as a cluster head for its own cluster with respect to Equation (6).
3.2.4. Global Leader Decision Phase
The lead cluster head position is continuously monitored in this phase and it creates new clusters when it is not able to find any optimal lead cluster head for ensuring a smooth communication process. Therefore, this decision phase creates the maximum number of clusters in the sensing region for identifying a lead cluster head and it combines all the nodes to act in a single cluster group when no optimal lead cluster is found.
4. Experimental Setup
The performance of the proposed CTO and E-MSA methodology is evaluated in the NS2 simulator with Linux operating system. A 300 × 300 square meter network size is selected for the analysis and the network area is placed with 700 sensor nodes. Each node contains an initial energy level of 0.5 J for its operation on data transmission and collection. The sink node is placed at the 200, 150 position for collecting the information from all the lead cluster head. The lead cluster head is selected by the CTO algorithm and its position will be changed randomly according to the fitness function. Table 3 represents the complete parametric settings of the proposed network structure and Figure 6 shows a screenshot from the NS2 simulator depicting its operation with the proposed E-MSA and CTO algorithm.

Table 3.
Simulation parameters.
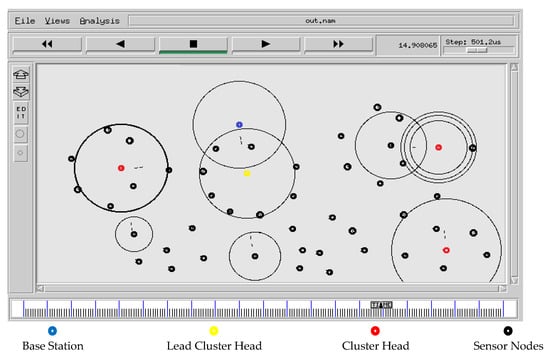
Figure 6.
Simulation of the proposed work on the NS2 application.
The nodes in the NS2 simulation network are highlighted with different colors for a better visibility on their action. The base station is highlighted in blue and the lead cluster head, cluster heads and sensor nodes are represented in yellow, red and black, respectively. A simulation time of 1600 s is considered in the work as the proposed E-MSA model lasts up to 1589 s. The following section explores the metric-wise betterment of the proposed E-MSA model with the traditional routing approaches.
5. Result Analysis
The performance of the proposed E-MSA methodology is compared to Destination-Sequenced Distance Vector Routing (DSDV) and On-Demand Distance Vector routing (ODV). DSDV is a proactive routing method that routes the data in a tabulated manner with a sequence number. The sequence number is updated with respect to the energy and other metric information of the sensor nodes for making an efficient routing process. ODV is a reactive kind of routing method that is suitable for mobile and ad-hoc types of routing applications. Here the routing path is established by sending a request to the neighboring nodes and the successful message ensures that the routing way is clear. This methodology also utilizes a sequence number for avoiding stale information in the nodes.
Similarly, the performance of the CTO algorithm on cluster head selection is compared to the traditional Low-Energy Adaptive Clustering Hierarchy (LEACH). In LEACH, the cluster head is selected based on the given threshold value of the energy and distance calculation. Therefore, the proposed E-MSA with CTO technique is compared to the following five combination techniques: E-MSA with LEACH, ODV with CTO, ODV with LEACH, DSDV with CTO, DSDV with LEACH.
5.1. Performance Evaluation by Changing the Node Count
The energy consumption betterment of the proposed E-MSA methodology is explored in Figure 7 where the sensor node counts are increased in a step from 100 to 700 and the corresponding energy consumption is noted for the analysis. The comparative analysis indicates that the proposed work gives a remarkable improvement while operated from 400 to 600 nodes. Node 100 to 300 were consuming almost a similar energy consumption to that E-MSA with LEACH. The performance of DSDV with LEACH shows a poor energy consumption among the other algorithms. Figure 7 also indicates that the ODV-LEACH and DSDV approaches need more than 350 joules when running with 700 nodes.
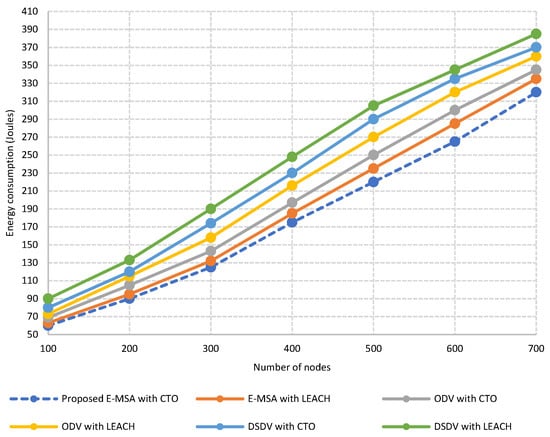
Figure 7.
Energy consumption on different node implementations.
The packet delivery ratio metric analysis of the proposed E-MSA model is shown in Figure 8. Packet delivery ratio indicates the proportion of successfully delivered packets over the total number of transmitted data packets. The packet delivery ratio is completely relative to the distance between the primary node and the receiver node. The comparative performance analysis indicates that the proposed E-MSA routing shows an excellent packet delivery ratio variation among the other techniques. It attains 79 percentage of packet delivery ratio when all the 700 nodes are active which is comparatively 10 percentage better over ODV-LEACH and 19 percentage better than DSDV with LEACH. The performance of E-MSA with LEACH gives an outcome of 70 percentage and the ODV-CTO and DSDV-CTO gives 70 and 66 percentage, respectively.
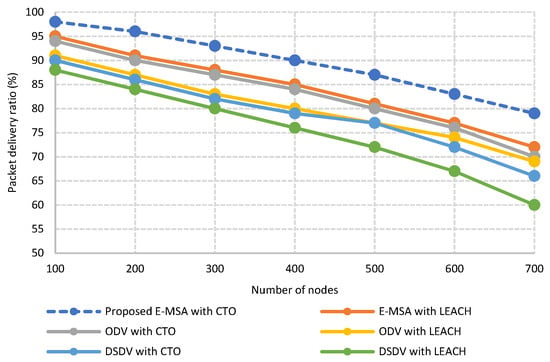
Figure 8.
Packet delivery ratio on different node operations.
Delay represents the time taken for transferring a data packet from the source to the destination. Packet processing and queuing due to intermediate nodes are some of the reasons for delay in WSNs. Figure 9 represents the delay comparison chart of the proposed method over the other techniques. The comparative chart represents a minimum delay on the proposed E-MSA approach over the other ones. The delay is very gradual up to the 600 node deployment and a slightly larger delay is observed in the 700 node operation in the proposed method. The proposed work takes 0.11 s for transferring a data packet in the 100 node operation and it takes 0.48 s when operated with 700 nodes. DSDV-CTO is the method that consumes 0.53 s of delay for transmission at the 100 node operation itself. ODV performs better when it is merged with the CTO algorithm for cluster head selection than the LEACH method. ODV-CTO takes 0.3 s and 0.72 s for transmitting the data packets at the 100 and 700 node operations, respectively.
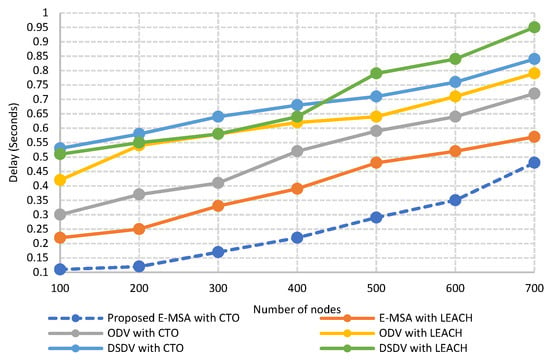
Figure 9.
Delay comparison on different node deployments.
Throughput indicates the amount of data that can be transmitted without loss from the source to the destination in a specific time period. It explores the capability of the sensor network on handling the data traffic. High throughput value refers to the fast and reliable data transmission of the sensor network. Figure 10 presents the throughput analysis of the proposed method over the previous methodologies. The proposed E-MSA with CTO technique has the ability to transfer 1 to 0.85 Mbps data on the 100 to 700 node operations. The proposed E-MSA model with LEACH attains a throughput of 0.96 to 0.79 Mbps for the 100 to 700 node operations. The CTO cluster head algorithm gives 0.64 to 0.95 Mbps throughput for the DSDV and ODV routing algorithms. Similarly, DSDV and ODV provide 0.61 to 0.9 Mbps when implemented with LEACH routing architecture.
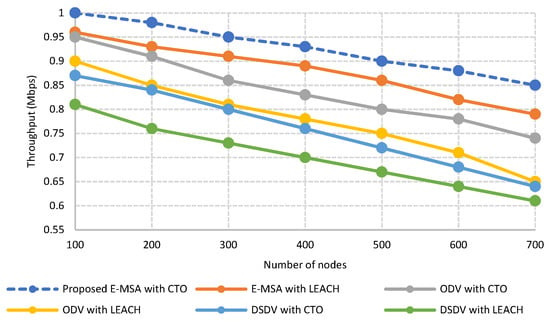
Figure 10.
Throughput on variable node operations.
5.2. Performance Evaluation with Respect to Time
Network residual energy refers to the sum of energy remaining in the sensor nodes after some data transmission with respect to time. It represents the energy consumption rate of the complete network setup. The network residual energy has a direct relationship to the network lifetime and efficiency.
Figure 11 specifies a comparative chart on the performance of the proposed model over the traditional methods on its residual energy level. A simulation time of 1600 s is set in the simulation tool and the residual energy of the complete 700 nodes is estimated for every 100 s. An initial energy of 0.5 J was assigned to each node and a total of 350 J was given to the complete sensor network of 700 nodes.
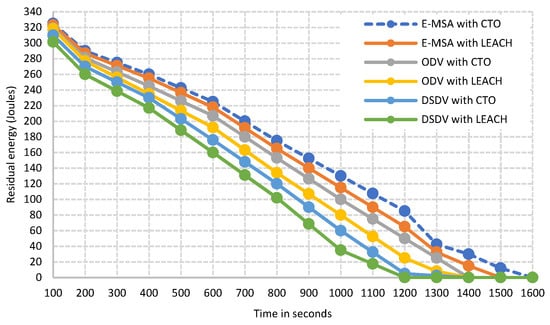
Figure 11.
Network residual energy with time.
The proposed E-MSA with CTO algorithm lasts up to 1579 s which is comparatively better by 129 s than the E-MSA implemented with the traditional LEACH methodology. The performance of the LEACH-based approaches is slightly lower than the CTO even when it is implemented with ODV and DSDV routing methods. Table 4 represents the network lifetime of the verified sensor node models and it also indicates the stable and unstable time of the simulated WSN. The stable time represents the activeness of all 700 sensor nodes in seconds and the unstable time indicates the operation of the simulated WSN with less than 700 sensor nodes.

Table 4.
Time analysis on WSN operation.
Figure 12 represents the comparative analysis chart of the proposed method with the existing ones on their active node count with respect to time in seconds. It shows that the proposed E-MSA with CTO methodology worked with all 700 sensor nodes active up to 700 s and the DSDV routing was active with all the sensor nodes only up to 200 s on both the LEACH and CTO cluster head selection algorithm. Similarly, the ODV and E-MSA with LEACH approaches performed worse than the proposed work. The unstable time of DSDV with LEACH looks better in comparison than ODV-LEACH and DSDV-CTO with 934 s. However, its total operational time is very low at 1134 s and that is comparatively worse than ODV-LEACH and DSDV-CTO.
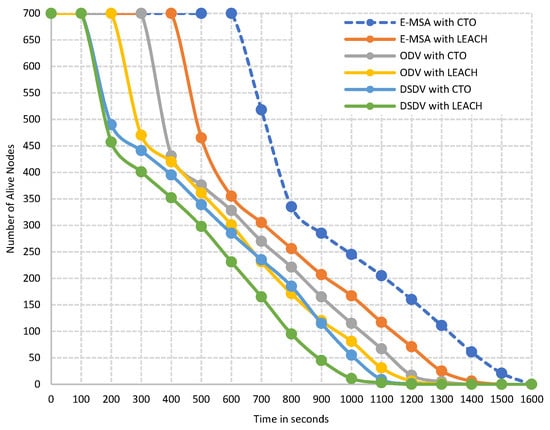
Figure 12.
Number of alive nodes with time.
5.3. Discussion
The ODV algorithm enables the routing process by using the routes stored in its cache for multiple operations. This leads to data loss and forces nodes to make multiple attempts when the destination node has low energy levels, resulting in energy wastage and higher energy consumption. Similarly, the DSDV algorithm consumes more energy due to the periodic updates of its routing paths and sequencing them in the routing table. The proposed work addresses the multiple-attempt issue of the ODV algorithm by implementing a lead cluster head identified by the CTO algorithm. This lead cluster head regularly updates the routing flow based on the fitness function outcome of E-MSA, eliminating the need for a sequence table and saving significant energy that would otherwise be used by the DSDV algorithm to update sequence numbers for identified routes. These two processes are the primary energy-saving mechanisms in the proposed work, allowing the simulated WSN model to achieve a maximum network lifetime of 1579 s. However, the performance of the proposed work heavily depends on the values assigned to the variables and the outcomes of the fitness function. In future work, a lightweight prediction algorithm will be employed to determine the optimal variables for extending network lifetime.
6. Conclusions
The need for wireless data sharing is increasing day by day. However, providing an energy-efficient wireless network remains a critical challenge in several applications due to their limited energy availability. The proposed work addresses this issue by increasing the network lifetime of WSNs through the implementation of an Enhanced Monkey Search Algorithm (E-MSA) to provide a better routing space and through using Class Topper Optimization (CTO) to identify an efficient node as the cluster head. To overcome the reaction to the CTO algorithm, it identifies a node as a lead cluster head for sending information to the base station in a sequential manner. Memory, energy and distance are the parameters considered by CTO for identifying the lead and regular cluster heads. The performance of the proposed work is simulated on the NS2 platform, indicating improvements in routing with E-MSA and CTO over traditional ODV, DSDV and LEACH approaches in terms of a 79% packet delivery ratio, 0.85 Mbps throughput, and a delay of 0.48 s. In the future, the work will enhance the packet delivery ratio by customizing the fitness function parameter of the CTO algorithm in the cluster head selection process and its performance will be compared with recent novel algorithms from the past year. Similarly, the work will also be extended in the future to address energy issues caused by security attacks by implementing a dynamic optimization algorithm.
Author Contributions
Conceptualization, methodology, validation, analysis, writing, editing, supervision: J.D.K.H., K.C.R., M.P.S., V.M.K., D.K.S., M.D., S.S.A. and R.M. All authors have read and agreed to the published version of the manuscript.
Funding
This research received no external funding.
Institutional Review Board Statement
Not applicable.
Informed Consent Statement
Not applicable.
Data Availability Statement
Not applicable.
Conflicts of Interest
The authors declare no conflict of interest.
References
- Vellela, S.S.; Balamanigandan, R. Optimized clustering routing framework to maintain the optimal energy status in the wsn mobile cloud environment. Multimed. Tools Appl. 2023, 1–20. [Google Scholar] [CrossRef]
- Malathy, S.; Rastogi, R.; Maheswar, R.; Kanagachidambaresan, G.R.; Sundararajan, T.V.P.; Vigneswaran, D. A novel energy-efficient framework (NEEF) for the wireless body sensor network. J. Supercomput. 2020, 76, 6010–6025. [Google Scholar] [CrossRef]
- Ananthi, J.V.; Jose, P.S.H. Performance Analysis of Clustered Routing Protocol for Wearable Sensor Devices in an IoT-Based WBAN Environment. In Intelligent Technologies for Sensors: Applications, Design, and Optimization for a Smart World; CRC Press: Boca Raton, FL, USA, 2023; p. 253. [Google Scholar]
- Singh, S.; Garg, D.; Malik, A. A Novel Cluster Head Selection Algorithm based IoT enabled Heterogeneous WSNs Distributed Architecture for Smart City. Microprocess. Microsyst. 2023, 101, 104892. [Google Scholar] [CrossRef]
- Chaurasia, S.; Kumar, K.; Kumar, N. Mocraw: A meta-heuristic optimized cluster head selection based routing algorithm for wsns. Ad Hoc Netw. 2023, 141, 103079. [Google Scholar] [CrossRef]
- Affane, A.R.; Satori, H.; Sanhaji, F.; Boutazart, Y.; Satori, K. Energy enhancement of routing protocol with hidden Markov model in wireless sensor networks. Neural Comput. Appl. 2023, 35, 5381–5393. [Google Scholar] [CrossRef]
- Taha, A.A.; Abouroumia, H.O.; Mohamed, S.A.; Amar, L.A. Enhancing the lifetime and energy efficiency of wireless sensor networks using Aquila Optimizer algorithm. Future Internet 2022, 14, 365. [Google Scholar] [CrossRef]
- Balachandran Nair Premakumari, S.; Mohan, P.; Subramanian, K. An Enhanced Localization Approach for Energy Conservation in Wireless Sensor Network with Q Deep Learning Algorithm. Symmetry 2022, 14, 2515. [Google Scholar] [CrossRef]
- Zulfiqar, R.; Javid, T.; Ali, Z.A.; Uddin, V. Novel metaheuristic routing algorithm with optimized energy and enhanced coverage for WSNs. Ad Hoc Netw. 2023, 144, 103133. [Google Scholar] [CrossRef]
- Babu, V.; Kumar, C.V.; Parthiban, S.; Padmavathi, U.; Rahman, M.Z.U. AE-LEACH: An Incremental Clustering Approach for Reducing the Energy Consumption in WSN. Microprocess. Microsyst. 2022, 93, 104602. [Google Scholar] [CrossRef]
- Juneja, S.; Kaur, K.; Singh, H. An intelligent coverage optimization and link-stability routing for energy efficient wireless sensor network. Wirel. Netw. 2022, 28, 705–719. [Google Scholar] [CrossRef]
- Moussa, N.; Nurellari, E.; El Belrhiti El Alaoui, A. A novel energy-efficient and reliable ACO-based routing protocol for WSN-enabled forest fires detection. J. Ambient. Intell. Humaniz. Comput. 2023, 14, 11639–11655. [Google Scholar] [CrossRef]
- Devassy, D.; Johnraja, J.I.; Paulraj, G.J.L. NBA: Novel bio-inspired algorithm for energy optimization in WSN for IoT applications. J. Supercomput. 2022, 78, 16118–16135. [Google Scholar] [CrossRef]
- Kathiroli, P.; Selvadurai, K. Energy efficient cluster head selection using improved Sparrow Search Algorithm in Wireless Sensor Networks. J. King Saud Univ. Comput. Inf. Sci. 2022, 34, 8564–8575. [Google Scholar] [CrossRef]
- Rami Reddy, M.; Ravi Chandra, M.L.; Venkatramana, P.; Dilli, R. Energy-Efficient Cluster Head Selection in Wireless Sensor Networks Using an Improved Grey Wolf Optimization Algorithm. Computers 2023, 12, 35. [Google Scholar] [CrossRef]
- Natesan, G.; Konda, S.; de Prado, R.P.; Wozniak, M. A hybrid mayfly-Aquila optimization algorithm based energy-efficient clustering routing protocol for wireless sensor networks. Sensors 2022, 22, 6405. [Google Scholar] [CrossRef]
- Alharbi, N.; Mackenzie, L.; Pezaros, D. Enhancing Graph Routing Algorithm of Industrial Wireless Sensor Networks Using the Covariance-Matrix Adaptation Evolution Strategy. Sensors 2022, 22, 7462. [Google Scholar] [CrossRef]
- Sengathir, J.; Rajesh, A.; Dhiman, G.; Vimal, S.; Yogaraja, C.A.; Viriyasitavat, W. A novel cluster head selection using Hybrid Artificial Bee Colony and Firefly Algorithm for network lifetime and stability in WSNs. Connect. Sci. 2022, 34, 387–408. [Google Scholar] [CrossRef]
- Jagan, G.C.; Jesu Jayarin, P. Wireless sensor network cluster head selection and short routing using energy efficient ElectroStatic discharge algorithm. J. Eng. 2022, 2022, 8429285. [Google Scholar] [CrossRef]
- Maheswar, R.; Jayarajan, P.; Sampathkumar, A.; Kanagachidambaresan, G.R.; Hindia, M.N.; Tilwari, V.; Dimyati, K.; Ojukwu, H.; Amiri, I.S. CBPR: A cluster-based backpressure routing for the internet of things. Wirel. Pers. Commun. 2021, 118, 3167–3185. [Google Scholar] [CrossRef]
- Han, B.; Ran, F.; Li, J.; Yan, L.; Shen, H.; Li, A. A Novel Adaptive Cluster Based Routing Protocol for Energy-Harvesting Wireless Sensor Networks. Sensors 2022, 22, 1564. [Google Scholar] [CrossRef]
- Narayan, V.; Daniel, A.K.; Chaturvedi, P. E-FEERP: Enhanced Fuzzy based Energy Efficient Routing Protocol for Wireless Sensor Network. Wirel. Pers. Commun. 2023, 131, 371–398. [Google Scholar] [CrossRef]
- Divya, K.; Maheswar, R.; Jayarajan, P. Mitigation of E2E Delay in LF-IEHM Routing Protocol for Underwater Acoustic Wireless Sensor Networks. Adhoc Sens. Wirel. Netw. 2022, 53, 285–301. [Google Scholar]
- Bahadur, D.J.; Lakshmanan, L. A novel method for optimizing energy consumption in wireless sensor network using genetic algorithm. Microprocess. Microsyst. 2023, 96, 104749. [Google Scholar] [CrossRef]
- Dai, K.; Zhang, C.; Li, Q.; Huang, X.; Zhang, H. An Adaptive Energy Management Strategy for Simultaneous Long Life and High Wake-Up Success Rate of Wireless Sensor Network Nodes. Energy Technol. 2021, 9, 2100522. [Google Scholar] [CrossRef]
- Sharma, H.; Haque, A.; Jaffery, Z.A. Maximization of wireless sensor network lifetime using solar energy harvesting for smart agriculture monitoring. Ad Hoc Netw. 2019, 94, 101966. [Google Scholar] [CrossRef]
- Wang, C.-N.; Yang, F.-C.; Vo, N.T.M.; Nguyen, V.T.T. Wireless communications for data security: Efficiency assessment of cybersecurity industry—A promising application for UAVs. Drones 2022, 6, 363. [Google Scholar] [CrossRef]
- Kler, R.; Gangurde, R.; Elmirzaev, S.; Hossain, M.S.; Vo, N.V.T.; Nguyen, T.V.T.; Kumar, P.N. Optimization of Meat and Poultry Farm Inventory Stock Using Data Analytics for Green Supply Chain Network. Discret. Dyn. Nat. Soc. 2022, 2022, 8970549. [Google Scholar] [CrossRef]
- Das, P.; Das, D.K.; Dey, S. A new class topper optimization algorithm with an application to data clustering. IEEE Trans. Emerg. Top. Comput. 2018, 8, 948–959. [Google Scholar] [CrossRef]
Disclaimer/Publisher’s Note: The statements, opinions and data contained in all publications are solely those of the individual author(s) and contributor(s) and not of MDPI and/or the editor(s). MDPI and/or the editor(s) disclaim responsibility for any injury to people or property resulting from any ideas, methods, instructions or products referred to in the content. |
© 2023 by the authors. Licensee MDPI, Basel, Switzerland. This article is an open access article distributed under the terms and conditions of the Creative Commons Attribution (CC BY) license (https://creativecommons.org/licenses/by/4.0/).