Article

The Effects of Demineralization on Reducing Ash Content in Corn and Soy Biomass with the Goal of Increasing Biofuel Quality

1
Bjelin Otok d.o.o., Skorotinci 6, 32253 Otok, Croatia
2
Department of Agricultural Technology, Storage and Transport, University of Zagreb Faculty of Agriculture, Svetošimunska Cesta 25, 10000 Zagreb, Croatia
3
Faculty of Forestry and Wood Technology, University of Zagreb, Svetošimunska Cesta 23, 10000 Zagreb, Croatia
*
Author to whom correspondence should be addressed.
Energies 2023, 16(2), 967; https://doi.org/10.3390/en16020967
Submission received: 22 December 2022 / Revised: 9 January 2023 / Accepted: 13 January 2023 / Published: 15 January 2023
(This article belongs to the Section A: Sustainable Energy)

Abstract

:
The increasing amount of residual waste presents several opportunities to use biomass as a renewable energy source. Agricultural biomass is a raw material with a high ash content, which can be a problem in any form of energy conversion. To obtain better quality biofuel, excess mineral matter must be removed. Demineralization is a simple form of mixing and washing biomass with various liquids to reduce ash content. Water, acetic acid, hydrochloric acid and nitric acid are common solvents used for this purpose. Ash is composed of different micro (Zn, Cu, Fe) and macro elements (Mg, Ca, K), which can have different consequences for the use of biomass for thermal energy. Different solvents have different effects on the individual elements, with inorganic acids having the greatest effect in demineralization processes, with a reduction in ash content of up to 80% for corn and about 99% for soybeans.

1. Introduction

Petroleum and fossil fuels have long been the primary drivers of both all industry and life on Earth in general. Their use has significant implications for global politics and economics. Due to major environmental problems and a constantly unstable market situation caused by various factors, there is an increasing search for adequate substitutes for non-renewable energy sources. More and more research is being done with the aim of using renewable energy sources of varying quality. From an ecological point of view, biomass has a specific chemical composition that is favorable for different types of use. Due to its carbon dioxide neutrality, biomass combustion is still the most common method of energy production. However, the main advantage of using lignocellulosic feedstocks is their large and easy availability, though this requires appropriate and optimal use considering that this type of renewable energy source serves as a raw material for various other industries.
The consequence of the higher mineral content is a higher ash content in the raw material. As far as elemental composition is concerned, biomass consists of six main elements (C, H, N, S, Cl, O) in organic compounds and at least 10 other elements (Si, Al, Ti, Fe, Ca, Mg, Na, K, S, P) in inorganic compounds, which are important in ash characterization [1]. Ash content is desirable in some cases, but when it comes to energy efficiency, ash content becomes a problem, especially when burning biomass for heat. Recently, the pressing of wood biomass into briquettes and pellets has become increasingly popular as a source of thermal energy. Wood generally has a high calorific value and a much lower ash content (excluding bark) [2,3] than agricultural biomass, which to date has mostly consisted of agricultural residues for solid biofuel production. This richness in minerals is exactly the reason why the later residues are also used for mulching the soil. During combustion, slag and deposits reduce heat transfer and cause corrosion and erosion problems, resulting in shorter life for the equipment used and more frequent cleaning requirements when blockages occur [4]. There are various thermal, mechanical and chemical pretreatments which aim to transform biomass with lower energy potential into a feedstock with high energy efficiency. Another feedstock utilization option where lower ash content is desirable is the pyrolysis process for bio-oil production. In previous research, many authors [5] mention the catalytic reaction of the ash in the biomass, i.e., the alkali and alkaline earth metals during the pyrolysis process, which ultimately results in higher biochar and biogas content and lower bio-oil demand [6]. The aforementioned pyrolysis, carried out at moderate temperature, high heating rate, short steam residence time and in an inert atmosphere, achieves maximum yields of bio-oil in addition to biogas and biochar [7,8]. Similarly, liquefaction breaks down the feedstock’s macromolecular compounds in the presence of a suitable catalyst into fragments of light molecules, whose repolymerization leads to oily compounds [9]. Such treatments have already been successfully carried out on wood [10,11] and agricultural raw materials [12]. Furthermore, in a review paper by Trubetskaya (2022) [13], the effects of the reactivity of inorganic components on biomass gasification were studied. The author concluded that, although the influence of inorganic matter in the gasification process is known, the basic mechanisms behind this influence are still not clear, thus highlighting the complexity of ash conversion. The author further proposed that future research on the interactions between inorganics and gasification reactivity should cover a wide range of inorganic elements and their corresponding reaction kinetics.
As mentioned earlier, the ash content of wood biomass and agricultural biomass differs, and, in order to replace wood biomass with a more energetically acceptable biofuel, the agricultural feedstock should be made more favorable for energy use. The simplest way to reduce ash content (i.e., the residue after combustion) and thus increase calorific value is demineralization. In this process, soluble mineral substances are separated from the raw material using organic or inorganic solvents [14]. Depending on the choice of solvent, there are various ways of carrying out this process [15]. Water, as an inorganic substance, is in itself a suitable solvent to dissolve a considerable number of mineral substances, and the addition of small amounts of various acids increases this efficiency [16,17]. Some of the acids used include acetic, hydrochloric, sulfuric, nitric and hydrofluoric acids, and recent research offers the possibility of using surfactants [15]. Some of the most important parameters of the demineralization process are the acid concentration in the water, the temperature and the duration of the process. The speed of mixing also has a positive effect on reducing ash content. Thus, some studies have shown a difference in the effect of the demineralization process between when the sample was constantly mixed and when it was only in an aqueous solution [17]. The problem with using acids is the necessity of washing the samples after mixing or filtering. In this way, higher concentrations of acids produce more harmful waste that must be disposed of later. In addition, higher concentrations of certain acids may interfere with the reduction of cellulose content, which is desirable during the pyrolysis process to produce bio-oil [15]. Higher temperatures and a longer mixing time during demineralization mean higher energy consumption in such a process. Therefore, the purpose of such a process should be well defined in order to choose the appropriate type of solvent in combination with acceptable parameters to achieve an optimal effect. Consequently, the aim of this work is to investigate the best solution for achieving low ash content in agricultural raw materials by the demineralization process in order to obtain a useful biofuel for the further processing of lower-quality raw materials. The idea is to use a lower concentration of different acids through different process times, exclude temperature as a parameter to save energy, and include different particle sizes, which is different from other research. Furthermore, the influence of different solvents on different micro and macro elements of ash composition will be studied.
Miscanthus [15], eucalyptus [18,19], switchgrass, pine [5,20], rice straw [3,16,21,22], wheat straw, barley straw [6,23], fruit bunches [24,25], palm kernels [5] and even algae [26] attest to the wide range of biomass feedstocks for exploring this type of pretreatment. Corn and soybean stalk samples, however, have rarely been studied for this purpose. Corn is one of the most widely used cereals in the world and is mainly used in food and animal husbandry [27], followed by agriculture and energy use. Corn stalks (which consist mainly of the leaves and stalks of corn plants that remain after the corn kernels are harvested) are the most important crop residues worldwide [28]. According to the Statistical Yearbook [29], the total production of corn in the Republic of Croatia was between 1,500,000 and 2,000,000 tons, i.e., between 6 and 8 t/ha per year, and represents a crop whose residues have a great potential for energy use. On the other hand, according to the statistical calendar, soybean production is much lower than corn production. However, in recent years, production has increased, amounting to about 200,000 tons per year in the Republic of Croatia. After combustion, different agricultural crops contain 5–12% ash [30], whereas soybeans belong to a species with lower ash content (2–3%) [31]. For this reason, this paper compares the influence of different demineralization factors on two agricultural species with different ash content and different particle size.

2. Materials and Methods

2.1. Shredding

The postharvest residues, i.e., corn and soybean stalks after shredding in the mill, were sieved with a laboratory sieve machine [32] into two grain size groups: 630–1000 ym (I) and 1000–1400 ym (II). The water content and ash content of the samples thus obtained were analyzed by the gravimetric method.

2.2. Ash Content

0.5–1 g of the sample is weighed into pre-dried porcelain pots in a laboratory dryer at 105 °C for 1 h. Subsequently, the samples are placed in the muffle furnace, Naberthertm GmbH at a temperature of 550 °C for 5:30 h with an initial preheating time of 15 min [33].

2.3. Demineralization

20 g of the sample was mixed with a magnetic stirrer in a solution of 400 mL at times of 30 and 240 min, considering that, according to previous studies, most changes in ash content were recorded within the time of half an hour. The acids used were acetic acid (CH3COOH), hydrochloric acid (HCl) and nitric acid (HNO3) in concentrations of 0% (distilled water only) and 1%. After mixing, the samples were filtered using a LABPORT N96, a KNF vacuum pump and filter paper until the filtered liquid reached a neutral pH. The samples were then gently dried at 60 °C for 5–6 h to avoid the influence of drying on the results obtained.

2.4. Micro and Macro Element

A PinAAcle 500 atomic spectrometer, Perkin Elmer, was used to analyze individual macro [34] and microelements [35]. 9 mL of HNO3 and 1 mL of H2O2 had already been added to the samples, which were digested in an SK −15 eT microwave oven, Milestone for 35 min at 190 °C. The macroelements were K, Ca and Mg, while the microelements were Na, Fe, Cu and Zn.

3. Results and Discussion

3.1. Ash Content

Ash content is a common problem when using lignocellulosic biomass as a solid fuel [36] as it represents the non-combustible portion of the biomass [37]. However, with various treatment methods, this fraction can be significantly reduced.

3.1.1. The Influence of Sieving

Unlike corn and other agricultural biomass, soybean is a crop with relatively low ash content when it comes to postharvest residues. Table 1 shows the positive effect of sieving on the biomass of corn and soybeans, with the mechanically untreated samples having a higher ash content. Both species studied had different ash contents for different grain size groups. Samples with a grain size of 1.00 to 1.40 mm had a lower ash content after analysis. For corn, this difference is only 5.03%, but, in return, the ash content of larger particles is as much as 47.46% lower for soybeans. Pattiya et al. [18] screened samples of cassava stalks, also finding the lowest ash content (4.75%) in the class with the largest particle size, significantly lower than an ash content of 12.17% in the class with the smallest particle size. One possible reason for this is that shaking physically removes various impurities from the surface of the samples that later demonstrate ash content in the combustion process.

3.1.2. The Influence of Demineralization

Demineralization involves washing the raw biomass with various liquids that dissolve the components of the ash [22,25,38]. Corn as a raw material for demineralization and filtration proved to be impractical due to suspended particles and clogging during filtration, which may have a lesser effect on subsequent results. However, the ash content of corn decreased under the influence of any reagents. Triage is desirable not only for untreated samples. Table 2 shows a difference in ash content between I and II as early as the first 30 and 240 min, indicating that larger particles in corn are washed out more quickly and easily, ultimately resulting in a lower ash content than smaller particles over a given period.
This confirms the claim that after 30 min the effectiveness of demineralization decreases significantly [18]. The only exception is when acetic acid is used, where an anomaly occurs. With distilled water, hydrochloric acid and nitric acid, the ash content decreases consistently over time, although not with the same intensity. With acetic acid, the ash content of the sample begins to increase after some mixing time, and here the main differ.
Even when acetic acid was used, the ash content after 4 h was not as low as it had been with 1% hydrochloric and nitric acids (with values of 1.26% and 1.25%, respectively). The reason for this is that acetic acid cannot dissolve certain chemical elements that form mineral substances [16].
Table 3 shows the variance analysis of the observed parameters of influence on ash.
Through statistical analysis, we can conclude that the influence of the parameters of time and the interaction of time*solution is statistically insignificant for the change in the ash content. As mentioned above, according to the analyses performed, it is obvious that a longer treatment time and the treatment of larger particles result in a lower ash content. From the percentage change in the different treatments (Table 4 and Table 5), it is easier to see the big difference in efficiency between I and II for the same duration of the process, and that there is no big change after 30 min for the same granule size. As in other studies [15,24], we can see that HCl causes the greatest decrease in ash content in both granule size classes compared to other acids, although it is a different type of agricultural raw material. For corn I, this percentage ranges from 48% to 51%, while for corn II, a larger percentage decrease, 77–80%, is observed (Table 4). Similar results were obtained with nitric acid, with percentages ranging from 43% to 48% in maize I and from 75% to 80% in maize II.
Soybean, unlike corn, proved to be a more practical, i.e., suitable raw material for the demineralization process, and a significant reduction in ash content was obtained for all treatment types. The analytical results obtained show similarities in the treatment of soybean and corn samples. The final ash content after the use of all solvents and in the different time intervals is lower for soybean II, which is expected considering that soybean II has a lower ash content in the raw sample than soybean I. The use of acetic acid also leads to the anomaly that, for the same concentration (1%) in soybean II, there is a lower final ash content after 30 min than after 240 min. The effectiveness of reducing ash content in soybean I and II is the same as in corn I and II, with the order of solvent effects thus: distilled water < acetic acid < nitric acid < hydrochloric acid. This order of solvent effects is common in biomass treatment. The values of ash content when using nitric and hydrochloric acids are not very different, and with them an extremely low ash content (i.e., a raw material suitable for further use in the form of pyrolysis, pelletization, briquetting, etc.) is obtained. Table 4 and Table 5 show the main differences between corn and soybean I and II treatments. Although the final ash content is lower for soybean II, the percentage change is generally lower compared to I at 30 and 240 min. The percentage changes range from 97% to 99% for hydrochloric acid and nitric acid, while for distilled water this effect ranges from 45 to 60% for soybean I and II combined.

3.2. Micro and Macro Elements

To better demonstrate the effects of demineralization on biomass using the PinAAcle 500 instrument, PerkinElmer, analyses were performed on different percentages of the elements that comprise ash in the raw material of corn and soybeans. The elements were analyzed separately to determine their respective amounts, since each element has a particular influence on the subsequent combustion of the biomass. Figure 1, Figure 2, Figure 3 and Figure 4 show some of the major elements that make up the ash content of raw corn and soybeans. K, Ca and Mg are present in large concentrations (macroelements) in the natural, untreated sample, while elements such as Cu, Fe and Zn are present in much lower concentrations (microelements). Regardless, the different elements have different effects on the consequences of biomass processing. Elements such as K and Na, along with elements such as Si and Cl, contribute to the formation of corrosion after biomass combustion [2,39], while elements such as Ca and Mg increase the melting point of ash [40,41].
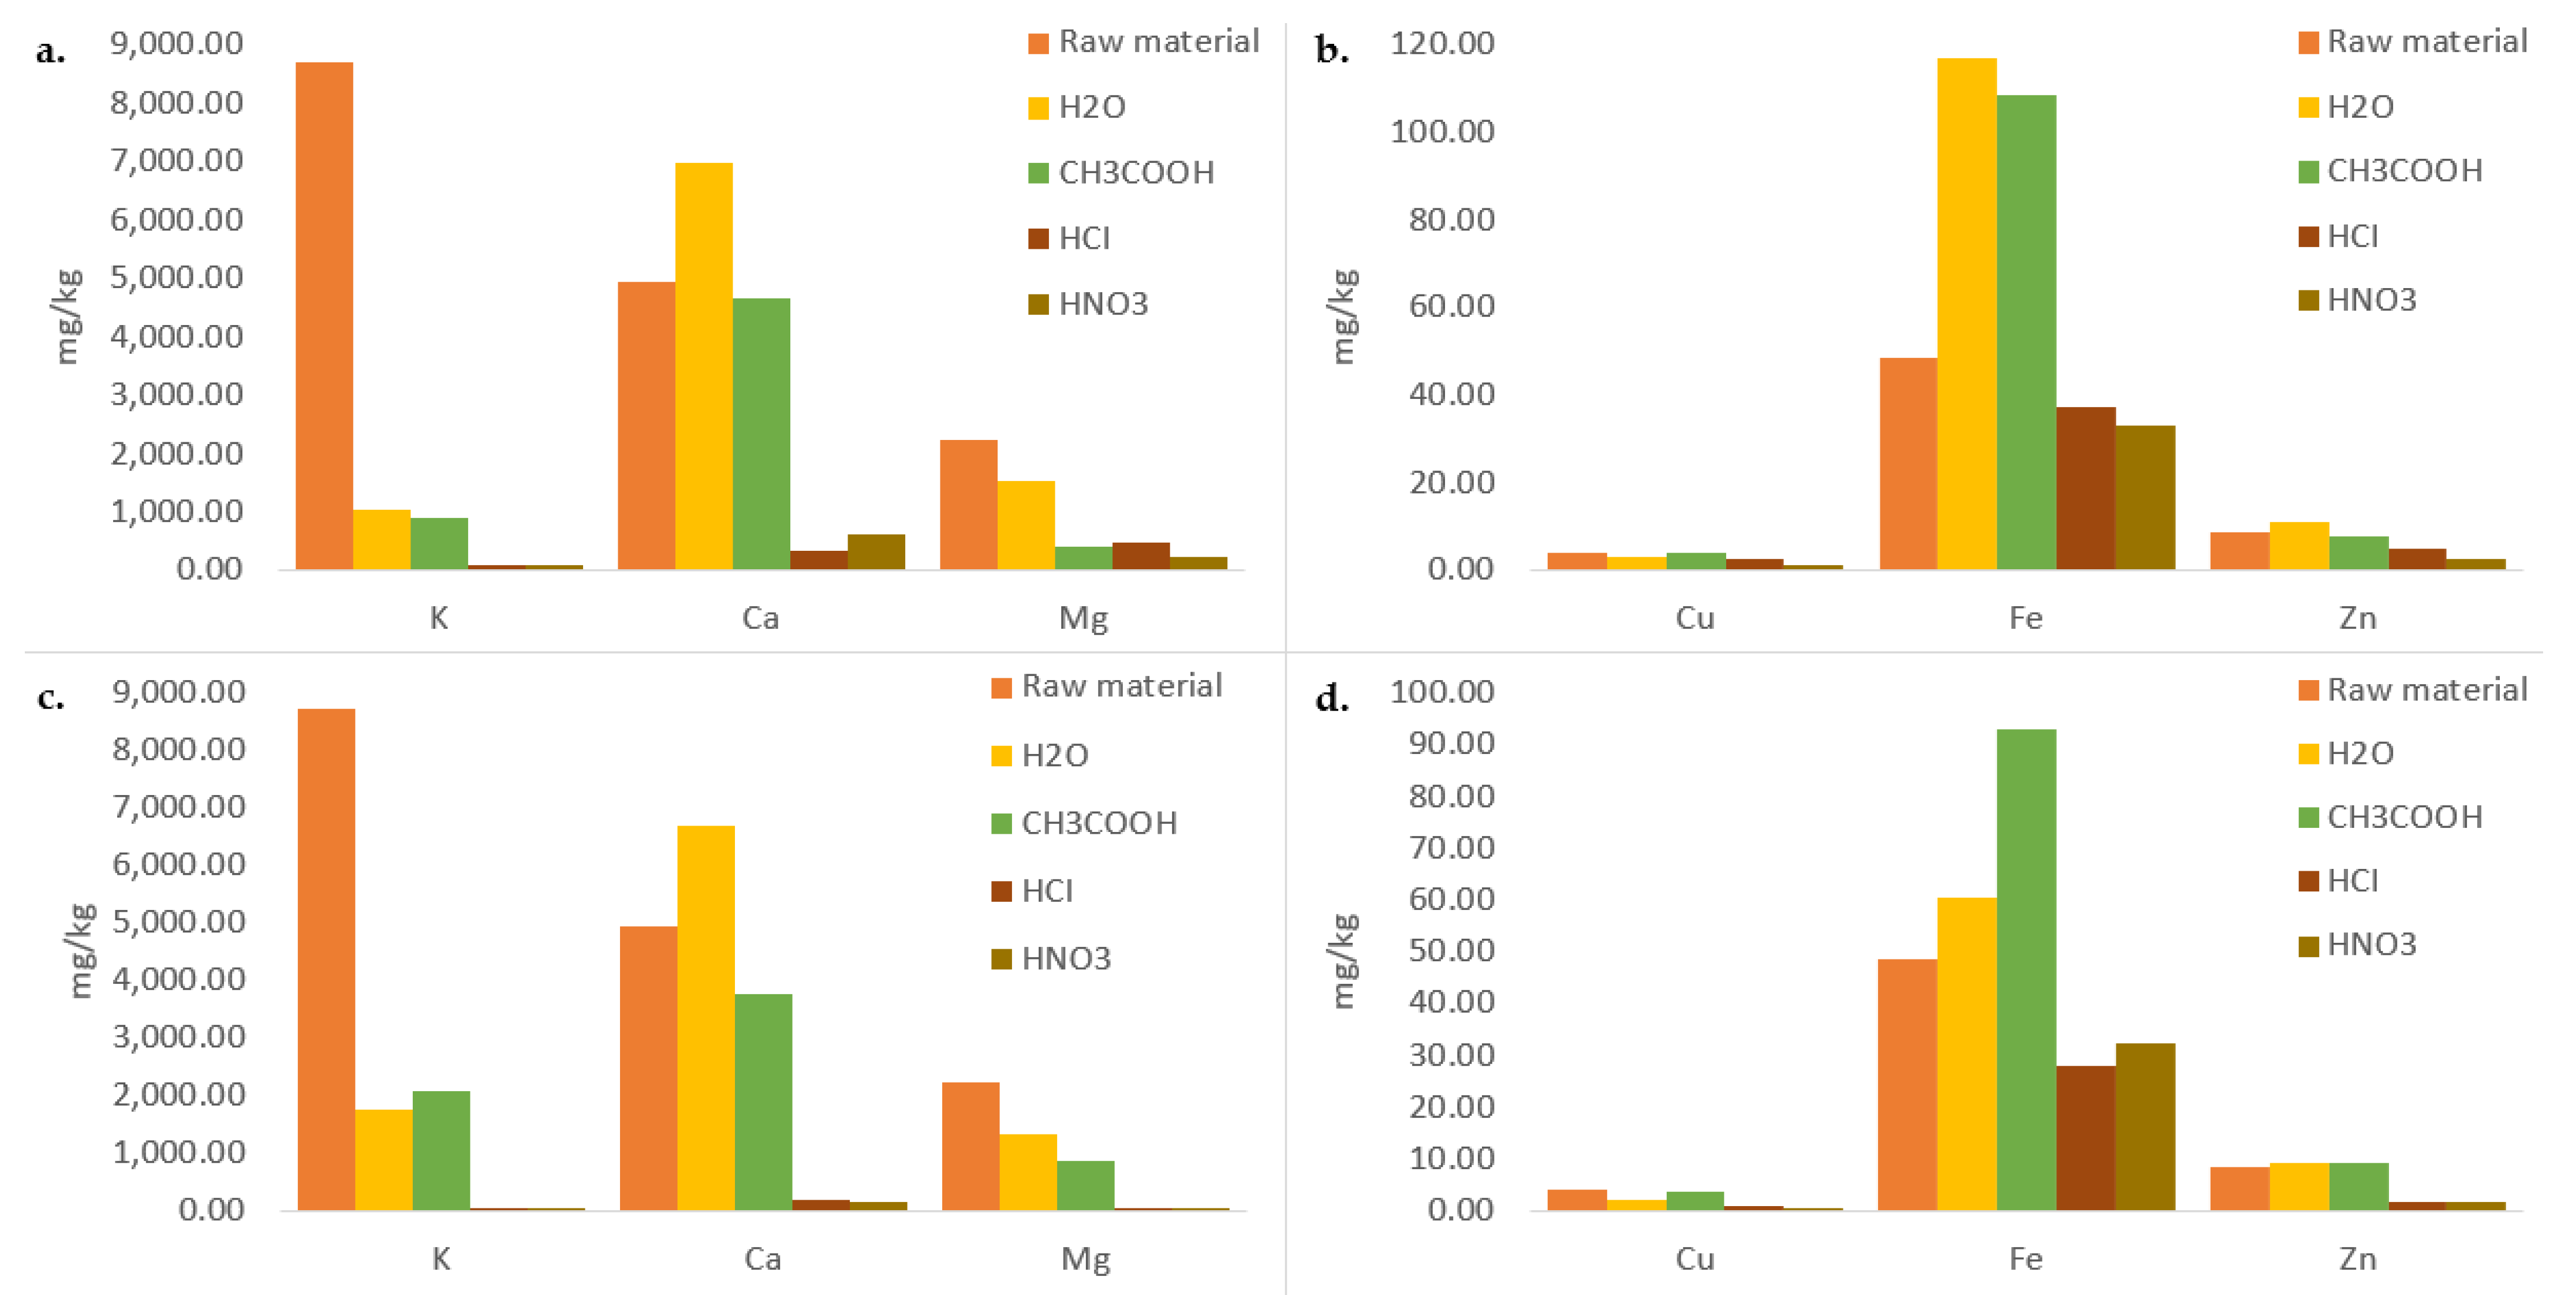
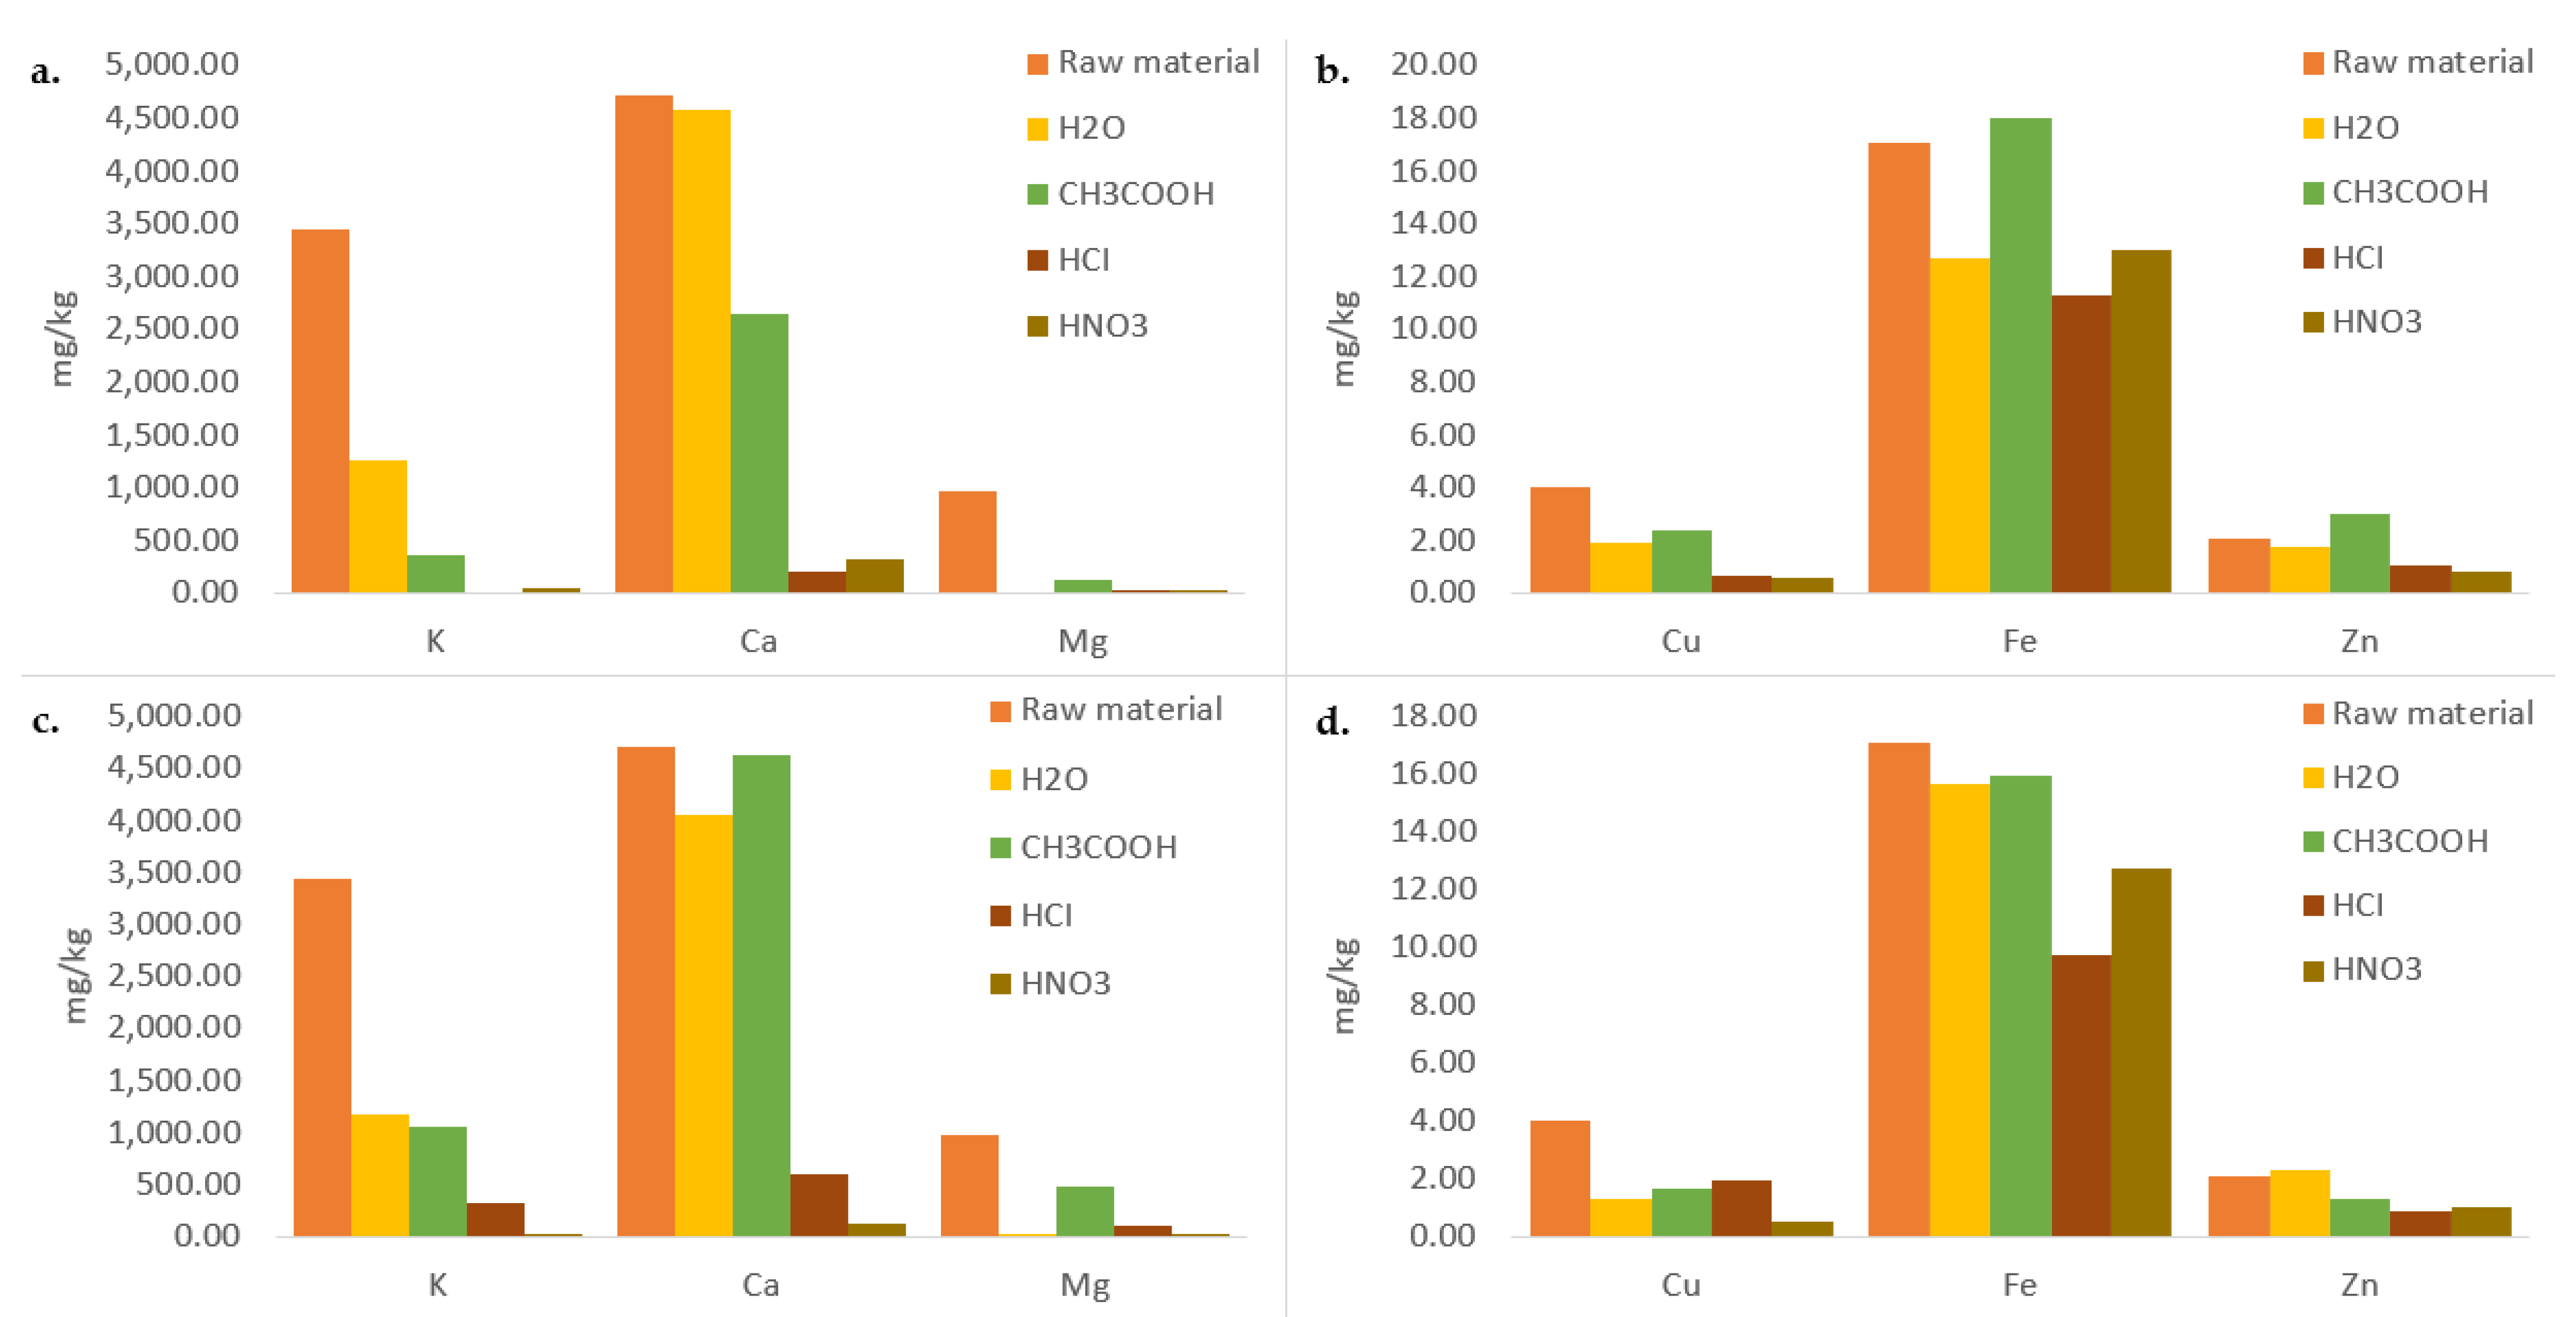
Figure 1 shows that there is a significant difference in the concentrations of macro and microelements in untreated maize I compared to Figure 2, where the initial content of each element (K 10,295 mg/kg, Ca 4355.96 mg/kg, Mg 2626.85 mg/kg, Cu 3.40 mg/kg, Fe 84.46 mg/kg, Na 42.35 mg/kg, Zn 12 mg/kg) is shown to be generally slightly lower in maize II (K 8714.25 mg/kg, Ca 4944.94 mg/kg, Mg 2224.97 mg/kg, Cu 4.12 mg/kg, Fe 48.48 mg/kg, Na 32.13 mg/kg). These results were expected, considering that the initial ash content in the higher-grain corn stalk samples was slightly lower. Guo et al., 2020 had higher values for K (28,435 mg/kg) and Na (6970 mg/kg) in untreated samples of corn stover, while the values for Ca (3718 mg/kg) and Mg (2130 mg/kg) were similar to those of corn I and II. This distribution of concentrations of each element is similar for the rice straw samples [16]. When looking at the effects of demineralization, the different influences of water, organic and inorganic solvents on individual elements become visible. Potassium is an element that dissolves in all solvents, but especially in hydrochloric acid, which is consistent with other studies [14,16]. In contrast to potassium, calcium is an element that dissolves only in strong inorganic acids. The reason for this is that it is found mainly in acid-soluble carbonates, sulfates and sulfides [42]. Similarly to potassium, magnesium was reduced in all acids in corn with larger and smaller grains, while it was partially dissolved in water. Copper is the element with the lowest concentration among the elements studied, on whose reduction hydrochloric and nitric acids have a greater effect than water and acetic acid. As for the effect of demineralization on iron, according to the results, after 240 min only the content of nitric acid and hydrochloric acid decreased. After mixing and washing with water and acetic acid, the iron content actually increased, which is not consistent with previous studies. Zinc is one of the heavy metals that, like copper, is not present in higher concentrations. It also dissolved most in inorganic acids, while treatment with water and acetic acid allowed the concentration to increase. As for time, the greatest change in these analyses is visible in the first 30 min, while this change is less after 4 h. In some cases, it is also possible to increase the concentration of certain elements after 240 min of mixing compared to the first 30 min. Potassium in soybean I (Figure 3) and II (Figure 4) dissolved in the same way as in corn I and II in all solvents and mainly in inorganic acids (up to 11.17 mg/kg for HCl and 30.78 mg/kg for HNO3). The concentration of calcium, which is not soluble in water, increased when treated with water and acetic acid solvents, while a sharp decrease in concentration was observed with hydrochloric and nitric acids. Magnesium and copper were dissolved in all solvents, but also like potassium with different effects in each liquid. The initial levels of iron in soybean I and II are significantly lower than in corn I and II. Fe content ranges from 17 to 25 mg/kg in soybean and from 50 to 80 mg/kg in corn. The effect of demineralization on the Fe content of soybean differs from its effect on Fe in corn. While Fe content in corn increased in most cases, it increased slightly in soybean only in water and acetic acid. Zinc also dissolved in all solvents, but more time is required to achieve better solubility when water and acetic acid are used.
Comparing the final results of the analysis of soybean I and II and corn I and II, the initial values of the individual elements are lower for larger particles. Similarly, after treatment with certain reagents, the levels of certain elements are generally lower in samples with larger particle sizes. This is ultimately reflected in the final ash content, even though agricultural biomass contains various other elements such as Na, Cl, Si, Mn, Cd, Pb, and others that are not analyzed in this work and make up the composition of ash. In the case of soybean I and II, the time proved to be most important in the first 30 min, when the largest proportion of each element decreased, and after which this efficiency decreases with time.

4. Conclusions

Various demineralization treatments with distilled water, acetic, hydrochloric and nitric acids at concentrations of 1% and at times of 30 and 240 min were successfully carried out on both types of raw material, with the final result being a significant reduction in ash content. Sieving is a quick and simple method that significantly affects the reduction of the content of inorganic substances, because both the initial and the final ash content are lower with larger biomass particles. The inorganic acids had a significantly greater effect on the removal of inorganic substances than water and acetic acid. In only 30 min and with a concentration of only 1%, hydrochloric acid and nitric acid dissolved the elements of ash content in corn to a low level and in soybean to a very low level. In this way, the biofuel obtained from agricultural raw materials becomes suitable for any further processing with the aim of producing final energy.

Author Contributions

Conceptualization, J.K.; methodology, A.M.; software, B.M.; validation, A.A., T.K. and A.M.; formal analysis, M.K.; investigation, J.K.; data curation, I.B.; writing—original draft preparation, J.K.; writing—review and editing, A.M.; supervision, A.A.; project administration, A.A. All authors have read and agreed to the published version of the manuscript.

Funding

This research was funded by the European Regional Development Fund, under the Operational program competitiveness and cohesion 2014–2022, project no. KK 01.2.1.02.0286, “Development of innovative pellets from forest and/or agricultural biomass—INOPELET”.

Data Availability Statement

Not applicable.

Conflicts of Interest

The authors declare no conflict of interest.

References

  1. Demirbaş, A. Demineralization of Agricultural Residues by Water Leaching. Energy Sources 2003, 25, 679–687. [Google Scholar] [CrossRef]
  2. Šafran, B.; Jug, M.; Radmanović, K.; Hasan, M.; Kristijan, A.; Vučković, K.; Stjepan, R. Contribution to the research on wood pellet characteristics from Turopolje area. Šumarski List 2018, 142, 149–158. [Google Scholar] [CrossRef]
  3. Khan, A.; de Jong, W.; Jansens, P.; Spliethoff, H. Biomass combustion in fluidized bed boilers: Potential problems and remedies. Fuel Process. Technol. 2009, 90, 21–50. [Google Scholar] [CrossRef]
  4. Abreu, P.; Casaca, C.; Costa, M. Ash deposition during the co-firing of bituminous coal with pine sawdust and olive stones in a laboratory furnace. Fuel 2010, 89, 4040–4048. [Google Scholar] [CrossRef]
  5. Liu, X.; Bi, X.T. Removal of inorganic constituents from pine barks and switchgrass. Fuel Process. Technol. 2011, 92, 1273–1279. [Google Scholar] [CrossRef]
  6. Stefanidis, S.D.; Heracleous, E.; Patiaka, D.T.; Kalogiannis, K.G.; Michailof, C.M.; Lappas, A.A. Optimization of bio-oil yields by demineralization of low quality biomass. Biomass Bioenergy 2015, 83, 105–115. [Google Scholar] [CrossRef]
  7. Alcazar-Ruiz, A.; Dorado, F.; Sanchez-Silva, L. Influence of Temperature and Residence Time on Torrefaction Coupled to Fast Pyrolysis for Valorizing Agricultural Waste. Energies 2022, 15, 7914. [Google Scholar] [CrossRef]
  8. Jie, C.; Zhen, X.; Wu, J.H. Research Progress on Biomass Pyrolysis Kinetics. Adv. Mater. Res. 2013, 805–806, 240–246. [Google Scholar] [CrossRef]
  9. Balat, M. Mechanisms of Thermochemical Biomass Conversion Processes. Part 3: Reactions of Liquefaction. Energy Sources Part A Recover. Util. Environ. Eff. 2008, 30, 649–659. [Google Scholar] [CrossRef]
  10. Li, G.; Hse, C.; Qin, T. Wood liquefaction with phenol by microwave heating and FTIR evaluation. J. For. Res. 2015, 26, 1043–1048. [Google Scholar] [CrossRef]
  11. Antonović, A.; Jambreković, V.; Jaroslav, K.; Španić, N.; Medved, S. Influence of Urea-Formaldehyde Resin Modification with Liquefied Wood on Particleboard Properties. Drv. Ind. 2010, 61, 5–14. [Google Scholar]
  12. Jovičić, N.; Antonović, A.; Matin, A.; Antolović, S.; Kalambura, S.; Krička, T. Biomass Valorization of Walnut Shell for Liquefaction Efficiency. Energies 2022, 15, 495. [Google Scholar] [CrossRef]
  13. Trubetskaya, A. Reactivity Effects of Inorganic Content in Biomass Gasification: A Review. Energies 2022, 15, 3137. [Google Scholar] [CrossRef]
  14. Guo, Q.; Cheng, Z.; Chen, G.; Yan, B.; Li, J.; Hou, L.; Ronsse, F. Assessment of biomass demineralization on gasification: From experimental investigation, mechanism to potential application. Sci. Total. Environ. 2020, 726, 138634. [Google Scholar] [CrossRef] [PubMed]
  15. Banks, S.; Nowakowski, D.; Bridgwater, A. Fast pyrolysis processing of surfactant washed Miscanthus. Fuel Process. Technol. 2014, 128, 94–103. [Google Scholar] [CrossRef] [Green Version]
  16. Jiang, L.; Hu, S.; Sun, L.-S.; Su, S.; Xu, K.; He, L.-M.; Xiang, J. Influence of different demineralization treatments on physicochemical structure and thermal degradation of biomass. Bioresour. Technol. 2013, 146, 254–260. [Google Scholar] [CrossRef]
  17. Pattiya, A.; Chaow-U-Thai, A.; Rittidech, S. The Influence of Pretreatment Techniques on Ash Content of Cassava Residues. Int. J. Green Energy 2013, 10, 544–552. [Google Scholar] [CrossRef]
  18. Li, Y.; Deng, B.; Hou, Y.; Wang, S.; Zeng, F.; Luo, Y.; Ge, J.; Yao, S. Dissolution kinetics of calcium ions in hydrothermal demineralization of eucalyptus. Bioresources 2022, 17, 2849–2863. [Google Scholar] [CrossRef]
  19. Ge, J.; Wu, Y.; Han, Y.; Qin, C.; Nie, S.; Liu, S.; Wang, S.; Yao, S. Effect of hydrothermal pretreatment on the demineralization and thermal degradation behavior of eucalyptus. Bioresour. Technol. 2020, 307, 123246. [Google Scholar] [CrossRef]
  20. Li, W.Y.; Zhang, Z.B.; Zhao, L.Q.; Lu, Q. Thermogravimetric Analysis of Raw and Demineralized Biomass Materials. In Applied Mechanics and Materials; Trans Tech Publications Ltd.: Stafa-Zurich, Switzerland, 2013. [Google Scholar] [CrossRef]
  21. Dong, Q.; Zhang, S.; Ding, K.; Zhu, S.; Zhang, H.; Liu, X. Pyrolysis behavior of raw/torrefied rice straw after different demineralization processes. Biomass Bioenergy 2018, 119, 229–236. [Google Scholar] [CrossRef]
  22. Eom, I.-Y.; Kim, J.-Y.; Lee, S.-M.; Cho, T.-S.; Yeo, H.; Choi, J.-W. Comparison of pyrolytic products produced from inorganic-rich and demineralized rice straw (Oryza sativa L.) by fluidized bed pyrolyzer for future biorefinery approach. Bioresour. Technol. 2013, 128, 664–672. [Google Scholar] [CrossRef] [PubMed]
  23. Lateef, H.U.; Kazmi, M.; Tabish, A.N.; Cheema, I.I.; Rashid, M.I. Effect of demineralization on physiochemical and thermal characteristics of wheat straw. Energy Sources Part A Recover. Util. Environ. Eff. 2020. [Google Scholar] [CrossRef]
  24. Namkung, H.; Park, J.-H.; Lee, Y.-J.; Song, G.-S.; Choi, J.W.; Park, S.-J.; Kim, S.; Liu, J.; Choi, Y.-C. Performance evaluation of biomass pretreated by demineralization and torrefaction for ash deposition and PM emissions in the combustion experiments. Fuel 2021, 292, 120379. [Google Scholar] [CrossRef]
  25. Asadieraghi, M.; Daud, W.M.A.W. Characterization of lignocellulosic biomass thermal degradation and physiochemical structure: Effects of demineralization by diverse acid solutions. Energy Convers. Manag. 2014, 82, 71–82. [Google Scholar] [CrossRef]
  26. Dã az-Vã¡zquez, L.M.; Rojas-Pérez, A.; Fuentes-Caraballo, M.; Robles, I.V.; Jena, U.; Das, K.C. Demineralization of Sargassum spp. Macroalgae Biomass: Selective Hydrothermal Liquefaction Process for Bio-Oil Production. Front. Energy Res. 2015, 3, 6. [Google Scholar] [CrossRef] [Green Version]
  27. Gwirtz, J.A.; Garcia-Casal, M.N. Processing maize flour and corn meal food products. Ann. N. Y. Acad. Sci. 2013, 1312, 66–75. [Google Scholar] [CrossRef] [Green Version]
  28. Xiong, S.; Öhman, M.; Zhang, Y.; Lestander, T. Corn Stalk Ash Composition and Its Melting (Slagging) Behavior during Combustion. Energy Fuels 2010, 24, 4866–4871. [Google Scholar] [CrossRef]
  29. Statistical Yearbook of Repulic of Coratia. 2018. Available online: https://web.dzs.hr/Hrv/Archive/arh_stat_year.htm (accessed on 5 September 2022).
  30. Matin, A.; Krička, T.; Grubor, M.; Leto, J.; Bilandžija, N.; Voća, N.; Jurišić, V.; Zmaić, K.; Kiš, D.; Kopilović, I. Iskoristivost poslježetvenih ostataka za proizvodnju zelene energije, 1st ed.; Josip Juraj Srossmayer Univesrity of Osijek: Osijek, Croatia, 2019; pp. 48–50. [Google Scholar]
  31. Liu, Z.; Cao, Y.; Wang, Z.; Ren, H.; Amidon, T.E.; Lai, Y. The Utilization of Soybean Straw. I. Fiber Morphology and Chemical Characteristics. Bioresources 2015, 10, 2266–2280. [Google Scholar] [CrossRef] [Green Version]
  32. SIS-CEN/TS 15149-2:2006; Solid Biofuels—Methods for the Determination of Particle Size Distribution—Part 2: Vibrating Screen Method Using Sieve Apertures of 3.15 mm and Below. SIST: Ljubljana, Slovenia, 2006; 3.
  33. SIS-CEN/TS 14775:2004; Solid Biofuels—Method for the Determination of Ssh Content. SIST: Ljubljana, Slovenia, 2004.
  34. HRN EN ISO 16967:2015; Solid Biofuels—Determination of Major Elements—Al, Ca, Fe, Mg, P, K, Si, Na. HRN: Zagreb, Croatia, 2015.
  35. HRN EN ISO 16968:2015; Solid Biofuels—Determination of Minor Elements. HRN: Zagreb, Croatia, 2015.
  36. Chin, K.; H’Ng, P.; Maminski, M.; Go, W.; Lee, C.; Raja-Nazrin, R.; Khoo, P.; Ashikin, S.; Halimatun, I. Additional additives to reduce ash related operation problems of solid biofuel from oil palm biomass upon combustion. Ind. Crops Prod. 2018, 123, 285–295. [Google Scholar] [CrossRef]
  37. Parmar, K. Biomass-An Overview on Composition Characteristics and Properties. IRA-Int. J. Appl. Sci. 2017, 7, 42–51. [Google Scholar] [CrossRef]
  38. Álvarez, P.; Santamaría, R.; Blanco, C.; Granda, M. Thermal degradation of lignocellulosic materials treated with several acids. J. Anal. Appl. Pyrolysis 2005, 74, 337–343. [Google Scholar] [CrossRef]
  39. Masiá, A.A.T.; Buhre, B.J.P.; Gupta, R.P.; Wall, T.F. Characterising ash of biomass and waste. Fuel Process. Technol. 2007, 88, 1071–1081. [Google Scholar] [CrossRef]
  40. Obernberger, I.; Brunner, T.; Bärnthaler, G. Chemical properties of solid biofuels—Significance and impact. Biomass Bioenergy 2006, 30, 973–982. [Google Scholar] [CrossRef]
  41. Van Loo, S.; Koppejan, J. Handbook of Biomass Combustion and Co-Firing; IEA: Paris, France, 2002; ISBN 9036517737. [Google Scholar]
  42. Niu, Y.; Tan, H.; Hui, S. Ash-related issues during biomass combustion: Alkali-induced slagging, silicate melt-induced slagging (ash fusion), agglomeration, corrosion, ash utilization, and related countermeasures. Prog. Energy Combust. Sci. 2016, 52, 1–61. [Google Scholar] [CrossRef]
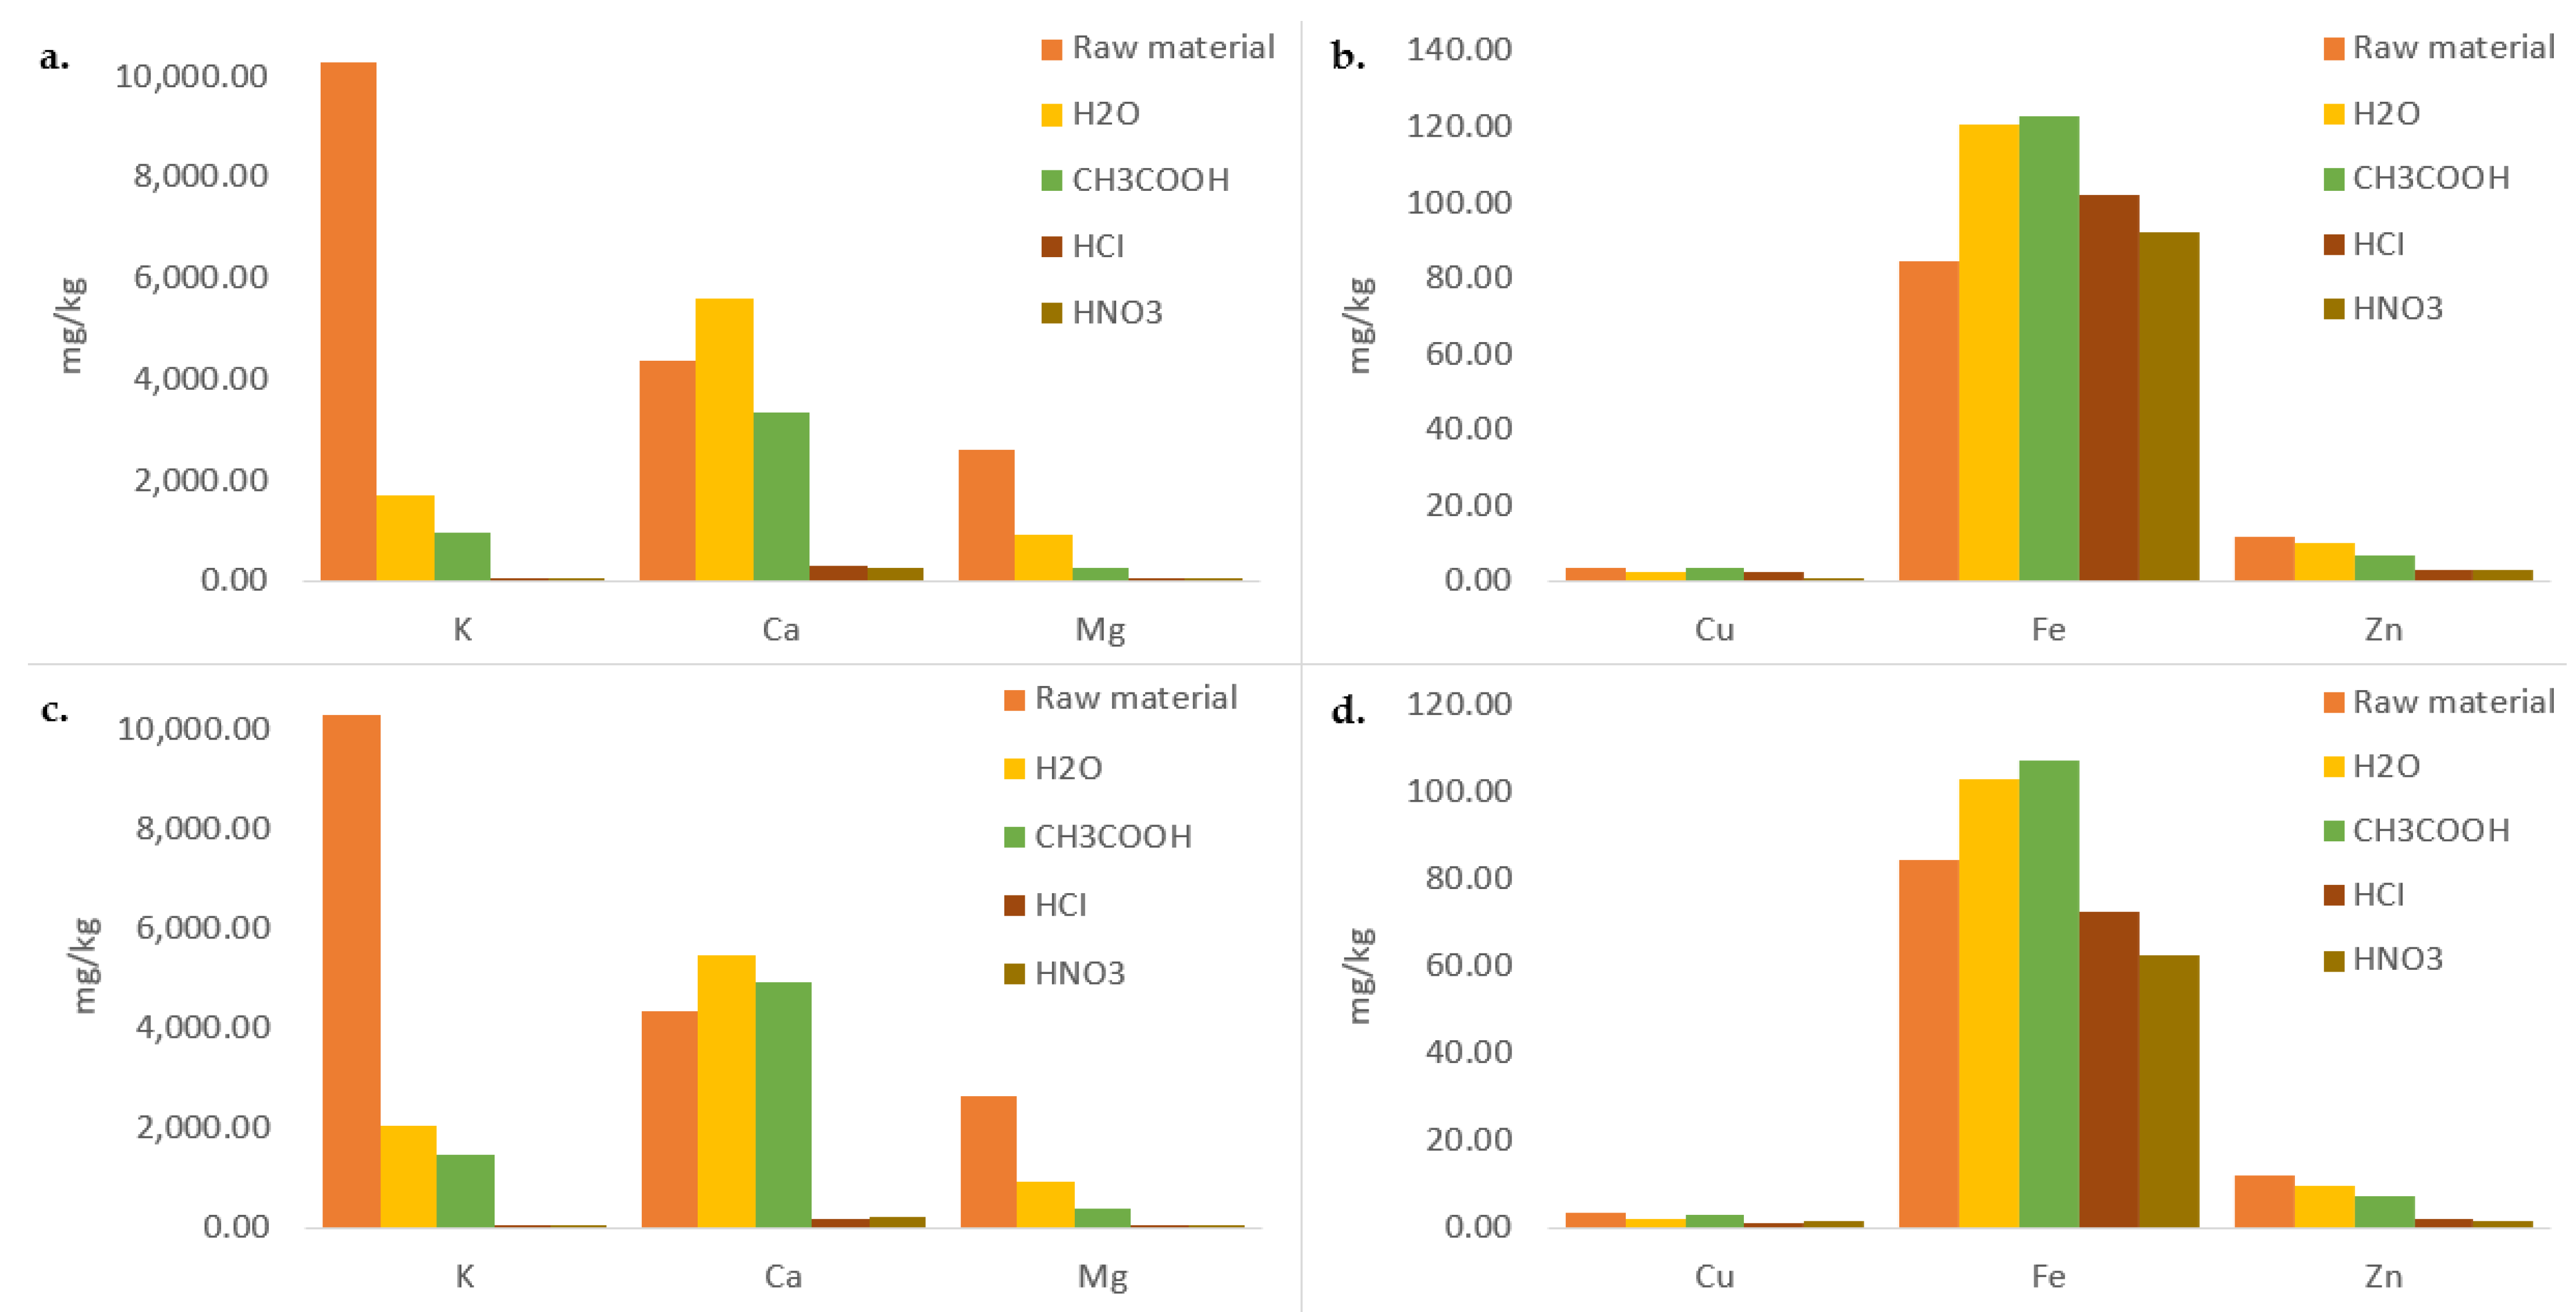
Figure 1. Atomic spectrometry analysis of: (a) macro elements in untreated and treated corn I within 30 min (b) micro elements in untreated and treated corn I within 30 min (c) macro elements in untreated and treated corn I within 240 min (d) micro elements in untreated and treated corn I within 240 min.
Energies 16 00967 g001
Figure 2. Atomic spectrometry analysis of: (a) macro elements in untreated and treated corn II within 30 min (b) micro elements in untreated and treated corn II within 30 min (c) macro elements in untreated and treated corn II within 240 min (d) micro elements in untreated and treated corn II within 240 min.
Energies 16 00967 g002
Figure 3. Atomic spectrometry analysis of: (a) macro elements in untreated and treated soybean I within 30 min (b) micro elements in untreated and treated soybean I within 30 min (c) macro elements in untreated and treated soybean I within 240 min (d) micro elements in untreated and treated soybean I within 240 min.
Energies 16 00967 g003
Figure 4. Atomic spectrometry analysis of: (a) macro elements in untreated and treated soybean II within 30 min (b) micro elements in untreated and treated soybean II within 30 min (c) macro elements in untreated and treated soybean II within 240 min (d) micro elements in untreated and treated soybean II within 240 min.
Energies 16 00967 g004
Table 1. Initial ash content in unsieved corn and soybean (x), corn (I, II) and soybean (I, II) samples.
SampleAsh (%)
Soybean x3.36 ± 0.18 a
Soybean I2.94 ± 0.77 b
Soybean II
Corn x
Corn I
Corn II
Statistical significance
Minimum
Maximum
Average
1.55 ± 0.22 a
8.17 ± 0.05 b
6.73 ± 0.03 c
6.37 ± 0.02 c
*
1.55
8.17
4.85
Roman numerals indicate different grain size groups (I = 630–1000 ym; II = 1000–1400 ym). The means in the same column with different lowercase superscripts are statistically different (p < 0.05), according to Tukey’s HSD test. Statistical significance; * p ≤ 0.01
Table 2. Ash content in soybean (I, II) and corn (I, II) after demineralization.
SampleTimeSolventAsh (%)
Soybean I30dH2O1.38 ± 0.06 f
CH3COOH0.75 ± 0.04 cde
HCl0.11 ± 0.02 ab
HNO30.18 ± 0.05 ab
240 dH2O1.17 ± 0.1 def
CH3COOH0.59 ± 0.13 bc
HCl0.04 ± 0.01 a
HNO30.1 ± 0.04 ab
Soybean II30dH2O0.85 ± 0.06 cde
CH3COOH0.44 ± 0.06 abc
HCl0.1 ± 0.02 ab
HNO30.12 ± 0.03 ab
240 dH2O0.72 ± 0.06 cd
CH3COOH0.61 ± 0.08 bc
HCl0.02 ± 0.01 a
HNO30.03 ± 0.02 a
Corn I 30dH2O4.46 ± 0.1 ijk
CH3COOH4.36 ± 0.35 ijk
HCl3.45 ± 0.13 g
HNO33.85 ± 0.1 ghi
240 dH2O4.18 ± 0.26 hij
CH3COOH3.62 ± 0.26 g
HCl3.35 ± 0.21 g
HNO33.45 ± 0.12 g
Corn II 30dH2O4.71 ± 0.15 k
CH3COOH3.4 ± 0.32 g
HCl1.46 ± 0.02 f
HNO31.62 ± 0.34 f
240 dH2O4.18 ± 0.14 hij
CH3COOH3.78 ± 0.23 gh
HCl1.26 ± 0.17 ef
HNO31.25 ± 0.35 ef
Statistical significance*
Minimum0.02
Maximum4.71
Average1.86
The means in the same column with different lowercase superscripts are statistically different (p < 0.05), according to Tukey’s HSD test. Statistical significance; * p ≤ 0.01
Table 3. Results of univariant analysis of ash content.
SS
EffectDFAsh (%)
Time10.77 n.s.
Solvent336.41 *
Time*Solvent30.17 n.s.
Error88227.91
DF—degrees of freedom; SS—sum of squares. *—Statistical significance; n.s.—not significante.
Table 4. Percentage change in ash content in corn I and II (%).
Time (min)SolidGrain Size Group
--III
30dH2O33.7626.11
30CH3COOH 1% 35.3046.66
30HCl 1%48.8677.13
30HNO3 1% 42.7974.68
240dH2O38.0154.78
240CH3COOH 48.8640.77
240HCl 1% 50.2680.27
240HNO3 1%48.7480.38
Table 5. Percentage change in ash content in soybean I and II (%).
Time (min)SolidGrain Size Group
--III
30dH2O53.3745.13
30CH3COOH 1% 74.7172.07
30HCl 1%96.6094.08
30HNO3 1% 94.0492.37
240dH2O60.4453.66
240CH3COOH 80.2260.72
240HCl 1% 98.9098.73
240HNO3 1%96.6298.12
Disclaimer/Publisher’s Note: The statements, opinions and data contained in all publications are solely those of the individual author(s) and contributor(s) and not of MDPI and/or the editor(s). MDPI and/or the editor(s) disclaim responsibility for any injury to people or property resulting from any ideas, methods, instructions or products referred to in the content.