Abstract
The uniqueness of this investigation lies in empirically testing and proving the contagion spillover of Bitcoin attention to carbon futures. Specifically, several models are adopted to investigate the explanatory and predictive abilities of Bitcoin attention to carbon futures. The results can be generalized as follows. First, Bitcoin attention Granger causes the variation of carbon futures. Second, Bitcoin attention shows a negative impact on carbon futures and an addition, an invert U-shaped connection exists. Third, the Bitcoin attention-based models can beat the commonly used historical average benchmark during out-of-sample forecasting both in statistical and economic levels. Fourth, we complete robustness checks to certify that the contagion spillover from Bitcoin attention to the pricing of carbon futures does exist. Finally, we prove the linear and non-linear impacts from Bitcoin attention to realized volatility of carbon futures. All the results prove that Bitcoin attention is an important pricing factor for carbon futures market.
1. Introduction
Climate change poses irreversible damages to humanity (Intergovernmental Panel on Climate Change, IPCC, https://www.ipcc.ch/, accessed on 1 July 2021). Global warming, one of the most obvious phenotypic forms of climate change, became a world focus in the end of last century. The famous Kyoto Protocol was therefore signed in 1997, with the aim to control and reduce carbon dioxide to protect human beings. The Protocol determined an Emission Trading (ET) mechanism (UNFCCC, https://unfccc.int/, accessed on 1 July 2021), which successfully transfers the carbon reduction to capital issue to some degree [1].
Based on the ET mechanism, the European Union established the famous EU-ETS. Since the formerly trading of carbon allowance in EU-ETS from 2005, the trading volume gradually increased, and price of carbon changed drastically, resulting the EU-ETS carbon market to have some characteristics similar with financial markets and attracts numerous financial investigations.
Inside the carbon market, carbon return seems to the most attracting characteristic as carbon return reflects the marginal abatement cost and is crucial for both authorities and individual investors in making climate policies and managing wealth. However, current investigations seem to be puzzled and have no unified conclusions on return explaining and forecasting in carbon market [2,3]. The puzzles greatly raise our interests and motivate the authors to center on carbon explaining and forecasting in this paper to broaden the current studies and benefit the authorities to some extent.
Bitcoin, one of the most popular cryptocurrencies, becomes a research focus in recent years [4,5]. While researchers are obsessed with price of Bitcoin, few researchers paid attention to the huge electricity consumptions and carbon emissions behind Bitcoin until Jiang et al. [6]. On the one hand, huge excess return prompts Bitcoin trading and Bitcoin mining, resulting the demand for electricity and carbon emission to change drastically. Consequently, the carbon price is affected. On the other hand, Zhu et al. points out that investor attention on Bitcoin will affect the Bitcoin market [4]. The two aspects motivate the authors to link the Bitcoin attention and carbon price in the following theoretical framework (see Figure 1). However, current investigations have not involved in this field. Thus, in this paper, we focus on Bitcoin attention and carbon return in order to fill the potential research gap. As market explaining and forecasting stand the focus of pricing theory. In this paper, we try to explain and forecast the carbon return by Bitcoin attention.
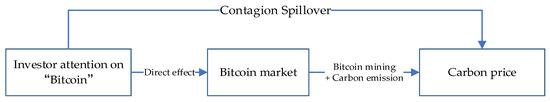
Figure 1.
Cross market transmission mechanism.
To the best of our knowledge, regarding carbon pricing and investor attention, this paper adds to the existing literature in two ways. First, our research may be the first empirical investigation to explore and certify the contagion spillover of Bitcoin attention to carbon market pricing; Second, we find Bitcoin attention to be an important factor which broadens the theories on carbon pricing. The empirical investigations can be generalized to six perspectives. First, we implement the VAR analysis and the linear Granger causality test between Bitcoin attention and carbon futures return. Second, we adopt several model specifications during the in-sample period to comprehensively analyze the connections between Bitcoin attention and carbon futures return. Third, we extent the models for in-sample analysis to out-of-sample forecasts to avoid the potential over-fitting problems; the forecast accuracy also assessed. Fourth, we further construct portfolios based on Bitcoin attention to explore whether Bitcoin attention-based models can provide investors with benefits. Fifth, we implement several robustness checks on the connections between Bitcoin attention and carbon futures return. Finally, the roles of Bitcoin attention on realized volatility of carbon futures are investigated.
The structure of this paper is shown below. Related investigations are shown in Section 2. Section 3 introduces the data for empirical investigations. Section 4 presents the models. Section 5 reports the results for in-sample and out-of-sample forecasts. In Section 6, portfolios are constructed. Section 7 summarizes the robustness checks. Section 8 refers to the further discussions on realized volatility of carbon futures. Section 9 concludes the paper.
2. Related Literature
The EU ETS begins to trade European Union Allowance (EUA) in 2005, and since then, the emerging carbon market has attracted the attention of numerous energy researchers. Similar to other traditional markets, financial characteristics, i.e., asymmetry, nonlinear dynamics, long-term memory, break points, etc., are comprehensively investigated [7,8,9,10]. Factors which may explain the variation of the carbon market have also been researched. For example, Milunovich and Joyeux find evidence that carbon futures may be one pricing factor to carbon spot as a bi-directional correlation between carbon spot and futures [11]. Kanen, Arouri and Nguyen, Ciner and Ren et al., point out that the oil market and stock market are correlated with the carbon market, which may also suggest that these markets can explain the variation of the carbon market and should be pricing factors to the carbon market [12,13,14,15]. The forecast of carbon markets is also a research hotspot. For example, Chevallier and Sévi investigate the prediction of carbon futures using the HAR-RV method [16]. Zhu and Wei, Zhu et al. select the least squares support-based methods for carbon forecasting [17,18]. Recently, sophisticated methods such as CEEMD, CIM, GARCH, GNN, VMD-ICEEMDAN-RE-SSA-HKELM, and a multi-objective optimization algorithm have also been adopted [19,20,21].
Behavior finance is developing rapidly; it reveals the connections between micro individual investor and macro financial markets, shedding light on some existing confusions [22,23,24]. In this paper, we argue that the Bitcoin attention which generates from the Google Search Volume Index is a powerful factor when the carbon market tries to price carbon futures [25]. In fact, applying investor attention to diverse aspects of financial markets has brought about many achievements. For example, Vozlyublennaia, Da et al. find significant effects of investor attention to market index and certain stocks [26,27]. Han et al. and Yao et al. argue that investor attention affects the oil markets [28,29]. Han et al. find evidence in the FX market that investor attention matters [30]. Kou et al. and Zhou et al., add further evidence on the commodity futures markets [31,32]. Chen et al. and Huang et al. note that the internet financial markets are greatly affected by investor attention [33,34]. The cryptocurrency market, as another emerging market, is also involved by investor attention [4,35,36,37,38]. As for the novel carbon market, Zhang et al. point out that investor attention is closely related with how the carbon market correctly explains and forecasts the carbon return [39]. The investor attention increases the uncertainty of the carbon market and is an important exogenous factor affecting the price of carbon assets [40]. Contagion spillover of investor attention is gradually entering the scope of research. For example, Wu et al. proves that investor attention on one specific currency surely affects other currencies’ return [41]. Yin and Feng’s research show that stock returns can be effectively forecast through the investor attention on oil market [42]. Ding et al., suggest that investor attention to climate change will significantly increase spillovers between carbon, fossil energy, and clean energy markets [43].
To sum up, existing studies that explain the carbon market mainly focus on traditional factors, failing to make comprehensive investigations by some novel factors, i.e., investor attention, etc. Besides, current investigations regarding carbon market forecasting centered on statistical models, and few studies adopt factors outside the carbon market to forecast the market. Notably, the current study begins by focusing on the contagion spillover of investor attention in certain fields. In this paper, we make comprehensive investigations of Bitcoin attention and carbon futures to add evidence for the existence of contagion spillover and broaden the theories of carbon pricing.
3. Data
We first download the data on Bitcoin prices from Investing (https://cn.investing.com/, accessed on 1 July 2021), a commonly used free website for data acquisition [44]. As shown in the following Figure 2, Bitcoin prices show great changes in 2017 and 2018, which may result to some drastic changes in Bitcoin attention. Thus, the sample period to analyze Bitcoin attention and carbon futures in this paper is set as beginning in 2019. Specifically, the sample is set to the period from 1 January 2019 to 23 April 2021, which covers 604 trading days.
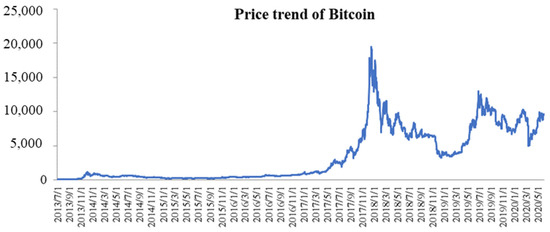
Figure 2.
Price trend of Bitcoin. Note: The X-axis refers to the time while the Y-axis represents the price of Bitcoin per unit.
This paper aims to analyze the impacts of Bitcoin attention to carbon futures; thus, some relevant data is required. For carbon futures, we download data freely from Investing (https://cn.investing.com/, accessed on 1 July 2021). As for novel Bitcoin attention, in this paper, similar with some previous investigations, GSVI is selected and is freely downloaded from Google Trends (http://www.Google.com/trends, accessed on 1 July 2021) [30,45]. In the process of data collection, we set the search area to “Global” and search the key word of “Bitcoin”.
We transfer all the data to “log-return” to form the time series used for empirical investigations. Some basic information of the two series, i.e., carbon futures and Bitcoin attention, is shown in Table 1 and Figure 3. To have an overall understanding of the return patterns of carbon futures and Bitcoin, statistics on Bitcoin return are also reported in the following Table 1.

Table 1.
Descriptive statistics and the ADF stationary test of the interested time series.
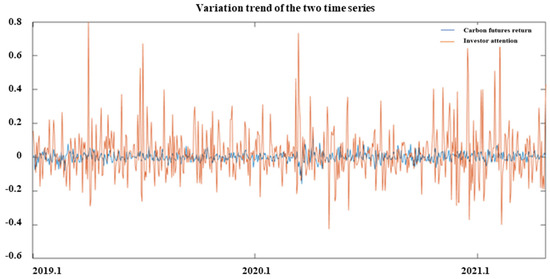
Figure 3.
Variation trend of the two selected time series. The X-axis refers to the time while the Y-axis represents the values of return for the reported time series.
As shown in Panel A of Table 1, the mean values of the three series are positive, which means that the prices increased inside our full sample period and that Bitcoin is drawing increasing amounts of global attention. Compared with carbon futures return series, the absolute values of std. dev, min, and max values for the series of Bitcoin attention are much larger. The skewness of the three series is equal to −0.0973, 1.2130, and −0.7493, respectively, while the kurtosis equals to 2.276, 4.6775, and 15.0439, respectively, sharing the same characteristics with the general financial time series. More importantly, the series for carbon futures return and Bitcoin attention is stationary, which satisfies the essential prerequisite of VAR modelling (see Panel B of Table 1). As shown in Figure 3, we may notice that local extreme value of carbon futures return came after the local extreme value of Bitcoin attention, which indicates that Bitcoin attention may cause the variation and affect the carbon futures returns. In this paper, as we try to explore the function of Bitcoin attention on carbon forecasting, we divide the full sample into two parts. From 1 January 2019 to 31 August 2020, is selected for in-sample analysis. Consequently, the period from 1 September 2020 to 23 April 2021 is used for out-of-sample forecasting.
4. Methods
4.1. VAR and Granger Causality
The VAR model depicts the correlation between the current status and lagged status of the selected assets and is widely used in the empirical investigations of investor attention [46,47,48]. Accordingly, in this study, we implement the VAR analysis to capture the relationships inside carbon futures and Bitcoin attention. The VAR model including two variables are commonly depicted by the following two Equations (1) and (2),
where refers to the carbon futures return, represents Bitcoin attention. represents the time lag of the corresponding variable. Granger causality is used to test whether another variable is the Granger cause of one variable and is closely related with the VAR model. Specifically, it is used to test whether or () is jointly equal to 0. In this paper, whether () is statistically equal to 0 in Equation (1) is of interest as it reflects the impacts of Bitcoin attention on carbon futures return. In other words, we are interested in whether contagion spillover of investor attention from one market to a totally different market exists.
4.2. Squared Bitcoin Attention
Inspired by numerous previous studies, squared terms are also important factors when analyzing investor attention and asset pricing, as squared terms contain non-linear relationships between variables [30]. To make comprehensive investigations on the contagion spillover of investor attention from multiple aspects, according to Han et al. as well as other authors, we extend Equation (1) to the following Equation (3) by adding squared terms of Bitcoin attention [30,32]. Equation (2) is not extended as Equation (2) reflects the impact of carbon futures return on Bitcoin attention, which exceeds the research scope of this study.
4.3. Interactive Terms
Inspired by Vozlyublennaia, there may exist a feedback mechanism between investor attention and asset return [26]. Thus, in this section, we add interactive terms in the regression model to trace the effects of Bitcoin attention to the carbon futures returns more precisely and the regression model is shown as follows [26].
4.4. Controlling Other Variables
It is widely accepted that the EU ETS carbon market is positively related with the oil market, since the two markets are both positively connected with energy demand [49]. Thus, in this section, we further control the representative Brent oil futures return in the carbon futures return regression model. Specifically, oil market return is introduced to the regression model by two linear formations to comprehensively identify the importance of Bitcoin attention to carbon futures return (See Equations (5) and (6)). Equation (5) is designed to directly control the oil market return, while Equation (6) is based on Equation (5), controlling the interactive terms as well.
4.5. Models and Indicators for Out-of-Sample Forecasting
The above sub-sections present the models used for in-sample analysis. As can be seen from Equations (1) and (3)–(6), operators for time-lag exist, and it is obvious that models in the previous sub-sections used to explain carbon futures return can be used to forecast the returns in the future. Therefore, in this sub-section, we extend these models to out-of-sample forecasting models and show the models in the following Equations (7)–(11). Specifically, the rolling window forecast method is adopted when forecasting the future carbon returns.
The forecasting accuracy needs to be assessed and compared. In this paper, two indicators, i.e., out-of-sample R squared () and mean squared forecast error (MSFE)-adjusted statistic, are selected [50]. A positive represents a better performance of the predictive model than the benchmark model from the aspect of cumulative sum of squared error. The is obtained from the following Equation (12),
where T is the numbers of the full sample period and t refers to the window length, is the real value of carbon futures return. contains the return forecasted by Equations (7)−(11). For financial asset return prediction, the historical average forecasting model is a difficult model to beat [51]. Thus, in this paper, , representing the benchmark forecasting value, is calculated by historical average. The MSFE-adjusted statistic can be measured using the following Equation (13).
where and denote the MSFE statistics of the forecasting model with Bitcoin attention and historical average model, respectively.
5. Results for In-Sample and Out-of-Sample
5.1. VAR and Granger Causality
During VAR modelling process, identifying a lag length described by n in Equations (1) and (2) and ensuring the lag length passes the Granger causality test are essential and crucial steps. In this section, we adopt several statistical criterions to quantify an optimal lag length and show the criteria values in Table 2. Thus, according to Table 2, setting the lag length to 4 is a preferred choice.
Table 2.
The optimized VAR lag length selection process.
According to the above analysis, the lag length is set to 4 and the results of VAR modelling and corresponding Granger causality test are listed in Table 3.
Table 3.
VAR estimation and Granger causality tests.
Obviously, Bitcoin attention does Granger cause the carbon futures return. Furthermore, Bitcoin attention is significantly and negatively connected with the carbon futures returns as the terms of , , and are significantly negative. These results demonstrate that contagion spillover of investor attention from one market, i.e., the Bitcoin market, to a totally different market does exist, i.e., the carbon futures market. The impulse response function (IRF) allows researchers to analyze the duration of shock from one variable to another variable under the framework of VAR modelling. In this section, to comprehensively analyze the contagion spillover of investor attention from one market to a totally different financial market, IRF is implemented, and Figure 4 summarizes the IRF. As shown in Figure 4, Bitcoin attention surely affects the carbon futures return, and one unit shock from Bitcoin attention may last for seven days in the carbon futures market. However, all the above-mentioned analyses are derived based on the VAR analysis, so the effects of Bitcoin attention on carbon futures deserve in-depth discussions.
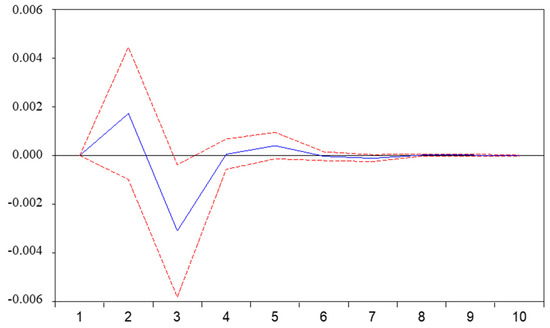
Figure 4.
Reaction of carbon futures market to Bitcoin attention. The X-axis refers to the time for response while the Y-axis represents the magnitude of response. The blue line refers to the value while the red line refers to the confidence interval.
5.2. Nonlinear Impact of Bitcion Attention
In this subsection, we estimation the Equation (3) to explore whether a non-linear effect exists from Bitcoin attention to carbon futures return. The results are in Table 4 with the lag length of 4.
Table 4.
Estimation results after controlling squared Bitcoin attention.
As shown in Table 4, linear and non-linear terms of Bitcoin attention do not show significance at the same lag length, implying that the influence of Bitcoin attention may not be quantified. However, Bitcoin attention as well as squared Bitcoin attention in the past periods significantly influence the current carbon futures returns since some corresponding terms are significant, i.e., , and . The results in this sub-section further certify that the contagion spillover from Bitcoin attention to carbon pricing does exist, and in addition, the results show that there may exists an invert U-shaped relationship between Bitcoin attention and carbon futures return.
5.3. Interactive Terms
In this sub-section, we estimate the Equation (4), and the results are shown in Table 5. On the one hand, interactive term between carbon futures returns and Bitcoin attention indeed shows impact on carbon futures return, as the second lag is significant and positive; On the other hand, Bitcoin attention negatively affects the carbon futures, which is consistent with the above analysis. The results provide in-depth evidence on the contagion spillover.
Table 5.
Estimation of Equation (4).
5.4. Controlling Other Variables
As mentioned previously, the oil market shows great effects on the carbon market. Thus, in this sub-section, we control the oil market factor and estimate the two Equations (5) and (6). The results are shown in Table 6.
Table 6.
Estimation after controlling the Brent oil market return.
As shown above, after controlling the oil market factor, Bitcoin attention is still negatively connected with the carbon futures return, as the terms of , , and are significant, which is consistent with above analysis. Furthermore, the results identify another important reality that the interactive terms between Bitcoin attention and oil return are crucial factors for carbon futures market. The above results add another important evidence to support the existence of contagion spillover from Bitcoin attention to carbon pricing. Furthermore, the results in Table 6 also support the previous conclusion that the carbon market is positively connected with the oil market as the terms for oil market return are positive.
5.5. Out-of-Sample Forecasts
We forecast the carbon futures returns by using predictive models (7)–(11), and the results are shown in Table 7.
Table 7.
Out-of-sample forecasting.
As shown in Table 7, on the one hand, predictive model represented by Equation (11), which incorporates the oil returns and interactive terms, has a positive , while models represented by Equations (7)−(10) do not; on the other hand, the statistic for Equation (11) shows significance at 5% level. The two aspects indicate that, compared with the historical average forecasting model, combining oil return and Bitcoin attention surely improve the forecasting accuracy, Bitcoin attention seems to show excellent ability to predict carbon futures. In this paper, not only the predictive power of Bitcoin attention on the short horizon are investigated, but also the long horizons [39]. The results for out-of-sample forecast in long horizons are shown in Table 8. Evidently, the predictive model represented by Equation (11) can also significantly beat the historical average model in long horizons.
Table 8.
Long horizons forecasts during out-of-sample.
Combining Table 7 and Table 8, it seems that the predictive model incorporated with Bitcoin attention can always outperform historical average benchmark model. However, it should be noted that, in Equation (11), oil market factors are included as explanatory variables. Thus, it is not sufficient to conclude that Bitcoin attention is also a crucial factor in forecasting the carbon futures market. To solve the deficiency, in this paper, we complete some in-depth investigations. Specifically, we remove all the terms related with investor attention in Equation (11) and re-examine the out-of-sample forecasts. The corresponding equation and results are shown in Equation (14) and Table 9. From Table 9, it is obvious that the predictive model of Equation (14) outperforms the historical average benchmark model. However, it is also evident that Equation (14) does not beat Equation (11) regarding the same historical average benchmark model. In other words, we can conclude that Bitcoin attention can significantly improve accuracy in carbon futures return forecasting.
Table 9.
Comparison of Equations (11) and (14) in out-of-sample forecasts.
6. Economic Values
The above sections demonstrate that investor attention on one market can spill into a totally different financial market. Specifically, in this paper, it is identified that Bitcoin attention can empirically explain and forecast carbon futures returns. However, this does not imply that a portfolio based on Bitcoin attention can beat a portfolio based on traditional historical average forecasting technology. In other words, this does not mean that Bitcoin attention can generate certain economic values which outperform the commonly used models. Thus, in this section, we implement some related investigations based on the predictive models in the previous sections. Specifically, we construct simple portfolios with one risk-free asset and the risky carbon futures. According to Neely et al., and Wang et al., we compare these portfolios according to the utility and Sharpe ratio (SR) [53,54]. Furthermore, according to Han et al. along with other authors, we set different parameters for transaction cost (b_cp) and risk-averse attitude () and calculate the utility and Sharpe ratio [45]. The results for the above models are shown in Table 10. As can be seen, in almost all scenarios, portfolio construction based on predictive models has a higher utility compared with the benchmark case. Meanwhile, it should be noted that for investors with the same risk-averse attitude, an increase of transaction cost results in the decrease of Sharpe ratio of the portfolio. More importantly, the predictive model of Equation (11) that can significantly improve the forecast accuracy always has a higher Sharpe ratio than the benchmark. To sum up, Bitcoin attention can surely bring economic values for risk-averse investors with mean-variance preference.
Table 10.
Economic values of incorporating investor attention.
7. Robustness Checks
7.1. Update Sample Frequency
Previous results are derived based on daily frequency. Therefore, it is of interest to change the sample frequency for robustness check to ensure academic rigor. In this section, we update the sample frequency from daily to weekly and repeat the explorations, i.e., VAR modelling and linear Granger causality test. The lag length is set to 1, 2, and 4, and the results are in Table 11. Apparently, Bitcoin attention is still negatively connected with carbon futures returns, which indicates that the conclusion on the contagion spillover does not depend on the sample frequency. Thus, our conclusion is robust.
Table 11.
Robustness checks for updating data frequency.
7.2. Twitter Based Investor Attention
The empirical results are obtained based on Bitcoin attention, which is generated from Google Search Volume Index (GSVI). Twitter, as another popular instrument to obtain and express information and emotions, is also applied to measure investor attention [44]. Inspired by Shen et al., in this paper, we update the GSVI-based investor attention to Twitter-based investor attention for robustness check [56]. Specifically, we acquire the number of tweets regarding Bitcoin from BitlnfoCharts (https://bitinfocharts.com/, accessed on 1 July 2021). Similar to the above empirical process, we transfer the number of tweets to the form of “log-return”. Basic VAR modelling and the Granger causality tests results are shown in the following Table 12. As can be seen from Table 12, updating the measurement of investor attention does not change our conclusion that cross-market spillovers from Bitcoin to carbon futures exist. Besides, Twitter-based investor attention still shows a negative impact on carbon futures return as some relevant items are significantly negative. The results also provide another empirical evidence to support that Twitter is an important pricing factor for financial asset.
Table 12.
Updating the investor attention to Twitter-based measurement.
7.3. Twitter Based Uncertainty
In the previous section, we control the crucial oil factors in the regression model to prove that Bitcoin attention is a non-negligible factor to carbon futures pricing. In fact, uncertainty is also a crucial factor for financial asset pricing [44,45]. Commonly, three types of uncertainty, i.e., World Uncertainty Index, Economic Policy Uncertainty Index and Twitter-based Uncertainty Indices, are widely used in financial investigations. However, due to the sample length and frequencies, the World Uncertainty Index and Economic Policy Uncertainty Index are not selected for robustness check, as the sample size is too small to regress a regression model in monthly or quarterly frequency. Thus, in this study, inspired by Ali et al., we download the Twitter-based Uncertainty Indices from Economic Policy Uncertainty (http://policyuncertainty.com/index.html, accessed on 1 July 2021) and introduce the Twitter-based Uncertainty Indices to the regression model in daily frequency for robustness checks [44]. We select the Twitter-based economic uncertainty (TEU) and Twitter-based market uncertainty (TMU). Considering the fact that the English language is the most widely used language, we select the TEU-ENG and TMU-ENG, which consist of the total number of daily English-language tweets containing both Uncertainty terms as well as Economy terms. Detailed regression models are shown below in Equations (15)–(18). The estimation results are shown in the following Table 13. As can be seen from Table 13, Bitcoin attention still shows negative impact on carbon futures return. Besides, it is evident that Twitter-based uncertainty, i.e., TEU and TMU, plays an important role when the market is pricing the carbon futures, as some relevant items are significant.
Table 13.
Estimation results for controlling Twitter-based uncertainty.
7.4. VAR-DCC-GARCH Based Dynamic Correlation
Previous empirical investigations show an interesting reality that Bitcoin attention exerts a negative impact on carbon futures return. In other words, Bitcoin attention and carbon futures returns are negatively connected. However, the results are obtained based on some linear model specifications. In this subsection, we update the model specification to re-investigate the connections between Bitcoin attention and carbon futures. The VAR-DCC-GARCH model is a widely used model and can depict correlations between variables [57]. Thus, in this sub-section, we adopt the model and estimate the dynamic correlation between Bitcoin attention and carbon futures return for robustness check. According to the results in the sub-section of 5.1, the lag length in the VAR model is 4. At the same time, according to Ustaoğlu, DCC-GARCH (1, 1) is enough to capture the correlations between variables [57]. Thus, in this sub-section, we construct the VAR (4)-DCC-GARCH (1,1) model. Basic information about the dynamic correlation is shown in the following Figure 5 and Table 14. As shown in Table 14, Bitcoin attention and carbon futures returns are negatively connected, as the mean value of the dynamic correlation is −0.0330. The results are consistent with the all the previous estimations. Our conclusion on the negative impact still holds.
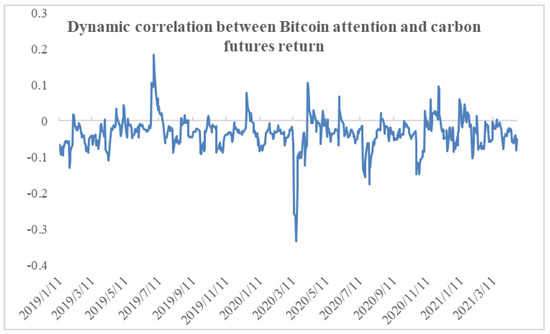
Figure 5.
Dynamic correlation between Bitcoin attention and carbon futures returns. The X-axis refers to the time while the Y-axis represents the values for the reported time series.
Table 14.
Descriptive statistics of the dynamic correlation.
8. Further Discussions
For one typical financial asset, return and volatility are two main aspects for asset pricing, and undoubtedly are two focuses in the investigation of pricing theory. The above results focus on the return level and lack explorations on carbon futures volatility. Thus, in this section, we implement some relevant investigations for Bitcoin attention and volatility of carbon futures.
As for the sample frequency, due to the data collected, weekly rather than daily data is selected from 7 January 2019 to 23 April 2021. Similar to the above section of robustness checks, we average daily Bitcoin attention in one week to represent the weekly attention. According to Shen et al., we adopt the realized volatility to represent the volatility of financial assets, and the indicator is calculated by Equation (19) as follows [56],
where is the realized volatility in week t, rt,j is the daily log-return inside week t. N is the number of trading days in week t and is set to 5 in this paper.
For a deep understanding on the effects of Bitcoin attention on realized volatility of carbon futures, we implement some similar investigations in previous sections. First, a basic VAR analysis is implemented. Specifically, a same lag length, i.e., 4, is set in this section. The related VAR estimation results, linear Granger causality tests, and impulse response analysis are shown in the following Table 15 and Figure 6.
Table 15.
VAR estimation between Bitcoin attention and realized volatility.
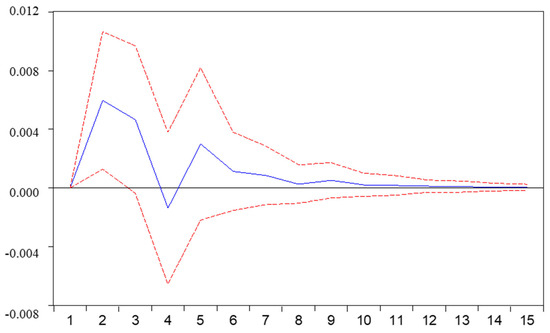
Figure 6.
Response of realized volatility to Bitcoin attention. The X-axis refers to the time for response while the Y-axis represents the magnitude of response. The blue line refers to the value while the red line refers to the confidence interval.
From the above Table 15, Bitcoin does Granger cause the realized volatility of carbon futures. Furthermore, the change of Bitcoin attention will generate a significant and positive impact on realized volatility one week later. The results from impulse response analysis show that the influence of one shock from Bitcoin attention may affect the realized volatility of carbon futures for about 10 weeks.
Subsequently, we transfer our focus to the potential non-linear relationship between realized volatility and Bitcoin attention. The equation formula is similar to Equation (3), and the estimation results are shown in Table 16.
Table 16.
Nonlinear relationship between realized volatility and Bitcoin attention.
From Table 16, and are significantly positive, which shows that Bitcoin attention surely generates a non-linear impact on the realized volatility of carbon futures. Besides, an interesting phenomenon can be found that the linear terms and non-linear terms are both significant at the first lag, which indicates that the total influence of one change in Bitcoin attention can be quantified in the future week. To sum up, Bitcoin attention is a non-negligible factor when the market is explaining the realized volatility of carbon futures.
9. Conclusions
The novelty of this paper lies in the successful connection between Bitcoin attention and carbon futures pricing. The findings can be generalized as follows. First, we construct and implement the basic VAR modelling and the corresponding linear Granger causality test. The results suggest that Bitcoin attention Granger causes the carbon futures return and is negatively connected with carbon return. In additional, IRF indicates that shock from Bitcoin attention lasts for about seven trading days in the carbon futures market. Second, linear and non-linear relationships exist between Bitcoin attention and carbon futures return. Third, predictive models based on Bitcoin attention surely improve the forecasting accuracy in both short and long horizons, and such improvement is not explained by a related variable other than Bitcoin attention. Fourth, Bitcoin attention-based models beat the historical model on utility and Sharpe ratio when constructing portfolio with the risky carbon asset and one risk-free asset. Fifth, we implement several robustness checks and find that our empirical results on the negative connection hold. Finally, we introduce Bitcoin attention to realized volatility of carbon futures, and the results show that Bitcoin attention generates both linear and non-linear impacts on the realized volatility. All these results lead to the conclusion of this paper, that contagion spillover effects of investor attention do exist, and Bitcoin attention shows great effects on carbon futures pricing.
Returns in the carbon market reflect the marginal abatement cost, and thus are important when climate policy authorities make decisions. The results of this paper provide a novel and simple method for both authorities and individual investors to understand the carbon futures market. However, deficiencies do exist. Future research can be carried out from at least four aspects. First, in this paper, the linear Granger causality test is adopted, and adopting some sophisticated time-varying model may be of interests [58]. Second, applying directional spillover method, i.e., cross-quantilogram, between Bitcoin and carbon may be another research direction [44]. Third, the EU ETS carbon market is constructed on the basis of climate policy, thus, climate policy uncertainty may be crucial for carbon pricing [58]. However, due to the sample frequency and sample period, the indicator is not controlled in the regression model. Fourth, higher-moment is the academic frontier in risk measurement, and adopting some related techniques to carbon portfolio management is also an interesting topic [44].
Author Contributions
Methodology, P.Z.; writing—original draft preparation, Q.Z. and P.Z.; writing—review & editing, Q.Z., P.Z. and Y.Z.; supervisor, Q.Z. and Y.Z. All authors have read and agreed to the published version of the manuscript.
Funding
This work was funded by the Key Program of the National Social Science Foundation of China (21ATJ007).
Institutional Review Board Statement
Not applicable.
Informed Consent Statement
Not applicable.
Data Availability Statement
All the data can be freely downloaded from the Internet.
Acknowledgments
We would like to express our great thanks to the editors and reviewers for their helpful suggestions to improve the quality of this paper.
Conflicts of Interest
The authors declare no conflict of interest.
References
- Teixidó, J.; Verde, S.F.; Nicolli, F. The impact of the EU emissions trading system on low-carbon technological change: The empirical evidence. Ecol. Econ. 2019, 164, 106347. [Google Scholar] [CrossRef]
- Zhao, X.; Han, M.; Ding, L.; Kang, W. Usefulness of economic and energy data at different frequencies for carbon price forecasting in the EU ETS. Appl. Energy 2018, 216, 132–141. [Google Scholar] [CrossRef]
- Aatola, P.; Ollikainen, M.; Toppinen, A. Price determination in the EU ETS market: Theory and econometric analysis with market fundamentals. Energy Econ. 2013, 36, 380–395. [Google Scholar] [CrossRef]
- Zhu, P.; Zhang, X.; Wu, Y.; Zheng, H.; Zhang, Y. Investor attention and cryptocurrency: Evidence from the Bitcoin market. PLoS ONE 2021, 16, e0246331. [Google Scholar] [CrossRef] [PubMed]
- Huang, Y.; Duan, K.; Urquhart, A. Time-varying dependence between Bitcoin and green financial assets: A comparison between pre-and post-COVID-19 periods. J. Int. Financ. Mark. Inst. Money 2023, 82, 101687. [Google Scholar] [CrossRef]
- Jiang, S.; Li, Y.; Lu, Q.; Hong, Y.; Guan, D.; Xiong, Y.; Wang, S. Policy assessments for the carbon emission flows and sustainability of Bitcoin blockchain operation in China. Nat. Commun. 2021, 12, 1938. [Google Scholar] [CrossRef] [PubMed]
- Paolella, M.S.; Taschini, L. An econometric analysis of emission allowance prices. J. Bank Financ. 2008, 32, 2022–2032. [Google Scholar] [CrossRef]
- Benz, E.; Trück, S. Modeling the price dynamics of CO2 emission allowances. Energy Econ. 2009, 31, 4–15. [Google Scholar] [CrossRef]
- Feng, Z.H.; Zou, L.L.; Wei, Y.M. Carbon price volatility: Evidence from EU ETS. Appl. Energy 2011, 88, 590–598. [Google Scholar] [CrossRef]
- Dutta, A. Modeling and forecasting the volatility of carbon emission market: The role of outliers, time-varying jumps and oil price risk. J. Clean. Prod. 2018, 172, 2773–2781. [Google Scholar] [CrossRef]
- Milunovich, G.; Joyeux, R. Pricing efficiency and arbitrage in the EU ETS carbon futures market. J. Invest. Strategy 2007, 2, 23–26. [Google Scholar]
- Kanen, J.L.M. Carbon Trading and Pricing; Environmental Finance Publications: London, UK, 2006. [Google Scholar]
- Arouri, M.E.H.; Nguyen, D.K. Oil prices, stock markets and portfolio investment: Evidence from sector analysis in Europe over the last decade. Energy Policy 2010, 38, 4528–4539. [Google Scholar] [CrossRef]
- Ciner, C. Energy shocks and financial markets: Nonlinear linkages. Stud. Nonlinear Dyn. Econom. 2001, 5, 203–212. [Google Scholar] [CrossRef]
- Ren, X.; Dou, Y.; Dong, K.; Yan, C. Spillover effects among crude oil, carbon, and stock markets: Evidence from nonparametric causality-in-quantiles tests. Appl. Econ. 2022, 1–24. [Google Scholar] [CrossRef]
- Chevallier, J.; Sévi, B. On the realized volatility of the ECX CO2 emissions 2008 futures contract: Distribution, dynamics and forecasting. Ann. Financ. 2011, 7, 1–29. [Google Scholar] [CrossRef]
- Zhu, B.; Wei, Y. Carbon price forecasting with a novel hybrid ARIMA and least squares support vector machines methodology. Omega-Int. J. Manag. Sci. 2013, 41, 517–524. [Google Scholar] [CrossRef]
- Zhu, B.; Han, D.; Wang, P.; Wu, Z.; Zhang, T.; Wei, Y.M. Forecasting carbon price using empirical mode decomposition and evolutionary least squares support vector regression. Appl. Energy 2017, 191, 521–530. [Google Scholar] [CrossRef]
- Zhang, J.; Li, D.; Hao, Y.; Tan, Z. A hybrid model using signal processing technology, econometric models and neural network for carbon spot price forecasting. J. Clean. Prod. 2018, 204, 958–964. [Google Scholar] [CrossRef]
- Hao, Y.; Tian, C.; Wu, C. Modelling of carbon price in two real carbon trading markets. J. Clean. Prod. 2020, 244, 118556. [Google Scholar] [CrossRef]
- Cheng, Y.; Hu, B. Forecasting Regional Carbon Prices in China Based on Secondary Decomposition and a Hybrid Kernel-Based Extreme Learning Machine. Energies 2022, 15, 3562. [Google Scholar] [CrossRef]
- Adra, S.; Barbopoulos, L.G. The valuation effects of investor attention in stock-financed acquisitions. J. Empir. Financ. 2018, 45, 108–125. [Google Scholar] [CrossRef]
- Audrino, F.; Sigrist, F.; Ballinari, D. The impact of sentiment and attention measures on stock market volatility. Int. J. Forecast. 2020, 36, 334–357. [Google Scholar] [CrossRef]
- Pham, L.; Huynh, T.L.D. How does investor attention influence the green bond market? Financ. Res. Lett. 2020, 35, 101533. [Google Scholar] [CrossRef]
- Wang, Y. Volatility spillovers across NFTs news attention and financial markets. Int. Rev. Financ. Anal. 2022, 83, 102313. [Google Scholar] [CrossRef]
- Vozlyublennaia, N. Investor attention, index performance, and return predictability. J. Bank Financ. 2014, 41, 17–35. [Google Scholar] [CrossRef]
- Da, Z.; Engelberg, J.; Gao, P. In search of attention. J. Financ. 2011, 66, 1461–1499. [Google Scholar] [CrossRef]
- Han, L.; Lv, Q.; Yin, L. Can investor attention predict oil prices? Energy Econ. 2017, 66, 547–558. [Google Scholar] [CrossRef]
- Yao, T.; Zhang, Y.J.; Ma, C.Q. How does investor attention affect international crude oil prices? Appl. Energy 2017, 205, 336–344. [Google Scholar] [CrossRef]
- Han, L.; Xu, Y.; Yin, L. Does investor attention matter? The attention-return relationships in FX markets. Econ. Model. 2018, 68, 644–660. [Google Scholar] [CrossRef]
- Kou, Y.; Ye, Q.; Zhao, F.; Wang, X. Effects of investor attention on commodity futures markets. Financ. Res. Lett. 2018, 25, 190–195. [Google Scholar] [CrossRef]
- Zhou, Q.; Zhu, P.; Wu, Y.; Zhang, Y. Research on the Volatility of the Cotton Market under Different Term Structures: Perspective from Investor Attention. Sustainability 2022, 14, 14389. [Google Scholar] [CrossRef]
- Chen, R.; Qian, Q.; Jin, C.; Xu, M.; Song, Q. Investor attention on internet financial markets. Financ. Res. Lett. 2020, 36, 101421. [Google Scholar] [CrossRef]
- Huang, Y.; Lu, Y. Coronation Day of Financial Market, Investor Attention, and Stock Return: A Perspective of Local and Global Media. Emerg. Mark. Financ. Trade 2021, 58, 1–14. [Google Scholar] [CrossRef]
- Ibikunle, G.; McGroarty, F.; Rzayev, K. More heat than light: Investor attention and bitcoin price discovery. Int. Rev. Financ. Anal. 2020, 69, 101459. [Google Scholar] [CrossRef]
- Su, X.; Zhan, W.; Li, Y. Quantile dependence between investor attention and cryptocurrency returns: Evidence from time and frequency domain analyses. Appl. Econ. 2021, 53, 6439–6471. [Google Scholar] [CrossRef]
- Wang, C.; Shen, D.; Li, Y. Aggregate investor attention and Bitcoin return: The long short-term memory networks perspective. Financ. Res. Lett. 2022, 49, 103143. [Google Scholar] [CrossRef]
- Neto, D. Examining interconnectedness between media attention and cryptocurrency markets: A transfer entropy story. Econ. Lett. 2022, 214, 110460. [Google Scholar] [CrossRef]
- Zhang, Y.; Chen, Y.; Wu, Y.; Zhu, P. Investor attention and carbon return: Evidence from the EU-ETS. Ekon. Istraz. 2021, 35, 709–727. [Google Scholar] [CrossRef]
- Pan, D.; Zhang, C.; Zhu, D.; Hu, S. Carbon price forecasting based on news text mining considering investor attention. Environ. Sci. Pollut. Res. 2022, 1–14. [Google Scholar] [CrossRef]
- Wu, Y.; Han, L.; Yin, L. Our currency, your attention: Contagion spillovers of investor attention on currency returns. Econ. Model. 2019, 80, 49–61. [Google Scholar] [CrossRef]
- Yin, L.; Feng, J. Can investors attention on oil markets predict stock returns? N. Am. Econ. Financ. 2019, 48, 786–800. [Google Scholar] [CrossRef]
- Ding, Q.; Huang, J.; Zhang, H. Time-frequency spillovers among carbon, fossil energy and clean energy markets: The effects of attention to climate change. Int. Rev. Financ. Anal. 2022, 83, 102222. [Google Scholar] [CrossRef]
- Ali, F.; Bouri, E.; Naifar, N.; Shahzad, S.J.H.; AlAhmad, M. An examination of whether gold-backed Islamic cryptocurrencies are safe havens for international Islamic equity markets. Res. Int. Bus. Financ. 2022, 63, 101768. [Google Scholar] [CrossRef]
- Han, L.; Wu, Y.; Yin, L. Investor attention and currency performance: International evidence. Appl. Econ. 2018, 50, 2525–2551. [Google Scholar] [CrossRef]
- Guidolin, M.; Hyde, S. Can VAR models capture regime shifts in asset returns? A long-horizon strategic asset allocation perspective. J. Bank Financ. 2012, 36, 695–716. [Google Scholar] [CrossRef]
- Anggraeni, W.; Andri, K.B.; Mahananto, F. The performance of ARIMAX model and Vector Autoregressive (VAR) model in forecasting strategic commodity price in Indonesia. Procedia Comput. Sci. 2017, 124, 189–196. [Google Scholar] [CrossRef]
- Zhang, Y.J.; Lin, J.J. Can the VAR model outperform MRS model for asset allocation in commodity market under different risk preferences of investors? Int. Rev. Financ. Anal. 2019, 66, 101395. [Google Scholar] [CrossRef]
- Ren, X.; Dou, Y.; Dong, K.; Li, Y. Information spillover and market connectedness: Multi-scale quantile-on-quantile analysis of the crude oil and carbon markets. Appl. Econ. 2022, 54, 4465–4485. [Google Scholar] [CrossRef]
- Yin, L.; Feng, J.; Liu, L.; Wang, Y. It’s not that important: The negligible effect of oil market uncertainty. Int. Rev. Econ. Financ. 2019, 60, 62–84. [Google Scholar] [CrossRef]
- Welch, I.; Goyal, A. A comprehensive look at the empirical performance of equity premium prediction. Rev. Financ. Stud. 2008, 21, 1455–1508. [Google Scholar] [CrossRef]
- Clark, T.E.; West, K.D. Approximately normal tests for equal predictive accuracy in nested models. J. Econom. 2007, 138, 291–311. [Google Scholar] [CrossRef]
- Neely, C.J.; Rapach, D.E.; Tu, J.; Zhou, G. Forecasting the equity risk premium: The role of technical indicators. Manag. Sci. 2014, 60, 1772–1791. [Google Scholar] [CrossRef]
- Wang, Y.; Wei, Y.; Wu, C.; Yin, L. Oil and the short-term predictability of stock return volatility. J. Empir. Financ. 2018, 47, 90–104. [Google Scholar] [CrossRef]
- Ferreira, M.A.; Santa-Clara, P. Forecasting stock market returns: The sum of the parts is more than the whole. J. Financ. Econ. 2011, 100, 514–537. [Google Scholar] [CrossRef]
- Shen, D.; Urquhart, A.; Wang, P. Does twitter predict bitcoin? Econ. Lett. 2019, 174, 118–122. [Google Scholar] [CrossRef]
- Ustaoğlu, E. Return and Volatility Spillover between Cryptocurrency and Stock Markets: Evidence from Turkey. J. Account. Financ. 2022, 93, 117–126. [Google Scholar] [CrossRef]
- Ren, X.; Li, J.; He, F.; Lucey, B. Impact of climate policy uncertainty on traditional energy and green markets: Evidence from time-varying granger tests. Renew. Sust. Energy Rev. 2023, 173, 113058. [Google Scholar] [CrossRef]
Disclaimer/Publisher’s Note: The statements, opinions and data contained in all publications are solely those of the individual author(s) and contributor(s) and not of MDPI and/or the editor(s). MDPI and/or the editor(s) disclaim responsibility for any injury to people or property resulting from any ideas, methods, instructions or products referred to in the content. |
© 2023 by the authors. Licensee MDPI, Basel, Switzerland. This article is an open access article distributed under the terms and conditions of the Creative Commons Attribution (CC BY) license (https://creativecommons.org/licenses/by/4.0/).