
D-Distance Technique to Determine Failure Probability of Power Circuit Breaker


Abstract
:1. Introduction
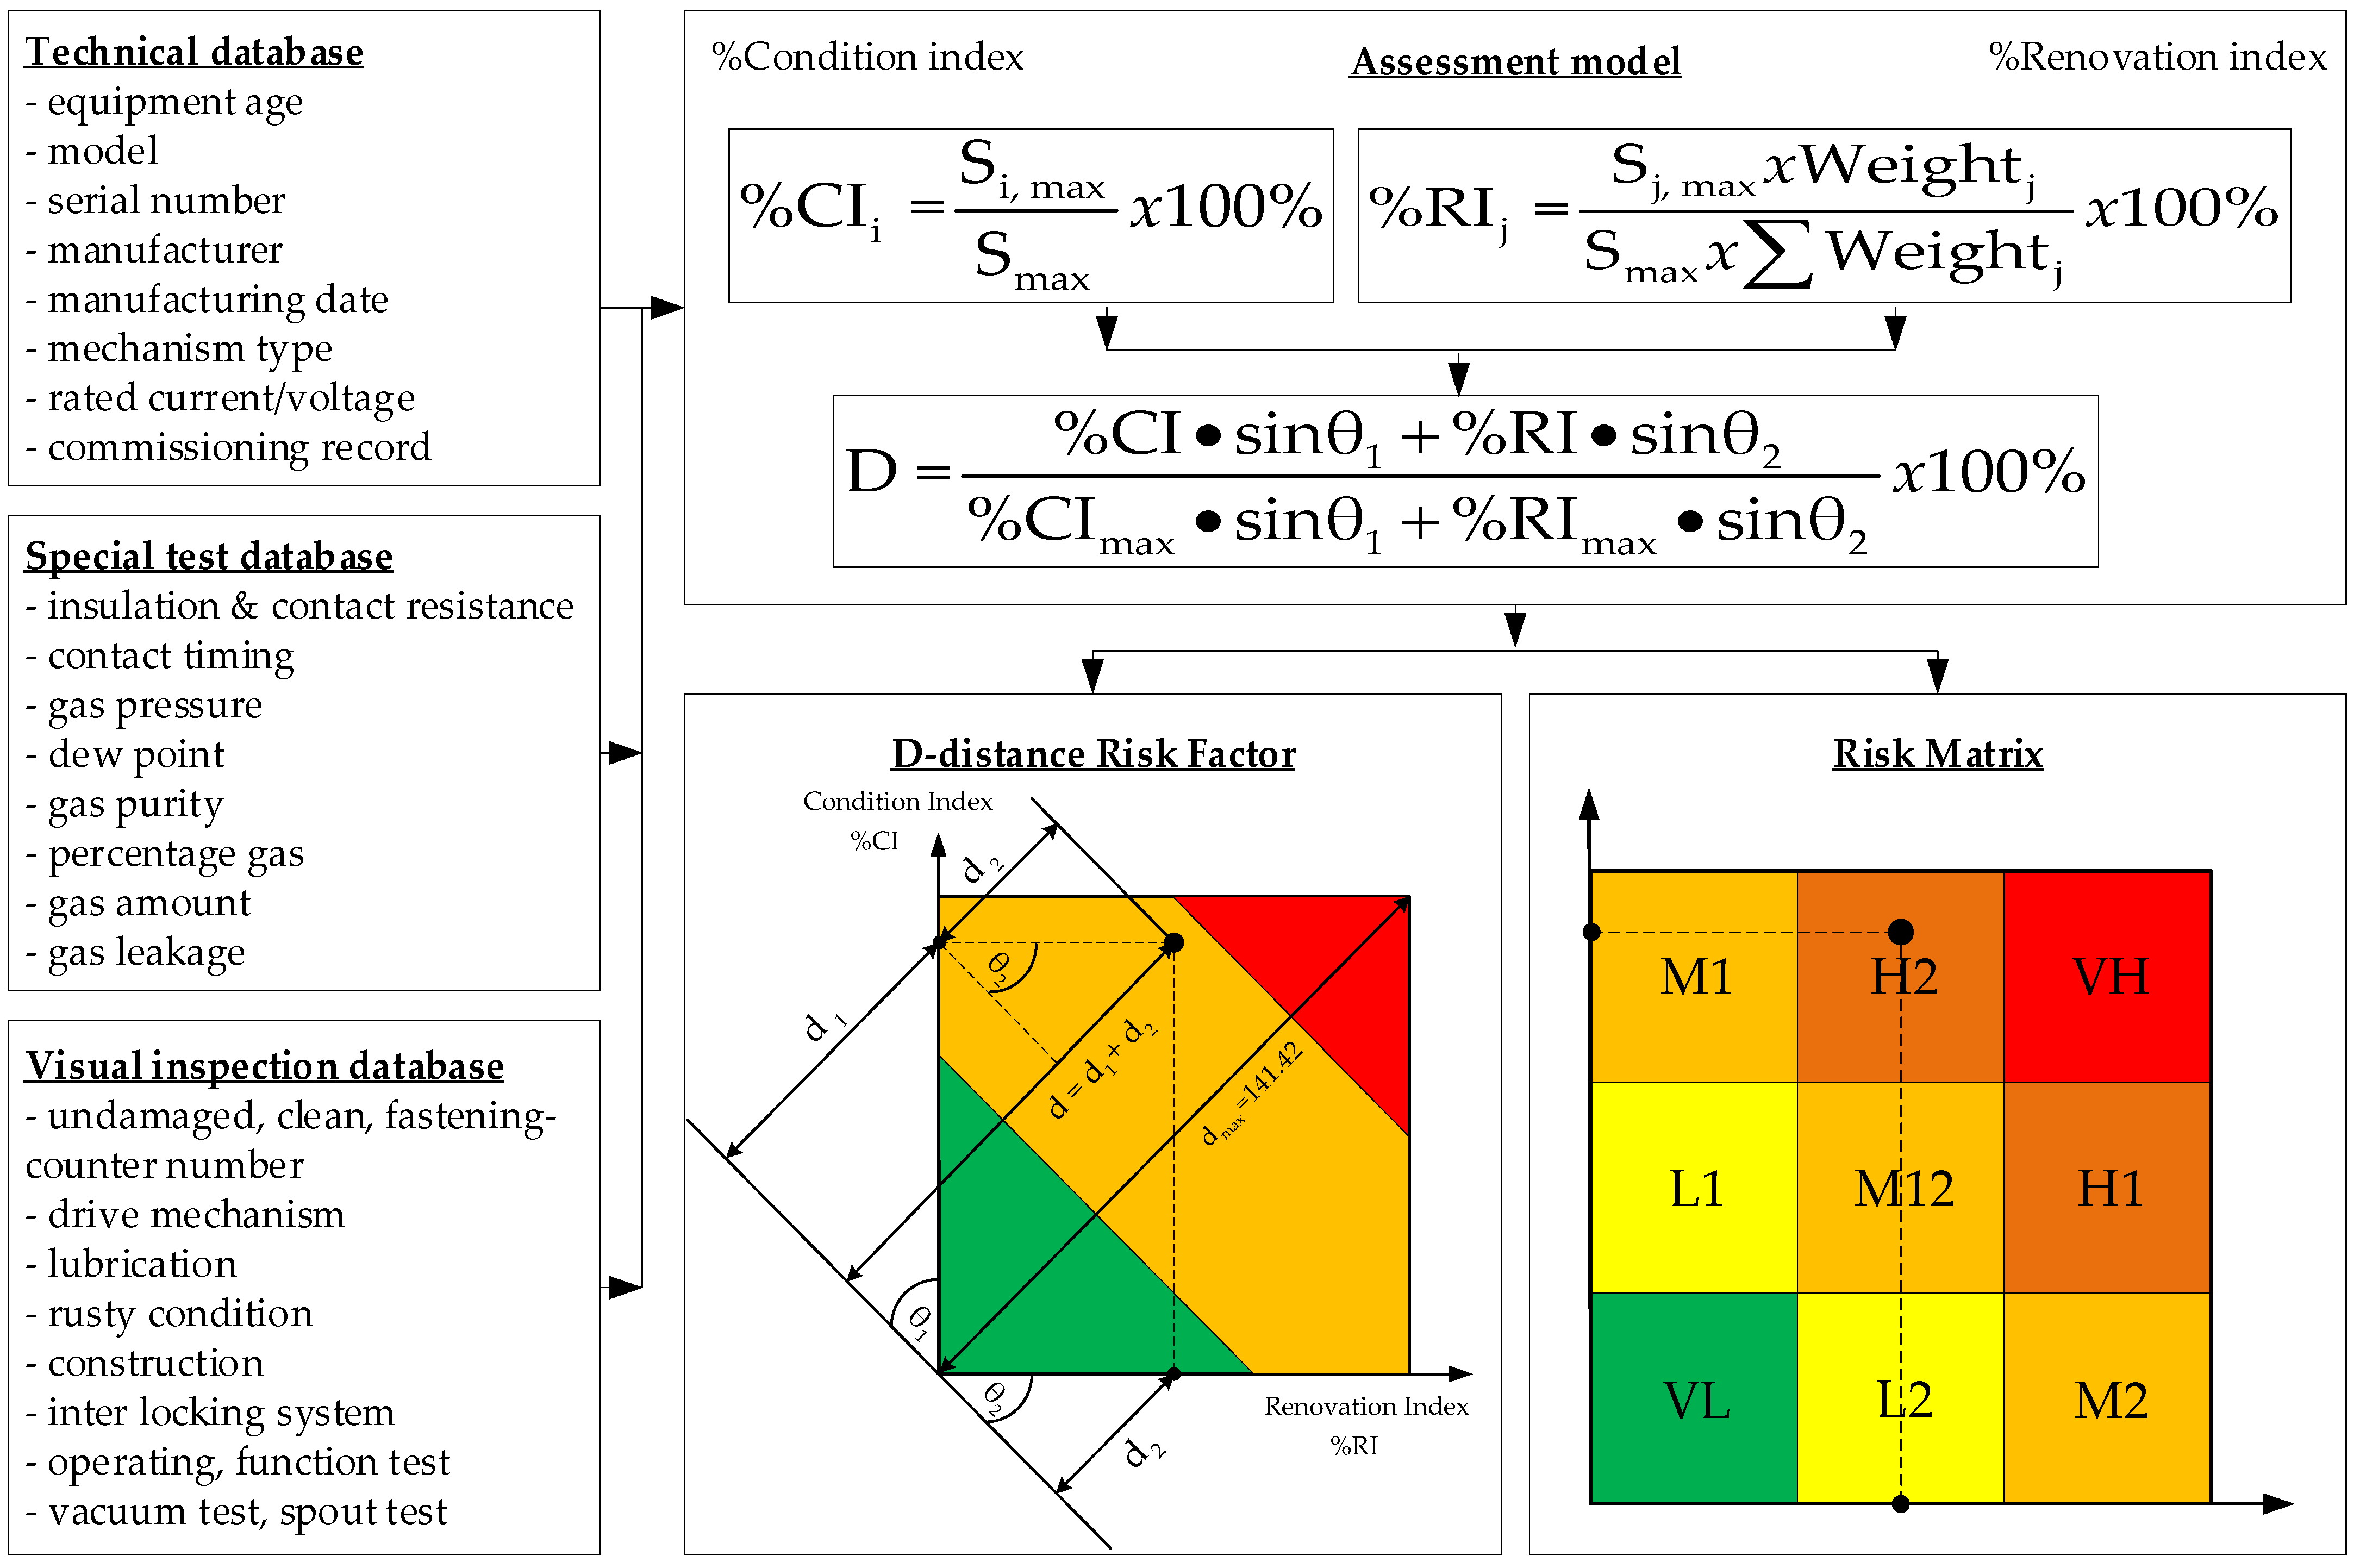
2. Failure Probability Assessment and Maintenance Strategy
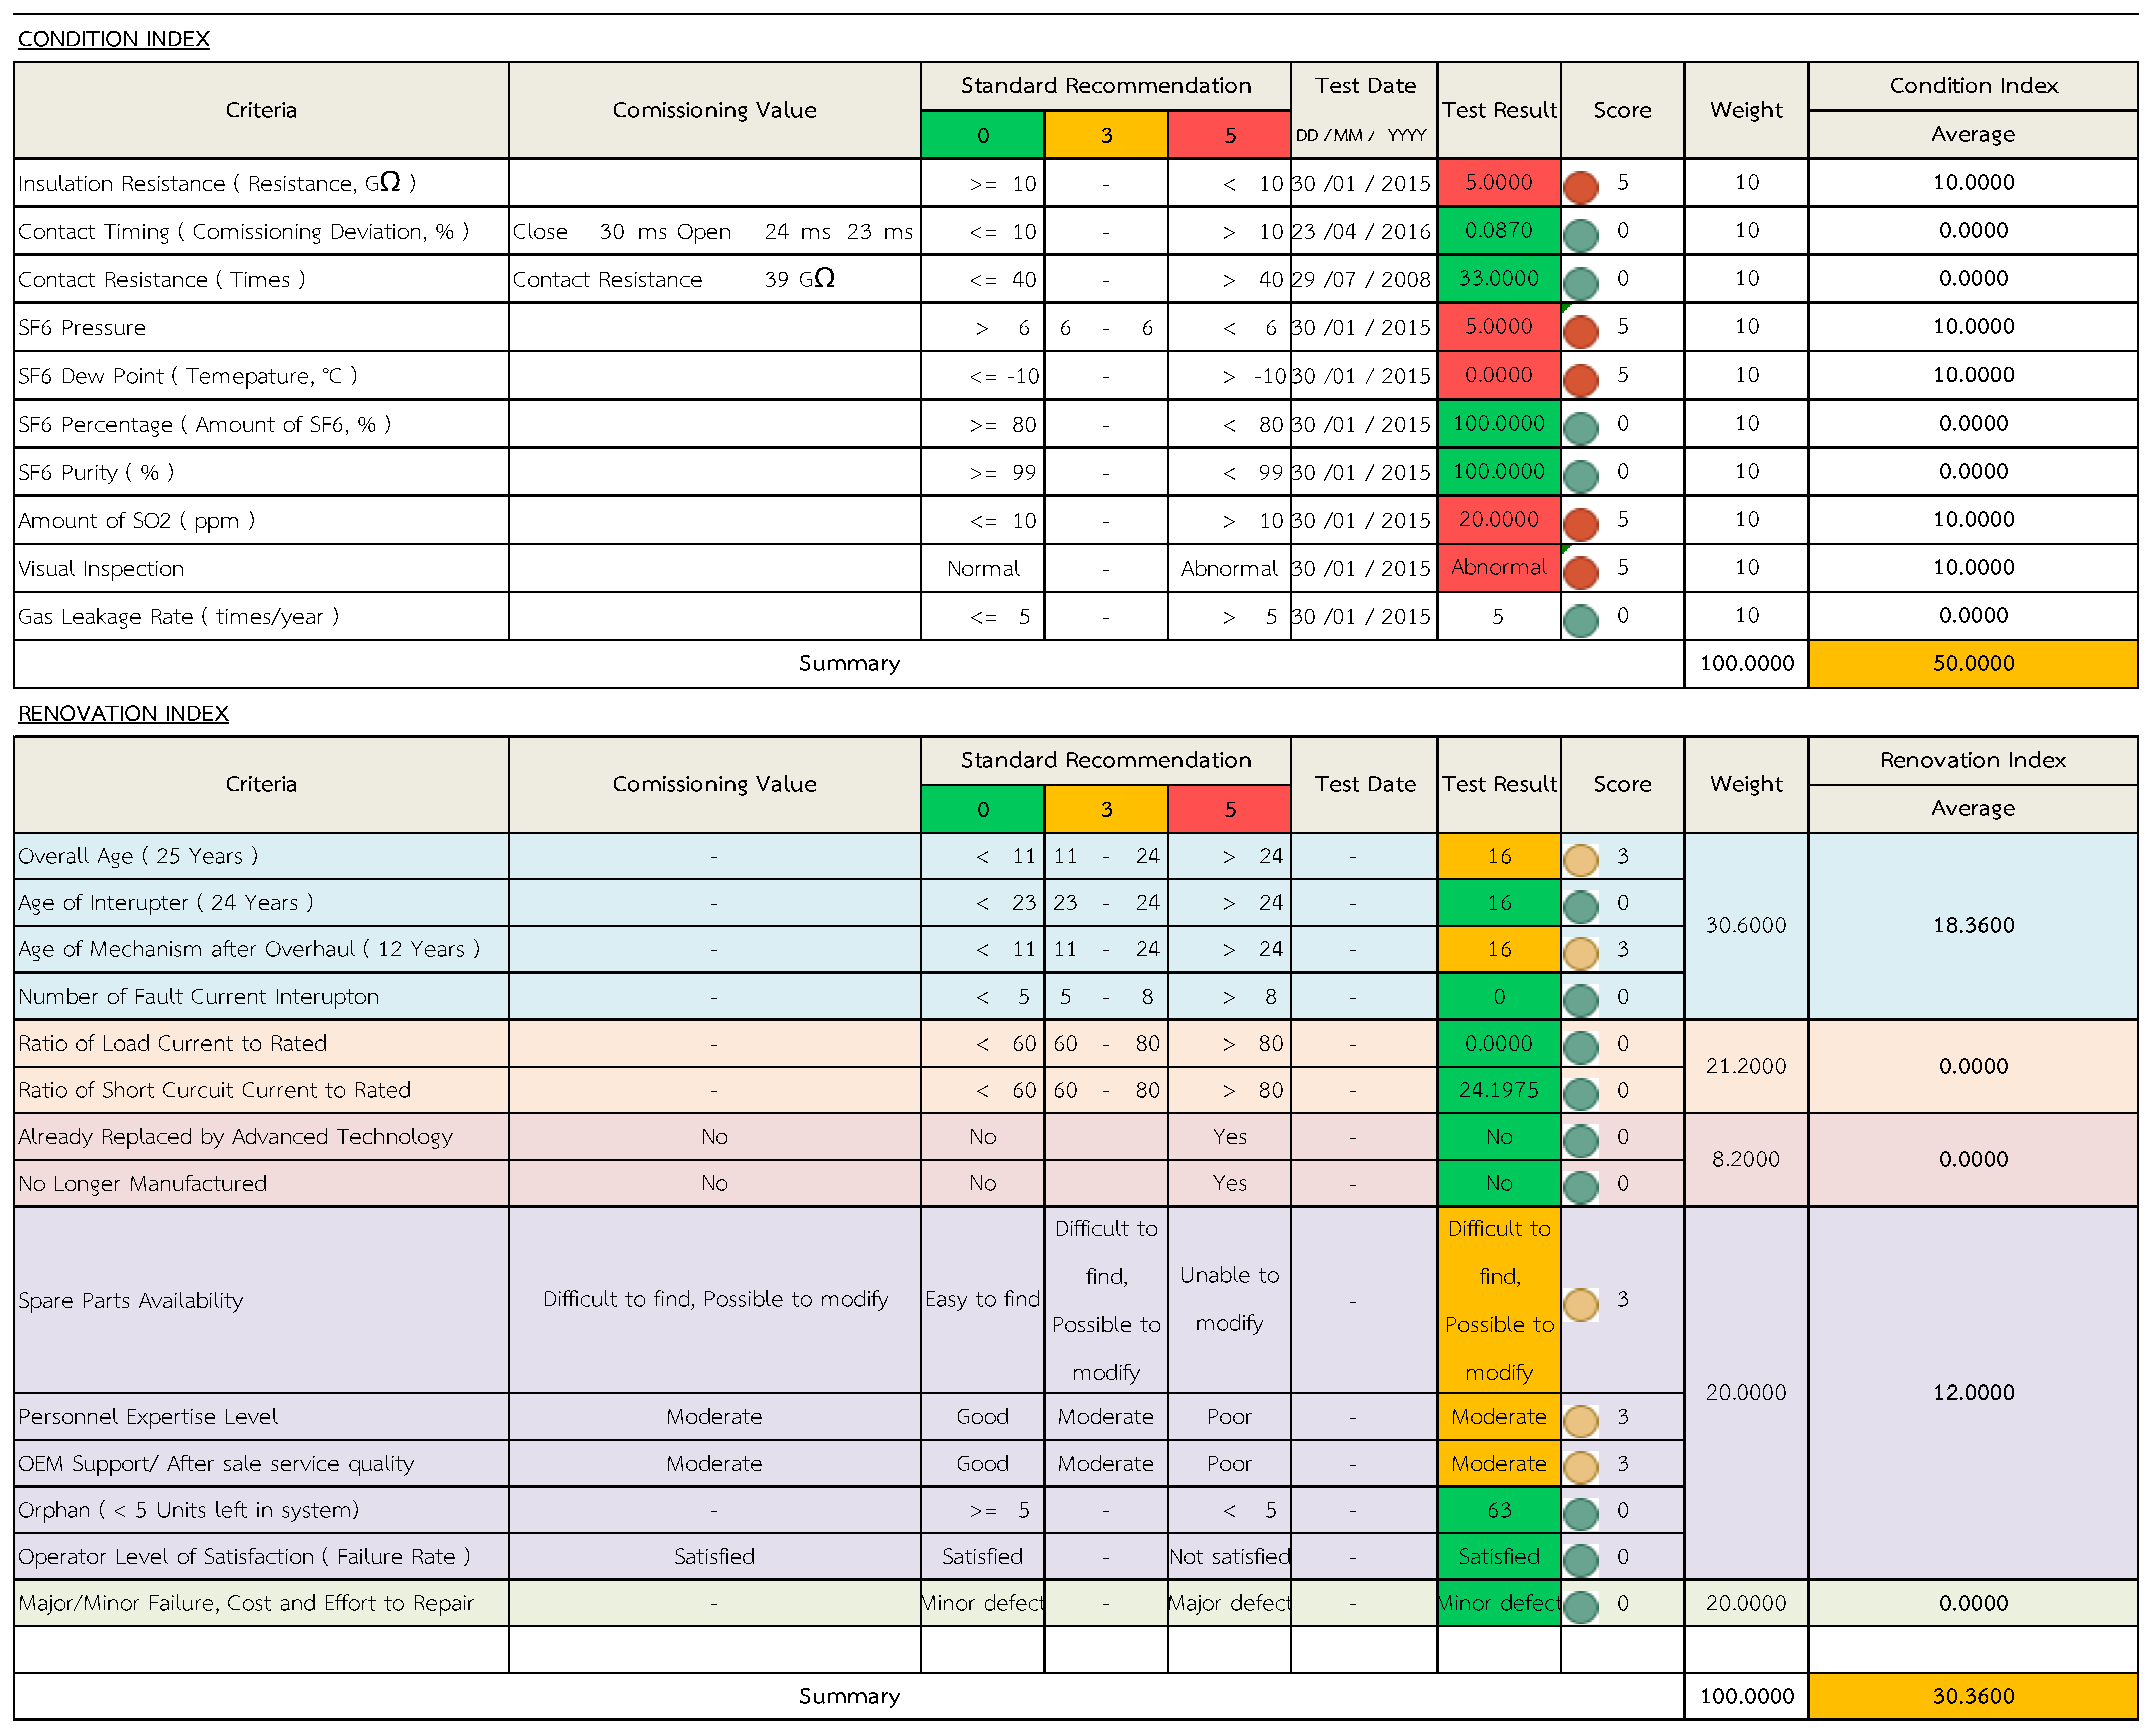
2.1. Condition Index Calculation
2.2. Renovation Index Calculation
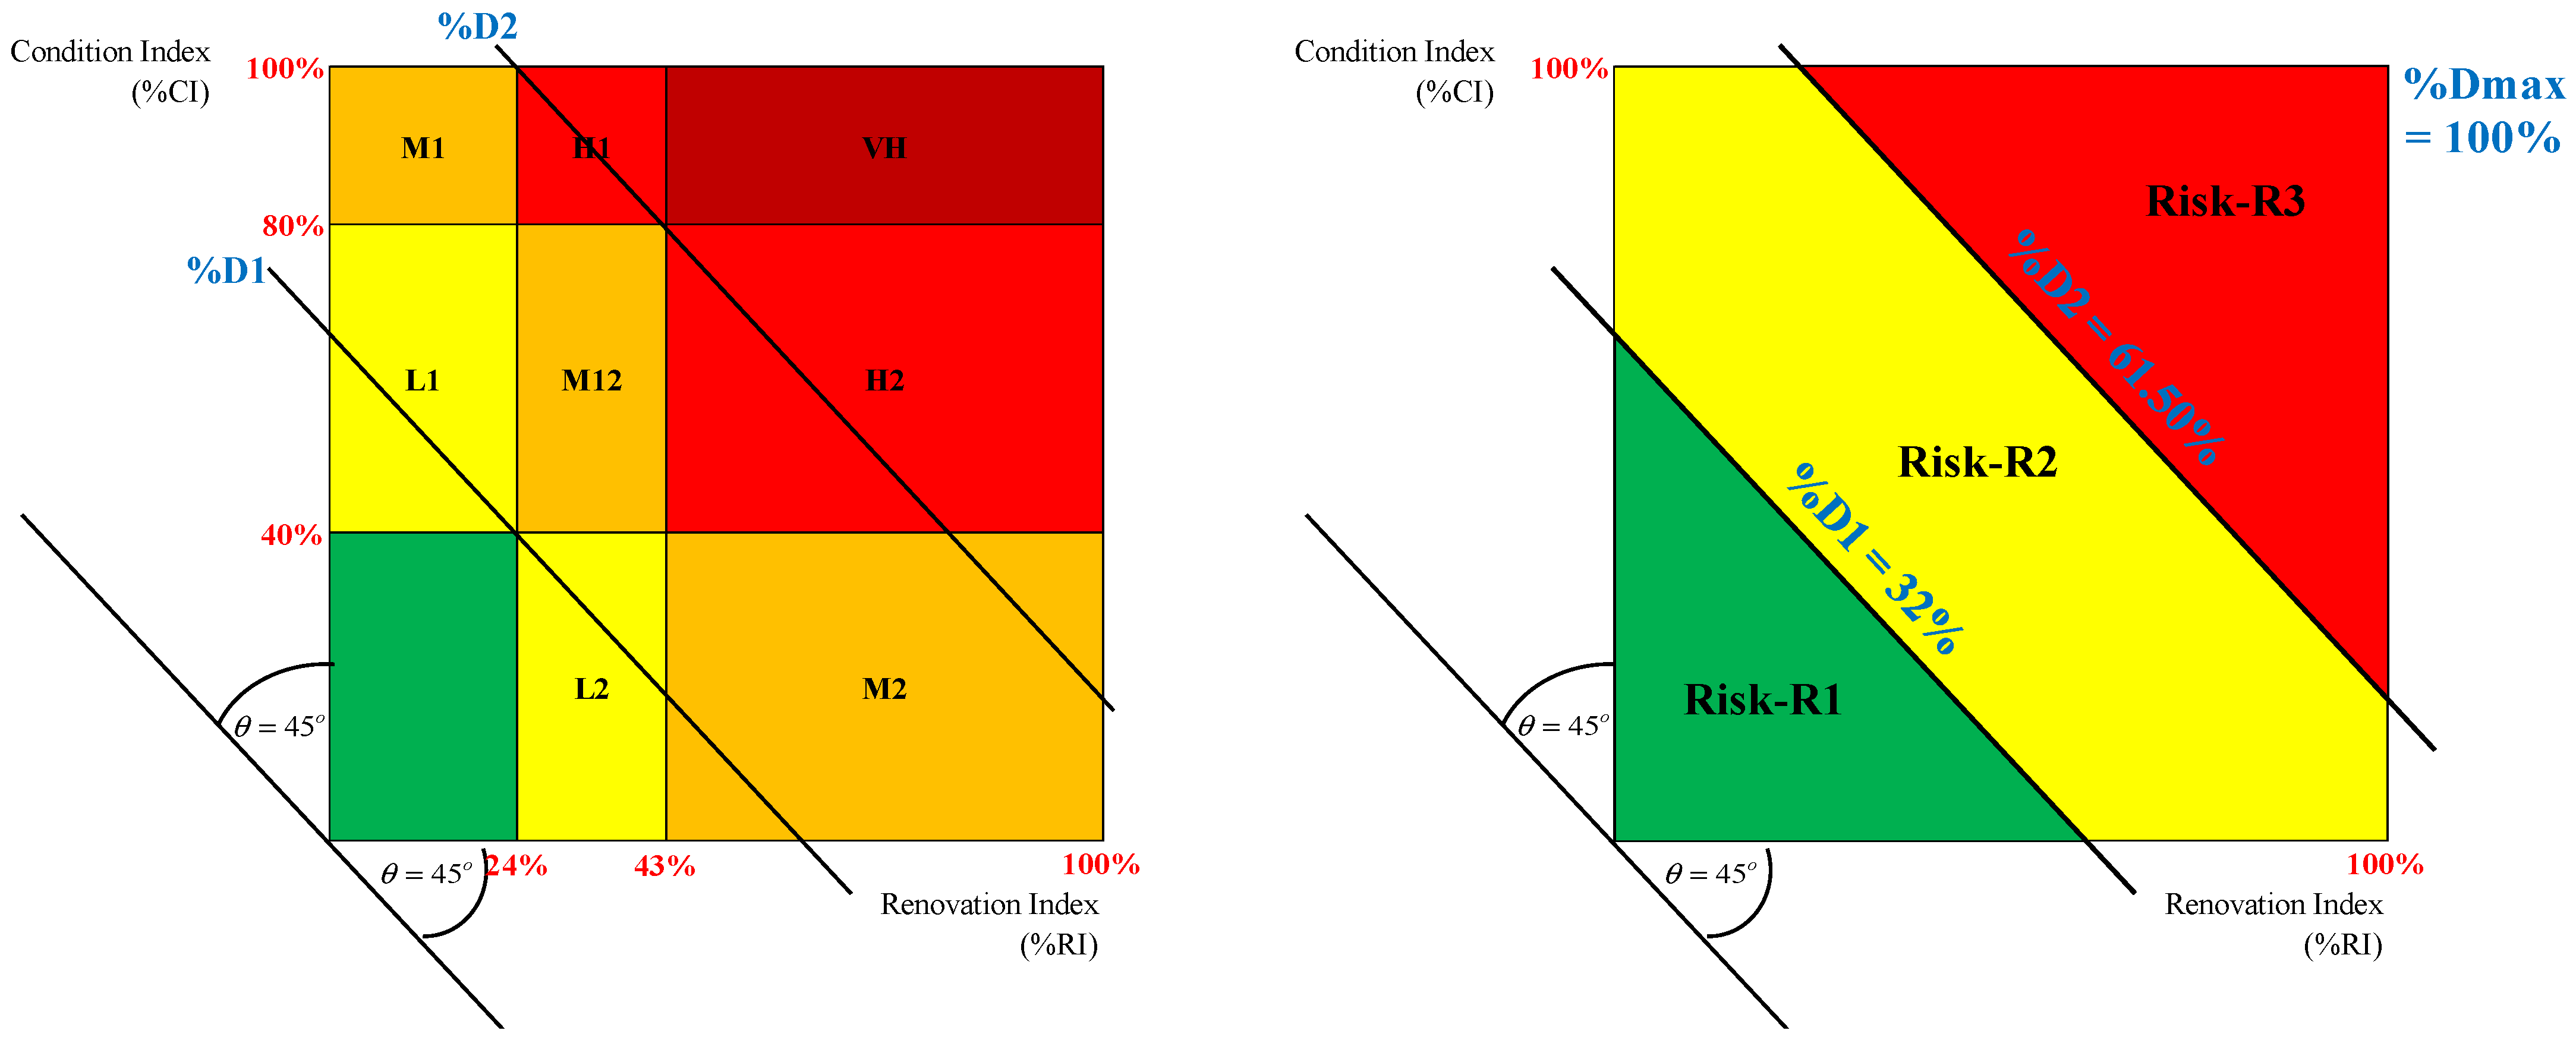
2.3. D-Distance Factor Calculation
2.4. Risk Matrix with Proper Maintenance Action
3. Results and Discussions
4. Conclusions
Author Contributions
Funding
Institutional Review Board Statement
Informed Consent Statement
Data Availability Statement
Conflicts of Interest
References
- Nadew, A.; René, P.; Roy, M. Experimental Investigation of Electrical Stresses on the Main Components of HVDC Circuit Breakers. IEEE Trans. Power Deliv. 2020, 35, 2762–2771. [Google Scholar]
- Behnam, F.; Omer, U. A Novel Arcing Power-Based Algorithm for Condition Monitoring of Electrical Wear of Circuit Breaker Contacts. IEEE Trans. Power Deliv. 2019, 34, 1060–1068. [Google Scholar]
- Yakui, L.; Guogang, Z.; Chenchen, Z.; Sheng, L.; Hao, Q.; Jinggang, Y. Mechanical Condition Identification and Prediction of Spring Operating Mechanism of High Voltage Circuit Breaker. IEEE Access 2020, 8, 210328–210338. [Google Scholar]
- Qiuyu, Y.; Jiangjun, R.; Zhijian, Z.; Daochun, H.; Zhibin, Q. A New Vibration Analysis Approach for Detecting Mechanical Anomalies on Power Circuit Breakers. IEEE Access 2019, 7, 14070–14080. [Google Scholar]
- IEEE Std C37.10-2011; (Revision of IEEE Std C37.10-1995)—Guide for Investigation, Analysis, and Reporting of Power Circuit Breaker Failures. IEEE: Piscataway, NJ, USA, 2011.
- Kiran, R.; Prasanna, P.; Rajesh, K. A Novel Methodology to Incorporate Circuit Breaker Active Failure in Reliability Evaluation of Electrical Distribution Networks. IEEE Trans. Power Syst. 2021, 36, 1013–1022. [Google Scholar]
- Christopher, T.; Carolina, B. Relationship between Historical Trends, Equipment Age, Maintenance, and Circuit Breaker Failure Rates. IEEE Trans. Ind. App. 2019, 55, 5699–5707. [Google Scholar]
- Anton, J.; Dirk, M.; Carl-Ejnar, S. International Surveys on Circuit-Breaker Reliability Data for Substation and System Studies. IEEE Trans. Power Deliv. 2014, 29, 808–814. [Google Scholar]
- Mohammad, A.; Ali, A. Intelligent Failure Diagnosis for Gas Circuit Breakers Based on Dynamic Resistance Measurements. IEEE Trans. Instr. Meas. 2019, 68, 3066–3077. [Google Scholar]
- Ali, R.; Mehdi, V.; Kave, N.; Matti, L. Circuit-Breaker Automated Failure Tracking Based on Coil Current Signature. IEEE Trans. Power Deliv. 2014, 29, 283–290. [Google Scholar]
- Adriano, O.; Edson, G.; Alexandre, J.; Herbet, F.; Tarso, V.; Henrique, N. Radiometric Monitoring Technique for High-Voltage Circuit Breakers. IEEE Trans. Power Deliv. 2019, 34, 1656–1665. [Google Scholar]
- Milad, M.; Kaveh, N.; Amir, S.; Hossein, M. Online Assessment of Contact Erosion in High Voltage Gas Circuit Breakers Based on Different Physical Quantities. IEEE Trans. Power Deliv. 2019, 34, 580–587. [Google Scholar]
- IEEE Std C37; 119-2016 Guide for Breaker Failure Protection of Power Circuit Breakers. IEEE: Piscataway, NJ, USA, 2016.
- Jose, A.; Victoria, C.; Ibrahim, A.; Maria, G. A Model-Based Hybrid Approach for Circuit Breaker Prognostics Encompassing Dynamic Reliability and Uncertainty. IEEE Trans. Syst. M. Cyber. 2018, 48, 1637–1648. [Google Scholar]
- Jun, Z.; Wenyuan, L.; Roy, B.; Juan, Y. Incorporating a Condition Monitoring Based Aging Failure Model of a Circuit Breaker in Substation Reliability Assessment. IEEE Trans. Power Syst. 2015, 30, 3407–3415. [Google Scholar]
- IEEE Std C37; 10.1-2018 Guide for the Selection of Monitoring for Circuit Breakers. IEEE: Piscataway, NJ, USA, 2019.
- Ali, R.; Kaveh, N. Condition Monitoring of High Voltage Circuit Breakers: Past to Future. IEEE Trans. Power Deliv. 2021, 36, 740–750. [Google Scholar]
- Nattapon, P.; Thanapong, S.; Cattareeya, S. Condition Assessment of Gas Insulated Switchgear Using Health Index and Conditional Factor Method. MDPI Energies. 2022, 15, 9393. [Google Scholar]
- Maret, Y.; Zlatanskim, M.; Marinkovic, S.; Hochlehnert, M. Online measurement of the overlapping time for generator circuit breakers (GCBs) in real plant conditions. IEEE Trans. Dielectr. Electr. Insul. 2016, 23, 1355–1363. [Google Scholar] [CrossRef]
- Abhisek, U.; Martin, Z.; Moritz, H. Monitoring of HV Generator Circuit Breaker Contact Ablation Based on Acoustic Emission. IEEE Trans. Instr. Meas. 2013, 62, 2683–2693. [Google Scholar]
- Qiuyu, Y.; Jiangjun, R.; Zhijian, Z.; Daochun, H. Condition Evaluation for Opening Damper of Spring Operated High-Voltage Circuit Breaker Using Vibration Time-Frequency Image. IEEE J. Sens. 2019, 19, 8116–8126. [Google Scholar]
- Maryam, K.; Javad, S.; Pedjman, P. Performance Evaluation of Circuit Breaker Electrical Contact Based on Dynamic Resistance Signature and Using Health Index. IEEE Trans. Comp. Pack. Manuf. Tech. 2016, 6, 1505–1512. [Google Scholar]
- Ali, R.; Mehdi, V.; Kaveh, N.; Matti, L. Data Mining of Online Diagnosed Waveforms for Probabilistic Condition Assessment of SF6 Circuit Breakers. IEEE Trans. Power Deliv. 2015, 30, 1354–1362. [Google Scholar]
- Saugata, B.; Anurag, S.; Dave, W. A Real-Time Data-Driven Algorithm for Health Diagnosis and Prognosis of a Circuit Breaker Trip Assembly. IEEE Trans. Ind. Electron. 2015, 62, 3822–3831. [Google Scholar]
- Ali, R.; Mehdi, V.; Kaveh, N.; Matti, L. Priority Assessment of Online Monitoring Investment for Power System Circuit Breakers—Part II: Determination of Optimum Number. IEEE Trans. Power Deliv. 2013, 28, 1440–1446. [Google Scholar]
- Ali, R.; Mahshad, S. A New Approach on Prioritization of the Circuit Breakers for Installation of Online Monitoring Systems. IEEE Trans. Power Deliv. 2019, 34, 1569–1577. [Google Scholar]
- Jun, Z.; Wenyuan, L.; Caisheng, W.; Juan, Y. A RankBoost-Based Data-Driven Method to Determine Maintenance Priority of Circuit Breakers. IEEE Trans. Power Deliv. 2018, 33, 1044–1053. [Google Scholar]
- Shuguang, S.; Zhitao, W.; Taihang, D.; Jingqin, W.; Yao, T.; Hui, G. Remaining Life Prediction of Conventional Low-Voltage Circuit Breaker Contact System Based on Effective Vibration Signal Segment Detection and MCCAE-LSTM. IEEE J. Sens. 2021, 21, 21862–21871. [Google Scholar]
- Payman, D.; Yufan, G.; Mladen, K. Real-Time Life-Cycle Assessment of High-Voltage Circuit Breakers for Maintenance Using Online Condition Monitoring Data. IEEE Trans. Ind. App. 2019, 55, 1135–1146. [Google Scholar]
- Xiang, Z.; Jiaosuo, Z.; Ernst, G. Reliability Centered Asset Management for Medium-Voltage Deteriorating Electrical Equipment Based on Germany Failure Statistics. IEEE Trans. Power Deliv. 2009, 24, 721–728. [Google Scholar] [CrossRef]
- Tanachai, S.; Thanapong, S.; Cattareeya, S. Lifetime Estimation Based Health Index and Conditional Factor for Underground Cable System. Energies 2021, 14, 8113. [Google Scholar]


| Major Components | Minor Components | Failure Modes | Environments | Situations | Root Causes |
|---|---|---|---|---|---|
| interrupting unit | fix contact/moving contact, terminal plate, arc quenching system | leakage, broken, stiff, loose, rusty, dirty, short circuit, flashover, hot spot, damaged, non-operating, malfunction, properties changed, failed test | rain acid, corrosion from salt water, pollution as smoke from agriculture, animals, lightning | fails during installation, energization, re-energization, operation, maintenance, testing, after service | mistakes during design, construction installation, and operation, careless, lack of maintenance, overloading, deterioration, end of life, animal, surrounding, human error |
| operating mechanism | energy storage, latching linkage, motor, dashpot | ||||
| SF6 gas system | gas density gauge, pressure switch, | ||||
| gas quality, | |||||
| gas tightness | |||||
| external insulation | cleanliness of surface | ||||
| control and auxiliary circuit | closing/tripping circuit, electrical supply/wiring, auxiliary switch, magnetic contactor, heater circuit, counter |
| Test Method | Score (Si) | Weight (Wi) | ||
|---|---|---|---|---|
| 0 | 3 | 5 | ||
| insulation resistance (GΩ) | ≥10 | - | <10 | 10% |
| contact resistance (µΩ) | ≤40 | - | >40 | 10% |
| contact timing (%deviation) | ≤10 | - | >10 | 10% |
| SF6 pressure (bar) | >6 | 6–5.5 | <5.5 | 10% |
| SF6 dew point (°C) | ≤−10 | >−10 | 10% | |
| SF6 percentage (%) | ≥80 | - | <80 | 10% |
| SF6 purity (%) | ≥99 | - | <99 | 10% |
| amount of SO2 (ppm) | ≤10 | - | >10 | 10% |
| gas leakage rate (frequency per year) | ≤5 | - | >5 | 10% |
| undamaged, clean, fastening, counter, operating, thermos-scan, function, drive mechanism lubrication, rusty, construction, annunciator operation, interlocking system, hi-pot test, vacuum test, spout test check | normal | - | abnormal | 10% |
| Condition Assessment | Good | Acceptable | Poor |
|---|---|---|---|
| %CI | <40 | 40–80 | >80 |
| Criteria | Sub-Criteria | Scoring (Sj) | Weight (Wj) | ||
|---|---|---|---|---|---|
| 0 | 3 | 5 | |||
| age and no. of interruptions | overall age (25 years) | <11 | 11–24 | >24 | 7.675 |
| age of interrupter (24 years) | <23 | 23–24 | >24 | 7.675 | |
| age of mechanism after overhaul (12 years) | <11 | 11–24 | >24 | 7.675 | |
| number of fault current interruptions (times) | <5 | 5–8 | >8 | 7.675 | |
| inadequate rating | ratio of load current to rated current | <60 | 60–80 | >80 | 10.6 |
| ratio of short circuit current to rated S/C current | <60 | 60–80 | >80 | 10.6 | |
| technology obsolescence | already replaced by advanced technology | no | - | yes | 4.1 |
| no longer manufactured | no | - | yes | 4.1 | |
| maintain ability | spare parts availability | easy to find | difficult to find, possible to modify | unable to modify | 5.0 |
| personnel expertise level | good | moderate | poor | 5.0 | |
| OEM support/ after sale service quality | good | moderate | poor | 5.0 | |
| orphan (amount of installed unit left in system) | ≥5 | - | <5 | 5.0 | |
| operator level of satisfaction (model’s failure rate) | satisfied | - | not satisfied | 5.0 | |
| symptom | major/ minor failure, cost, and effort to repair | minor defect | - | major defect | 20.0 |
| Renovation Assessment | Long-Term | Medium-Term | Urgent |
|---|---|---|---|
| %RI | <24 | 24–43 | >43 |
| Zone | Definition | Maintenance Strategy |
|---|---|---|
| VL | very low | time based maintenance, monthly visual inspection, annually full test |
| L1 | low1 | refurbishment on minor defect, eliminate/ restrict root cause |
| L2 | low2 | renovation/modifying some sub-components |
| M1 | moderate1 | corrective maintenance within 15 days |
| M2 | moderate2 | load management, upgrade plan |
| M12 | moderate12 | determine the most benefit alternative whether to repair or relocation |
| H1 | high1 | de-energizing, corrective maintenance within 7 days |
| H2 | high2 | relocation planning |
| VH | very high | de-energizing, replacement |
| %D Factor | Normal | Moderate | Urgent |
|---|---|---|---|
| %D (%) | <32.00 | 32.00–61.50 | >61.50 |
| maintenance task | normal maintenance | preventive maintenance should be planned | high priority needs executing within 7 days to prevent the failure of equipment |
| Items | Raw Data | Si | %Wi | Si × %Wi | %CI | |
|---|---|---|---|---|---|---|
| Group of Test Results | 50.00% | |||||
| 1 | insulation resistance | 5 GΩ | 5 | 10 | 5 × 10 | |
| 2 | contact resistance | 34 μΩ | 0 | 10 | 0 × 10 | |
| 3 | contact timing deviation | 6.96% | 0 | 10 | 0 × 10 | |
| 4 | SF6 pressure | 5.20 barg. | 5 | 10 | 5 × 10 | |
| 5 | SF6 dewpoint | 0 C | 5 | 10 | 5 × 10 | |
| 6 | SF6 percentage | 100% | 0 | 10 | 0 × 10 | |
| 7 | SF6 purity | 100% | 0 | 10 | 0 × 10 | |
| 8 | amount of SO2 | 20% ppm | 5 | 10 | 5 × 10 | |
| 9 | gas leakage rate | 5 time/yr | 0 | 10 | 0 × 10 | |
| Visual Inspection | ||||||
| a | undamaged | Normal | 0 | Si, worst × %Wi = 5 × 10 | ||
| b | cleansing | Normal | 0 | |||
| c | connector fastening | Normal | 0 | |||
| d | thermo scan check | Normal | 0 | |||
| e | counter | Abnormal | 5 | 10 | ||
| f | functional operating | Normal | 0 | |||
| g | mechanism operating | Normal | 0 | |||
| h | drive mech. lubricant | Normal | 0 | |||
| i | rusty condition | Normal | 0 | |||
| j | foundation condition | Normal | 0 | |||
| k | annunciator operation | Normal | 0 | |||
| l | interlocking system | Normal | 0 | |||
| m | hi-pot test | Normal | 0 | |||
| n | vacuum test | Normal | 0 | |||
| o | spout test check | Normal | 0 | |||
| Raw Data | %Wi | %Si | %Si, Worst | %Wi × %Si, Worst | %RI | ||
|---|---|---|---|---|---|---|---|
| 1 | overall age | 17 yr. | 30.6 | 3 | 3 | 18.36% | 30.36% |
| 2 | age of interrupter | 17 yr. | 0 | ||||
| 3 | age of mechanism after overhaul | 17 yr. | 3 | ||||
| 4 | no. of fault interruptions | 5 time | 3 | ||||
| 5 | load to rated current ratio | 0% | 21.2 | 0 | 0 | 0.00% | |
| 6 | Short circuit current to rated current ratio | 24.20% | 0 | ||||
| 7 | already replaced by advanced technology | no | 8.2 | 0 | 0 | 0.00% | |
| 8 | no longer manufactured | no | 0 | ||||
| 9 | spare part availability | difficult to find | 20.0 | 3 | 3 | 12.00% | |
| 10 | man, expertise level | moderate | 3 | ||||
| 11 | OEM/after sale quality | moderate | 3 | ||||
| 12 | orphan (installed unit) | 63 | 0 | ||||
| 13 | model’s failure rate | satisfied | 20.0 | 0 | 0 | 0.00% | |
| Index | %CI | %RI | sinθ1 | Sinθ2 | %CImax | %RImax | %D |
|---|---|---|---|---|---|---|---|
| calculated value | 50% | 30.36% | 0.707 | 0.707 | 100% | 100% | 40.18% |
| No | Details | Unit | 1 | 2 | 3 | 4 | 5 | 6 | 7 | 8 | 9 | 10 | 11 | 12 | 13 | 14 | 15 | 16 | 17 | 18 | 19 | 20 |
|---|---|---|---|---|---|---|---|---|---|---|---|---|---|---|---|---|---|---|---|---|---|---|
| General Information | ||||||||||||||||||||||
| 1 | energized date | 1/1/14 | 23/5/04 | 1/1/09 | 11/13/97 | 27/3/94 | 27/3/94 | 19/6/98 | 19/6/98 | 1/5/87 | 1/5/87 | 3/9/97 | 3/9/97 | 26/12/01 | 6/10/94 | 6/10/94 | 4/11/05 | 4/11/98 | 1/5/97 | 1/5/97 | 26/10/93 | |
| 2 | age | yrs. | 8 | 17 | 13 | 24 | 27 | 27 | 23 | 23 | 34 | 34 | 24 | 24 | 20 | 27 | 27 | 16 | 23 | 24 | 24 | 28 |
| 3 | manufacturing year | 2014 | 2002 | 2009 | 1996 | 1999 | 1993 | 2004 | 2004 | 1982 | 1982 | 1995 | 1995 | 1997 | 2000 | 1993 | 2005 | 1997 | 1994 | 1994 | 1990 | |
| 4 | rated kV | kV | 145 | 145 | 145 | 145 | 123 | 145 | 145 | 145 | 121 | 121 | 145 | 145 | 123 | 145 | 123 | 145 | 145 | 145 | 145 | 145 |
| 5 | system kV | kV | 115 | 115 | 115 | 115 | 115 | 115 | 115 | 115 | 115 | 115 | 115 | 115 | 115 | 115 | 115 | 115 | 115 | 115 | 115 | 115 |
| 6 | BIL | kV | 650 | 650 | 650 + 70 | 650 | 550 | 650 | 650 | 650 | 550 | 550 | 650 | 650 | 550 | 650 | 550 | 650 | 650 | 650 | 650 | 650 |
| 7 | power freq. voltage | kV | 275 | 275 | 275 + 70 | 230 | 230 | 275 | 275 | 275 | - | - | 275 | 275 | 230 | 275 | 230 | 275 | 275 | 275 | 275 | 275 |
| 8 | Irated | A | 3150 | 2500 | 3150 | 3150 | 2000 | 3150 | 3150 | 3150 | 2000 | 2000 | 3150 | 3150 | 2000 | 3150 | 2000 | 3150 | 3150 | 3150 | 3150 | 2000 |
| 9 | kA rated interrupt | kA | 40 | 40 | 40 | 31.50 | 31.50 | 40 | 40 | 40 | 31.50 | 31.50 | 31.50 | 31.50 | 40 | 31.50 | 40 | 40 | 31.50 | 40 | 40 | 31.50 |
| 10 | S/C withstand duration | s | 4 | 3 | 1 | 3 | 3 | 3 | 3 | 3 | 3 | 3 | 3 | 3 | 3 | 3 | 1 | 3 | 3 | 3 | 3 | 3 |
| 11 | rated freq. | Hz | 50 | 50 | 50 | 50 | 50 | 50 | 50 | 50 | 50 | 50 | 50 | 50 | 50 | 50 | 50 | 50 | 50 | 50 | 50 | 50 |
| 12 | no. of faults interruption | time | 0 | 5 | 4 | 3 | 0 | 0 | 0 | 0 | 0 | 0 | 3 | 5 | 3 | 6 | 7 | 3 | 5 | 5 | 6 | 5 |
| 13 | defect level | minor defect | ||||||||||||||||||||
| Test Results | ||||||||||||||||||||||
| 1 | insulation resistance | GΩ | 5 | 5 | 3.84 | 7.25 | 5.40 | 5 | 6.80 | 7.80 | 6.20 | 6.15 | 6.98 | 6.88 | 4.99 | 8.80 | 5.31 | 5 | 7.55 | 7.41 | 7.66 | 4.89 |
| 2 | contact resistance | μΩ | 34 | 32.67 | 33.22 | 33.34 | 23.40 | 34.15 | 33.38 | 33.41 | 35.40 | 35.30 | 33.28 | 33.50 | 32.87 | 33.80 | 24.10 | 31.88 | 33.45 | 33.53 | 33.66 | 34.22 |
| 3 | contact timing deviation | % | 2.33 | 6.96 | 3.25 | 0.00 | 16.35 | 6.79 | 3.16 | 6.57 | 1.37 | 2.21 | 3.19 | 3.95 | 10.38 | 5.30 | 1.62 | 5.41 | 4.24 | 8.30 | 8.89 | 8.38 |
| 4 | SF6 pressure | barg. | 5.20 | 5.14 | 5.50 | 6.80 | 6.02 | 5.25 | 6.73 | 6.68 | 5.67 | 5.67 | 6.80 | 6.75 | 5.04 | 6.83 | 6.47 | 6.48 | 6.63 | 6.80 | 6.77 | 5.10 |
| 5 | SF6 dewpoint | C | 0 | 0 | −21.40 | −21.40 | −18.80 | −21.40 | −43.90 | −48 | −16.70 | −15.60 | −42 | −46 | −19.20 | −47 | −20.10 | −18.10 | −45 | −41 | −52.20 | −18.30 |
| 6 | SF6 percentage | % | 100% | 100% | 99.10% | 99.10% | 99% | 99% | 99.20% | 99% | 99.20% | 99% | 99.10% | 99.20% | 99% | 99% | 99.10% | 99.20% | 99.20% | 99.10% | 99% | 99% |
| 7 | SF6 purity | % | 100% | 100% | 99.20% | 99.10% | 99.30% | 99% | 99.10% | 99.10% | 99.10% | 99.20% | 99.20% | 99.20% | 99.10% | 99.10% | 99.10% | 99% | 99% | 99% | 99.10% | 99.10% |
| 8 | amount of SO2 | ppm | 20% | 20% | 19.50% | 19.90% | 19.80% | 19.80% | 19.80% | 20.30% | 20.10% | 20.50% | 20.50% | 20.70% | 19.90% | 19.80% | 19.90% | 20.10% | 20% | 20% | 20.30% | 20% |
| 9 | gas leakage rate | time/yr | 0 | 5 | 4 | 3 | 0 | 0 | 0 | 0 | 0 | 0 | 3 | 5 | 3 | 6 | 7 | 3 | 5 | 5 | 6 | 5 |
| Operation Information | ||||||||||||||||||||||
| 1 | overall age | yr. | 8 | 17 | 13 | 24 | 27 | 27 | 23 | 23 | 34 | 34 | 24 | 24 | 20 | 27 | 27 | 16 | 23 | 24 | 24 | 28 |
| 2 | age of interrupter | yr. | 8 | 17 | 13 | 24 | 27 | 27 | 23 | 23 | 34 | 34 | 24 | 24 | 20 | 27 | 27 | 16 | 23 | 24 | 24 | 28 |
| 3 | age of mechanism after overhaul | yr. | 8 | 17 | 13 | 24 | 27 | 27 | 23 | 23 | 34 | 34 | 24 | 24 | 20 | 27 | 27 | 16 | 23 | 24 | 24 | 28 |
| 4 | no. of fault interruption | time | 0 | 5 | 4 | 3 | 0 | 0 | 0 | 0 | 0 | 0 | 3 | 5 | 3 | 6 | 7 | 3 | 5 | 5 | 6 | 5 |
| 5 | load to rated current ratio | % | 5.45% | 0% | 15.35% | 0% | 27.57% | 0% | 20.55% | 20.55% | 37.87% | 0% | 7.64% | 0% | 0% | 13.07% | 0% | 44.23% | 0% | 53.37% | 0% | 0% |
| 6 | SC to rated current ratio | % | 24.20% | 24.20% | 15.18% | 19.27% | 93.08% | 73.30% | 60.42% | 60.42% | 25.10% | 25.10% | 13.61% | 30.73% | 22.18% | 91.88% | 72.36% | 38.51% | 48.90% | 21.83% | 21.83% | 23.35% |
| 7 | already replaced by advanced technology | no | no | no | yes | no | no | no | no | yes | yes | yes | yes | yes | no | yes | no | yes | yes | yes | yes | |
| 8 | no longer manufactured | no | no | no | yes | no | no | no | no | yes | yes | yes | yes | yes | no | yes | no | yes | yes | yes | yes | |
| 9 | spare part availability | difficult to find | easy to find | difficult to find | easy to find | unable to modify | easy to find | unable to modify | easy to find | unable to modify | easy to find | unable to modify | ||||||||||
| 10 | man expertise level | moderate | poor | moderate | good | moderate | good | poor | poor | moderate | ||||||||||||
| 11 | OEM/after sale quality | moderate | good | moderate | good | moderate | ||||||||||||||||
| 12 | orphan (installed unit) | unit | 63 | 63 | 12 | 49 | 4 | 5 | 49 | 49 | 3 | 3 | 49 | 49 | 7 | 49 | 20 | 16 | 49 | 49 | 49 | 3 |
| 13 | model’s failure rate | satisfied | ||||||||||||||||||||
| No. | DetailsVisual Inspection | Unit | |||||||||||||||||||
|---|---|---|---|---|---|---|---|---|---|---|---|---|---|---|---|---|---|---|---|---|---|
| 1 | 2 | 3 | 4 | 5 | 6 | 7 | 8 | 9 | 10 | 11 | 12 | 13 | 14 | 15 | 16 | 17 | 18 | 19 | 20 | ||
| a | undamaged | Normal | |||||||||||||||||||
| b | cleansing | Normal | |||||||||||||||||||
| c | connector fastening | Normal | |||||||||||||||||||
| d | thermo scan check | Normal | |||||||||||||||||||
| e | counter | Normal | Abnormal | Normal | Abnormal | ||||||||||||||||
| f | functional operating | Normal | |||||||||||||||||||
| g | mechanism operating | Normal | |||||||||||||||||||
| h | drive mech. lubricant | Normal | |||||||||||||||||||
| i | rusty condition | Normal | |||||||||||||||||||
| j | foundation condition | Normal | |||||||||||||||||||
| k | annunciator operation | Normal | |||||||||||||||||||
| l | interlocking system | Normal | |||||||||||||||||||
| m | hi-pot test | Normal | |||||||||||||||||||
| n | vacuum test | Normal | |||||||||||||||||||
| o | spout test check | Normal | |||||||||||||||||||
| No. | Detail | 1 | 2 | 3 | 4 | 5 | 6 | 7 | 8 | 9 | 10 | 11 | 12 | 13 | 14 | 15 | 16 | 17 | 18 | 19 | 20 |
|---|---|---|---|---|---|---|---|---|---|---|---|---|---|---|---|---|---|---|---|---|---|
| Test Result | Score | ||||||||||||||||||||
| 1 | insulation resistance | 5 | 5 | 5 | 5 | 5 | 5 | 5 | 5 | 5 | 5 | 5 | 5 | 5 | 5 | 5 | 5 | 5 | 5 | 5 | 5 |
| 2 | contact resistance | 0 | 0 | 0 | 0 | 0 | 0 | 0 | 0 | 0 | 0 | 0 | 0 | 0 | 0 | 0 | 0 | 0 | 0 | 0 | 0 |
| 3 | contact timing | 0 | 0 | 0 | 0 | 5 | 0 | 0 | 0 | 0 | 0 | 0 | 0 | 5 | 0 | 0 | 0 | 0 | 0 | 0 | 0 |
| 4 | SF6 pressure | 5 | 5 | 5 | 0 | 0 | 5 | 0 | 0 | 5 | 5 | 0 | 0 | 5 | 0 | 0 | 0 | 0 | 0 | 0 | 5 |
| 5 | SF6 dewpoint | 5 | 5 | 0 | 0 | 0 | 0 | 0 | 0 | 0 | 0 | 0 | 0 | 0 | 0 | 0 | 0 | 0 | 0 | 0 | 0 |
| 6 | SF6 percentage | 0 | 0 | 0 | 0 | 0 | 0 | 0 | 0 | 0 | 0 | 0 | 0 | 0 | 0 | 0 | 0 | 0 | 0 | 0 | 0 |
| 7 | SF6 purity | 0 | 0 | 0 | 0 | 0 | 0 | 0 | 0 | 0 | 0 | 0 | 0 | 0 | 0 | 0 | 0 | 0 | 0 | 0 | 0 |
| 8 | amount of SO2 | 5 | 5 | 5 | 5 | 5 | 5 | 5 | 5 | 5 | 5 | 5 | 5 | 5 | 5 | 5 | 5 | 5 | 5 | 5 | 5 |
| 9 | gas leakage rate | 0 | 0 | 0 | 0 | 0 | 0 | 0 | 0 | 0 | 0 | 0 | 0 | 0 | 5 | 5 | 0 | 0 | 0 | 5 | 0 |
| 10 | visual inspection | 0 | 5 | 5 | 5 | 0 | 0 | 0 | 0 | 0 | 0 | 5 | 5 | 5 | 5 | 5 | 5 | 5 | 5 | 5 | 5 |
| Condition Index (%CI) | 40.00% | 50.00% | 40.00% | 30.00% | 30.00% | 30.00% | 20.00% | 20.00% | 30.00% | 30.00% | 30.00% | 30.00% | 50.00% | 40.00% | 40.00% | 30.00% | 30.00% | 30.00% | 40.00% | 40.00% | |
| Operation Information | |||||||||||||||||||||
| 1 | overall age | 0 | 3 | 3 | 3 | 5 | 5 | 3 | 3 | 5 | 5 | 3 | 3 | 3 | 5 | 5 | 3 | 3 | 3 | 3 | 5 |
| 2 | age of interrupter | 0 | 0 | 0 | 3 | 5 | 5 | 3 | 3 | 5 | 5 | 3 | 3 | 0 | 5 | 5 | 0 | 3 | 3 | 3 | 5 |
| 3 | age of mechanism after overhaul | 0 | 3 | 3 | 3 | 5 | 5 | 3 | 3 | 5 | 5 | 3 | 3 | 3 | 5 | 5 | 3 | 3 | 3 | 3 | 5 |
| 4 | no. of fault interruption | 0 | 3 | 0 | 0 | 0 | 0 | 0 | 0 | 0 | 0 | 0 | 3 | 0 | 3 | 3 | 0 | 3 | 3 | 3 | 3 |
| 5 | load to rated current ratio | 0 | 0 | 0 | 0 | 0 | 0 | 0 | 0 | 0 | 0 | 0 | 0 | 0 | 0 | 0 | 0 | 0 | 0 | 0 | 0 |
| 6 | SC to rated current ratio | 0 | 0 | 0 | 0 | 5 | 5 | 5 | 5 | 0 | 0 | 0 | 3 | 0 | 5 | 5 | 3 | 3 | 0 | 0 | 0 |
| 7 | already replaced by advanced tech. | 0 | 0 | 0 | 5 | 5 | 0 | 0 | 0 | 5 | 5 | 5 | 5 | 5 | 0 | 5 | 0 | 5 | 5 | 5 | 5 |
| 8 | no longer manufactured | 0 | 0 | 0 | 5 | 5 | 0 | 0 | 0 | 5 | 5 | 5 | 5 | 5 | 0 | 5 | 0 | 5 | 5 | 5 | 5 |
| 9 | spare part availability | 3 | 3 | 3 | 5 | 5 | 3 | 5 | 5 | 5 | 5 | 5 | 5 | 5 | 5 | 5 | 5 | 5 | 5 | 5 | 5 |
| 10 | man expertise level | 3 | 3 | 3 | 3 | 5 | 3 | 0 | 0 | 3 | 3 | 3 | 3 | 3 | 0 | 5 | 5 | 3 | 3 | 3 | 3 |
| 11 | OEM/after sale quality | 3 | 3 | 3 | 3 | 3 | 3 | 0 | 0 | 3 | 3 | 3 | 3 | 3 | 0 | 3 | 3 | 3 | 3 | 3 | 3 |
| 12 | orphan (installed unit) | 0 | 0 | 0 | 0 | 5 | 0 | 0 | 0 | 5 | 5 | 0 | 0 | 0 | 0 | 0 | 0 | 0 | 0 | 0 | 5 |
| 13 | model’s failure rate | 0 | 0 | 0 | 0 | 5 | 5 | 0 | 0 | 5 | 5 | 0 | 0 | 0 | 5 | 5 | 0 | 0 | 0 | 0 | 5 |
| Renovation Index (%RI) | 12.00% | 30.36% | 30.36% | 46.56% | 100.00% | 83.80% | 59.56% | 59.56% | 78.80% | 78.80% | 46.56% | 59.28% | 46.56% | 91.80% | 100.00% | 51.08% | 59.28% | 46.56% | 46.56% | 78.80% | |
| %D | 26.00 | 40.18 | 35.18 | 38.28 | 65.00 | 56.90 | 39.78 | 39.78 | 54.40 | 54.40 | 38.28 | 44.64 | 48.28 | 65.90 | 70.00 | 40.54 | 44.64 | 38.28 | 43.28 | 59.40 | |
Disclaimer/Publisher’s Note: The statements, opinions and data contained in all publications are solely those of the individual author(s) and contributor(s) and not of MDPI and/or the editor(s). MDPI and/or the editor(s) disclaim responsibility for any injury to people or property resulting from any ideas, methods, instructions or products referred to in the content. |
© 2023 by the authors. Licensee MDPI, Basel, Switzerland. This article is an open access article distributed under the terms and conditions of the Creative Commons Attribution (CC BY) license (https://creativecommons.org/licenses/by/4.0/).
Share and Cite
Kumpalavalee, S.; Suwanasri, T.; Suwanasri, C.; Phadungthin, R. D-Distance Technique to Determine Failure Probability of Power Circuit Breaker. Energies 2023, 16, 847. https://doi.org/10.3390/en16020847
Kumpalavalee S, Suwanasri T, Suwanasri C, Phadungthin R. D-Distance Technique to Determine Failure Probability of Power Circuit Breaker. Energies. 2023; 16(2):847. https://doi.org/10.3390/en16020847
Chicago/Turabian StyleKumpalavalee, Suphon, Thanapong Suwanasri, Cattareeya Suwanasri, and Rattanakorn Phadungthin. 2023. "D-Distance Technique to Determine Failure Probability of Power Circuit Breaker" Energies 16, no. 2: 847. https://doi.org/10.3390/en16020847
APA StyleKumpalavalee, S., Suwanasri, T., Suwanasri, C., & Phadungthin, R. (2023). D-Distance Technique to Determine Failure Probability of Power Circuit Breaker. Energies, 16(2), 847. https://doi.org/10.3390/en16020847