Abstract
Direct study of CO2 capture efficiency during microalgae Arthrospira platensis cultivation at high CO2 concentrations was carried out. Microalgae were grown in a 90 L photobioreactor on Zarrouk’s medium prepared with distilled water. Three 15-day experiments were carried out with different initial CO2 concentrations: 1, 5, and 9 vol.%. During the experiments, both the change in the optical density of the microalgae suspension and the direct change in the CO2 concentration in the chamber were measured. The maximum decrease in CO2 concentration due to the growth of microalgae was 0.10 vol.% (CO2)/day in the experiment with an initial CO2 concentration of 5 vol.%. Growth rate of biomass density was 79.4, 76.3, and 48.4 (mg/L)/day at 1, 5, and 9 vol.% CO2 concentrations, respectively. During the experiment with initial CO2 concentrations of 1 and 5 vol.%., pH of the culture medium was increased, but pH was decreased from 9.2 to 8.8 at 9 vol.%. In general, good viability (high quality of biomass and high rate of its growth) of Arthrospira platensis was established at 1 and 5 vol. (CO2)%, while massive death of Arthrospira platensis cells was observed in the experiment with 9 vol. (CO2)%. Biochemical analysis of the resulting biomass revealed a decrease in the content of lipids and proteins with an increase in CO2 concentration.
1. Introduction
One of the problems of the modern world is climate change, which is associated, among other things, with greenhouse gas emissions into the atmosphere. As a solution to this problem, carbon dioxide capture and storage technologies are used. One CO2 storage method is the injection of CO2 into the ground (injection into wells). Although this technology has been used for several decades, this method of CO2 utilization is costly and requires additional resources.
In recent years, approaches based on the use of microalgae and cyanobacteria have been studied to reduce carbon dioxide emissions [1,2]. The biological reduction of CO2 emissions using fast-growing microalgae species is attracting particular attention as an alternative that can be competitive, both economically and environmentally. The tolerance of microalgae to various concentrations of carbon dioxide, as well as a comparison of the characteristics of the biomass obtained in experiments for its further use as a biofuel are extensively studied [3]. The choice of microalgae (MA) species and strains potentially suitable for CO2 and flue gases (FGs) absorption is the main task in most studies. In this case, the capture of CO2 by microalgae either from gas–air mixtures or from flue gases, where its concentration is 10–20%, is considered. Also, great importance is attached to the choice of cultivation methods and adaptation of microalgae cultures to high concentrations of CO2/FGs. Adaptation of microalgae involves the selection of physical (optimum temperature, illumination, speed and composition of the gas flow), biological (selection of microorganism strains) and chemical (nutrient medium composition) conditions and long-term cultivation of MA under gradual increase in CO2 concentration. The adaptation degree is estimated by the microalgae biomass growth rate, the state of the culture, the intensity of nutrients absorption, etc. Obviously, the higher the productivity (growth rate) of the MA biomass, the higher the CO2 uptake; therefore, it is the biomass productivity that can be considered as one of the main characteristics of the efficiency of the CO2/FGs utilization by microalgae.
The analysis of the studies performed shows a wide range of microalgae strains’ reactions to elevated concentrations of CO2 or FGs with varying dilution degrees. In [4], to assess the potential of three microalgae strains (Nannochloropsis sp., Tetraselmis sp., and Isochrysis sp.) to capture CO2, they were grown under laboratory conditions, first on 100% CO2, and then on flue gases from a coal-fired power plant. The best results after the adaptation phase were shown by Isochrysis sp. with a maximum biofixation rate of 0.35 g CO2/L of culture fluid per day. According to [5], the microalgae strain Desmodesmus sp. withstood concentrations up to 11% CO2, while in [6] Spirulina platensis in a consortium with other microalgae showed stable growth on flue gases with CO2 concentrations up to 15%. In [7] the impact of high CO2 concentrations and pH on MA Stichococcus bacillaris (ACUF 158/11) growth, which is a lipid producer for biodiesel fuel production, are presented. It has been shown that CO2 concentrations greater than 0.035% v/v increased microalgae productivity and lipid concentrations in biomass. However, with a further increase in the CO2 concentration (5 and 15 vol.%), no significant changes in the microalgae productivity were observed. In a wide-range review of methods and results of cultivating microalgae, including autotrophs, heterotrophs, and mixotrophs [8], Chlorella sp. is indicated as microalgae that grow with high efficiency upon bubbling with high CO2 concentrations. The efficiency of CO2 absorption in most cases is about 50–80%. The search for the stressors/stress conditions for the induction of various target products can also lead to the discovery of CO2-resistant microalgae strains. For example, it was shown in [9] that the Scenedesmus obliquus inhibition did not occur up to 10% CO2, and the productivity did not decrease significantly even at 35% CO2. The growth rate exceeded all published values for S. obliquus at concentrations greater than 2.5% CO2.
It is important to note that both microalgae from collections and isolated from natural sources are considered as promising objects of research. Thus, in [5], the selection of MA strains was carried out by sampling in different sources: in a freshwater lake, in a river in the tidal zone with brackish water, and in a cement plant rain sewer. The selected samples of microalgae were cultured autotrophically in Erlenmeyer flasks (250 mL) on Bold Basal medium. According to the cultivation results, microalgae consortiums (mixed cultures) were selected, which then underwent the adaptation to aeration with a CO2 concentration in gas–air mixtures (successively) of 1 and 5%. The consortiums that showed the highest growth at the highest concentration of CO2 were then used for flue gas experiments.
A significant inhibitor of some microalgae growth at elevated CO2 concentrations or in flue gases is a decreasing pH of the cultivation medium [10,11]. To overcome this problem, it has been proposed to use a phosphate buffer [5], but this solution is not universal.
The CO2 absorption efficiency of various microalgae can be assessed by biomass productivity and/or growth rate. Another important characteristic of CO2/FGs uptake efficiency is the microalgae biochemical composition. For example, in [12,13], a decrease in lipids content in the microalgae biomass was shown after cultivation under gas–air mixtures with high CO2 contents. A stable biochemical composition or an increasing lipid and/or carbohydrate content may indicate the stability of MA growth and the adaptability to stress conditions. In general, the changing biochemical composition can be a marker when choosing the most suitable microalgae strains for CO2 uptake purposes.
Thus, it can be assumed that microalgae consortiums can be most productive when grown under conditions of high CO2 concentrations. In this case, it may be promising to use consortiums that include cyanobacteria as dominant organisms, which are grown on media with a high initial pH and high buffering. This will reduce the lowering pH effect on the microalgae growth. As characteristics of CO2 absorption efficiency from gas–air mixtures one can consider the biomass productivity, the nutrient medium elements absorption intensity, as well as the microalgae biochemical characteristics.
In connection with the assumptions put forward, it was proposed to use microalgae/cyanobacteria Arthrospira platensis (or Spirulina platensis according to the old classification) as a study object in this work [14]. Despite the fact that its classification was revised, and it was assigned to cyanobacteria, Arthrospira, like other representatives of blue-green microalgae, still remains the object of study by algologists, since in all its external and physiological features it does not differ from microalgae. One of the A. platensis advantages is the relative ease of growing in open cultivators and biomass harvesting. It should be noted that these microalgae grow in a highly alkaline environment, due to which they are protected from contamination by other algae, fungi and other microorganisms. The tolerance of microalgae A. platensis to high CO2 concentrations has been previously studied in [15,16,17,18,19,20,21,22,23,24,25]. In [15] Spirulina strains (LAMB171, LAMB172, and LAMB220) from the Laboratory of Applied Microalgal Biology, Ocean University of China, were studied under the CO2 concentrations 2, 5, 10, and 15%. Spirulina platensis PCC9108 from the Pasteur Institute, France, was studied in [16] under the CO2 concentrations 0.036 (air), 4, 6, 8, and 10%. A single strain of Spirulina platensis from the University of Texas, USA, collection of cultures, as well as a mixed culture of local microalgae was studied in [17]. CO2 concentrations were chosen in the range of 2.5–20%. In contrast to the above studies (where the volume of cultivators is less than 1 L), in this work a photobioreactor with a volume of 250 L was used. In [18], Spirulina platensis from the ATCC (American Type Culture Collection) strain 53844 was studied. The experiments were carried out with a wide range of conditions for CO2 concentration (0.5, 2.5, 5.0, 7.5, and 10%), temperature (15, 20, 25, 30, and 40 °C), and light intensities (60, 80, 100, 150, and 200 µmol/m2 s).
The strain used in our studies (A. platensis rsemsu P (Bios)) was grown for more than 20 years in a semi-continuous way (with the periodical selection of biomass portion and the fresh medium addition) in open flat cultivators with a volume of 1000 and 500 L. As a result of long-term cultivation in open cultivators, the culture biological diversity has increased, which now includes—in addition to the microalgae A. platensis—bacterial organisms. In this work, a cylindrical photobioreactor with a microalgae consortium was placed in a sealed chamber with an increased content of CO2 in the ambient air, which made it possible to directly monitor the CO2 concentration changes in the gas–air mixture throughout the experiment. The microalgae state was assessed by the biomass growth rate, biochemical composition, and the nutrients absorption intensity.
The objectives of the study are:
- -
- Studying the efficiency of CO2 capture by A. platensis microalgae from a CO2-saturated atmosphere in a closed chamber.
- -
- Studying the resulting biomass properties and culture medium composition.
2. Materials and Methods
2.1. Microalgae and Nutrient Medium
As a source of biomass, we used a stable consortium of microalgae based on the blue-green microalgae/cyanobacteria Arthrospira platensis rsemsu P (Bios) with heterotrophic bacteria of the genera Pseudomonas and Bacterium. A stable consortium is represented by direct trichomes of Arthrospira, which were formed as a result of natural morphological variability during long-term cultivation in the laboratory, as well as by heterotrophic bacteria. Arthrospira platensis was obtained from the Research Laboratory of Renewable Energy Sources of the Faculty of Geography of Moscow State University, where this culture has been cultivated since 1987. The microalgae used in the experiments were initially grown in flat open-type cultivators (at atmospheric CO2 concentration of 0.03 vol.%) in a semi-continuous way on Zarrouk’s medium at a constant illumination of 25 ± 3 µmol/m2×s and a temperature of 21 °C with near-surface mixing. The composition of Zarrouk’s medium for cultivating the microalgae Arthrospira platensis: NaHCO3—16.8 g/L; KNO3—3.0 g/L; K2HPO4·3H2O—0.66 g/L; K2SO4—1.0 g/L, MgSO4·7H2O—0.2 g/L, NaCl—1.0 g/L, CaCl2—0.04 g/L, FeSO4·7H2O—0.018 g/L, EDTA—0.08 g/L, microelement solution for Zarrouk’s medium—1 mL/L. In experiments to determine the efficiency of CO2 capture, Zarrouk’s medium was used, prepared with distilled water [26].
2.2. Photobioreactor
The photobioreactor (PBR) is a vertical tube made of acrylic plexiglass. The tube has an internal diameter of 30 cm, a height of 150 cm, and an internal volume of about 100 L. Along the perimeter of the PBR, parallel to its axis and at a distance of 20 cm from the outside of the PBR, the FITOLUX-A144-10mm 24V Warm3000-Red (14W/m, IP20, 24V supply voltage) LED strip is mounted on a cylindrical mirror-shaped reflector. This 10 mm wide strip consists of SMD 2835 LEDs (144 pcs/m) in white, warm (3000 K), and red (660 nm) with a color rendering index (CRI > 90). The smallest LED strip length of 62.5 mm contains 9 LEDs: 6 white and 3 red LEDs. The total length of the LED strip installed around the PBR is 20 m. The distance between the individual vertical sections of the strip is identical. The LED strip is powered by two ARV-SN24150-PFC-TRIAC-B (24 V, 6.25 A, 150 W) power sources and two VT-S74-30A dimmers.
The illumination on the outer surface of the PBR at the maximum power of the LED strip is 14.0–14.4 klx. The illumination on the PBR surface immediately behind the wall (taking into account the decrease in light transmission through walls) is 12.1–13.4 klx. Illumination was determined using a Digital Luxmeter MS6610 MASTECH. The gas–air mixture is fed into the PBR from below and sprayed at the bottom using a ceramic atomizer. The PBR is closed from above with a lid with two fittings with a diameter of 10 mm, while the lid has holes for the exit of the gas–air mixture. The PBR uses a Hailea V30 compressor to supply gas. The compressor flow without resistance is 26.6 L/min, and the compressor flow through the filled PBR is 13 L/min. The flow rate of the gas generated by the compressor is determined using a Ritter drum-type gas meter, which is connected to one of the fittings of the PBR lid (the second fitting is blocked).
2.3. The Atmospheric Gas Chamber
The atmospheric gas chamber (AGC) is designed to create a controlled atmosphere in it with a given composition and parameters (temperature, pressure, etc.) and study the effect of various methods on the atmosphere (purification, disposal of harmful emissions, etc.). The internal volume of the chamber is 12 m3: width—2 m, length—3 m, height—2 m. The chamber is equipped with a door: with a width of 600 mm and a height of 1600 mm.
AGC is equipped with a vacuum pump, compressor, heater, cooler, blower, and sockets. The vacuum pump is used to pump the air out of the chamber, the compressor is used to pump the air into the chamber. The heater is designed to heat the air inside the chamber, the cooler is designed to cool the air inside the chamber, the blower is designed to mix the air mass inside the chamber, and the sockets are designed to connect the equipment inside the chamber.
The AGC allows automatic maintenance of the set temperature inside the chamber. A tank with carbon dioxide is connected to the chamber. The chamber is equipped with a gas analyzer that can determine the concentrations of the following gases: oxygen, carbon monoxide, carbon dioxide, ammonia, methane, sulfur dioxide, and nitrogen dioxide. The chamber is equipped with an exhaust stack with an exhaust fan. Schematic diagram and general view of the AGC are shown in Figure 1 and Figure 2, respectively.
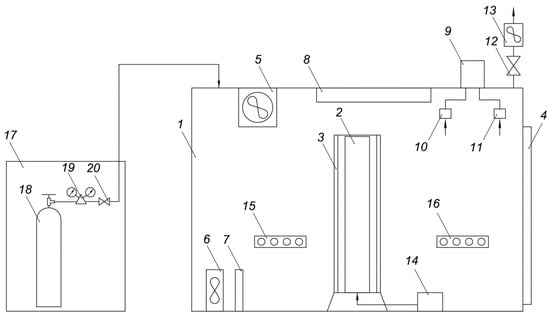
Figure 1.
Schematic diagram of atmospheric gas chamber (AGC) used in experiments. 1—Chamber, 2—Photobioreactor, 3—LED strips, 4—Chamber door, 5—Top blower, 6—Bottom blower, 7—Heater, 8—Cooler, 9—Acquisition system, 10—Gas analyzer, 11—Temperature, humidity and pressure sensor, 12—Valve, 13—Exhaust blower, 14—Compressor, 15, 16—Sockets, 17—Ramp, 18—CO2 tank, 19—Reducer, 20—Valve.
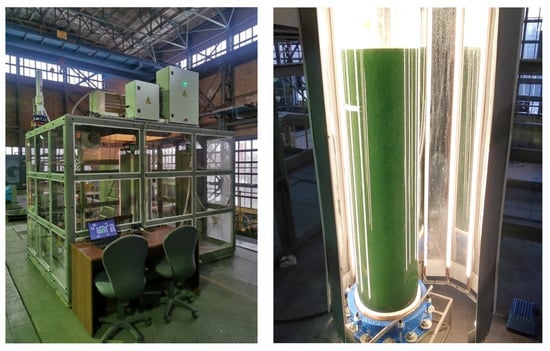
Figure 2.
A view of atmospheric gas chamber (AGC) with a photobioreactor (PBR) inside the chamber.
2.4. Experimental Procedure
Three experiments were carried out under the following conditions:
- -
- The initial volume of microalgae suspension in PBR—90 L.
- -
- Nutrient medium—Zarrouk’s medium, prepared with distilled water.
- -
- Duration of experiments—15 days.
- -
- The initial concentration of CO2 in experiments: 1 vol.%, 5 vol.%, 9 vol.%.
- -
- A constant temperature of 27 ± 1 °C was maintained in the chamber
Each of the experiments at a certain initial concentration of CO2 was carried out as follows: Prepared Zarrouk’s nutrient medium was poured into a clean photobioreactor and then a concentrated suspension of microalgae was added. The chamber was then closed and carbon dioxide was injected up to a certain concentration with an open exhaust pipe. Once a certain concentration of CO2 was reached, the exhaust pipe was closed and the chamber was hermetically sealed.
The illumination of the photobioreactor was continuous. The gas from the chamber was fed to the PBR through the porous bottom also continuously during the whole experiment with the help of a compressor. Inside the chamber, the gas–air medium was mixed with the help of two blowers.
The efficiency of CO2 capture by microalgae from the chamber atmosphere was investigated for 15 days. Every five days, i.e., on days 0, 5, 10, and 15, samples of suspension from PBR were taken to determine the concentration and growth rate of biomass and the nutrient content. At the time of sampling, the chamber was depressurized, but afterward, the same values of CO2 concentrations were set as before the chamber was opened. The sample of the suspension was filtered and the filtrate was sent for analysis.
On the 15th day, the experiment was terminated and a portion of the microalgae biomass was extracted by filtration. Stainless steel mesh filters with a mesh size of 100 µm were used for filtration. Three experiments were carried out in this way, each starting with the same initial concentration of microalgae biomass in 90 L cultivating medium.
2.5. Research Methods
During the experiments the following analyses were carried out for each sample of microalgae suspension:
- -
- Optical density on a spectrophotometer mod. SF-102 and KFK-2-UHL 42 (Russia) at 670 nm/750 nm.
- -
- pH by using a pH meter with an instrument error ±0.2.
Samples of biomass obtained on the 15th day of the experiments were subjected to drying, after which the protein and lipid contents were determined.
Microscopic monitoring of microalgae state during the growth process was carried out using an Axioplan 2 Imaging optical microscope with an AxioCam MB camera and an AxioVision 3.1 modular image processing and analysis system (Carl Zeiss, Göttingen, Germany). A visual inspection of the cells was carried out: uniformity of microalgae composition, pigmentation intensity, motility, and presence of dead cells.
3. Results and Discussion
In the experiment with the initial CO2 concentration of 1 vol.%, the smallest drop in CO2 concentration was observed during the 15 days (Figure 3a) among all experiments. The concentration of carbon dioxide in the gas–air mixture decreased from 1.01 to 0.24 vol.%, which means that the drop was approximately 0.06 vol.% (CO2)/day.
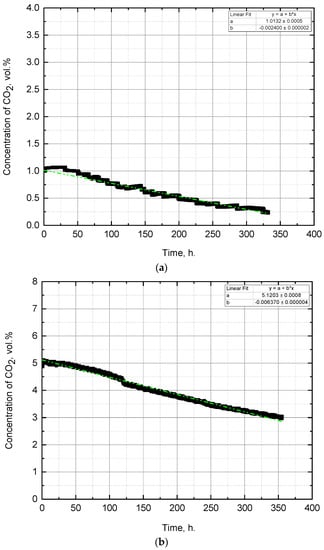
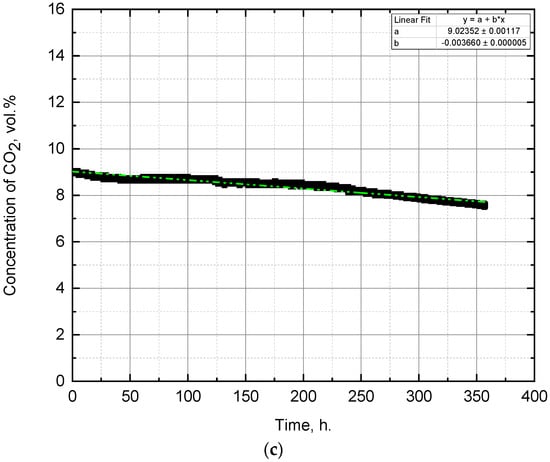
Figure 3.
Change of CO2 concentration during the experiment with the initial CO2 concentration of: (a) 1 vol.%, (b) 5 vol.%, (c) 9 vol.%.
The results showed that the pH of the medium increased from 9.2 to 9.7 (Figure 4), becoming more alkaline, which corresponds to the properties of the Arthrospira platensis culture. This experiment achieved the highest pH = 9.8. The density of biomass (Figure 5) also increased, which indicates the growth of microalgae in suspension. According to the results of the experiment, the biomass growth rate was 79.4 (mg/L)/day—which was the maximum growth rate in the experiments performed. Observation of the state of the culture (by microscopy) showed that microalgae cells were in a viable state during all stages of the experiment and were constantly dividing. The biomass was harvested by filtration, and the weight of the dried biomass after 15 days of the experiment was 160 g.
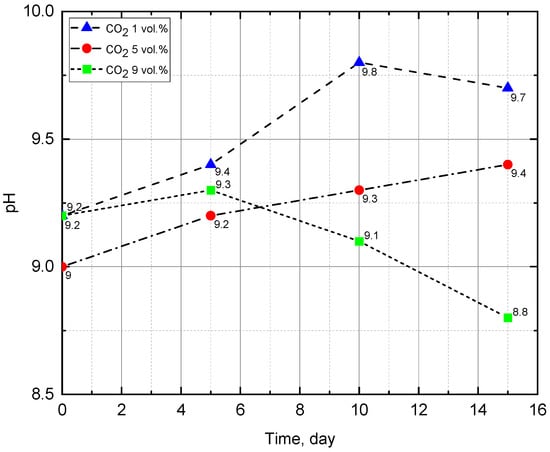
Figure 4.
Change of pH during the experiments.
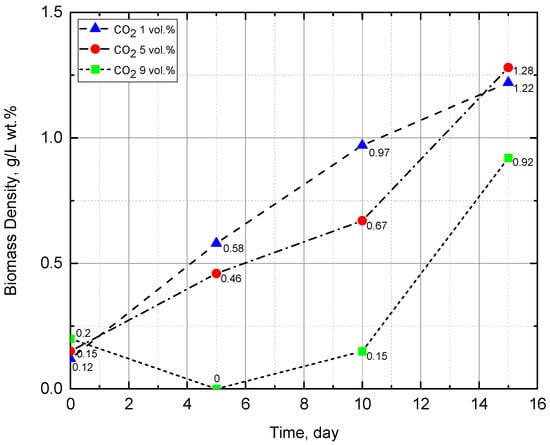
Figure 5.
Change of biomass density during the experiments.
In the experiment with the initial CO2 concentration of 5 vol.%, the most intense drop in CO2 concentration was observed within 15 days (Figure 3b). The concentration of carbon dioxide in the gas–air mixture decreased from 5.10 to 3.03 vol.%, that is, the drop was approximately 0.14 vol.% (CO2)/day. Part of this drop was due to CO2 losses through leaks in the chamber, estimated previously and equal to approximately 0.04 vol.% (CO2)/day, the other part is due to the capture of CO2 during photosynthesis by microalgae. The decrease in CO2 concentration associated with the process of photosynthesis is approximately 0.10 vol.% (CO2)/day.
The results showed that the pH of the medium, as the biomass grew, increased from 9.0 to 9.4 (Figure 4), becoming more alkaline, which corresponds to the Arthrospira platensis property of preferential physiological uptake of anions compared to cations. This is especially true for the predominant absorption of HCO3- anions compared to Na+ cations from NaHCO3, as a result, Na+ cations accumulate as cells grow and pH increases. The biomass’s density (Figure 5) also increased, while the active growth of its value fell during the period from the 10th to the 15th day of the experiment. It can be assumed that the first ten days were a period of adaptation to high CO2 concentration, and then a period of active growth of microalgae began. It should be noted that in this experiment, the highest value of biomass growth was achieved—1.28 g/L in terms of dry weight (wt.%). The biomass growth rate revealed by optical measurements was 76.3 (mg/L)/day. Observation of the state of the culture (by microscopy) showed that microalgae cells were in a viable state during all stages of the experiment and were constantly dividing. The weight of the dried biomass was 165 g.
In the experiment with 9% vol. CO2 concentration, at first, an increase in pH from 9.2 to 9.3 was also noted, but due to the mass death of Arthrospira cells, no further assimilation of bicarbonate ions occurred, and the culture liquid color in the photobioreactor changed from blue-green to green. In the samples, the number of Arthrospira trichomes significantly decreased, and the green picoplanktonic microalgae coccoid cells, whose growth does not require bicarbonate ions, became dominant. These microalgae are tolerant to high CO2 concentrations and actively assimilate it during growth; as a result a significant pH decrease from 9.3 to 8.8 was observed. After CO2 concentration decreasing, a partial adaptation of the surviving Arthrospira cells occurred and their growth was restored. The results of biomass density measurements (Figure 5) also confirm the green algae active growth and then blue-green algae Arthrospira development in the photobioreactor. The initial biomass density was equal 0.2 g/L wt.%. After 5 days of the experiment, optic density measurement, carried out at a wavelength of 670 nm, showed 0 g/L, which was due to cell death and a change in the culture fluid color (from blue-green to transparent yellow). On the 10th day of the experiment, due to the green microalgae in the consortium growth, the biomass density increased to 0.15 g/L, and on the 15th day—up to 0.92 g/L wt.%. Microscopic analysis showed that microalgae at the final stage of the experiment were represented by both trichomes—blue-green A. platensis and green picoplankton microalgae cocci.
It is necessary to explain the observed result. At a CO2 concentration of 8.88–8.69 vol.%, there was a massive cell death in Arthrospira platensis, since such values of carbon dioxide concentration are excessive for these microalgae. When observing the state of the culture (by microscopy) 7–8 days after the start of the experiment, a large number of dead Arthrospira cells were found. The number of surviving cells was less than 1% in ten fields of view at a magnification of 100 times. Since the experiments used a non-algologically pure culture A. platensis, and a stable consortium with heterotrophic bacteria, which was created during semi-continuous cultivation in an open way for many years, this consortium also included green microalgae in a small amount, adapted to the growing conditions and nutrient medium of Zarrouk. The extinction of most of the Arthrospira platensis cells made it possible to develop other algae that are resistant to such CO2 concentrations. These green microalgae occupied a vacant niche in the PBR and, through photosynthesis and assimilation, reduced the concentration of carbon dioxide to ~8% of the values at which the remaining A. platensis microalgae continued to grow. Microscopic examination confirmed the assumptions made. Thus, the state of the culture 10 days after the start of the experiment showed the presence in the sample of microorganisms that are not related to Arthrospira platensis (Figure 6a) and have a size of ~1 µm. On the 15th day of the experiment, the number of both microalgae increased (Figure 6b).
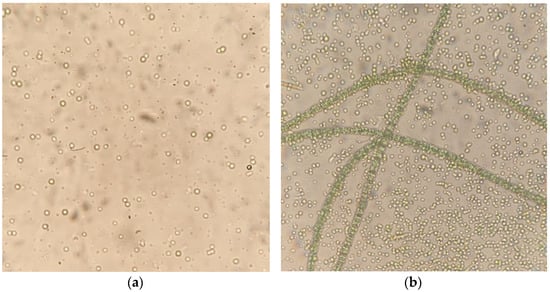
Figure 6.
Images of the culture during the experiment with the initial CO2 concentration of 9 vol.%. (a) 10th day of the experiment, (b) 15th day of the experiment (400 times magnification).
The change in CO2 concentration in the experiment with the initial CO2 concentration of 9 vol.% is shown in Figure 3c. The concentration of carbon dioxide in the gas–air mixture decreased from 9.02 to 7.59 vol.%, which means that the drop was about 0.09 vol.% (CO2)/day. Part of this drop was due to CO2 losses through leaks in the chamber, estimated previously and equal to approximately 0.05 vol.% (CO2)/day, the other part is due to the capture of CO2 during photosynthesis by microalgae. Thus, the decrease in CO2 concentration due to the photosynthesis process is about 0.04 vol.% (CO2)/day.
The pH measurement results (Figure 4) agree with the explanations for the last experiment. Initially, the pH rises from 9.2 to 9.3 and does not reach the values obtained in the previous two experiments, which is associated with the death of Arthrospira platensis. Further, there is a decrease in pH from 9.3 to 8.8, this indicates the presence of other photosynthetic microorganisms that assimilate carbon dioxide during the growth process. The results of biomass density measurements (Figure 5) also confirm the proposed explanations. The first measurement gives us an initial density value of 0.2 g/L wt.%. The second measurement is zero because when determining the optical density, the wavelength was set to 670 nm, and the suspension was transparent yellow. On the 10th day of the experiment, due to the growth of the accompanying green microalgae, the biomass density increased to 0.15 g/L wt.%, and on day 15—up to 0.92 g/L wt.%. Microscopic analysis showed that microalgae are represented by both trichomes of the blue-green A. platensis and cocci of green picoplankton microalgae.
As can be seen from Table 1, which summarizes the experiments’ results, the achieved productivity at various CO2 concentrations in the atmospheric gas chamber is far from the record Spirulina platensis productivity values given in [15,16,17,18]. In [15] Spirulina strains (LAMB171, LAMB172, and LAMB220) were cultivated in a tubular photobioreactor (PBR). CO2 concentrations were 2, 5, 10, and 15%. The initial density of inoculum was 0.3 ± 0.02 g/L for each 650 mL tube photobioreactor. Three parallel experiments were carried out and the cultivation lasted 12 days. Based on the results, the best biomass performance and the highest CO2 fixation rate were obtained under 10% CO2 for all three Spirulina strains tested. The maximum biomass productivity was 272.12 mg/L per day for Spirulina strain LAMB171. Spirulina platensis PCC9108 was cultured in a modified culture medium [16]. All experiments were performed with a working volume of 400 mL in 500 mL Erlenmeyer flasks and CO2 concentrations from 0.036 (air) to 10%. The initial concentration of biomass was 0.1 g/L. Intermittent illumination with a photoperiod of 16 h of light: 8 h of darkness was provided using four 40 W fluorescent lamps providing a light intensity of 3200 lx on the surface of the vessel. Based on the results, the maximum biomass production was recorded at 8% CO2 and was 163 mg/L per day. A single strain of Spirulina platensis from the collection of cultures of the University of Texas, USA, as well as a mixed culture of local microalgae were cultured in the 250 L pilot plant [17]. CO2 concentrations were chosen in the range of 2.5–20%, Zarrouk’s nutrient medium was used. According to the results, optimal performance was observed under 10% CO2. Biomass productivity and carbon fixation rate were 796–950 mg/L per day and 542–1075 mg(C)/L per day. In [18], Spirulina platensis was cultured under different concentrations of CO2 (from 0.5 to 10%) and continuous barbotage at the rate of 0.5 l/min; the experiment lasted 12 days. The pH of Zarrouk’s medium was 9.0 ± 0.2. As mentioned above, experiments were carried out at different temperatures and light intensities. Based on the results, the maximum CO2 biological fixation rate was 25.1 g(CO2)/m3 h (or 602 vu/k per day) and the maximum growth was achieved under 2.5% CO2, 150 µmol/m2 s at 25 °C. Further work requires a thorough comparative analysis of experimental conditions in order to find ways to increase the microorganism consortium’s A. platensis rsemsu P (Bios) productivity.

Table 1.
Summary of the results.
At the end of each experiment, biomass was obtained, which was harvested and sent for biochemical analysis. Biochemical analysis of the biomass harvested on the 15th day of the experiments showed (Table 2) that the lipid content differed slightly in comparison with the control sample (grown at air bubbling with CO2 concentration of 0.03 vol.%). A decrease in the lipid content is observed with the increase of CO2 concentration in the gas–air mixture. It can be seen that in the control (grown at air bubbling with CO2 concentration of 0.03 vol.%), the lipid content was (5.3 ± 1.1)% wt.% of the microalgae sample. At a concentration of 1 vol.% CO2, almost the same lipid content remained (5.7 ± 0.6)%. At higher concentrations of carbon dioxide (5 vol.%), the content of lipids decreased and reached (4.2 ± 0.5)%. It should be noted that A. platensis is not, generally speaking, a source of lipids unless two-stage methods of its cultivation with stress (nitrogen starvation) are used at the second stage of cultivation. As for the content of proteins produced by A. platensis, the content of proteins in all analyzed samples (control and biomass grown at elevated CO2 concentrations) remains high, about 70%, but at 5% CO2 concentration this content decreased to 47.7%. These results may indicate the effect of high levels of CO2 in the gas–air mixture on the metabolism of microalgae.
Table 2.
Lipid and protein concentration in A. platensis biomass grown at different of CO2 concentrations.
Taking into account the course of the last experiment, comparing the results of all three experiments is assumed to be inappropriate since the growth of another type of microorganisms unambiguously affected the amount and composition of the collected biomass in the experiment with the initial CO2 concentration of 9 vol.%.
4. Conclusions
The results of a study of the efficiency of CO2 capture by A. platensis culture from a CO2-saturated atmosphere in a closed chamber are presented. We used a 90 L photobioreactor, where microalgae were grown on Zarrouk’s medium prepared with distilled water. A semi-continuous method of cultivating microalgae in a photobioreactor was applied. This method also includes constant bubbling of the culture medium with a gas–air mixture with different initial concentrations of CO2 (1, 5, 9 vol.%).
The maximum drop in CO2 concentration, approx. 0.10 vol.% (CO2)/day, was obtained in experiment with the initial CO2 concentration of 5 vol.%. In the same experiment, the highest value of the biomass density on the 15th day was obtained. The value was 1.28 g/L wt.% with an initial density of 0.15 g/L wt.%. The maximum biomass growth rate was 79.4 (mg/L)/day at the initial CO2 concentration of 1 vol.%.
The high productivity of microalgae Spirulina at elevated CO2 concentrations presented in previous studies were not achieved in our experiments where a stable consortium of microalgae/cyanobacteria A. platensis with heterotrophic bacteria was used. Moreover, almost complete death of A. platensis cells was recorded under the influence of 9% CO2 concentration. Then there was a change of the dominant microalgae in the consortium to green picoplankton algae, resistant to a given CO2 concentration, which actively assimilated carbon dioxide and reduced its concentration. By the experiment’s end, a recovery in the microalgae consortium’s productivity was observed, including the growth and development of adapted A. platensis cells.
The results of biochemical analysis may indicate a stable state of cultures with a tendency to reduce the content of lipids and proteins with an increase in the concentration of CO2 in gas–air mixtures. It can be assumed, the high levels of CO2 in the gas–air mixture may have an impact on the metabolism of microalgae. Some additional experiments with high CO2 concentrations should be conducted, and the results of biochemical analysis should be compared to clarify the tendency.
The study demonstrated good viability (high biomass quality and stable growth rate) of A. platensis microalgae when cultured at a CO2 concentration of 1–5 vol.%. A CO2 concentration of 9 vol.% led to significant changes in the composition of the consortium, which ensured the temporary dominance of green picoplankton microalgae, which at the same time effectively reduced the CO2 concentration. This, in turn, provided conditions for a gradual restoration of growth and development of the main component of the consortium, A. platensis. To refine the tolerance threshold for CO2 concentration in the gas–air mixture for the A. platensis P (Bois) consortium with heterotrophic bacteria, it is necessary to further study the effect of CO2 concentrations in the range of 5–9 vol.%.
Author Contributions
Investigation, formal analysis, writing—original draft preparation, E.A.C.; data curation, visualization, A.V.G.; conceptualization, methodology, investigation, N.I.C.; conceptualization, methodology, investigation, resources, S.V.K.; data curation, K.G.R.; resources, O.S.P.; project administration, S.Y.M.; project administration, resources O.V.S., validation, F.d.F.N., writing—review and editing, L.L.; writing—review and editing, funding acquisition, project administration, V.K.; conceptualization, methodology, investigation, formal analysis, funding acquisition, project administration, M.S.V. All authors have read and agreed to the published version of the manuscript.
Funding
This work was funded by the Russian Science Foundation (RSF), Grant No. 22-49-02003, https://rscf.ru/project/22-49-02003/ (accessed on 11 September 2022).
Data Availability Statement
Not applicable.
Acknowledgments
We would like to express our gratitude to the Russian Science Foundation (RSF) for funding the present research project (Grant No.22-49-02003, https://rscf.ru/project/22-49-02003/ (accessed on 11 September 2022)).
Conflicts of Interest
The authors declare no conflict of interest.
References
- Matsudo, M.C.; Bezerra, R.P.; Sato, S.; Converti, A.; De Carvalho, J.C.M. Photosynthetic efficiency and rate of CO2 assimilation by Arthrospira (Spirulina) platensis continuously cultivated in a tubular photobioreactor. J. Biotechnol. 2012, 7, 1412–1417. [Google Scholar] [CrossRef] [PubMed]
- Duarte, J.H.; De Morais, E.G.; Rademann, E.M.; Costa, J.A.V. Biological CO2 mitigation from coal power plant by Chlorella fusca and Spirulina sp. Bioresour. Technol. 2017, 234, 472–475. [Google Scholar] [CrossRef]
- Chernova, N.I.; Kiseleva, S.V. The Wastewater Using in Technologies of Bio-Oil Production from Microalgae: CO2 Capture and Storage. In IOP Conference Series: Materials Science and Engineering; IOP Publishing: Bristol, UK, 2021; Volume 1037, p. 012045. [Google Scholar]
- Yahya, L.; Harun, R.; Abdullah, L.C. Screening of native microalgae species for carbon fixation at the vicinity of Malaysian coal-fired power plant. Sci Rep. 2020, 10, 22355. [Google Scholar] [CrossRef]
- Aslam, A.; Tomas-hall, S.R.; Aziz, T.; Schenk, P.M. Selection and adaptation of microalgae to growth in 100% unfiltered coal-fired flue gas. Bioresour. Technol. 2017, 233, 271–283. [Google Scholar] [CrossRef] [PubMed]
- Almomani, F.; Judd, S.; Bhosale, R.R.; Shurair, M.; Aljaml, K.; Khraisheh, M. Intergraded wastewater treatment and carbon bio-fxation from flue gases using Spirulina platensis and mixed algal culture. Process Saf. Environ. Prot. 2019, 124, 240–250. [Google Scholar] [CrossRef]
- Olivieri, G.; Gargano, I.; Andreozzi, R.; Marottaa, R.; Marzocchella, A.; Pinto, G.; Pollio, A. Effects of CO2 and pH on Stichococcus bacillaris in laboratory scale photobioreactors. Chem. Eng. Trans. 2012, 27, 127–132. [Google Scholar]
- Hossain, N.; Mahlia, T.M.I. Progress in physicochemical parameters of microalgae cultivation for biofuel production. Crit. Rev. Biotechnol. 2019, 39, 835–859. [Google Scholar] [CrossRef]
- Molitor, H.R.; Moore, E.J.; Schnoor, J.L. Maximum CO2 Utilization by Nutritious Microalgae. ACS Sustain. Chem. Eng. 2019, 7, 9474–9479. [Google Scholar] [CrossRef]
- Chiu, S.Y.; Kao, C.Y.; Chen, C.H.; Kuan, T.C.; Ong, S.C.; Lin, C.S. Reduction of CO2. Bioresour. Technol. 2008, 99, 3389–3396. [Google Scholar] [CrossRef] [PubMed]
- De Morais, M.G.; Costa, J.A.V. Biofixation of carbon dioxide by Spirulina sp. and Scenedesmus obliquus cultivated in a three-stage serial tubular photobioreactor. J. Biotechnol. 2007, 129, 439–445. [Google Scholar] [CrossRef]
- Yoo, C.; Jun, S.Y.; Lee, J.Y.; Ahn, C.Y.; Oh, H.M. Selection of microalgae for lipid production under high levels carbon dioxide. Bioresour. Technol. 2010, 101, S71–S74. [Google Scholar] [CrossRef]
- Kao, C.Y.; Chen, T.Y.; Chang, Y.B.; Chiu, T.W.; Lin, H.Y.; Chen, C.D.; Chang, J.S.; Lin, C.S. Utilization of carbon dioxide in industrial flue gases for the cultivation of microalga Chlorella sp. Bioresour. Technol. 2014, 166, 485–493. [Google Scholar] [CrossRef] [PubMed]
- Guidi, F.; Gojkovic, Z.; Venuleo, M.; Assunçao, P.A.C.J.; Portillo, E. Long-Term Cultivation of a Native Arthrospira platensis (Spirulina) Strain in PozoIzquierdo (Gran Canaria, Spain): Technical Evidence for a Viable Production of Food-Grade Biomass. Processes 2021, 9, 1333. [Google Scholar] [CrossRef]
- Zhu, B.; Xiao, T.; Shen, H.; Li, Y.; Ma, X.; Zhao, Y.; Pan, K. Effects of CO2 concentration on carbon fixation capability and production of valuable substances by Spirulina in a columnar photobioreactor. Algal Res. 2021, 56, 102310. [Google Scholar] [CrossRef]
- Hoseini, S.M.; Almodarres, A.; Afsharzadeh, S.; Hatamipur, M.; Montazeri, F. Growth response of Spirulina platensis PCC9108 to elevated CO2 levels and flue gas. Biol. J. Microorg. 2014, 2, 29–36. [Google Scholar]
- Almomani, F.; Al Ketife, A.; Judd, S.; Shurair, M.; Bhosale, R.R.; Znad, H.; Tawalbeh, M. Impact of CO2 concentration and ambient conditions on microalgal growth and nutrient removal from wastewater by a photobioreactor. Sci. Total Environ. 2019, 662, 662–671. [Google Scholar] [CrossRef]
- Ramirez-Perez, J.C.; Harry, J. Impact of Salinity on the Kinetics of CO2 Fixation by Spirulina platensis Cultivated in Semi-Continuous Photobioreactors. In Proceedings of the 249th American Chemical Society National Meeting and Exposition, Denver, CO, USA, 22–26 March 2015. Volume Division of Biochemical Technology, BIOT 407. [Google Scholar]
- Kareya, M.S.; Mariam, I.; Nesamma, A.A.; Jutur, P.P. CO2 sequestration by hybrid integrative photosynthesis (CO2-SHIP): A green initiative for multi-product biorefineries. Mater. Sci. Energy Technol. 2020, 3, 420–428. [Google Scholar] [CrossRef]
- Onyeaka, H.; Miri, T.; Obileke, K.; Hart, A.; Anumudu, C.; Al-Sharify, Z.T. Minimizing carbon footprint via microalgae as a biological capture. Carbon Capture Sci. Technol. 2021, 1, 100007. [Google Scholar] [CrossRef]
- Vale, M.A.; Ferreira, A.; Pires, J.C.M.; Gonçalves, A.L. Chapter 17—CO2 Capture Using Microalgae. In Advances in Carbon Capture; Rahimpour, M.R., Farsi, M., Makarem, M.A., Eds.; Woodhead Publishing: Sawston, UK, 2020; pp. 381–405. [Google Scholar]
- Zhao, B.; Su, Y. Process effect of microalgal—Carbon dioxide fixation and biomass production. Renew. Sustain. Energy Rev. 2014, 31, 121–132. [Google Scholar] [CrossRef]
- Zhu, B.; Shen, H.; Li, Y.; Liu, Q.; Jin, G.; Han, J.; Zhao, Y.; Pan, K. Large-Scale Cultivation of Spirulina for Biological CO2 Mitigation in Open Raceway Ponds Using Purified CO2 From a Coal Chemical Flue Gas. Front. Bioeng. Biotechnol. 2020, 7, 441. [Google Scholar] [CrossRef]
- Kim, Y.S.; Lee, S.-H. Quantitative analysis of Spirulina platensis growth with CO2 mixed aeration. Environ. Eng. Res. 2018, 23, 216–222. [Google Scholar] [CrossRef]
- Liu, W.; Wang, J.; Liu, T. Low pH rather than high CO2 concentration itself inhibits growth of Arthrospira. Sci. Total Environ. 2019, 666, 572–580. [Google Scholar] [CrossRef] [PubMed]
- Zarrouk, C. Contribution a L’etuded’unecyanophycee: Influence de Diverse Facteurs Physiques et Chimiquessur la Croissance et la Photosynthese de Spirulina Maxima (Setch et Gardner) Geitler. Ph.D. Thesis, University of Paris, Paris, France, 1966. [Google Scholar]
Disclaimer/Publisher’s Note: The statements, opinions and data contained in all publications are solely those of the individual author(s) and contributor(s) and not of MDPI and/or the editor(s). MDPI and/or the editor(s) disclaim responsibility for any injury to people or property resulting from any ideas, methods, instructions or products referred to in the content. |
© 2023 by the authors. Licensee MDPI, Basel, Switzerland. This article is an open access article distributed under the terms and conditions of the Creative Commons Attribution (CC BY) license (https://creativecommons.org/licenses/by/4.0/).