Article

Research of Load Impact on Energy Consumption in an Electric Delivery Vehicle Based on Real Driving Conditions: Guidance for Electrification of Light-Duty Vehicle Fleet

by
Wojciech Cieslik
1,* and
Weronika Antczak
2
1
Department of Combustion Engines and Powertrains, Faculty of Civil and Transport Engineering, Poznan University of Technology, 60-965 Poznan, Poland
2
Faculty of Civil and Transport Engineering, Poznan University of Technology, 60-965 Poznan, Poland
*
Author to whom correspondence should be addressed.
Energies 2023, 16(2), 775; https://doi.org/10.3390/en16020775
Submission received: 13 December 2022 / Revised: 29 December 2022 / Accepted: 4 January 2023 / Published: 9 January 2023
(This article belongs to the Special Issue Energy Transfer in Alternative Vehicles)

Abstract

:
Electromobility is developing rapidly in all areas of transportation, starting with small personal vehicles and passenger cars through public transportation vehicles and ending with noticeable expansion in the area of urban transportation services. So far, however, there is a lack of research determining how the effect of load weight defines the energy intensity of a vehicle under real conditions, especially in the areas of urban, suburban and highway driving. Therefore, this paper presents an analysis of a representative delivery vehicle and its energy consumption in two transportation scenarios where cargo weight is a variable. A survey was also conducted to determine the actual demand and requirements placed on the electric vehicle by transportation companies.

1. Introduction

For a number of years now, road transport has gone through considerable alteration. Ongoing research on more efficient, yet environmentally friendly powertrains supports the EU’s 2030 climate policy implementation [1]. However, most attention is paid to passenger car electrification, overlooking the need for heavy-duty (HDV) and light-duty (LDV) vehicle customization. In compliance with European Environment Agency insights, HDVs, i.e., buses, coaches, and trucks, account for approximately a quarter of the carbon dioxide (CO2) emissions from road transport in the EU. Poland, as a holder of the largest truck fleet in EU, contributes to these emissions for the most part [2]. In order to launch a general road transport transformation, a framework for HDV and LDV electrification should be developed.
Profound discussion regarding electrification of heavy vehicles has considerable potential to direct the further development of electromobility in general. Research conducted in the past drew key conclusions that the crucial parameter influencing electric vehicles energy consumption is their mass [3,4,5]. In contrast to vehicles with conventional powertrains, where the engine power is the leading light in the fuel consumption rate, performance of vehicles driven by electric motors is not as reliant on the rated motor power. Such a feature, correlated with the high overall efficiency of electric powertrains, may shed light on the success of small EVs, notably evident in urban areas. Electro-micromobility is the central thread of pursuing change in the urban transport structure [6]. Cities worldwide have already experienced adjustments in the used and obtainable means of transport. This trend is intensely fostered through vehicle-sharing systems advancement and broadening the accessibility of electric means of microtransport, just as a couple of examples [7,8,9]. While micromobility is undoubtedly suitable for city residents’ transportation, it will not meet the requirements of the transportation of mass goods. This need should not be omitted, as delivery vans are becoming a more and more common element of urban structures, due to the rapid rise in popularity of online shopping [10].
Scientists have already acknowledged this issue, beginning to conduct examinations verifying the actual suitability of electric vans for delivery and transportation companies. Most of these studies are focused on analyzing a variety of delivery scenarios by means of algorithms and thus proposing the best charging stations’ arrangement to overcome battery capacity limitations [11,12,13,14,15,16]. The conclusions and proposed adjustments are fundamental for reasonable planning of road infrastructure modification; however, they mostly do not consider real driving conditions, including traffic, variable loads, and driving style.
One of the possibilities to conduct research that takes account of the wide range of potential variables is to carry out road tests performed in compliance with the RDE (real driving emissions) procedure. It allows the counting of different road infrastructures, traffic, road slopes, and driving behaviors, simultaneously assuring compliance with European Union regulations test procedures [17]. Thanks to the prescriptive test method, results obtained for the different vehicle and powertrain models can be compared and submitted for analysis. While the RDE tests are focused on reflecting the vehicle’s impact on the environment, research that draws on their procedures but omits exhaust emission analysis is referred to as testing RDC (real driving conditions) [18,19]. Such examinations have been performed in the past; however, they regarded combustion engine, hybrid, and electric passenger cars for the most part [20,21,22,23,24,25,26,27]. Thereby, the electrification potential of HDVs and LDVs remains an insufficiently researched subject.
According to the data presented in Table 1, the number of both passenger EVs and large EVs registered in Poland has doubled year on year since 2019. While such an increasing rate is highly desirable, it is clearly seen that large EVs still play a minor role in the global service sector. To reach the goal of climate neutrality, immediate changes in this area are needed.
Light-duty vehicles, being so far challenging for electrification, remain a common element of the urban landscape and thus have an input into cities’ noise and air pollution. Moreover, the demand for the road freight transport has been continuously growing. The necessity to undertake further actions aiming to decarbonize the transport sector has encouraged authors to pursue research on the actual usage potential of electric delivery vans. With the aim of conducting tests possibly akin to real-life driving conditions, a survey has been created. The questionnaire focuses on gathering data that portray the expectations imposed on the delivery vehicles, as well as actions that could possibly spur users to turn to electromobility.
This article consists of six main sections. The first one describes the general research problem and presents the current state of the Polish fleet of various EVs. The second chapter is covers the survey that was disseminated among transport companies and other relevant businesses and data gathered on their demand for electromobility. The third part describes the research objective: details regarding vehicles chosen for tests and the software utilized for data gathering. In the fourth section, a description of the routes driven during examinations and weather conditions on the measurement days can be found. The fifth chapter is a comprehensive presentation of results and data analysis, while the sixth one contains a conclusion and guidelines for light-duty fleet electrification.
The information gathered throughout the series of driving tests combined with the interviewees’ answers may serve as a comprehensive guide for electrification of the light-duty vehicle fleet.

2. Survey Assessment: Guidelines and Demand of Transport Companies for Electromobility

2.1. Questionnaire Design

For familiarization with the actual working conditions and the scale of electric delivery vehicle usage, a questionnaire was created. The target group consisted of individuals performing professional duties with the aid of delivery vehicles or representing relevant companies, i.e., delivery and transportation companies, as well as self-employment. The survey investigated interviewees’ perspectives on the usefulness of electric delivery vehicles at their current technological level. Moreover, interviewees’ perceptions on the ongoing projects fostering electromobility and expectations associated with them were assessed.

2.2. Data Collection
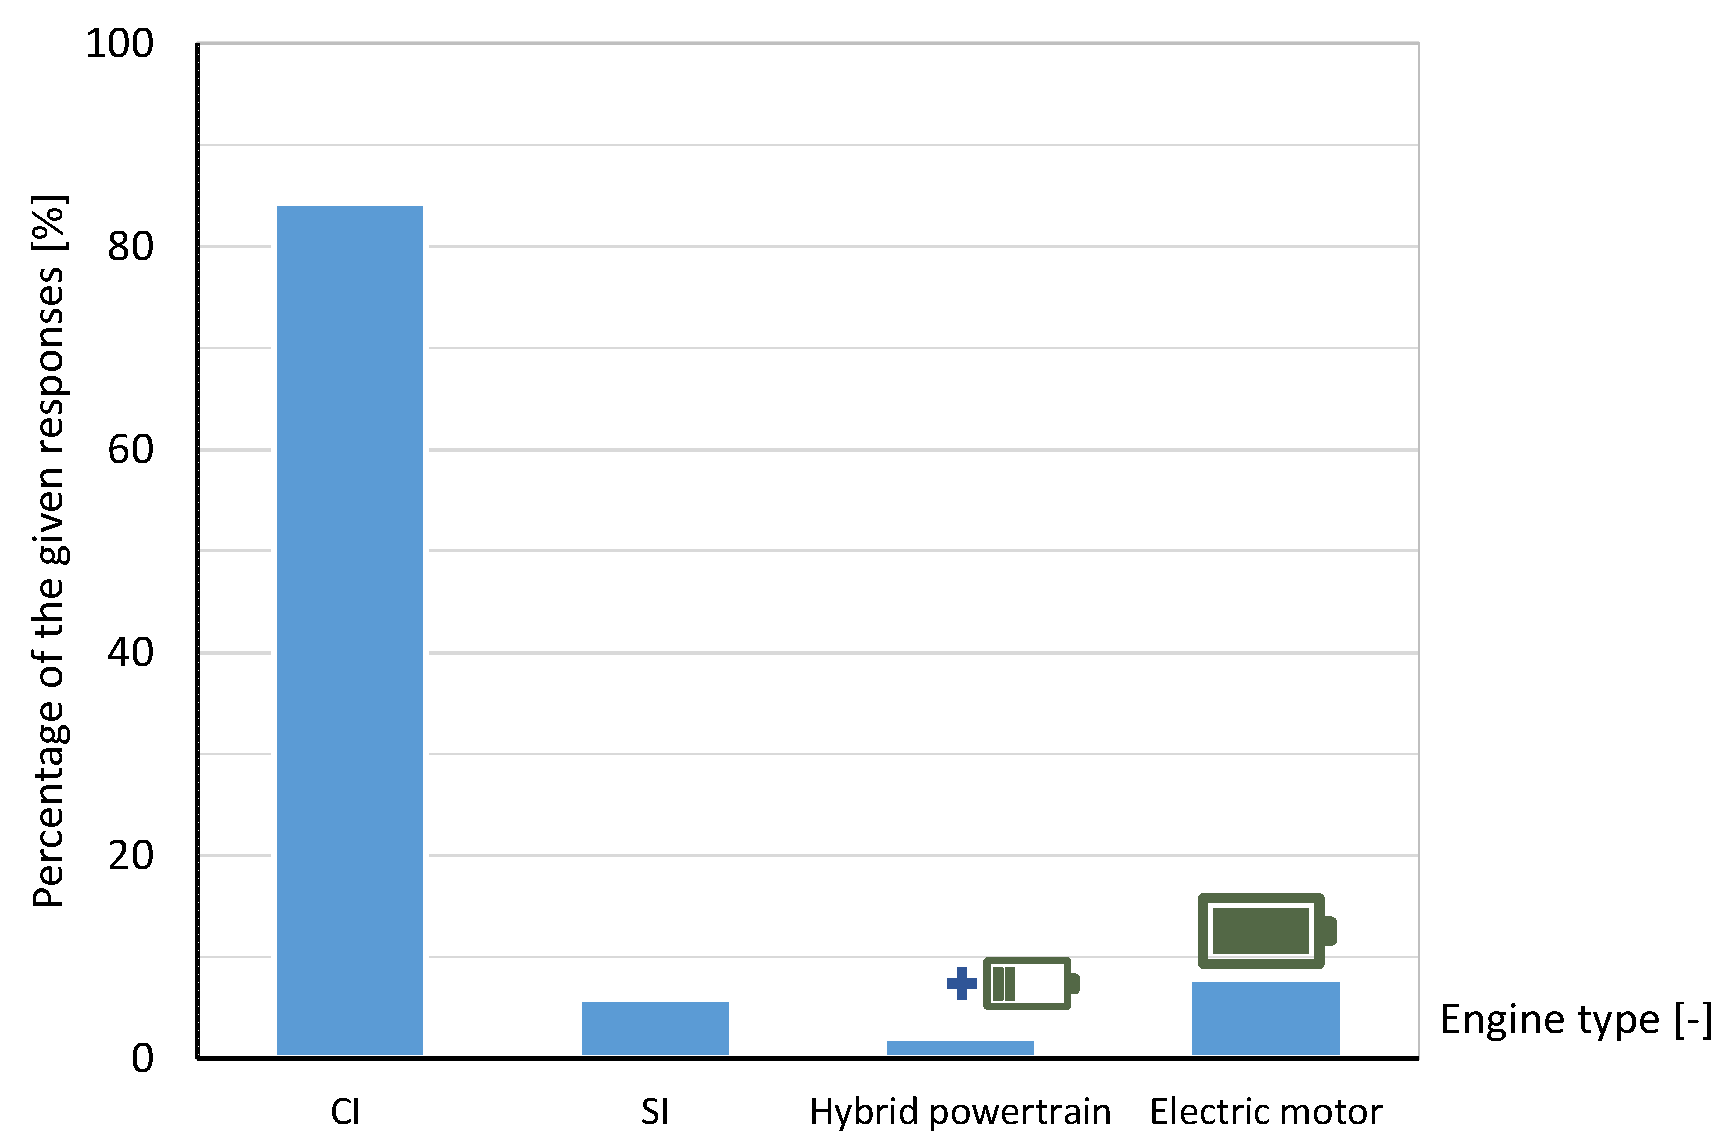
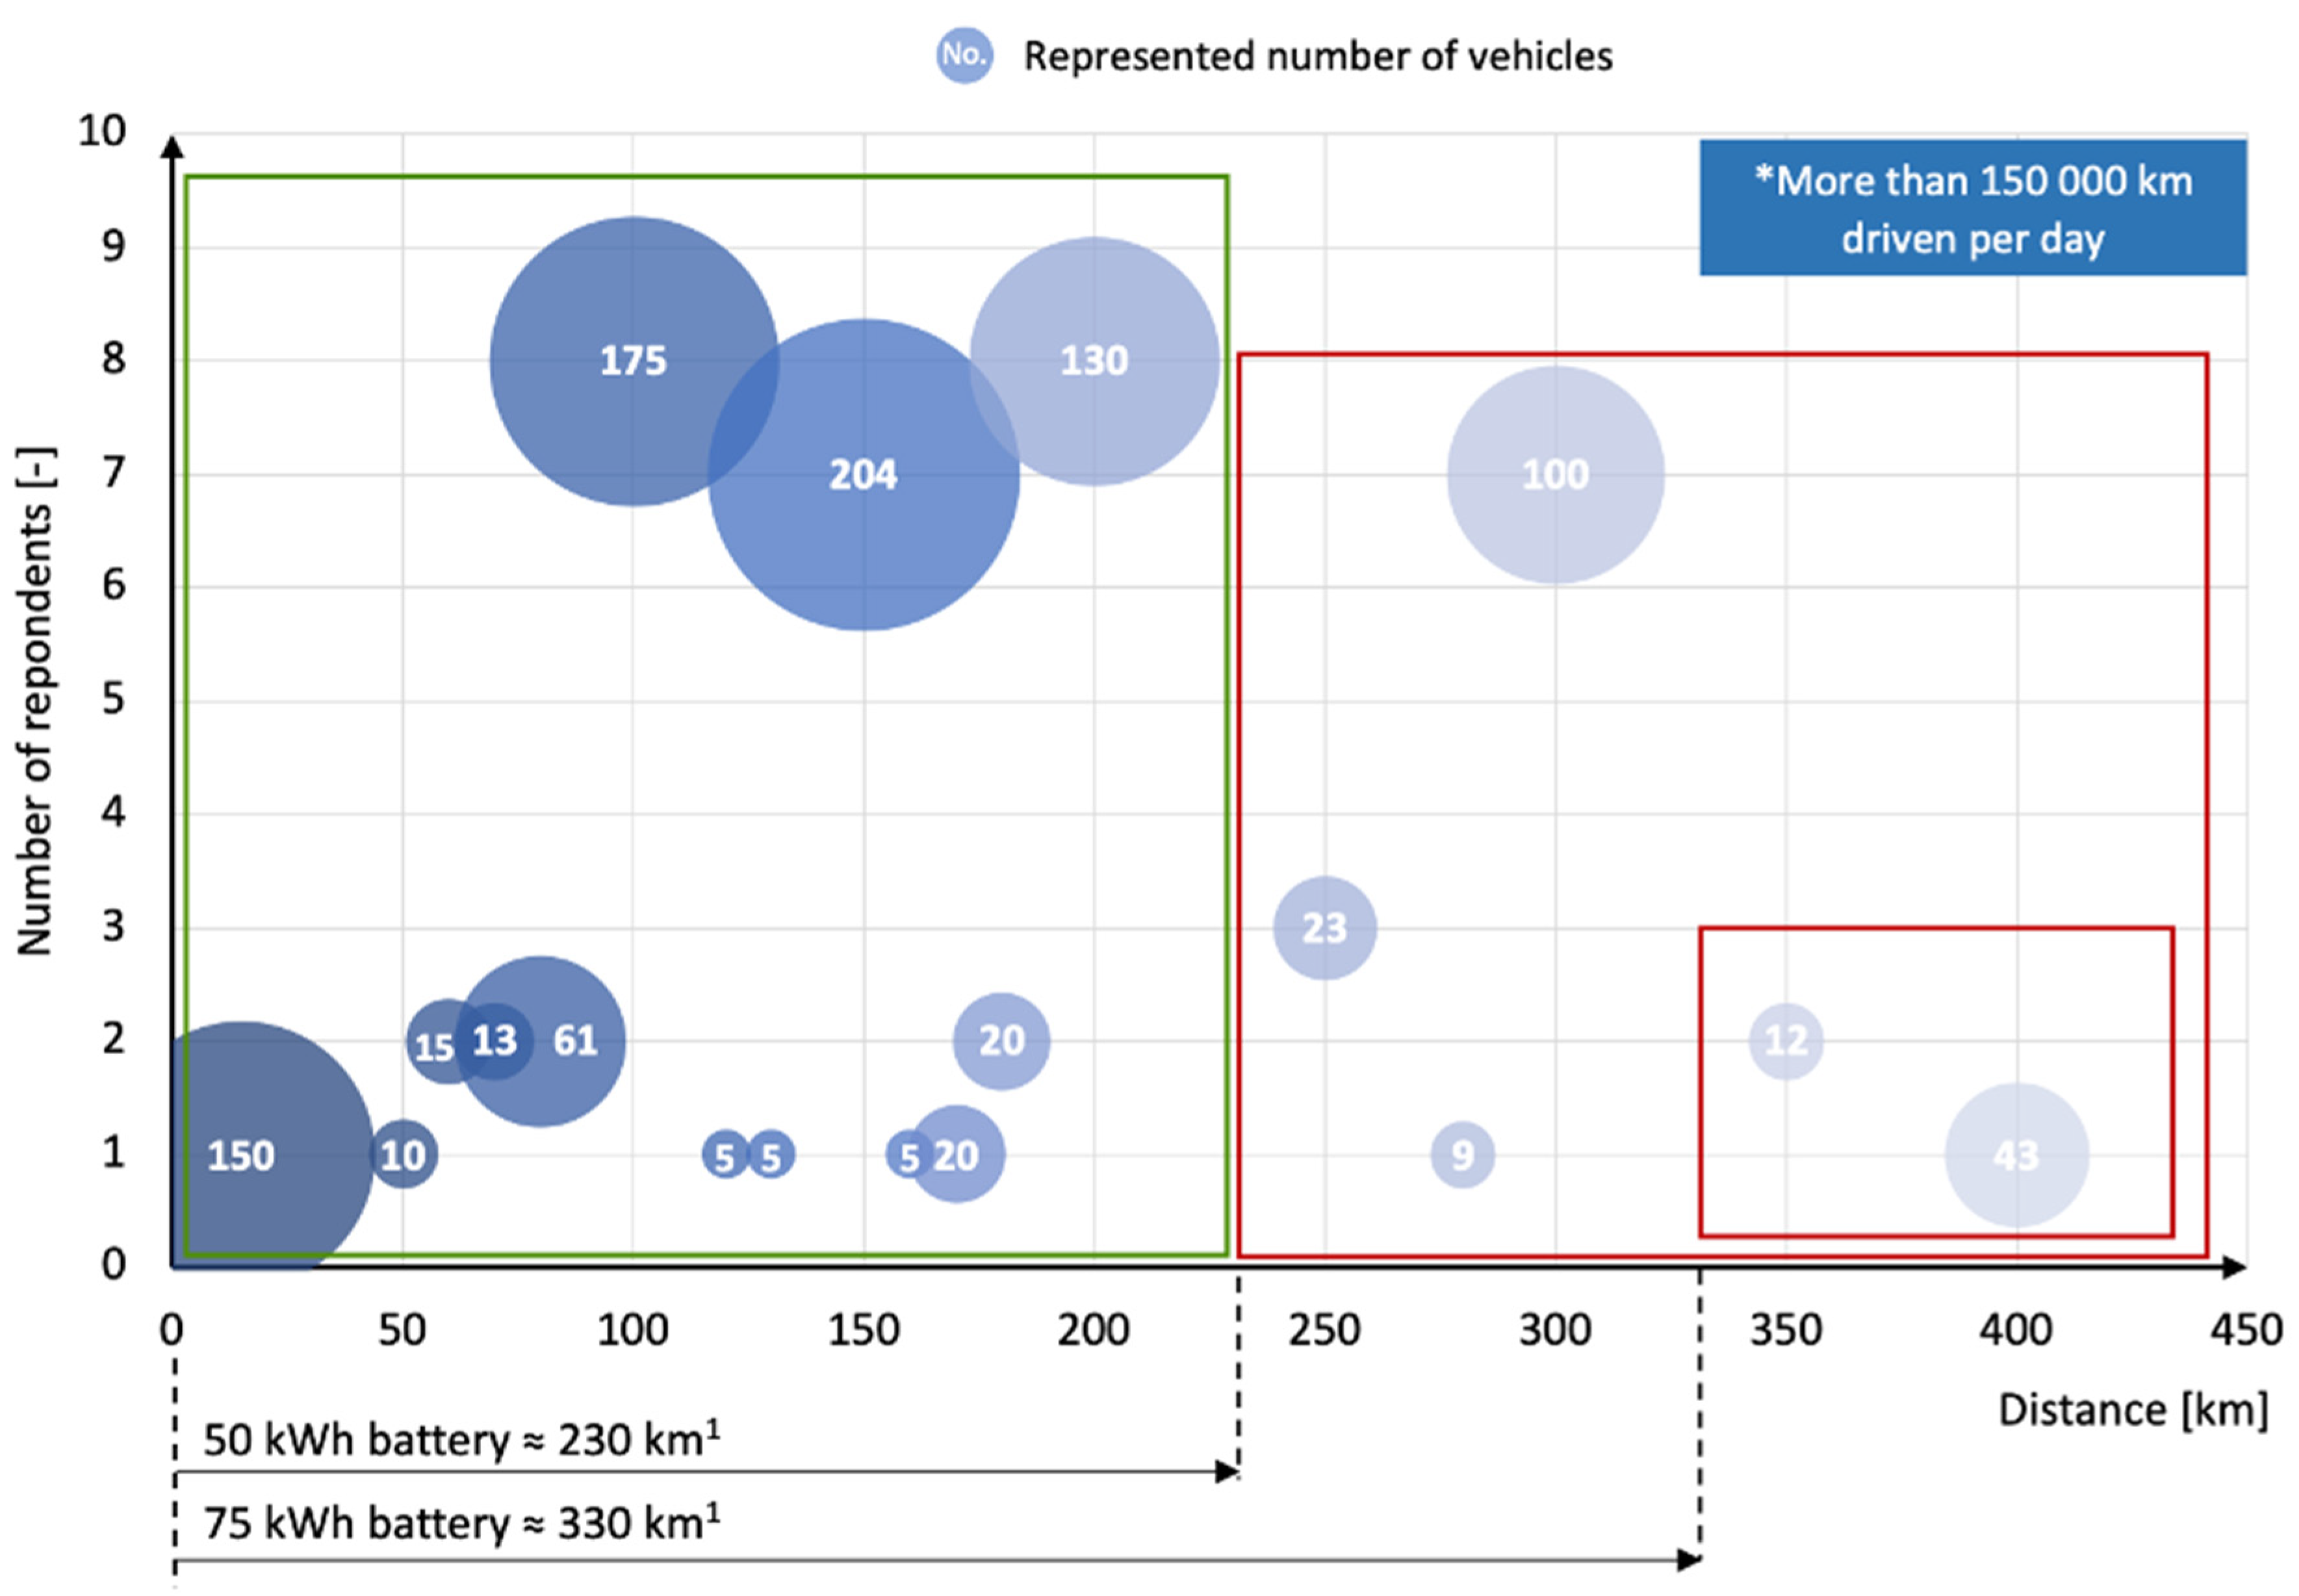
The questionnaire was designed with the aid of the Google Forms platform and disseminated online. It was distributed predominantly on media platforms among professional groups and through mailing lists to selected businesses. Video footage promoting the study and encouraging receivers to take part in the survey had been released on YouTube [29] and further advertised on social networks. Additionally, business cards containing references to the questionnaire were produced and spread around university and cooperating car dealers. The survey was available in Polish and disseminated among relevant companies and individuals across Poland. The data were collected from mid-July to mid-August 2022.

2.3. Data Analysis

A total of 51 responses were gathered. Initially, interviewees were asked about the type of propulsion with which the delivery vehicle is equipped. Obtained data show the predominant usage of CI engines in large cars, having been declared by 83% of the respondents. Delivery cars driven by electric motors were used by only 3% of the respondents, pointing to their still-modest use (Figure 1).
The number of collected survey responses represented virtually 1000 delivery vans. Both small fleets, beginning from two delivery vans, as well as large fleets comprising more than 200 vehicles, are included herein (Figure 2).
As shown in Figure 2. daily distance covered by the delivery vehicle declared by almost a third of respondents exceeds the range declared by the manufacturer for the Toyota Proace Electric with a 50 kWh battery. Greater battery capacity naturally enhances the range, but still does not meet all potential users’ needs. It should be highlighted that the theoretical range ensured by the producer is given for the unloaded car with the basic accessories package. Thus, it may be assumed that the predominant part of the electric delivery vans executing delivery or transportation services in real driving conditions, that is, with additional load and greater daily distance covered, will demand recharging during the workday, i.e., while loading or unloading. However, this solution requires infrastructure customization.
Of the examined group, 77% chose cargo vans. That statistic alone points out the reasonableness of the car model choice for the examination. Frequently chosen by users’ car bodies included Luton and city vans as well, both being represented by 22% of the answers (Figure 3). This confirms the appropriateness of the choice of research object.
Commercial vehicles are characterized by a wide variation of construction depending on their intended use, with many models of currently available vehicles available in a variety of bodies. Both passenger and cargo versions are observed, with open or closed cargo area. Selected cars available on the Polish market have been compared with each other by the basic parameters declared by manufacturers. In this way, a summary was created indicating selected electric vehicles and their range according to the WLTP test, depending on battery capacity (Figure 4).
The examined group was roughly equally divided in terms of car loading at the beginning of a workday. Merely 4% of respondents declared to take less than 100 kg of goods (Figure 5). This information should be considered notably, as load is one of the factors affecting an electric car range.
Interviewees were requested to indicate which of the ongoing projects fostering electromobility could encourage them to modify the fleet of vehicles into electric-powered models (Figure 6). Government subsidy for purchasing electric cars proved to be the most efficient way to raise the interest in electromobility. Moreover, free charging stations, as well as allowance for bus lanes usage, turned out to play an important role for potential electric delivery vehicle users.

2.4. Conclusions

Building on the survey answers, the following conclusion can be drawn:
  • Light-duty vehicles are currently predominantly equipped with CI Engines. The usage of electric motor is still modest—declared by only 3% of the respondents.
  • Almost a third of the respondents declared the average daily distance covered being greater than 230 km, which is the range declared by the manufacturer for the Toyota Proace Electric with a 50 kWh battery.
  • The cargo van is the most frequently chosen light-duty vehicle body type.
  • Government subsidies for purchasing electric cars, free charging stations and allowance for bus lane usage proved to be the most efficient ways to raise interest in electromobility.
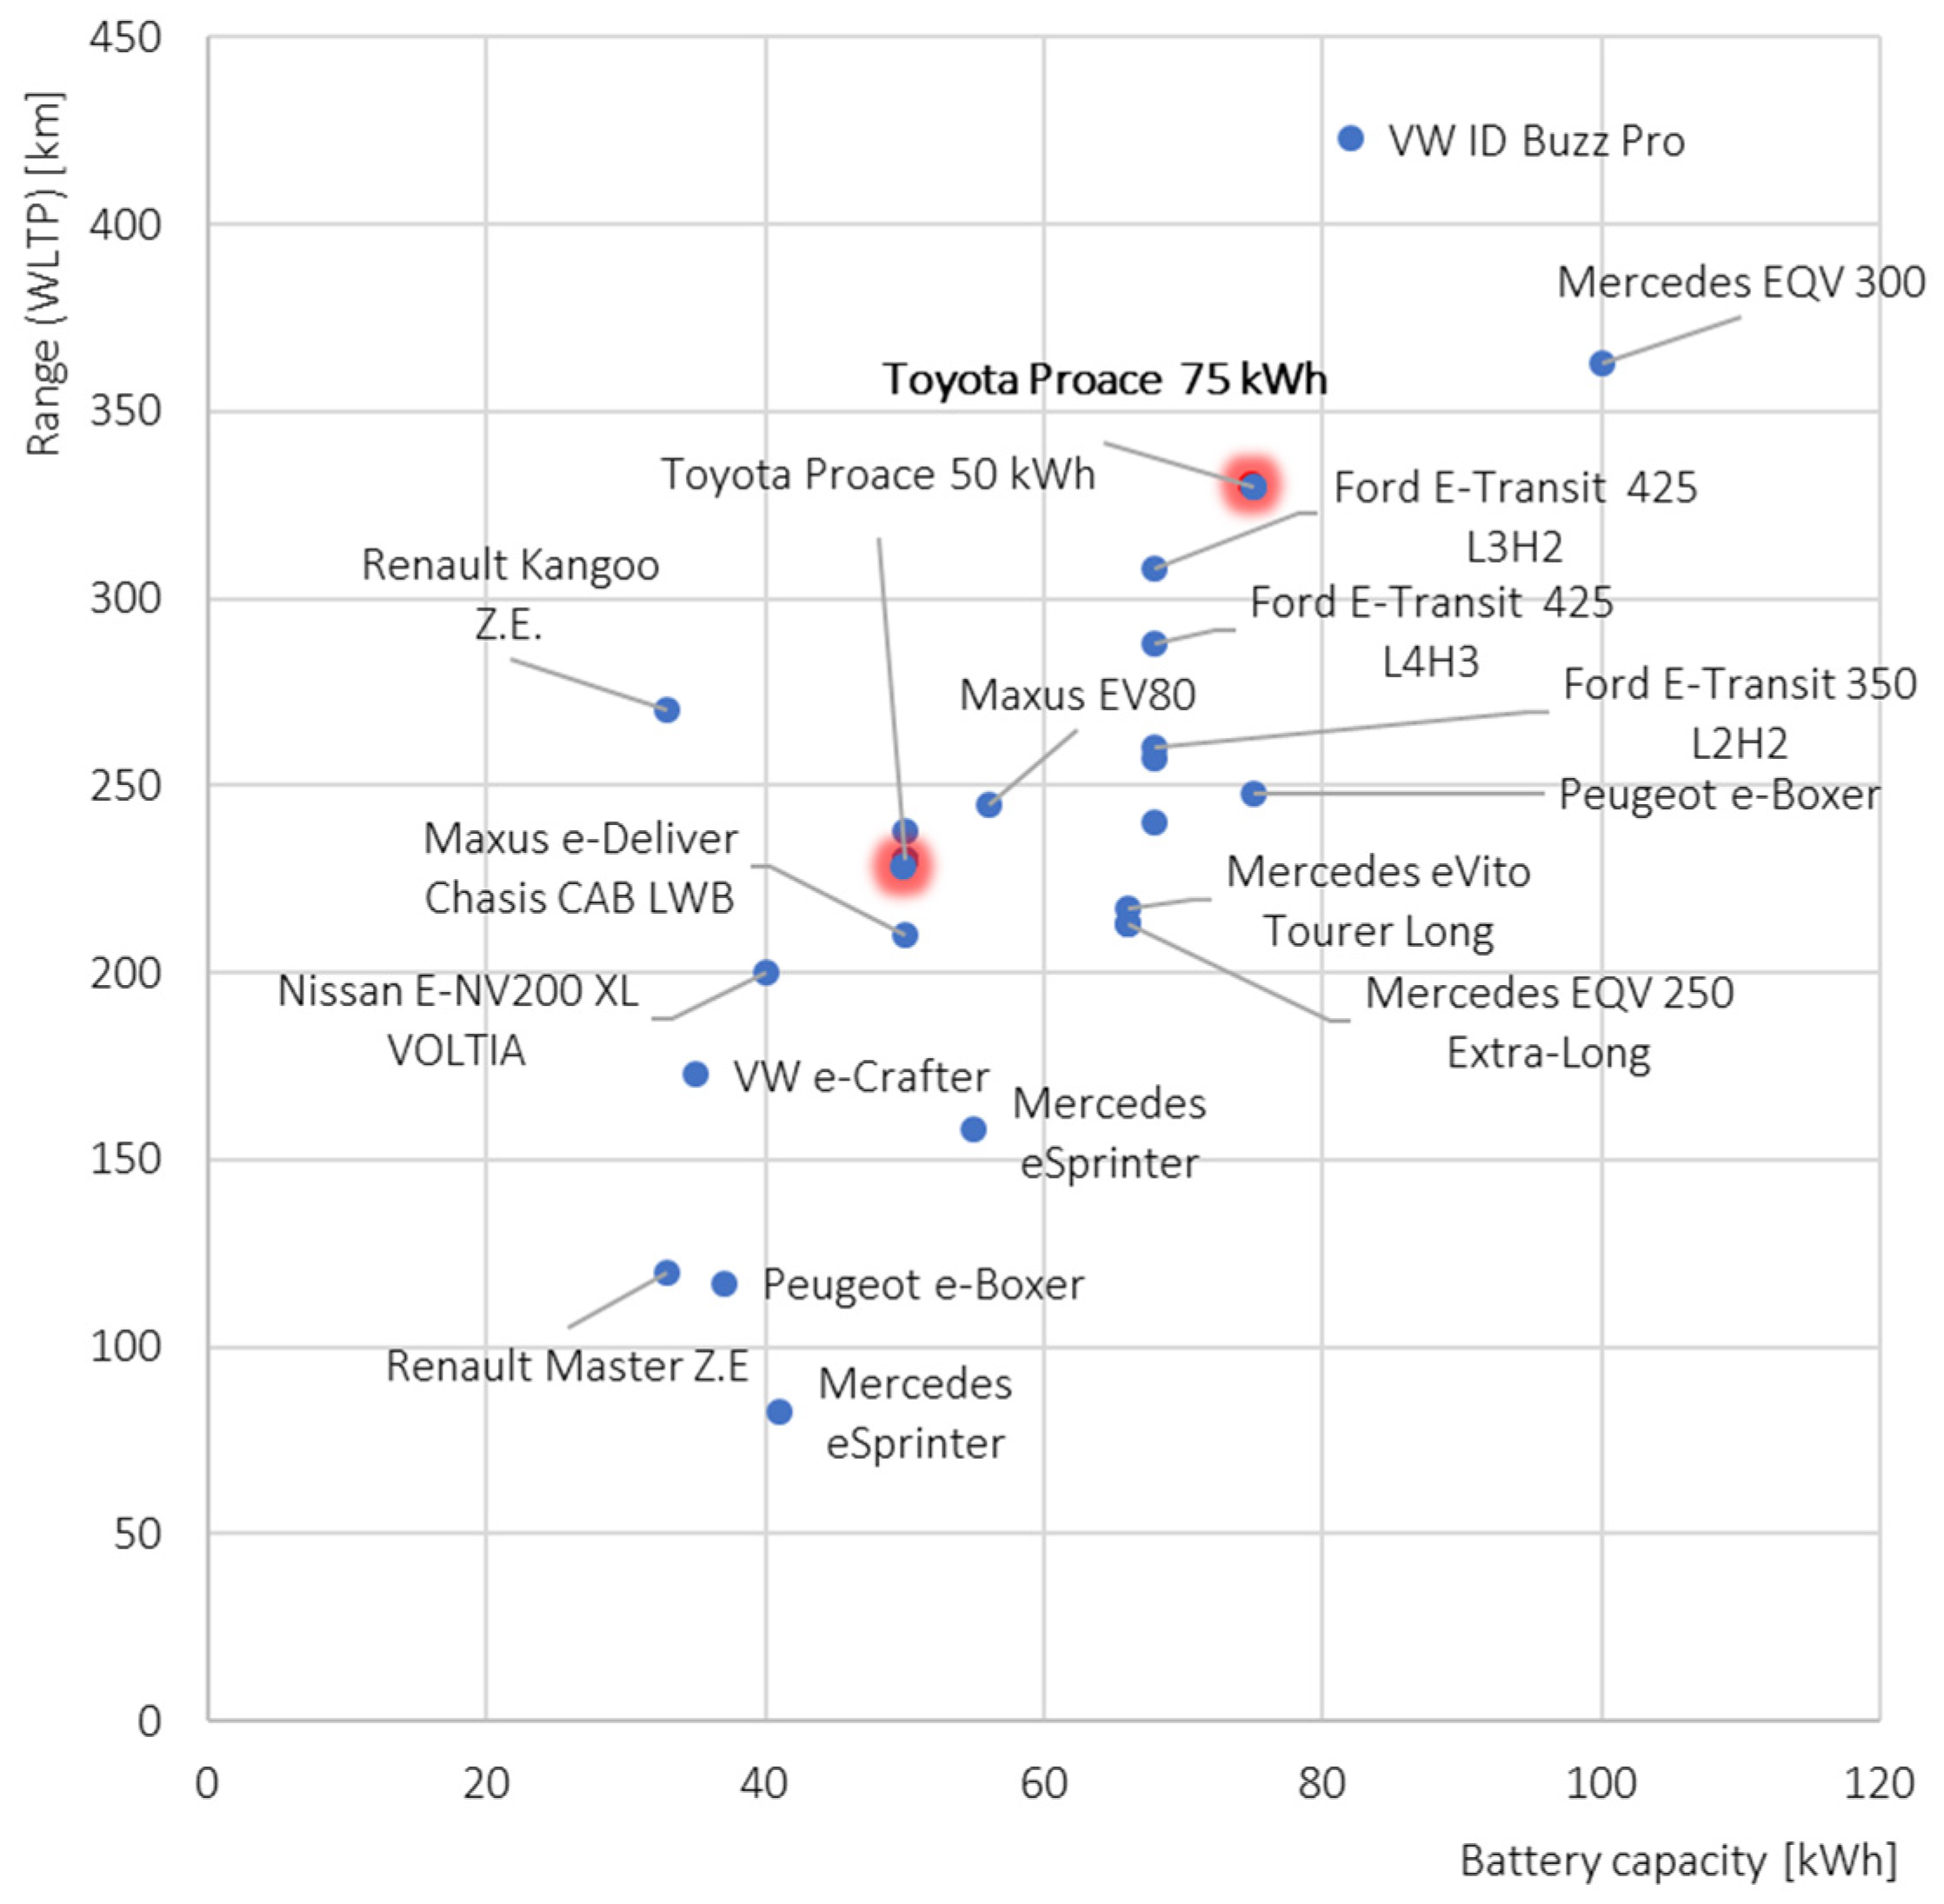
3. Research Object

The electric vehicle under test was a cargo van-type body structure. Its GVW is 3055 kg, and in the provided version of the equipment for the road tests conducted, the weight of the vehicle was 2115 kg (the weight limits related to the tested vehicle are shown in Figure 7; these values are presented on the basis of the registration certificate, which is an approval document showing the parameters of a specific model, and on the basis of the manufacturer’s data). Based on these values, the vehicle’s loading ranges were determined, defining the carrying capacity.
During the tests, the vehicle was equipped with a diagnostic system consisting of a diagnostic computer and a GPS signal recorder (Figure 8). The vehicle was equipped with a 75 kWh battery (optionally, the vehicle can also be equipped with a smaller 50 kWh battery capacity). Despite the available space, larger battery capacities are not available, which is determined by the maximum allowable weight of the vehicle. Data were collected with the use of an OBD diagnostic system and GPS module. The OBD system allowed the gathering of parameters related to the powertrain or the high-voltage battery performance. The frequency of data collection equaled 2 Hz.
In its current configuration, the vehicle can be loaded with a weight of 940 kg. This weight represents both the weight of the load space goods and the weight of the driver and passengers. Therefore, when taking into account the maximum possible loading weight, it is necessary to take into account the weight of the vehicle’s users as well (in the tested version, the homologation specifies three people in the passenger compartment). The research reported in the current work concerns the analysis of the maximum loading weight, that is, the weight of the driver (90 kg) and a cargo weight of 850 kg (Figure 9).
The realized research aims to assess the actual power consumption of an electric delivery car both in real traffic conditions and real driving conditions that include the influence of a load on the powertrain performance. An electric vehicle (EV), contrary to a hybrid (HEV) or a fuel cell (FCEV) vehicle, is characterized by considerably fewer powertrain operating modes. Considering the drive phase only, two modes can be differentiated: drive mode, during which the high voltage battery is discharged and deceleration mode, when the battery is recharged (Figure 10). The high-voltage battery may by charged with the aid of an external power source; however in this research, the charging process analysis is regarded as not a critical element.

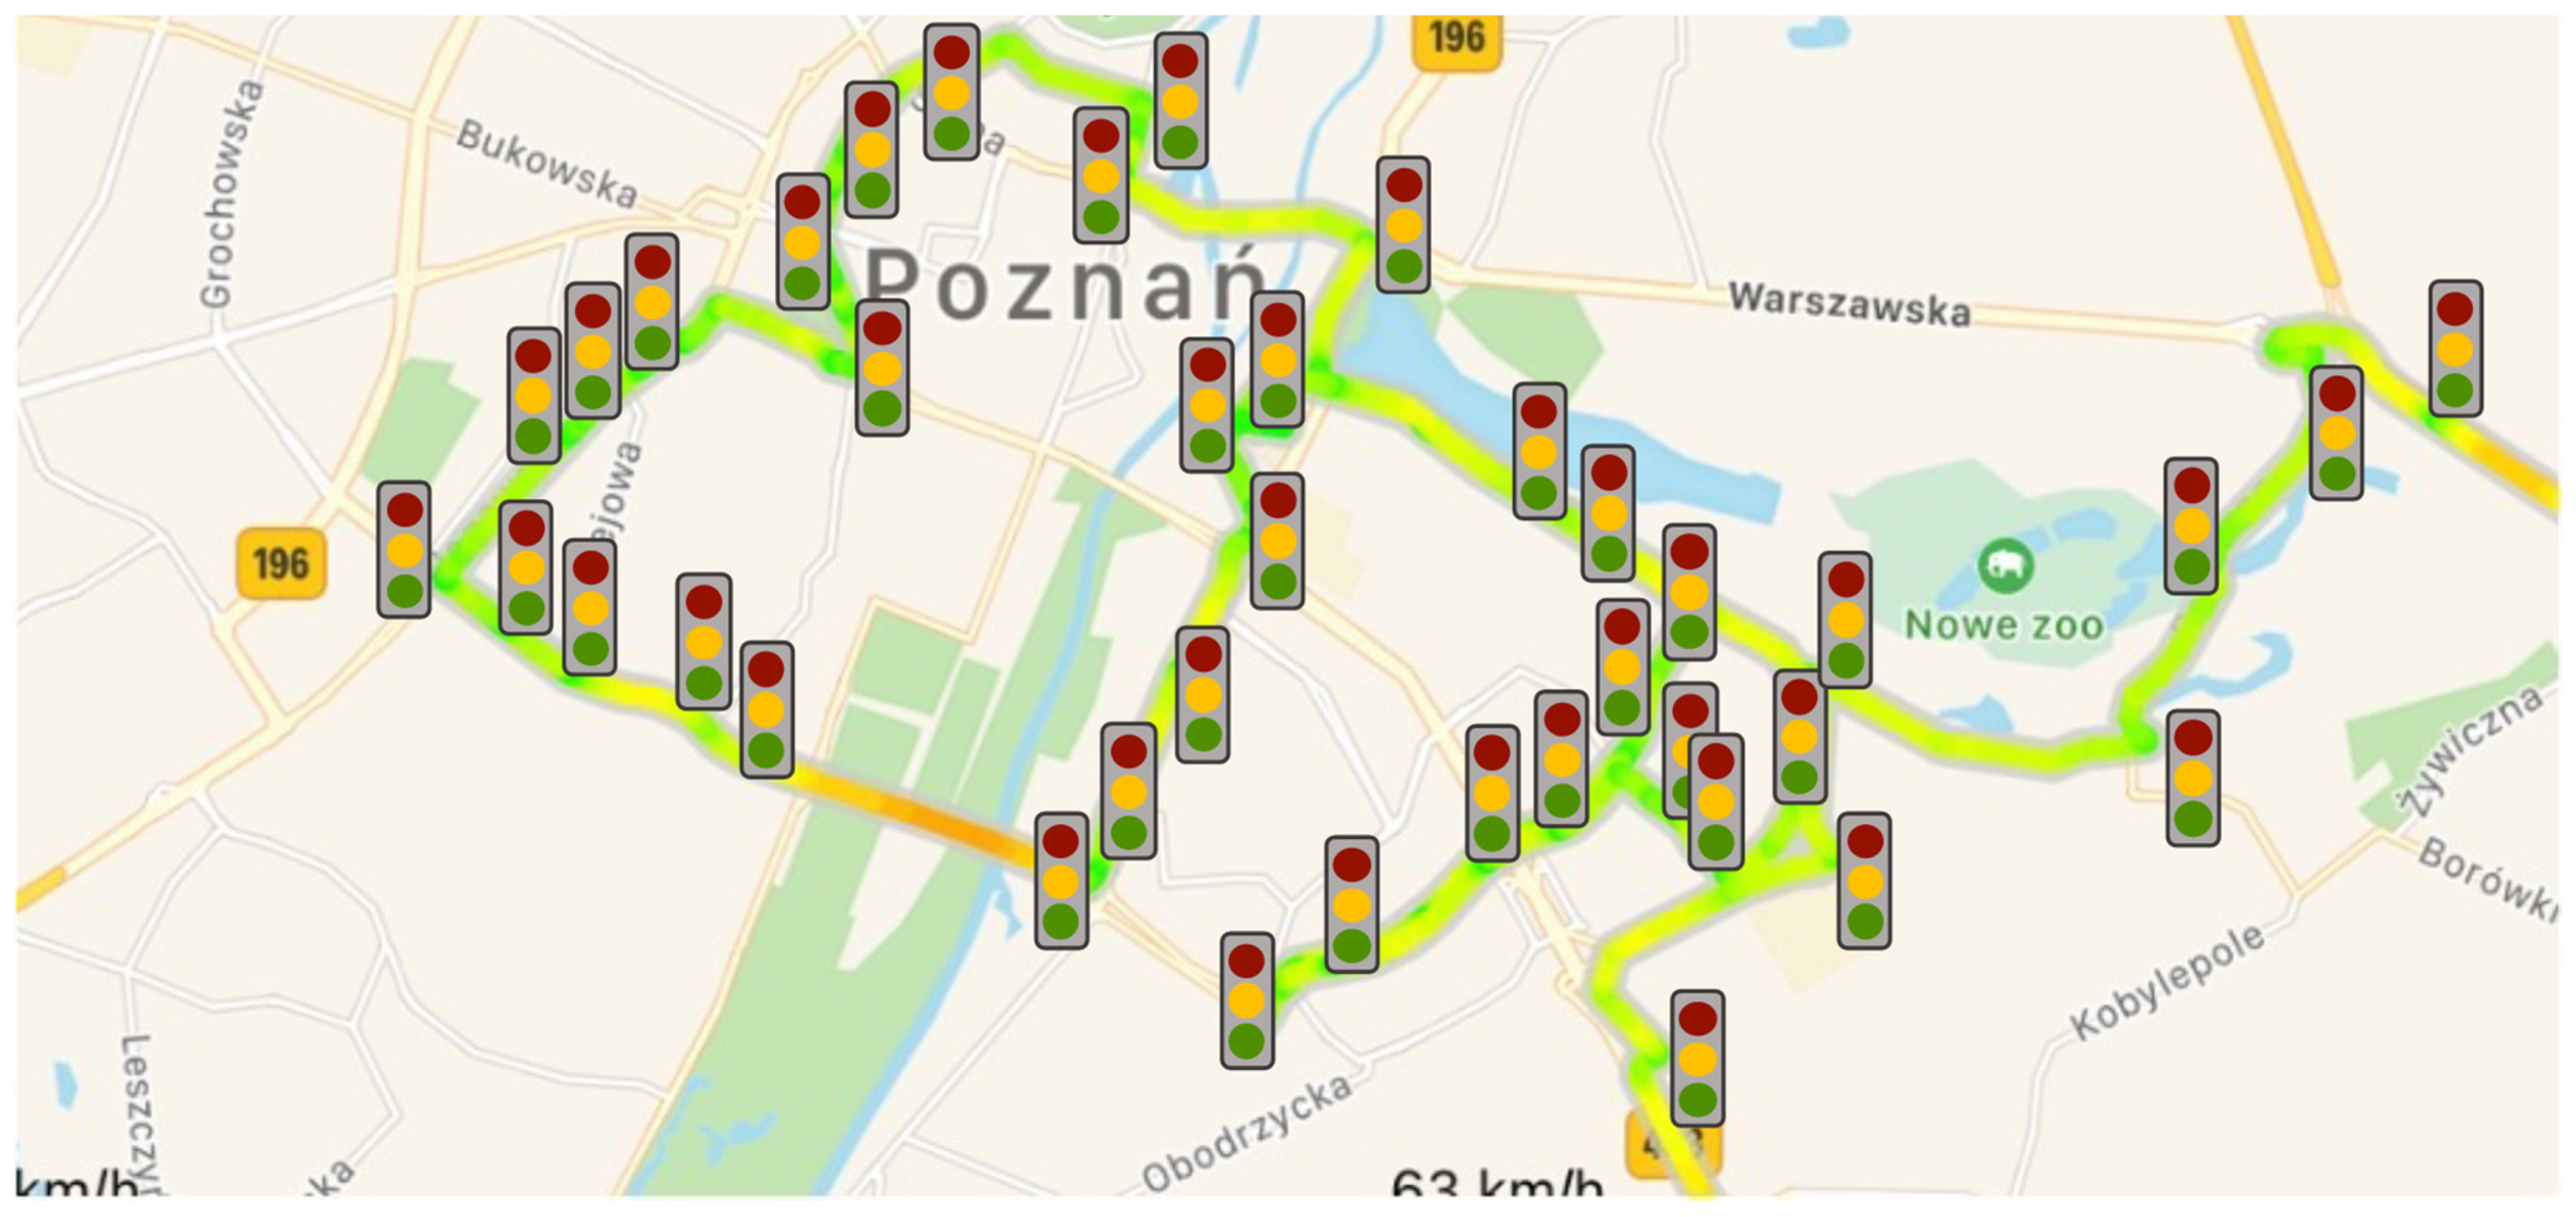
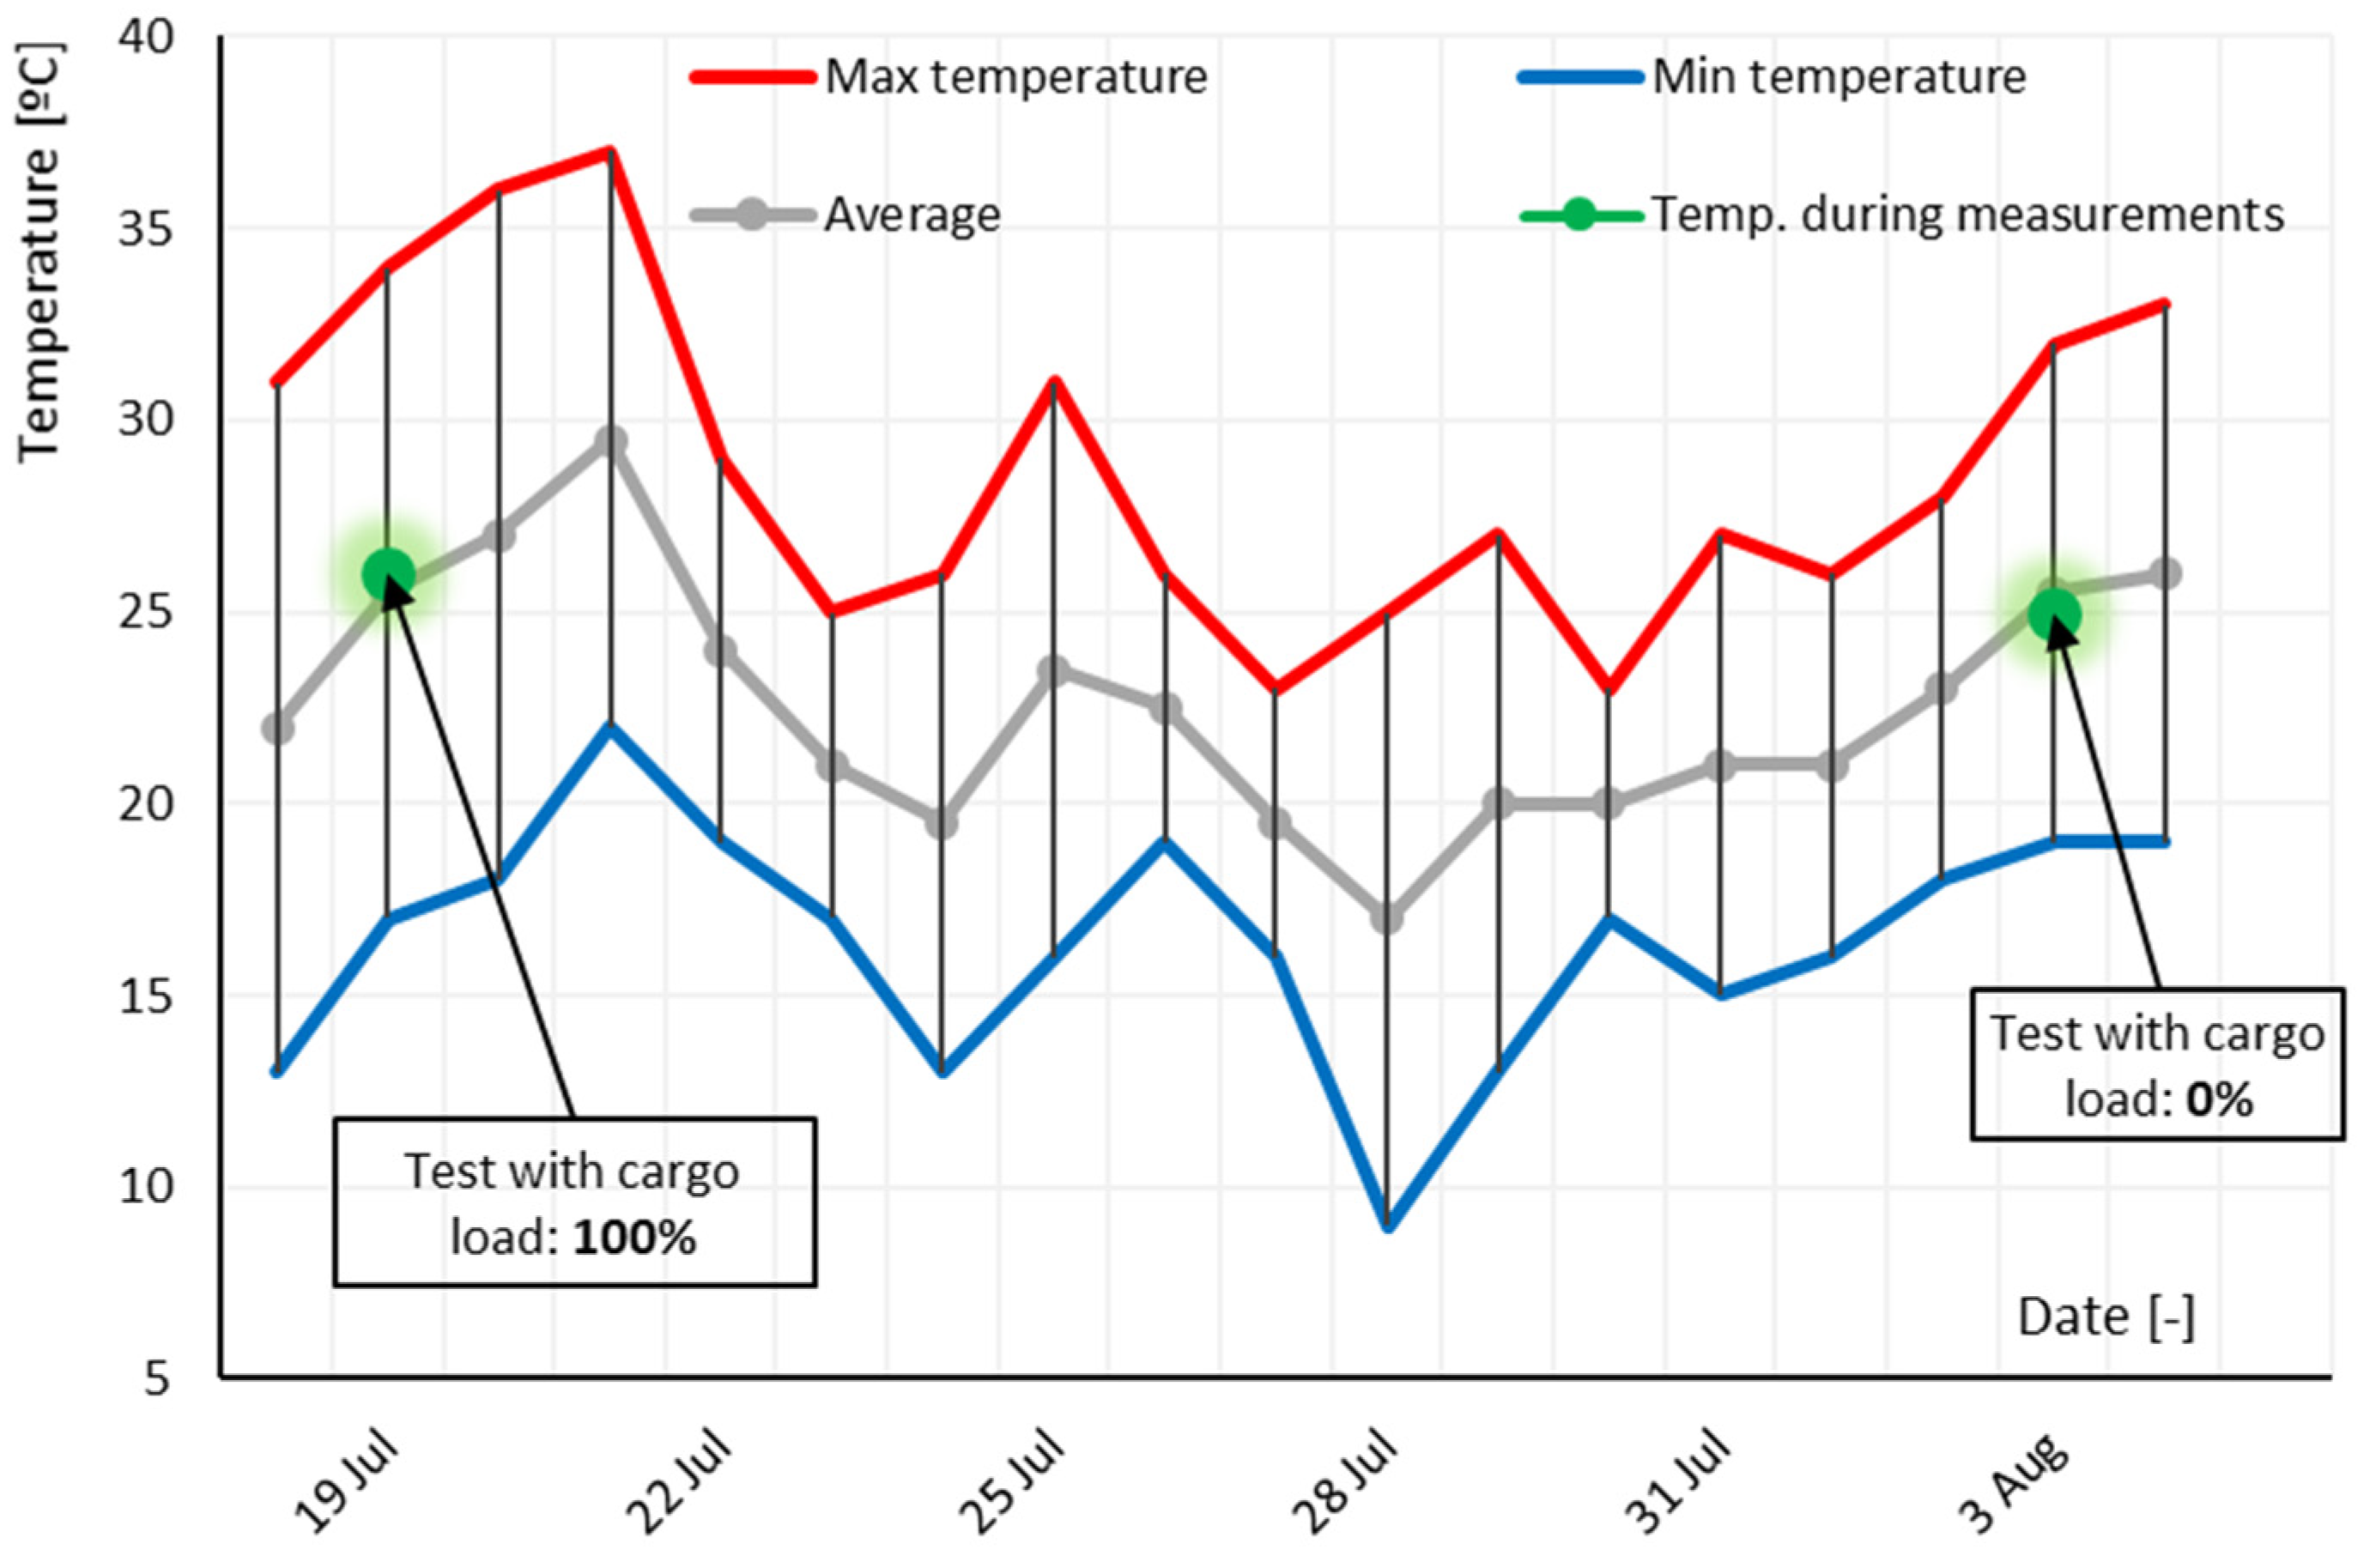
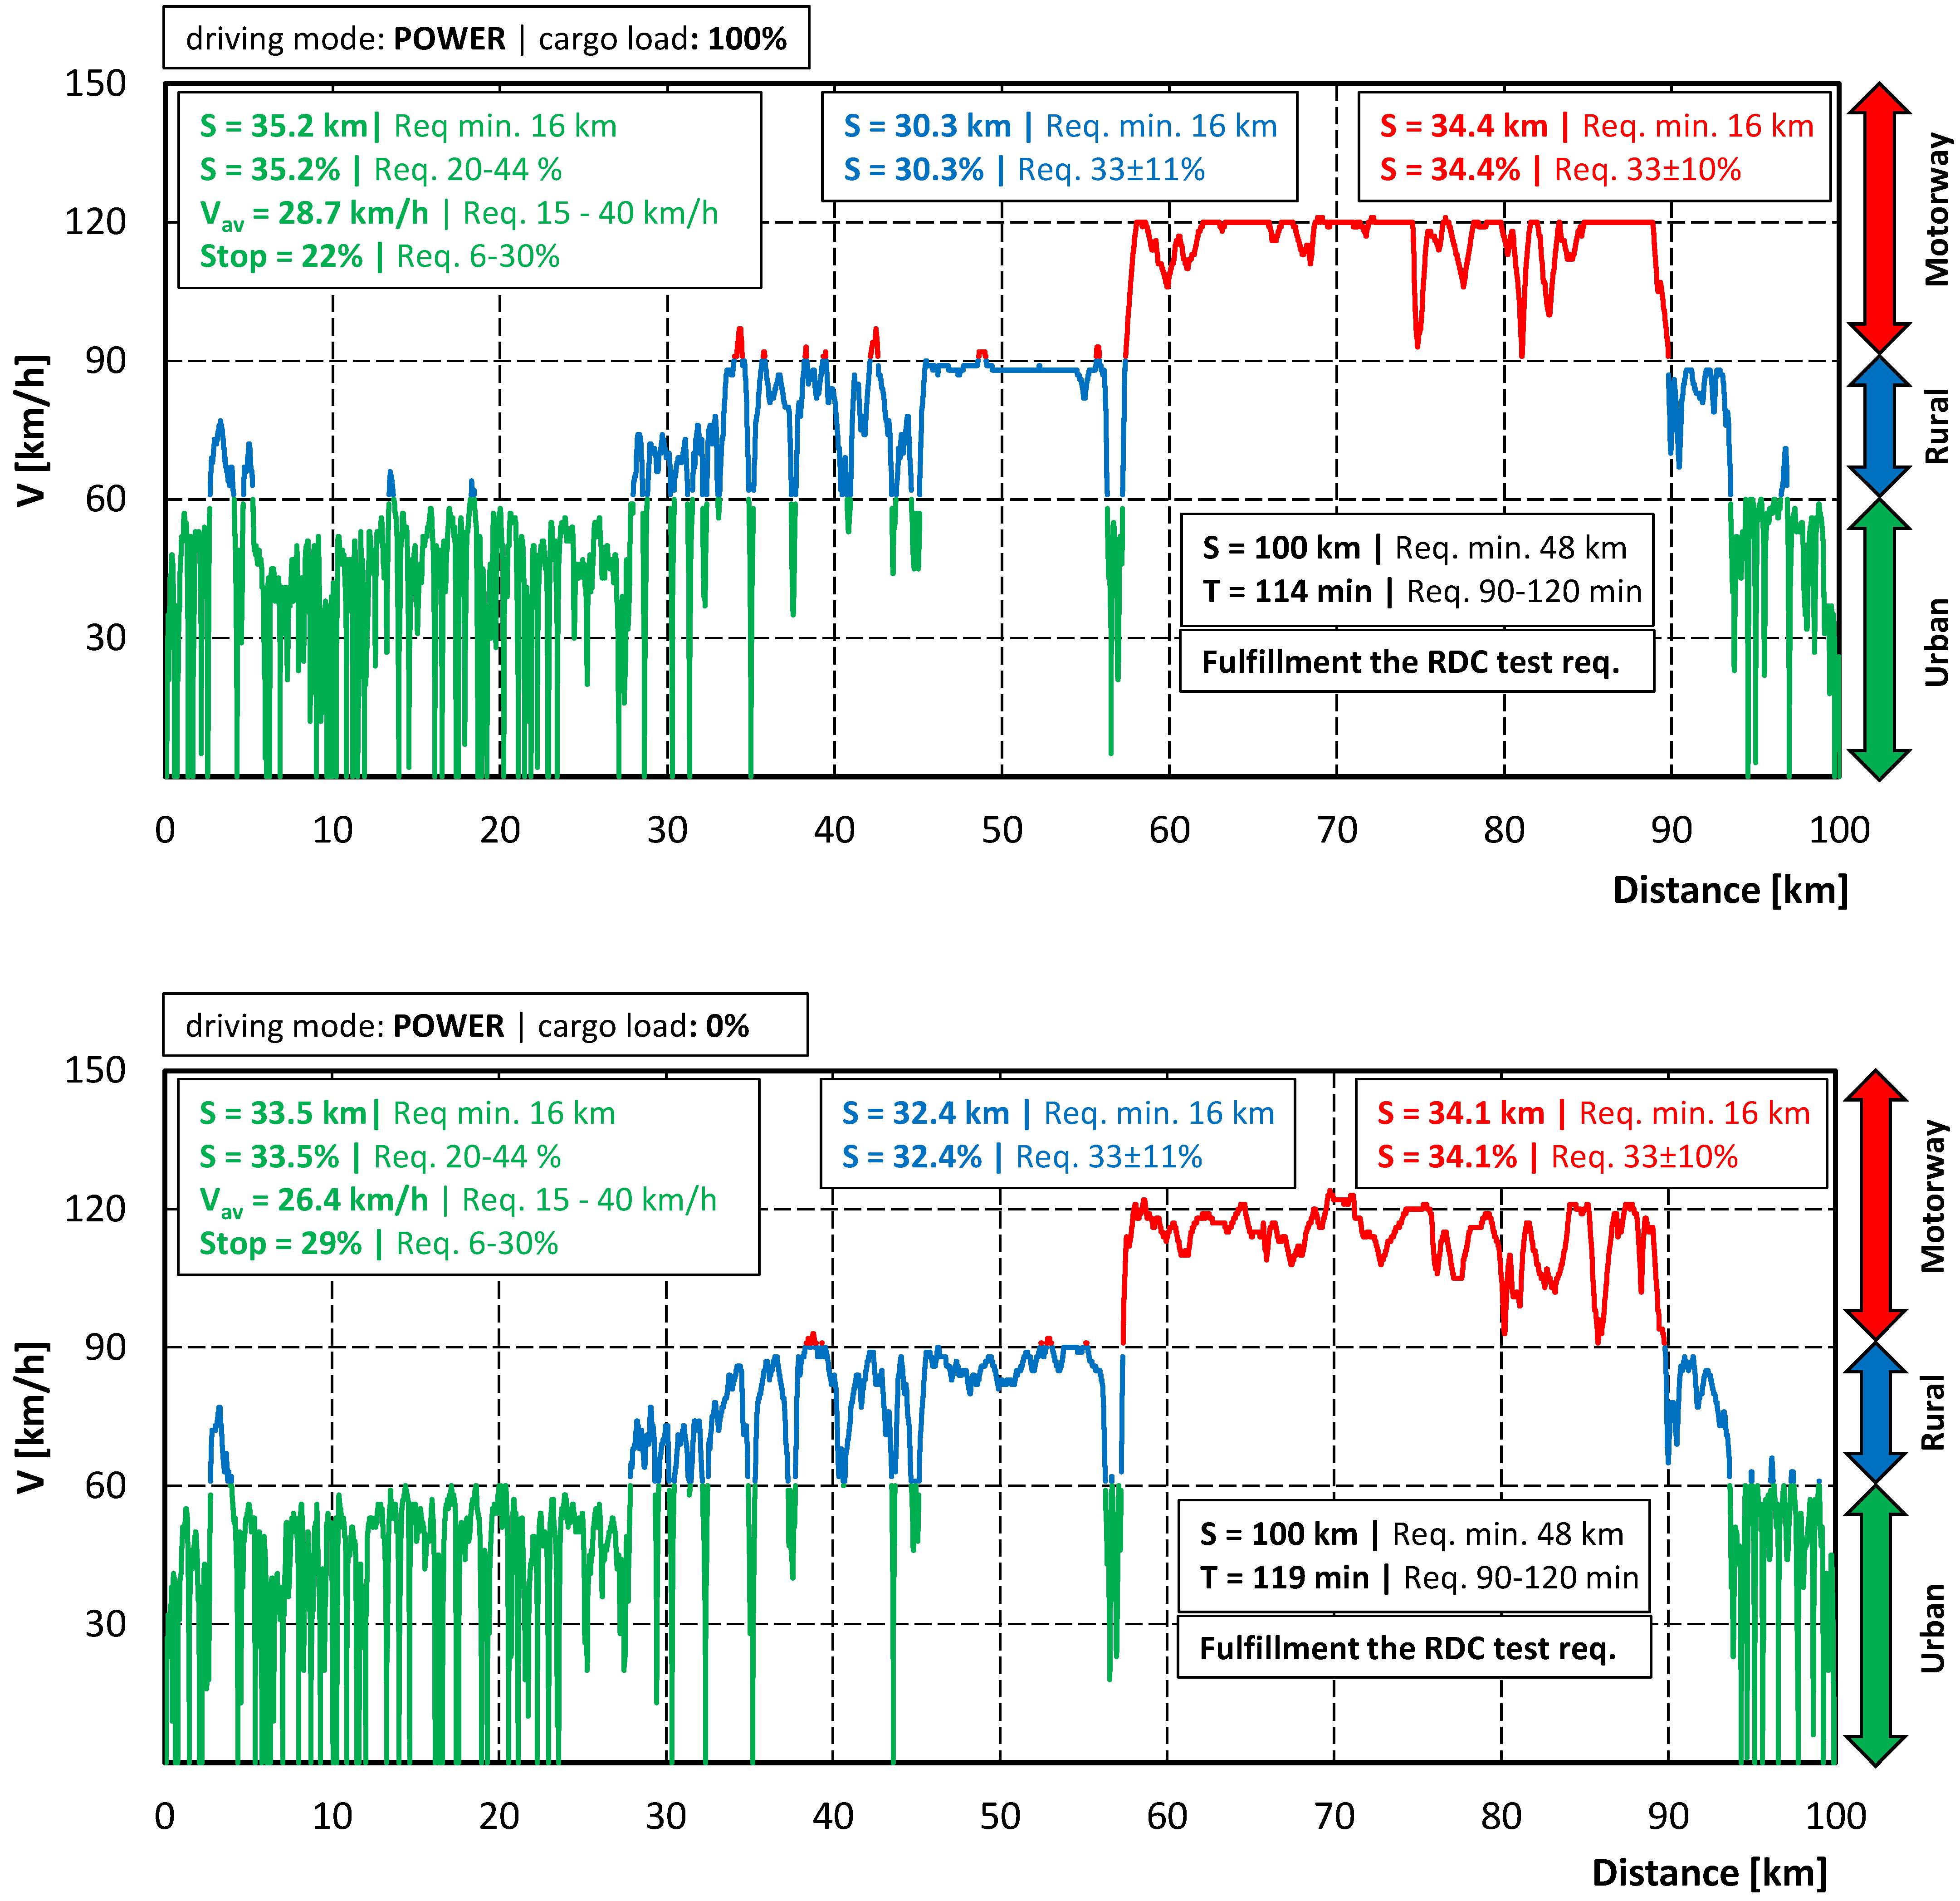
4. Measurement Route and Conditions
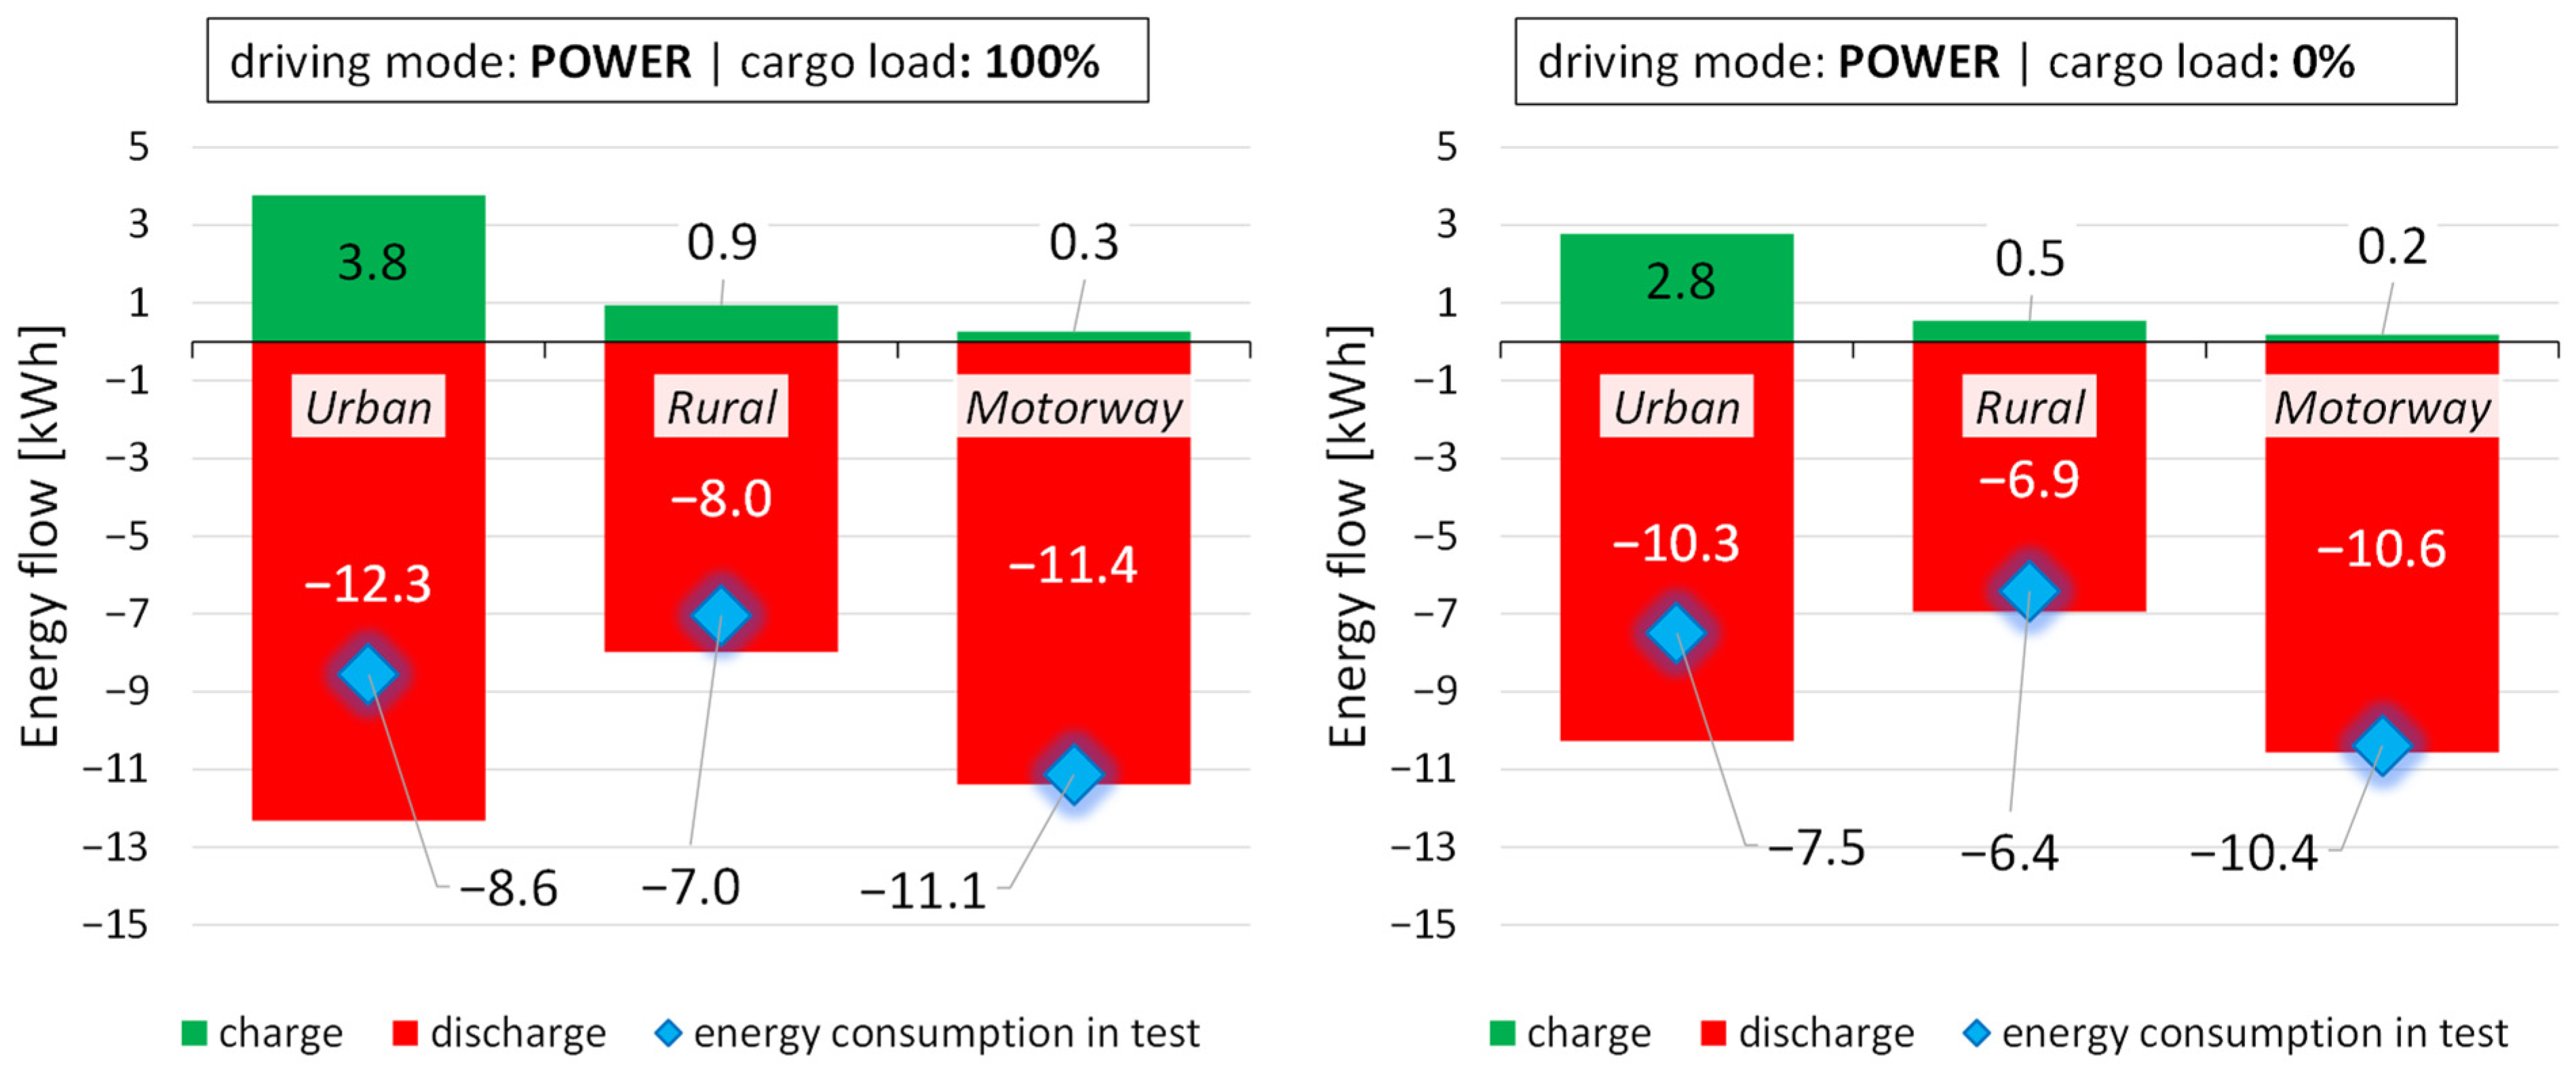
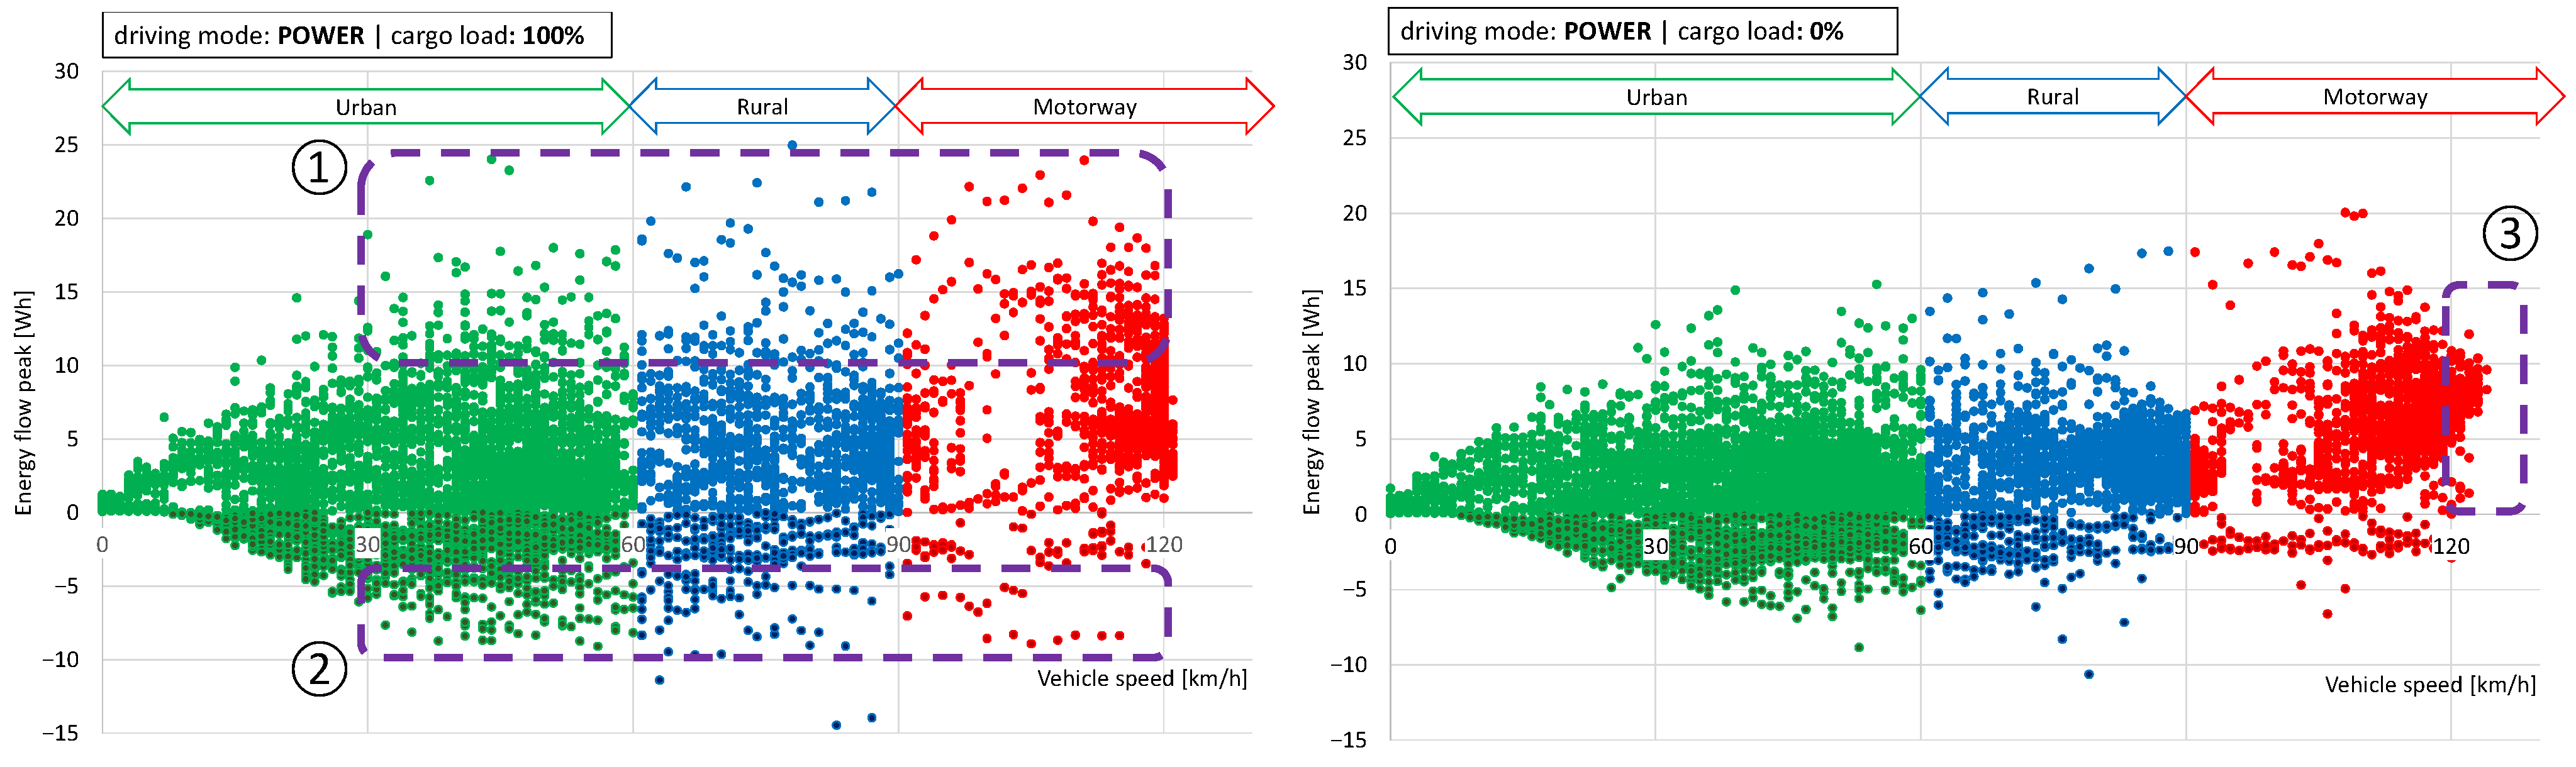
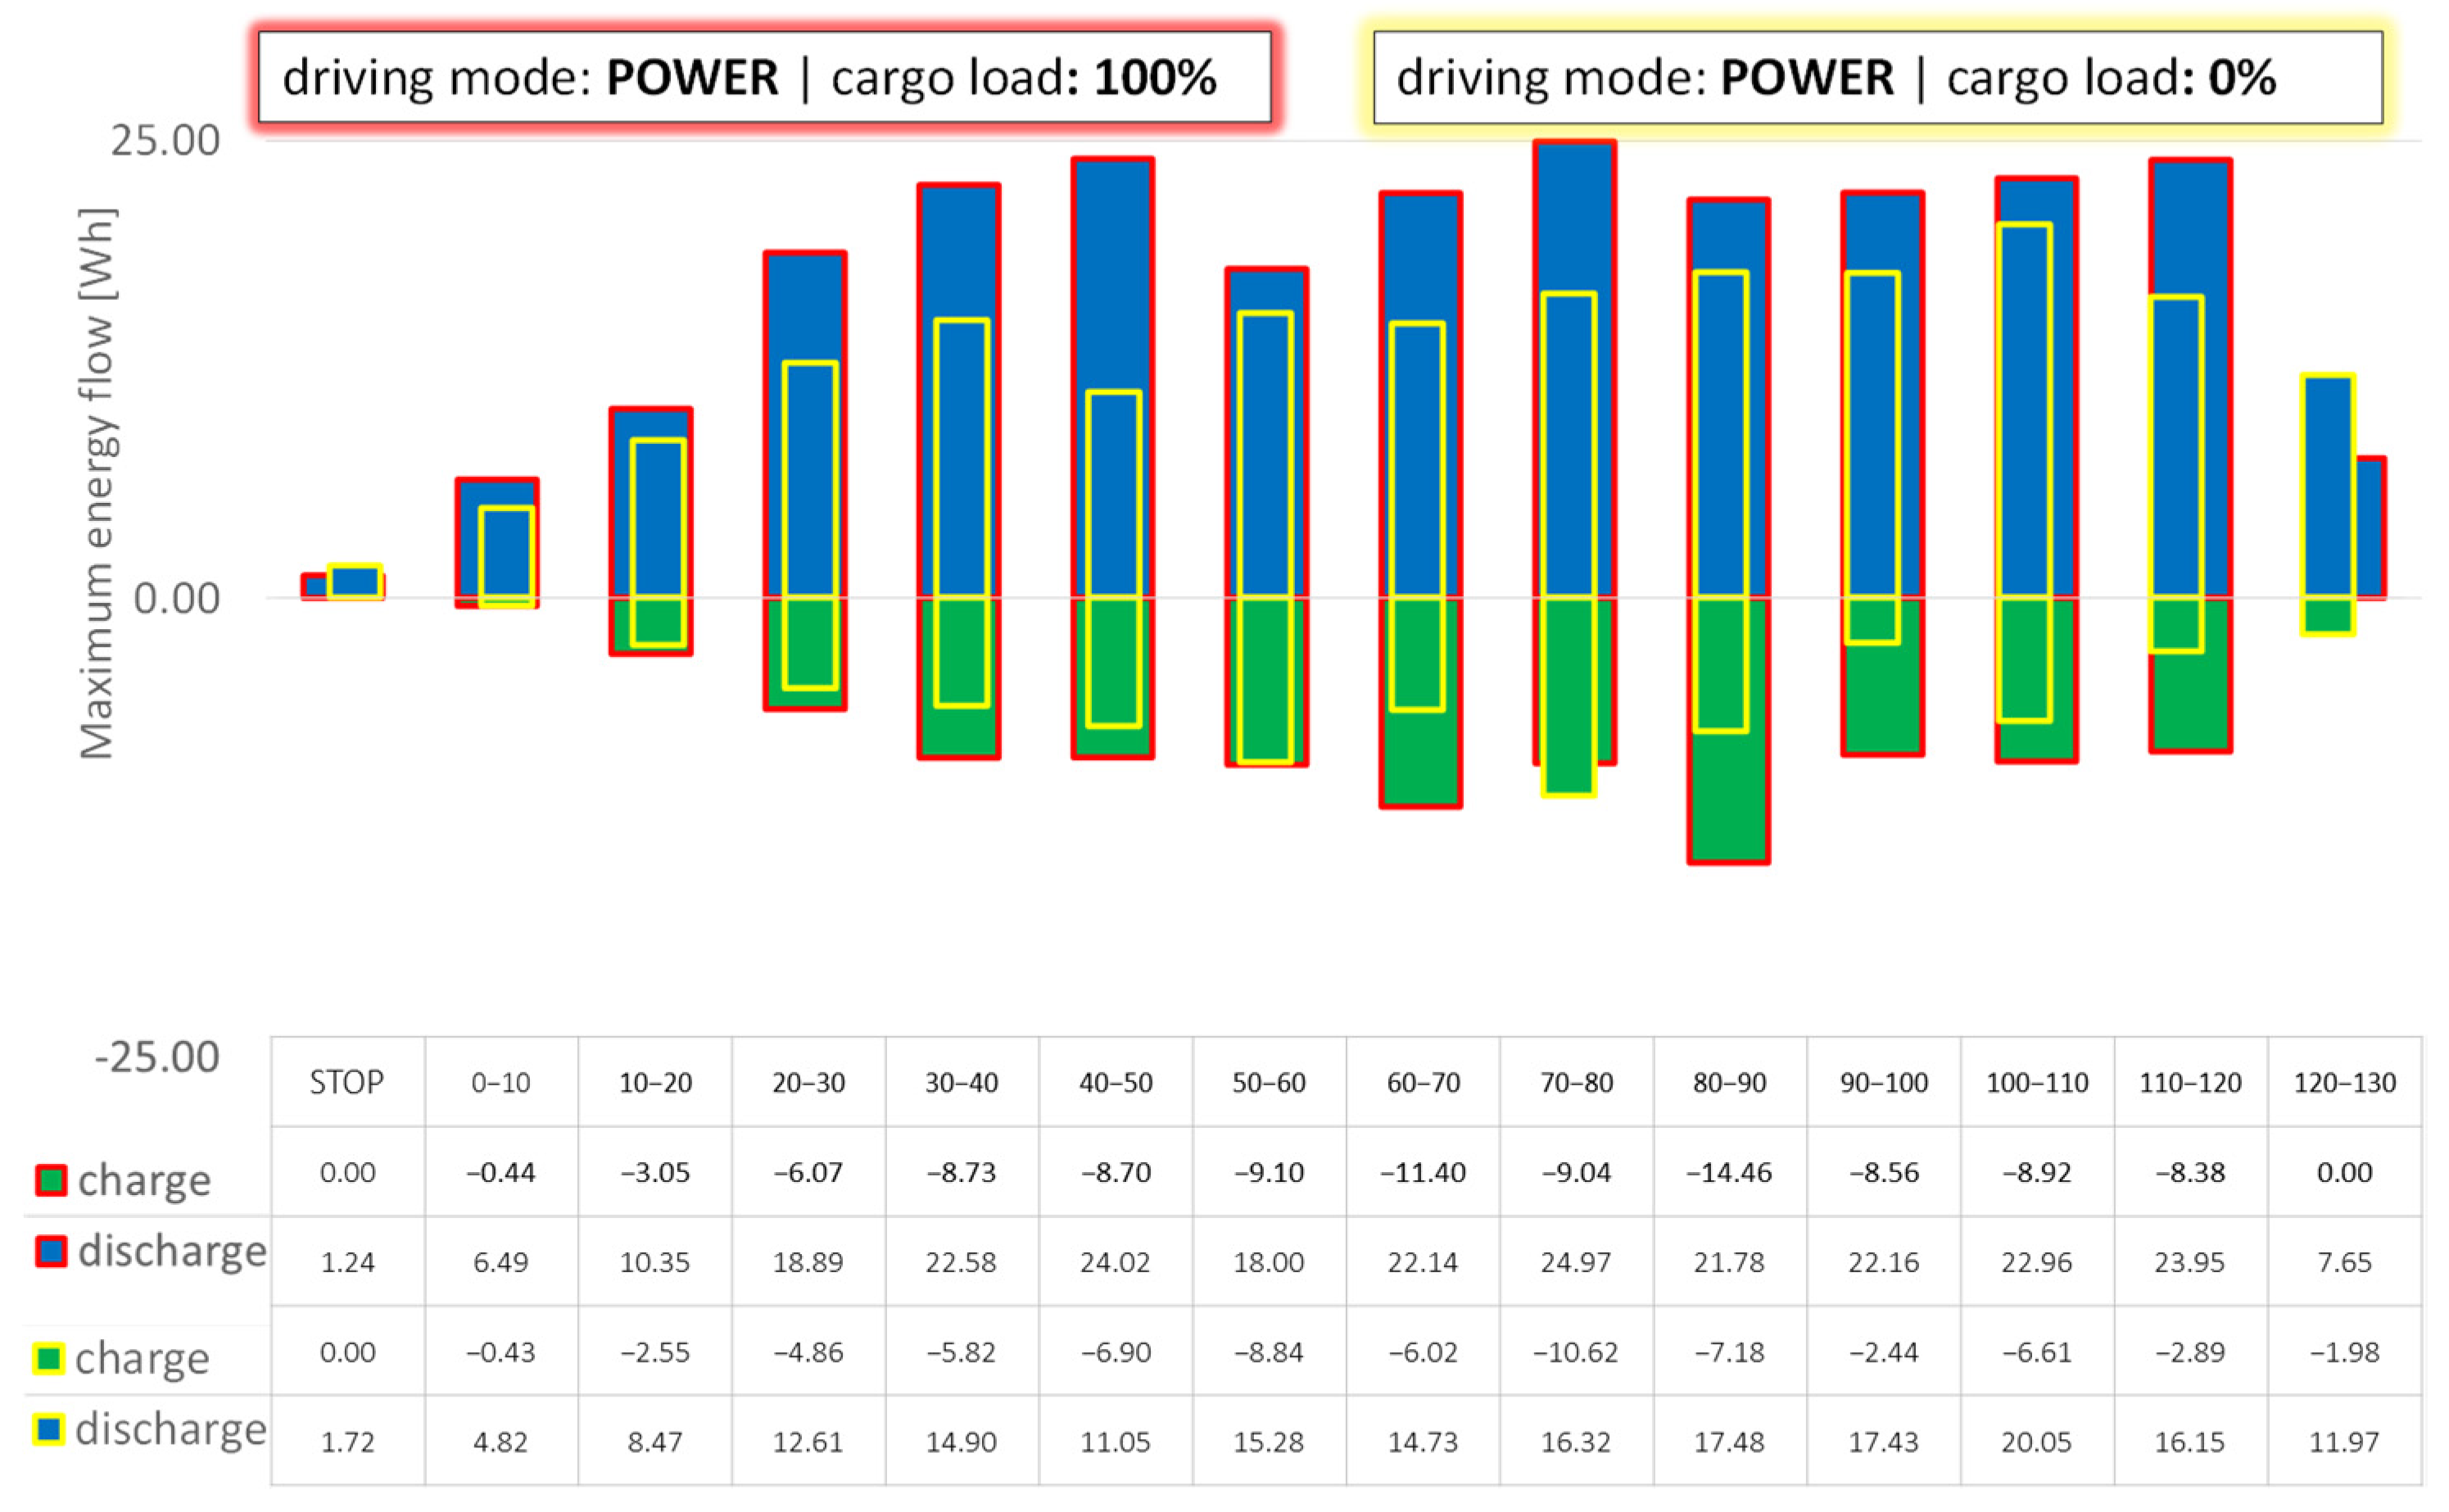
Research was conducted in compliance with RDC (real driving conditions) test requirements, which are shown in Table 2 in detail, and effective traffic regulations.
The marked route, depicted in Figure 11, met the RDC test requirements imposed by the European Union regulations. Thereby it consisted of the urban, rural and motorway sections, closely selected in accordance with the requirements imposed for the particular route sectors (Figure 12).
Tests were performed with the aid of an electric delivery van in Poznan (Poland) and its vicinities. The car was driven by only one driver throughout the tests, thus eliminating the influence of the driving manner on the gathered data. The length of the route averaged 100 km. The highest elevation, amounting to 131 m, was reached on the highway, while the lowest point, equal to 51 m, was encountered in the urban area (Figure 13). Thereby, the general elevation difference totaled 80 m.
Each drive included stopovers determined by the infrastructure of the particular route’s sectors. Naturally, drives along the motorway inheld no stops. However, due to the traffic lights and intersections encountered in the urban and rural sectors, in each drive several dozen stops were registered. As an example, during one of the tests 40 stops were enforced in the urban area (Figure 14) and 6 ones in the rural route, giving eventually the total of 46 stopovers along the route.
Drives were carried out on the working days at the hours of moderate traffic. They were realized in July 2022. Although the measurements were conducted at an interval of more than two weeks, during the period of varying temperatures, the temperature circled around 25 °C when the tests were conducted (Figure 15). During the recordings, the settings of the comfort systems including air conditioning were set at the same level.

5. Research Results

The presented test results are representative of the two examined cases that differ in the cargo load set in the vehicle’s rear compartment. The fundamental research question of this research paper was to define the load impact on the energy consumption in the real driving conditions. For this reason, two extreme cases have been considered. The first one assumed 100% of the maximum load (the addition of the driver weight and the cargo weight equal to 940 kg). As a matter of the second case the cargo area was emptied, thus the only loading constituted the driver’s weight. For both cases, full battery charge at the beginning of the drive was assured.
Both rides met the requirements of the test under real traffic conditions (guidelines shown in Table 2). The basic parameters for the proportion of the road in the urban, rural and motorway route are shown in Figure 16. Some differences can be seen in the two runs, consisting especially in the varying values and characteristics of maintaining a constant speed in freeway driving, but this did not adversely affect the fulfillment of the test requirements. Varying driving conditions, traffic volumes are taken into account in the test procedure allowing the two measurements to be compared.
The general number of stops differs between the drives as well as between the particular sections of the route. Such state is a direct result of a road infrastructure, that is, the number of junctions, and naturally of the current traffic intensity. The number of stops during the drives equals respectively: for the test with a 100% of a maximum cargo load—38 stops, and for the test with a 0% of a maximum cargo load—40 stops.
By analyzing parameters essential to determine the energy flow in a vehicle, the authors compiled tests parameterization in terms of a particular drive phase share (acceleration -a+, constant speed—a0, deceleration—a) and a stopover share. For both drives these values, depicted in Figure 17, are similar and thereby allow us to make a reliable assessment regarding the actual load influence on the powertrain’s energy consumption.
An electric vehicle is characterized by two states of drivetrain operation: the drivetrain consumes or generates energy from/to a high voltage battery. With respect to the route parameters in the real driving condition test, therefore, the time and distance intervals in which the vehicle consumes or generates energy were determined—presented in Figure 18 (periods in which the vehicle does not consume energy from the battery during standstill are not recorded—in most cases, at standstill, the battery is also discharged for vehicle comfort purposes—air conditioning).
For the both measurement runs, the highest energy recovery values are determined for urban driving conditions, but it should be pointed out that the procedure counts energy recovery/consumption with respect to vehicle speed, so any braking from highway or suburban route speeds automatically enters into the sum of energy recovery for suburban and urban routes, respectively. Nevertheless, it should be noted that in each case the loaded vehicle recorded higher shares of both time and distance of energy recovery, which is confirmed by the energy flow results shown in Figure 19. Greater time or distance of energy recovery resulting also in higher values of recovered energy to the battery did not result in lower energy consumption, as higher vehicle load results in higher energy consumption in the acceleration phase. The higher the speed of the vehicle, the smaller this difference is between runs. In city driving conditions, energy consumption is almost 20% higher for a loaded vehicle than for an empty one. When driving on the highway, this difference decreases to about 8%. However, taking into account the higher energy recovery for a vehicle loaded with a mass of cargo, these differences decrease in the total energy flow.
A loaded vehicle is characterized not only by the total amount of energy consumed at a higher level than a vehicle moving unloaded. Also, the individual operating points (energy intensity of the drivetrain) reach higher values, which is noted in area 1 in Figure 20. It can also be seen that the temporary energy recovered to the battery during braking is higher (area 2 in Figure 20) compared to the unloaded vehicle. Despite the unloaded vehicle reaching higher speeds on the highway, the energy flow is at a lower level (area 3 in Figure 20).
Based on the above short-term energy consumption maps, the maximum ongoing energy consumption was determined, which indirectly determines the use of the propulsion system. Due to the limitations of the OBD system’s measurement monitor, the drive engine’s operating parameters were not determined in the current work (this will be done in future work). Instead, the maximum values presented indicate that the energy consumption from the battery in practically every speed range is higher for a loaded vehicle (Figure 21).
The greatest energy recovery is realized in urban speed intervals, but this is due to the frequency of braking in urban driving conditions. Instantaneous maximum energy recovery values are highest in the 60–90 km/h speed range. Energy recovery for speeds below 10 km/h is marginal, so below this speed it is necessary to use the vehicle’s conventional braking system.

6. Summary

The presented research made it possible to determine the usability of an electric delivery vehicle in real traffic conditions with extreme load options. The conclusions of the presented work are presented below:
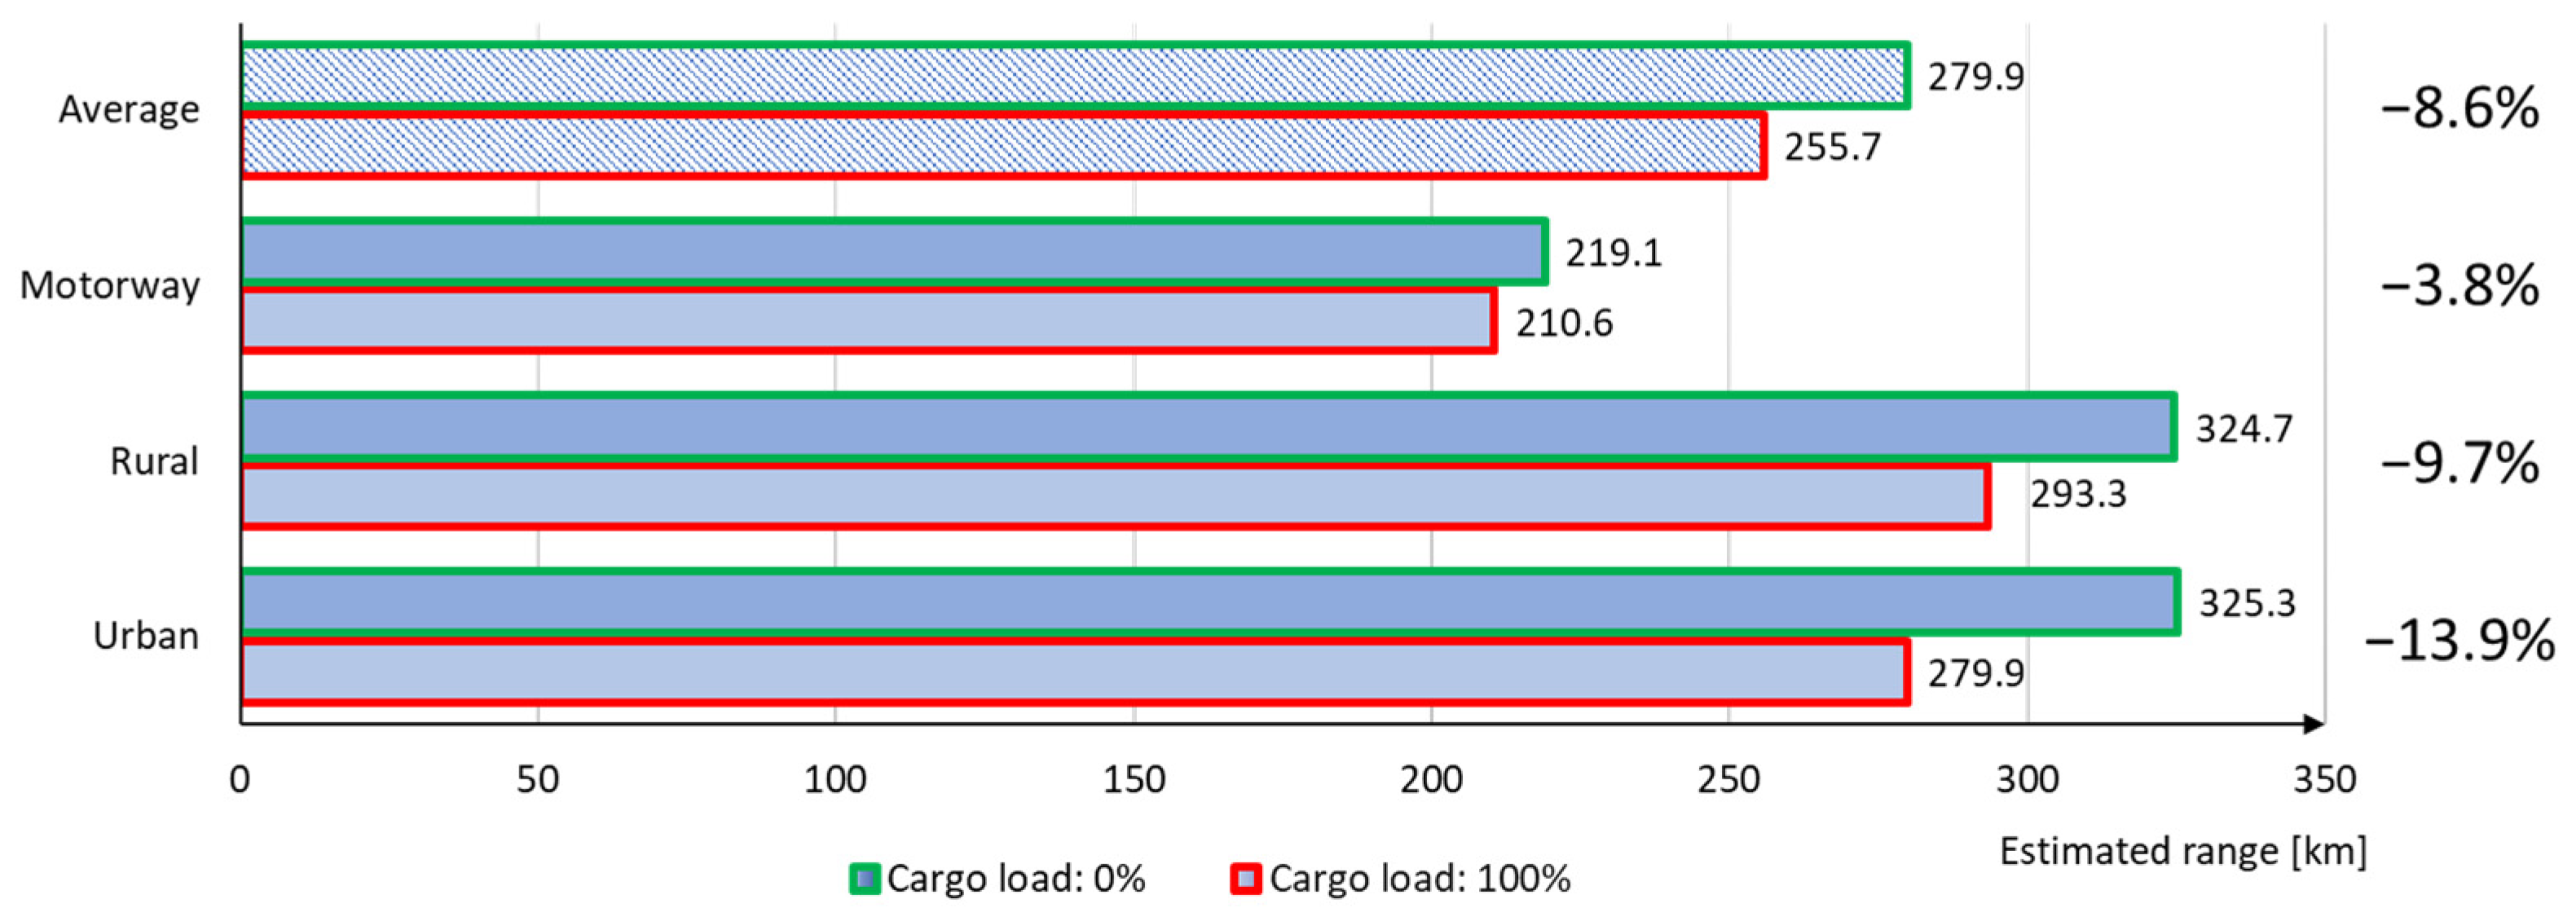
  • The maximum range of the LDV in actual traffic conditions differs from the declared by the manufacturer (330 km WLTP), both in unloaded and fully loaded trips (by 15% and 22%, respectively).
  • The vehicle’s weight increased by 850 kg of loading affects the range reduction as summarized in Figure 22. The largest decrease (by almost 14%) in range was recorded for the urban route, due to increased energy consumption during acceleration.
  • The impact of route type (average speed and proportion of recuperation) significantly affects the vehicle range—differences between highway and urban routes reach 25–30%.
Based on the research presented, guidelines and conclusions were determined for transportation companies interested in modernizing their vehicle fleets:
  • In an urban application, an electric delivery vehicle will meet most of the transportation requirements among surveyed entrepreneurs.
  • The delivery vehicle should be adapted to the daily operation of the company. This may allow to reduce the battery capacity (reduce the purchase price) or increase the battery charging intervals. This applies to companies that declare a daily distance in the range of up to 100 km.
  • Variable loading has an impact on the maximum range of the vehicle during the day, and proper planning of unloading from the heaviest goods can greatly increase the range of the vehicle.
  • The delivery electric vehicle should be used especially in urban transportation, as the energy recuperation significantly reduces the energy consumption of the vehicle.

Author Contributions

Conceptualization, W.C. and W.A.; methodology, W.C.; formal analysis, W.C. and W.A.; investigation, W.C. and W.A.; writing—original draft preparation, W.C. and W.A.; visualization, W.C. and W.A.; writing—review and editing, W.C. and W.A.; supervision, W.C. All authors have read and agreed to the published version of the manuscript.

Funding

This research was funded by Poznan University of Technology, grant 0415/SBAD/0337.

Data Availability Statement

The data presented in this study are available on request from the corresponding author.

Acknowledgments

The authors of this article would like to thank Toyota Professional Bońkowscy for the provision of a vehicle for research.

Conflicts of Interest

The authors declare no conflict of interest.

Abbreviations

BEVbattery electric vehicle
CANcontroller area network
EVelectric vehicle
FCEVfuel cell electric vehicle
HEVhybrid electric vehicles
ICEinternal combustion engine
LCAlife-cycle assessment
NEDCNew European Driving Cycle
PHEVplug-in hybrid electric vehicles
RDCreal driving conditions
SOCstate of charge
TTWtank to wheel
WLTPWorldwide Harmonised Light Vehicles Test Procedure

References

  1. Clean and Sustainable Mobility. Available online: https://www.consilium.europa.eu/en/policies (accessed on 27 November 2022).
  2. Carbon Dioxide Emissions from Europe’s Heavy-Duty Vehicles. Available online: https://www.eea.europa.eu/publications (accessed on 27 November 2022).
  3. Weiss, M.; Cloos, K.C.; Helmers, E. Energy efficiency trade-offs in small to large electric vehicles. Environ. Sci. Eur. 2020, 32, 46. [Google Scholar] [CrossRef] [Green Version]
  4. Zhao, C.; Gong, G.; Yu, C.; Liu, Y. Research on Key Factors for Range and Energy Consumption of Electric Vehicles. SAE Technical Paper 2019-01-0723. 2019. [Google Scholar] [CrossRef]
  5. Bull, M. Mass Reduction Performance of PEV and PHEV Vehicles. 22nd Enhanced Safety of Vehicle Conference, Washington, 2011. Available online: https://www-esv.nhtsa.dot.gov/Proceedings/22/ (accessed on 10 November 2022).
  6. Ziemba, P.; Gago, I. Compromise Multi-Criteria Selection of E-Scooters for the Vehicle Sharing System in Poland. Energies 2022, 15, 5048. [Google Scholar] [CrossRef]
  7. Turoń, K.; Kubik, A.; Chen, F. What Car for Car-Sharing? Conventional, Electric, Hybrid or Hydrogen Fleet? Analysis of the Vehicle Selection Criteria for Car-Sharing Systems. Energies 2022, 15, 4344. [Google Scholar] [CrossRef]
  8. Turoń, K.; Kubik, A.; Ševčovič, M.; Tóth, J.; Lakatos, A. Visual Communication in Shared Mobility Systems as an Opportunity for Recognition and Competitiveness in Smart Cities. Smart Cities 2022, 5, 802–818. [Google Scholar] [CrossRef]
  9. Aiello, G.; Quaranta, S.; Certa, A.; Inguanta, R. Optimization of Urban Delivery Systems Based on Electric Assisted Cargo Bikes with Modular Battery Size, Taking into Account the Service Requirements and the Specific Operational Context. Energies 2021, 14, 4672. [Google Scholar] [CrossRef]
  10. More Customers Are Shopping Online Now Than at Height Of Pandemic, Fueling Need For Digital Transformation. Available online: https://www.forbes.com/sites/blakemorgan/2020/07/27/more-customers-are-shopping-online-now-than-at-height-of-pandemic-fueling-need-for-digital-transformation/?sh=768cdf076bb9 (accessed on 24 November 2022).
  11. Sánchez, D.G.; Tabares, A.; Faria, L.T.; Rivera, J.C.; Franco, J.F. A Clustering Approach for the Optimal Siting of Recharging Stations in the Electric Vehicle Routing Problem with Time Windows. Energies 2022, 15, 2372. [Google Scholar] [CrossRef]
  12. Erdelić, T.; Carić, T. Goods Delivery with Electric Vehicles: Electric Vehicle Routing Optimization with Time Windows and Partial or Full Recharge. Energies 2022, 15, 285. [Google Scholar] [CrossRef]
  13. Iwan, S.; Nürnberg, M.; Bejger, A.; Kijewska, K.; Małecki, K. Unloading Bays as Charging Stations for EFV-Based Urban Freight Delivery System—Example of Szczecin. Energies 2021, 14, 5677. [Google Scholar] [CrossRef]
  14. Martins, L.d.C.; Tordecilla, R.D.; Castaneda, J.; Juan, A.A.; Faulin, J. Electric Vehicle Routing, Arc Routing, and Team Orienteering Problems in Sustainable Transportation. Energies 2021, 14, 5131. [Google Scholar] [CrossRef]
  15. Wang, L.; Wu, Z.; Cao, C. Integrated Optimization of Routing and Energy Management for Electric Vehicles in Delivery Scheduling. Energies 2021, 14, 1762. [Google Scholar] [CrossRef]
  16. Baek, D.; Chen, Y.; Chang, N.; Macii, E.; Poncino, M. Battery-Aware Electric Truck Delivery Route Exploration. Energies 2020, 13, 2096. [Google Scholar] [CrossRef]
  17. Zardini, A.; Bonnel, P. Real Driving Emissions Regulation: European Methodology to Fine Tune the EU Real Driving Emissions Data Evaluation Method, EUR 30123 EN; Publications Office of the European Union: Luxembourg, 2020; ISBN 978-92-76-17157-7. [Google Scholar] [CrossRef]
  18. Szałek, A.; Pielecha, I.; Cieslik, W. Fuel Cell Electric Vehicle (FCEV) Energy Flow Analysis in Real Driving Conditions (RDC). Energies 2021, 14, 5018. [Google Scholar] [CrossRef]
  19. Al-Wreikat, Y.; Sodre, J. Evaluating the Energy Consumption of an Electric Vehicle Under Real-World Driving Conditions. SAE Technical Paper 2022-01-1127. 2022. [Google Scholar] [CrossRef]
  20. Cieślik, W.; Szwajca, F.; Golimowski, J. The possibility of energy consumption reduction using the ECO driving mode based on the RDC test. Combust. Engines 2020, 182, 59–69. [Google Scholar] [CrossRef]
  21. Pielecha, I.; Cieslik, W.; Szalek, A. Impact of Combustion Engine Operating Conditions on Energy Flow in Hybrid Drives in RDC Tests. SAE Technical Paper 2020-01-2251. 2020. [Google Scholar] [CrossRef]
  22. Andrych-Zalewska, M.; Chlopek, Z.; Merkisz, J.; Pielecha, J. Comparison of Gasoline Engine Exhaust Emissions of a Passenger Car through the WLTC and RDE Type Approval Tests. Energies 2022, 15, 8157. [Google Scholar] [CrossRef]
  23. Pielecha, J.; Skobiej, K.; Gis, M.; Gis, W. Particle Number Emission from Vehicles of Various Drives in the RDE Tests. Energies 2022, 15, 6471. [Google Scholar] [CrossRef]
  24. Pielecha, I.; Szałek, A.; Tchorek, G. Two Generations of Hydrogen Powertrain—An Analysis of the Operational Indicators in Real Driving Conditions (RDC). Energies 2022, 15, 4734. [Google Scholar] [CrossRef]
  25. Selleri, T.; Melas, A.D.; Franzetti, J.; Ferrarese, C.; Giechaskiel, B.; Suarez-Bertoa, R. On-Road and Laboratory Emissions from Three Gasoline Plug-In Hybrid Vehicles—Part 1: Regulated and Unregulated Gaseous Pollutants and Greenhouse Gases. Energies 2022, 15, 2401. [Google Scholar] [CrossRef]
  26. Melas, A.; Selleri, T.; Franzetti, J.; Ferrarese, C.; Suarez-Bertoa, R.; Giechaskiel, B. On-Road and Laboratory Emissions from Three Gasoline Plug-In Hybrid Vehicles—Part 2: Solid Particle Number Emissions. Energies 2022, 15, 5266. [Google Scholar] [CrossRef]
  27. Pielecha, J.; Skobiej, K.; Kubiak, P.; Wozniak, M.; Siczek, K. Exhaust Emissions from Plug-in and HEV Vehicles in Type-Approval Tests and Real Driving Cycles. Energies 2022, 15, 2423. [Google Scholar] [CrossRef]
  28. Electromobility Meter: On Polish Roads in 2021. Available online: https://www.pzpm.org.pl/pl/Rynek-motoryzacyjny/Licznik-elektromobilnosci/Rok-2021/Grudzien-2021 (accessed on 24 November 2022).
  29. Electric Vans—Will They Manage to Meet the Demands of the Modern World—Toyota Proace EV. Available online: https://youtu.be/Y6kQzUP2CBw (accessed on 10 November 2022).
  30. Toyota Proace Electric. Available online: https://www.toyota.co.uk/new-cars/proace-ev (accessed on 24 November 2022).
  31. Electric Vehicle Database. Available online: https://ev-database.org/ (accessed on 10 November 2022).
  32. Proace EV Service Manuals. Available online: https://www.techdoc-toyota.com (accessed on 10 November 2022).
  33. Gis, W.; Pielecha, J.; Merkisz, J.; Kruczyński, S.; Gis, M. Determining the route for the purpose light vehicles testing in Real Driving Emissions (RDE) test. Combust. Engines 2019, 178, 61–66. [Google Scholar] [CrossRef]
  34. Weather Archive. Available online: https://www.weatheronline.pl/weather/maps/city (accessed on 10 November 2022).
Figure 1. Current status of the surveyed fleets in terms of their propulsion system (based on the survey).
Energies 16 00775 g001
Figure 2. Number of vehicles managed by each fleet and their average daily distance, indicating the potential of different versions of a battery capacity to meet vehicle range requirements as well as the range of electrification potential in particular companies (based on the survey). 1 Electric range ensured by the manufacturer for Toyota Proace Electric with 16” steel wheels. It is highlighted that these figures may not reflect real driving conditions (RDCs). Electric range depends on accessories package, driving style, conditions, speed, load, etc. [30].
Energies 16 00775 g002
Figure 3. Type of light-duty vehicle used in the company (based on own survey).
Energies 16 00775 g003
Figure 4. List of battery capacities of an electric LDV available on the Polish market, combined with their catalogue range based on the WLTP test [31] (marked with a red, color two versions of the test vehicle varying in battery capacity).
Energies 16 00775 g004
Figure 5. The average load at the beginning of a workday (based on own survey).
Energies 16 00775 g005
Figure 6. Factors deciding willingness to modify a fleet vehicle to electric-powered models (based on own survey).
Energies 16 00775 g006
Figure 7. Mass limits of the tested vehicle (values read from the registration certificate of used in research vehicle) based on [32].
Energies 16 00775 g007
Figure 8. Schematic of the measurement system including a view of the location of the traction battery [32].
Energies 16 00775 g008
Figure 9. Weights taken into account during road surveys conducted (based on the data from the vehicle registration certificate—Figure 7).
Energies 16 00775 g009
Figure 10. Drive train operating modes while driving (①—electric drive motor, ②—inverter, ③—traction battery, ④—on-board charger/DC-DC voltage transformer, ⑤—ancillary battery, ⑥—reduction gear) [32].
Energies 16 00775 g010
Figure 11. Route driven during the examinations.
Energies 16 00775 g011
Figure 12. Route divided into particular sections (S\F—Start/Finish).
Energies 16 00775 g012
Figure 13. The elevation pattern throughout the route.
Energies 16 00775 g013
Figure 14. Stops enforced by the infrastructure in the urban section along the marked route.
Energies 16 00775 g014
Figure 15. Ranges on measurement days [based on [34] and authors’ own measurements].
Energies 16 00775 g015
Figure 16. The course of RDC test in different driving mode with defining basic parameters for meeting test requirements.
Energies 16 00775 g016
Figure 17. Comparison of the phase motion share during the RDC test regarding the variable cargo load.
Energies 16 00775 g017
Figure 18. Parameterization of time- and route-dependent energy consumption and recovery for individual phases of the RDC test.
Energies 16 00775 g018
Figure 19. Energy consumption balance in terms of different cargo load.
Energies 16 00775 g019
Figure 20. Energy flow areas segmented by speed ranges for different vehicle payload levels.
Energies 16 00775 g020
Figure 21. Maximum values of energy flow in speed intervals steps of 10 km/h.
Energies 16 00775 g021
Figure 22. Effect of cargo weight on estimated range in different phases of the RDC test.
Energies 16 00775 g022
Table 1. Number of registered electric vehicles in Poland in recent years (based on [28]).
Type of Vehicle201920202021November 2022
Passenger EV509110,04118,79528,386
Passenger PHEV3546883419,20628,540
Large EV5191
224 2
8391
430 2
16571
651 2
26381
790 2
Small EV 36450930811,09116,541
FCEV1079124
1 Delivery vans and trucks; 2 buses; 3 electric bikes, scooters.
Table 2. Real driving conditions shorter test requirements [33].
Selected RDE/RDC Test RequirementsUrbanRuralMotorway
Cycle repetition (+/− 10%) [%]29 < ratio ≤ 3433
Speed [km/h]< 6060 ≤ V ≤90 V > 90
Max. speed [km/h](+/− 15 km/h for less than 3% of driving time)--145
Average speed (stops included) [km/h]15 ≤ V ≤30 --
Minimum travelled distance [km]16
Altitude difference (beginning/end) [m]100
Maximum slope [m/100 km]1200 m/100 km
Disclaimer/Publisher’s Note: The statements, opinions and data contained in all publications are solely those of the individual author(s) and contributor(s) and not of MDPI and/or the editor(s). MDPI and/or the editor(s) disclaim responsibility for any injury to people or property resulting from any ideas, methods, instructions or products referred to in the content.

